Dietary Patterns and Metabolic Syndrome in Adult Subjects: A Systematic Review and Meta-Analysis


Abstract
1. Introduction
2. Materials and Methods
2.1. Search Strategy and Data Source
2.2. Eligibility Criteria
2.3. Data Extraction and Quality Assessment
2.4. Statistical Analysis
3. Results
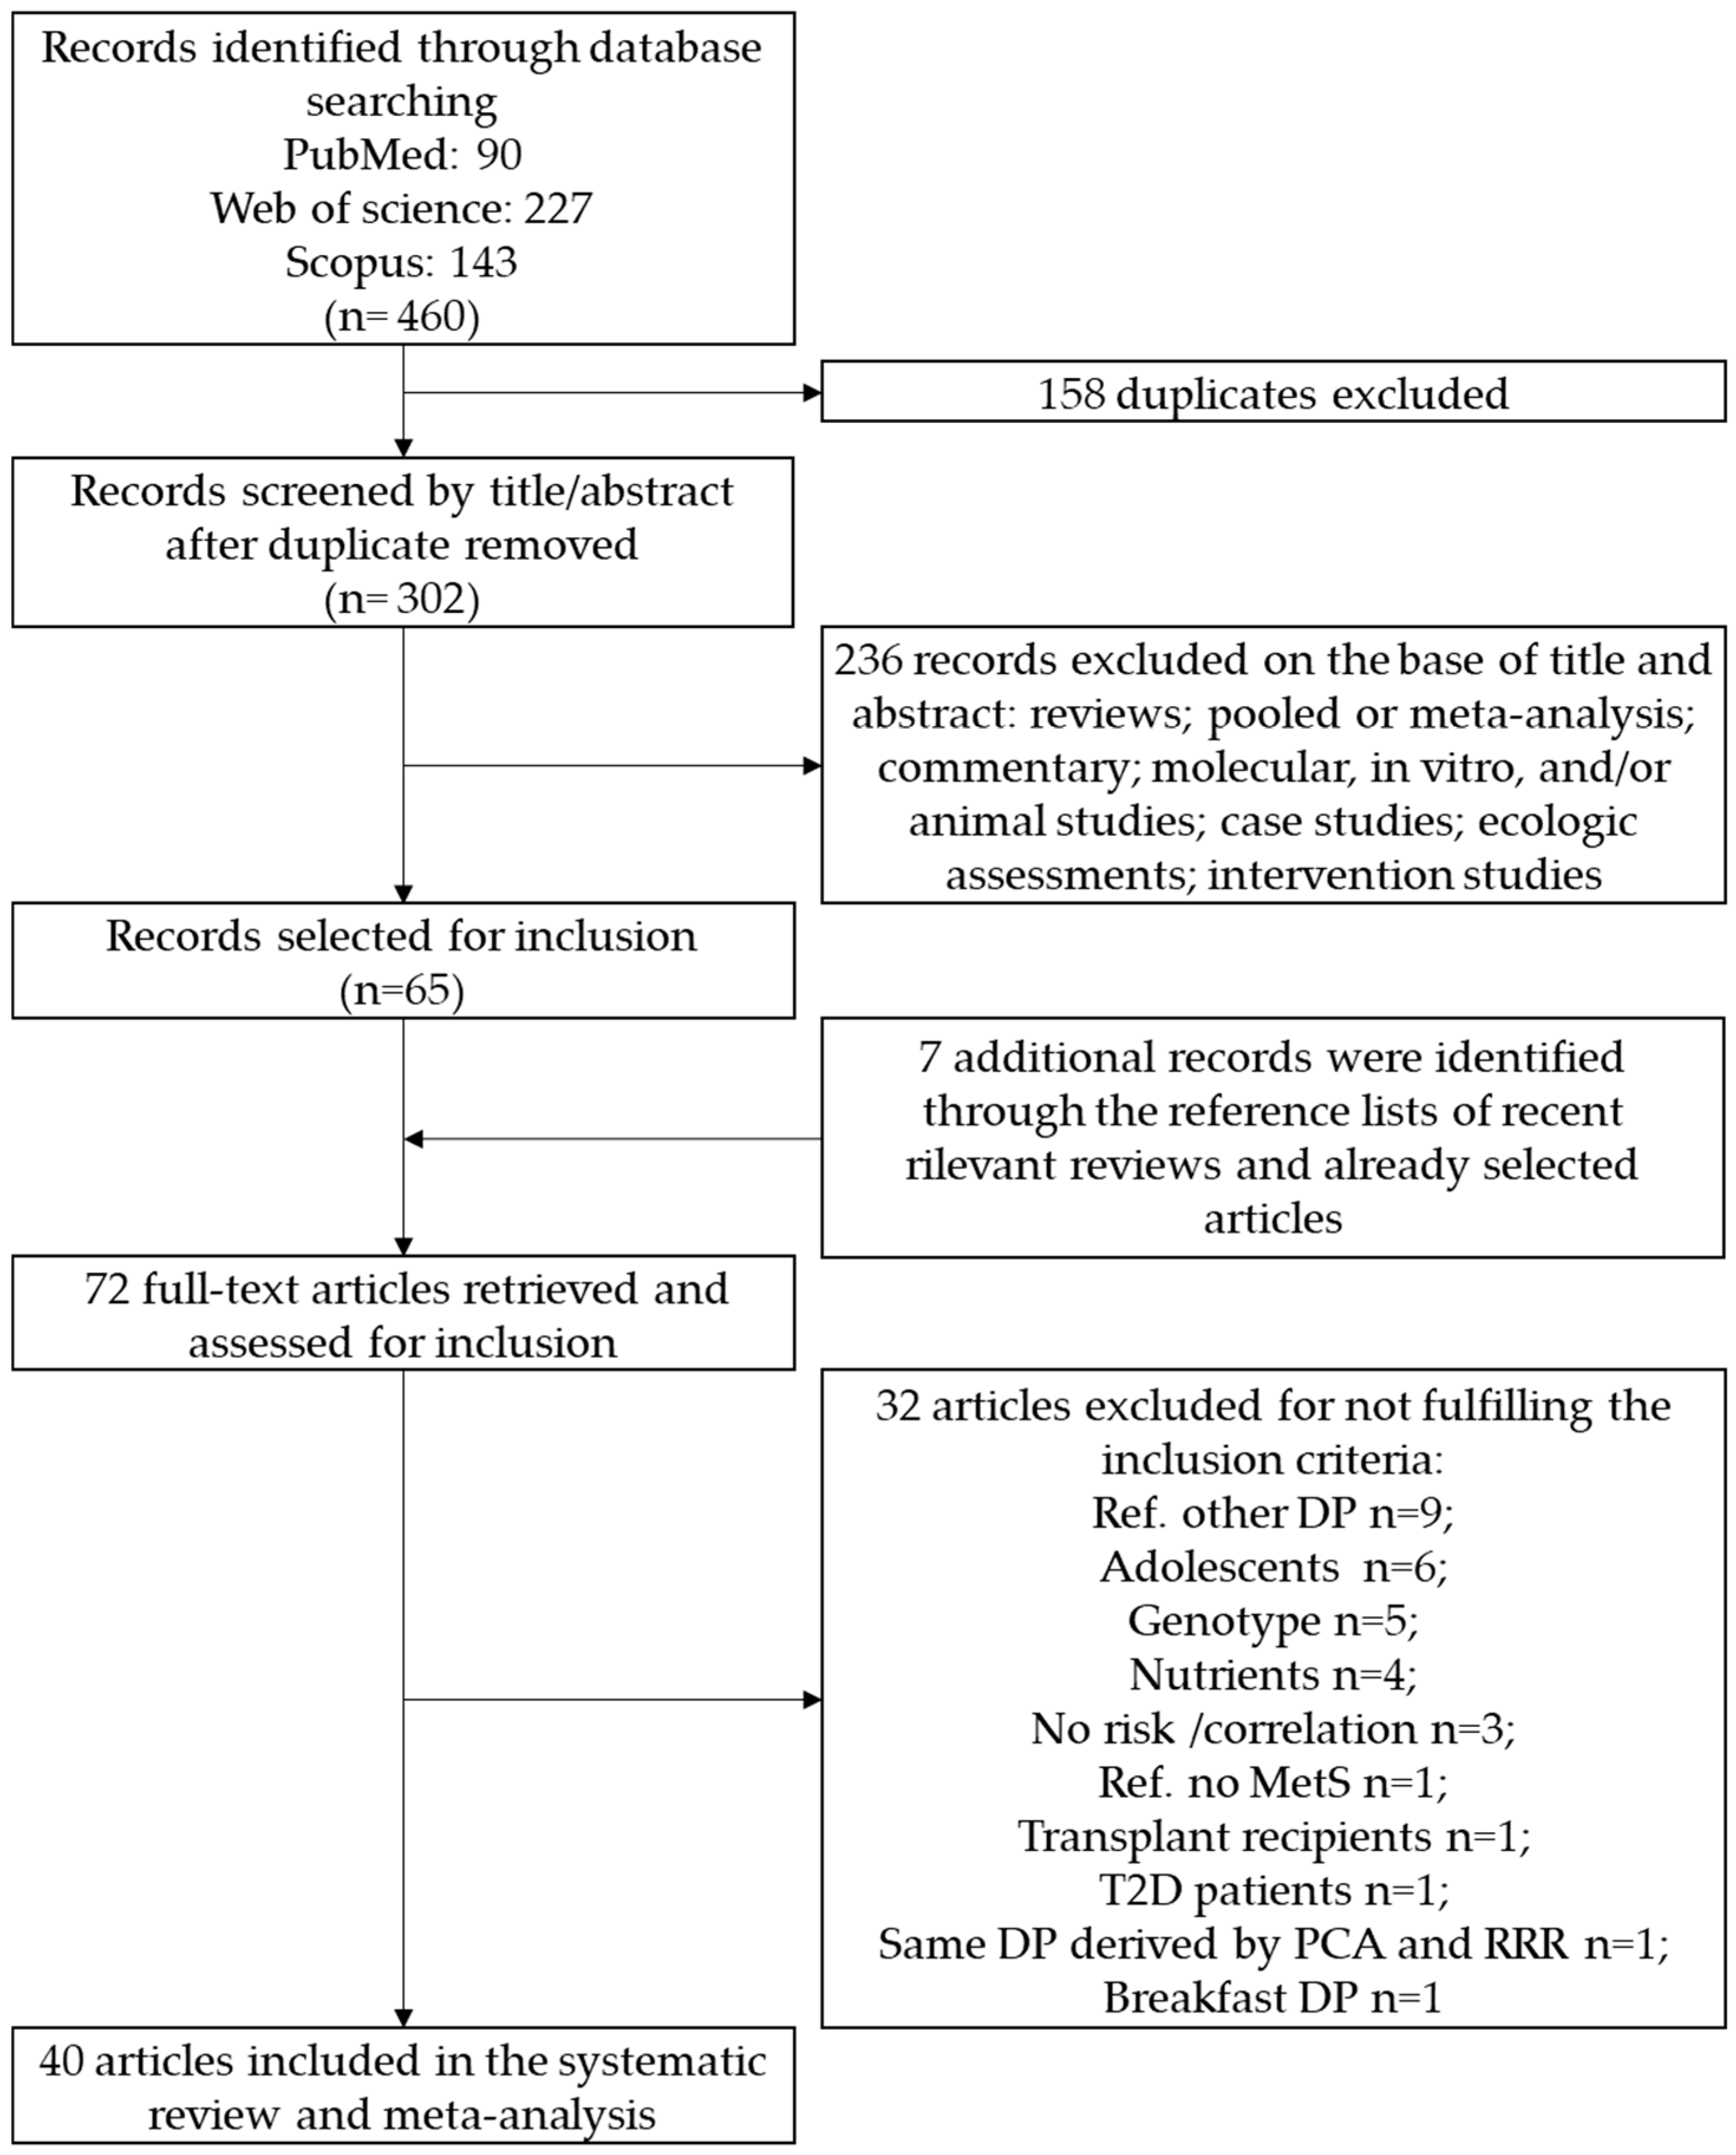
3.1. Study Selection
3.2. Study Characteristics and Quality Assessment
3.3. Meta-Analysis
4. Discussion
Limitations
5. Conclusions
Author Contributions
Funding
Conflicts of Interest
References
- Saklayen, M.G. The Global Epidemic of the Metabolic Syndrome. Curr. Hypertens. Rep. 2018, 20, 12. [Google Scholar] [CrossRef] [PubMed]
- Scuteri, A.; Najjar, S.S.; Morrell, C.H.; Lakatta, E.G. The metabolic syndrome in older individuals: Prevalence and prediction of cardiovascular events: The cardiovascular health study. Diabetes Care 2005, 28, 882–887. [Google Scholar] [CrossRef] [PubMed]
- Liberopoulos, E.N.; Mikhailidis, D.P.; Elisaf, M.S. Diagnosis and management of the metabolic syndrome in obesity. Obes. Rev. 2005, 6, 283–296. [Google Scholar] [CrossRef] [PubMed]
- Alberti, K.G.M.M.; Eckel, R.H.; Grundy, S.M.; Zimmet, Z.P.; Cleeman, J.I.; Donato, K.A.; Fruchart, J.-C.; James, W.P.; Loria, C.M.; Smith, S.C., Jr. Harmonizing the metabolic syndrome: A joint interim statement of the international diabetes federation task force on epidemiology and prevention; National heart, lung, and blood institute; American heart association; World heart federation; International. Circulation 2009, 120, 1640–1645. [Google Scholar] [CrossRef] [PubMed]
- National Cholesterol Education Program (NCEP). Third Report of the National Cholesterol Education Program (NCEP) Expert Panel on Detection, Evaluation, and Treatment of High Blood Cholesterol in Adults (Adult Treatment Panel III) Final Report. Circulation 2002, 106, 3143. [Google Scholar] [CrossRef]
- Julibert, A.; Bibiloni, M.D.M.; Mateos, D.; Angullo, E.; Tur, J.A. Dietary Fat Intake and Metabolic Syndrome in Older Adults. Nutrients 2019, 11, 1901. [Google Scholar] [CrossRef] [PubMed]
- Pérez-Martínez, P.; Mikhailidis, D.P.; Athyros, V.G.; Bullo, M.; Couture, P.; Covas, M.I.; de Koning, L.; Delgado-Lista, J.; Díaz-López, A.; Drevon, C.A.; et al. Lifestyle recommendations for the prevention and management of metabolic syndrome: An international panel recommendation. Nutr. Rev. 2017, 75, 307–326. [Google Scholar] [CrossRef] [PubMed]
- Iwasaki, Y.; Arisawa, K.; Katsuura-Kamano, S.; Uemura, H.; Tsukamoto, M.; Kadomatsu, Y.; Okada, R.; Hishida, A.; Tanaka, K.; Hara, M.; et al. Associations of nutrient patterns with the prevalence of metabolic syndrome: Results from the baseline data of the Japan multi-institutional collaborative cohort study. Nutrients 2019, 11, 990. [Google Scholar] [CrossRef] [PubMed]
- Mutt, S.J.; Jokelainen, J.; Sebert, S.; Auvinen, J.; Järvelin, M.; Keinänen-Kiukaanniemi, S.; Herzig, K. Vitamin D Status and Components of Metabolic Syndrome in Older Subjects from Northern Finland (Latitude 65° N). Nutrients 2019, 11, 1229. [Google Scholar] [CrossRef]
- Hu, F.B. Dietary pattern analysis: A new direction in nutritional epidemiology. Curr. Opin. Lipidol. 2002, 13, 3–9. [Google Scholar] [CrossRef]
- Michels, K.B.; Schulze, M.B. Can dietary patterns help us detect diet-disease associations? Nutr. Res. Rev. 2005, 18, 241–248. [Google Scholar] [CrossRef] [PubMed]
- Jacques, P.F.; Tucker, K.L. Are dietary patterns useful for understanding the role of diet in chronic disease? Am. J. Clin. Nutr. 2001, 73, 1–2. [Google Scholar] [CrossRef]
- Godos, J.; Zappalà, G.; Bernardini, S.; Giambini, I.; Bes-Rastrollo, M.; Martinez-Gonzalez, M. Adherence to the Mediterranean diet is inversely associated with metabolic syndrome occurrence: A meta-analysis of observational studies. Int. J. Food Sci. Nutr. 2017, 68, 138–148. [Google Scholar] [CrossRef] [PubMed]
- Namazi, N.; Larijani, B.; Azadbakht, L. Dietary Inflammatory Index and its Association with the Risk of Cardiovascular Diseases, Metabolic Syndrome, and Mortality: A Systematic Review and Meta—Analysis. Horm. Metab. Res. 2018, 50, 345–358. [Google Scholar] [CrossRef] [PubMed]
- Shab-Bidar, S.; Golzarand, M.; Hajimohammadi, M.; Mansouri, S. A posteriori dietary patterns and metabolic syndrome in adults: A systematic review and meta-analysis of observational studies. Public Health Nutr. 2018, 21, 1681–1692. [Google Scholar] [CrossRef] [PubMed]
- Rodríguez-Monforte, M.; Sánchez, E.; Barrio, F.; Costa, B.; Flores-Mateo, G. Metabolic syndrome and dietary patterns: A systematic review and meta-analysis of observational studies. Eur. J. Nutr. 2017, 56, 925–947. [Google Scholar] [CrossRef] [PubMed]
- Stroup, D.F.; Berlin, J.A.; Morton, S.C.; Olkin, I.; Williamson, G.D.; Rennie, D.; Moher, D.; Becker, B.J.; Sipe, T.A.; Thacker, S.B.; et al. Meta-analysis of observational studies in epidemiology: A proposal for reporting. Meta-analysis of Observational Studies in Epidemiology (MOOSE) group. JAMA 2000, 283, 2008–2012. [Google Scholar] [CrossRef] [PubMed]
- Liberati, A.; Altman, D.G.; Tetzlaff, J.; Mulrow, C.; Gøtzsche, P.C.; Ioannidis, J.P.A.; Clarke, M.; Devereaux, P.J.; Kleijnen, J.; Moher, D. The PRISMA statement for reporting systematic reviews and meta-analyses of studies that evaluate healthcare interventions: Explanation and elaboration. BMJ 2009, 339. [Google Scholar] [CrossRef] [PubMed]
- Asadi, Z.; Shafiee, M.; Sadabadi, F.; Maryam, S.; Susan, D.; Maryam, T.; Hamideh, G.; Alireza Heidari, B.; Mohsen, M.; Habibollah, E.; et al. Association of dietary patterns and the risk of metabolic syndrome among Iranian population: A cross-sectional study. Diabetes Metab. Syndr. 2019, 13, 858–865. [Google Scholar] [CrossRef]
- Czekajło, A.; Rózańska, D.; Zatońska, K.; Szuba, A.; Regulska-Ilow, B. Association between dietary patterns and metabolic syndrome in the selected population of Polish adults—Results of the PURE Poland Study. Eur. J. Public Health 2019, 29, 335–340. [Google Scholar] [CrossRef]
- Nasreddine, L.; Tamim, H.; Itani, L.; Nasrallah, M.P.; Isma’eel, H.; Nakhoul, N.F.; Abou-Rizk, J.; Naja, F. A minimally processed dietary pattern is associated with lower odds of metabolic syndrome among Lebanese adults. Public Health Nutr. 2018, 21, 160–171. [Google Scholar] [CrossRef] [PubMed]
- Suliga, E.; Kozieł, D.; Cieśla, E.; Rębak, D.; Głuszek, S. Dietary patterns in relation to metabolic syndrome among adults in Poland: A cross-sectional study. Nutrients 2017, 9. [Google Scholar] [CrossRef] [PubMed]
- Wang, D.; Hawley, N.L.; Thompson, A.A.; Lameko, V.; Reupena, M.S.; McGarvey, S.T.; Baylin, A. Dietary Patterns Are Associated with Metabolic Outcomes among Adult Samoans in a Cross—Sectional Study. J. Nutr. 2017, 147, 628–635. [Google Scholar] [CrossRef] [PubMed]
- Kang, Y.; Kim, J. Gender difference on the association between dietary patterns and metabolic syndrome in Korean population. Eur. J. Nutr. 2016, 55, 2321–2330. [Google Scholar] [CrossRef] [PubMed]
- Xia, Y.; Gu, Y.; Yu, F.; Zhang, Q.; Liu, L.; Meng, G.; Wu, H.; Du, H.; Shi, H.; Guo, X.; et al. Association between dietary patterns and metabolic syndrome in Chinese adults: A propensity score-matched case-control study. Sci. Rep. 2016, 6. [Google Scholar] [CrossRef]
- Aekplakorn, W.; Satheannoppakao, W.; Putwatana, P.; Taneepanichskul, S.; Kessomboon, P.; Chongsuvivatwong, V.; Chariyalertsak, S. Dietary Pattern and Metabolic Syndrome in Thai Adults. J. Nutr. Metab. 2015, 2015. [Google Scholar] [CrossRef]
- Bell, L.K.; Edwards, S.; Grieger, J.A. The relationship between dietary patterns and metabolic health in a representative sample of adult Australians. Nutrients 2015, 7, 6491–6505. [Google Scholar] [CrossRef]
- Choi, J.H.; Woo, H.D.; Lee, J.H.; Kim, J. Dietary Patterns and Risk for Metabolic Syndrome in Korean Women. Medicine 2015, 94. [Google Scholar] [CrossRef]
- Gadgil, M.D.; Anderson, C.A.; Kandula, N.R.; Kanaya, A.M. Dietary Patterns Are Associated with Metabolic Risk Factors in South Asians Living in the United States. J. Nutr. 2015, 145, 1211–1217. [Google Scholar] [CrossRef]
- He, D.H.; Zhu, X.H.; Yang, M.; Ma, X.G.; Huang, L.C.; Huang, E.S.; Gu, W.; Zhu, Y.B.; Zhao, D.; Zhu, X.H.; et al. Dietary patterns associated metabolic syndrome in Chinese adults. Biomed. Environ. Sci. 2015, 28, 370–373. [Google Scholar] [CrossRef]
- Agodi, A.; Maugeri, A.; Kunzova, S.; Sochor, O.; Bauerova, H.; Kiacova, N.; Barchitta, M.; Vinciguerra, M. Association of dietary patterns with metabolic syndrome: Results from the kardiovize brno 2030 study. Nutrients 2018, 10. [Google Scholar] [CrossRef] [PubMed]
- Suliga, E.; Kozieł, D.; Cieśla, E.; Głuszek, S. Association between dietary patterns and metabolic syndrome in individuals with normal weight: A cross-sectional study. Nutr. J. 2015, 14. [Google Scholar] [CrossRef] [PubMed]
- Arisawa, K.; Uemura, H.; Yamaguchi, M.; Nakamoto, M.; Hiyoshi, M.; Sawachika, F.; Katsuura-Kamano, S. Associations of dietary patterns with metabolic syndrome and insulin resistance: A cross-sectional study in a Japanese population. J. Med. Investig. 2014, 61, 333–344. [Google Scholar] [CrossRef]
- Woo, H.D.; Shin, A.; Kim, J. Dietary patterns of korean adults and the prevalence of metabolic syndrome: A cross-sectional study. PLoS ONE 2014, 9, e111593. [Google Scholar] [CrossRef] [PubMed]
- Akter, S.; Nanri, A.; Pham, N.M.; Kurotani, K.; Mizoue, T. Dietary patterns and metabolic syndrome in a Japanese working population. Nutr. Metab. 2013, 10. [Google Scholar] [CrossRef] [PubMed]
- Baik, I.; Lee, M.; Jun, N.R.; Lee, J.Y.; Shin, C. A healthy dietary pattern consisting of a variety of food choices is inversely associated with the development of metabolic syndrome. Nutr. Res. Pract. 2013, 7, 233–241. [Google Scholar] [CrossRef] [PubMed]
- Liu, J.; Hickson, D.A.; Musani, S.K.; Talegawkar, S.A.; Carithers, T.C.; Tucker, K.L.; Fox, C.S.; Taylor, H.A. Dietary patterns, abdominal visceral adipose tissue, and cardiometabolic risk factors in African Americans: The Jackson heart study. Obesity 2013, 21, 644–651. [Google Scholar] [CrossRef]
- Naja, F.; Nasreddine, L.; Itani, L.; Adra, N.; Sibai, A.M.; Hwalla, N. Association between dietary patterns and the risk of metabolic syndrome among Lebanese adults. Eur. J. Nutr. 2013, 52, 97–105. [Google Scholar] [CrossRef]
- Oh, H.Y.; Kim, M.K.; Lee, M.; Kim, Y.O. Macronutrient Composition and Sodium Intake of Diet Are Associated with Risk of Metabolic Syndrome and Hypertension in Korean Women. PLoS ONE 2013, 8, e78088. [Google Scholar] [CrossRef]
- Hong, S.; Song, Y.; Lee, K.H.; Lee, H.S.; Lee, M.; Jee, S.H.; Joung, H. A fruit and dairy dietary pattern is associated with a reduced risk of metabolic syndrome. Metabolism 2012, 61, 883–890. [Google Scholar] [CrossRef]
- Wagner, A.; Dallongeville, J.; Haas, B.; Ruidavets, J.B.; Amouyel, P.; Ferrières, J.; Simon, C.; Arveilera, D. Sedentary behaviour, physical activity and dietary patterns are independently associated with the metabolic syndrome. Diabetes Metab. 2012, 38, 428–435. [Google Scholar] [CrossRef] [PubMed]
- Cattafesta, M.; Salaroli, L.B. Diets high in vegetables, fruits, cereals, and tubers as a protective factor for metabolic syndrome in bank employees. Diabetes Metab. Syndr. Obes. 2018, 11, 781–790. [Google Scholar] [CrossRef] [PubMed]
- Cho, Y.A.; Kim, J.; Cho, E.R.; Shin, A. Dietary patterns and the prevalence of metabolic syndrome in Korean women. Nutr. Metab. Cardiovasc. Dis. 2011, 21, 893–900. [Google Scholar] [CrossRef] [PubMed]
- Heidemann, C.; Scheidt-Nave, C.; Richter, A.; Mensink, G.B.M. Dietary patterns are associated with cardiometabolic risk factors in a representative study population of German adults. Br. J. Nutr. 2011, 106, 1253–1262. [Google Scholar] [CrossRef] [PubMed]
- Kim, J.; Jo, I. Grains, Vegetables, and Fish Dietary Pattern Is Inversely Associated with the Risk of Metabolic Syndrome in South Korean Adults. J. Am. Diet. Assoc. 2011, 111. [Google Scholar] [CrossRef] [PubMed]
- Amini, M.; Esmaillzadeh, A.; Shafaeizadeh, S.; Behrooz, J.; Zare, M. Relationship between major dietary patterns and metabolic syndrome among individuals with impaired glucose tolerance. Nutrition 2010, 26, 986–992. [Google Scholar] [CrossRef] [PubMed]
- Denova-Gutiérrez, E.; Castañón, S.; Talavera, J.O.; Gallegos-Carrillo, K.; Flores, M.; Dosamantes-Carrasco, D.; Willett, W.C.; Salmerón, J. Dietary Patterns Are Associated with Metabolic Syndrome in an Urban Mexican Population. J. Nutr. 2010, 140, 1855–1863. [Google Scholar] [CrossRef] [PubMed]
- DiBello, J.R.; McGarvey, S.T.; Kraft, P.; Goldberg, R.; Campos, H.; Quested, C.; Laumoli, T.S.; Baylin, A. Dietary Patterns Are Associated with Metabolic Syndrome in Adult Samoans. J. Nutr. 2009, 139, 1933–1943. [Google Scholar] [CrossRef]
- Noel, S.E.; Newby, P.K.; Ordovas, J.M.; Tucker, K.L. A Traditional Rice and Beans Pattern Is Associated with Metabolic Syndrome in Puerto Rican Older Adults. J. Nutr. 2009, 139, 1360–1367. [Google Scholar] [CrossRef]
- Lutsey, P.L.; Steffen, L.M.; Stevens, J. Dietary intake and the development of the metabolic syndrome: The atherosclerosis risk in communities study. Circulation 2008, 117, 754–761. [Google Scholar] [CrossRef]
- Esmaillzadeh, A.; Kimiagar, M.; Mehrabi, Y.; Azadbakht, L.; Hu, F.B.; Willett, W.C. Dietary patterns, insulin resistance, and prevalence of the metabolic syndrome in women. Am. J. Clin. Nutr. 2007, 85, 910–918. [Google Scholar] [CrossRef] [PubMed]
- Panagiotakos, D.B.; Pitsavos, C.; Skoumas, Y.; Stefanadis, C. The Association between Food Patterns and the Metabolic Syndrome Using Principal Components Analysis: The ATTICA Study. J. Am. Diet. Assoc. 2007, 107, 979–987. [Google Scholar] [CrossRef] [PubMed]
- Drake, I.; Sonestedt, E.; Ericson, U.; Wallström, P.; Orho-Melander, M. A Western dietary pattern is prospectively associated with cardio-metabolic traits and incidence of the metabolic syndrome. Br. J. Nutr. 2018, 119, 1168–1176. [Google Scholar] [CrossRef] [PubMed]
- Hassannejad, R.; Kazemi, I.; Sadeghi, M.; Mohammadifard, N.; Roohafza, H.; Sarrafzadegan, N.; Talaeig, M.; Mansourian, M. Longitudinal association of metabolic syndrome and dietary patterns: A 13-year prospective population-based cohort study. Nutr. Metab. Cardiovasc. Dis. 2018, 28, 352–360. [Google Scholar] [CrossRef] [PubMed]
- Shokrzadeh, F.; Aslani, Z.; Rahimi-Foroushani, A.; Shab-Bidar, S. Interaction between a variant of vitamin D receptor gene and a posteriori dietary patterns on metabolic syndrome and its components: A nutrigenetic observational study. Nutr. Food Sci. 2018, 48, 780–794. [Google Scholar] [CrossRef]
- Wei, Z.Y.; Liu, J.J.; Zhan, X.M.; Feng, H.M.; Zhang, Y.Y. Dietary patterns and the risk of metabolic syndrome in Chinese adults: A population-based cross-sectional study. Public Health Nutr. 2018, 21, 2409–2416. [Google Scholar] [CrossRef]
- Drehmer, M.; Odegaard, A.O.; Schmidt, M.I.; Duncan, B.B.; Cardoso, L.d.; Matos, S.M.A.; Molina, M.d.B.; Barreto, S.M.; Pereira, M.A. Brazilian dietary patterns and the dietary approaches to stop hypertension (DASH) diet-relationship with metabolic syndrome and newly diagnosed diabetes in the ELSA—Brasil study. Diabetol. Metab. Syndr. 2017, 9, 13. [Google Scholar] [CrossRef]
- Falahi, E.; Anbari, K.; Ebrahimzadeh, F.; Roosta, S. Dietary patterns associated with metabolic syndrome: The Khorramabad Study. J. Nutr. Food Secur. 2017, 2, 201–212. [Google Scholar]
- Higgins, J.P.T.; Thompson, S.G. Quantifying heterogeneity in a meta-analysis. Stat. Med. 2002, 21, 1539–1558. [Google Scholar] [CrossRef]
- Higgins, J.P.T.; Thompson, S.G.; Deeks, J.J.; Altman, D.G. Measuring inconsistency in meta-analyses. BMJ 2003, 327, 557–560. [Google Scholar] [CrossRef]
- Begg, C.B.; Mazumdar, M. Operating characteristics of a rank correlation test for publication bias. Biometrics 1994, 50, 1088–1101. [Google Scholar] [CrossRef] [PubMed]
- Egger, M.; Smith, G.D.; Schneider, M.; Minder, C. Bias in meta-analysis detected by a simple, graphical test. BMJ 1997, 315, 629–634. [Google Scholar] [CrossRef] [PubMed]
- Brennan, S.F.; Cantwell, M.M.; Cardwell, C.R.; Velentzis, L.S.; Woodside, J.V. Dietary patterns and breast cancer risk: A systematic review and meta-analysis. Am. J. Clin. Nutr. 2010, 91, 1294–1302. [Google Scholar] [CrossRef] [PubMed]
- Magalhães, B.; Peleteiro, B.; Lunet, N. Dietary patterns and colorectal cancer. Eur. J. Cancer Prev. 2012, 21, 15–23. [Google Scholar] [CrossRef] [PubMed]
- Garcia-Larsen, V.; Morton, V.; Norat, T.; Moreira, A.; Potts, J.F.; Reeves, T.; Bakolis, I. Dietary patterns derived from principal component analysis (PCA) and risk of colorectal cancer: A systematic review and meta-analysis. Eur. J. Clin. Nutr. 2019, 73, 366–386. [Google Scholar] [CrossRef] [PubMed]
- Lu, P.-Y.; Shu, L.; Shen, S.-S.; Chen, X.-J.; Zhang, X.-Y. Dietary Patterns and Pancreatic Cancer Risk: A Meta—Analysis. Nutrients 2017, 9, 38. [Google Scholar] [CrossRef] [PubMed]
- Sun, Y.; Li, Z.; Li, J.; Li, Z.; Han, J. A Healthy Dietary Pattern Reduces Lung Cancer Risk: A Systematic Review and Meta—Analysis. Nutrients 2016, 8, 134. [Google Scholar] [CrossRef] [PubMed]
- Fabiani, R.; Minelli, L.; Bertarelli, G.; Bacci, S. A Western Dietary Pattern Increases Prostate Cancer Risk: A Systematic Review and Meta—Analysis. Nutrients 2016, 8, 626. [Google Scholar] [CrossRef] [PubMed]
- Fabiani, R.; Naldini, G.; Chiavarini, M. Dietary Patterns in Relation to Low Bone Mineral Density and Fracture Risk: A Systematic Review and Meta—Analysis. Adv. Nutr. 2019, 10, 219–236. [Google Scholar] [CrossRef] [PubMed]
- Rodríguez-Monforte, M.; Flores-Mateo, G.; Sánchez, E. Dietary patterns and CVD: A systematic review and meta-analysis of observational studies. Br. J. Nutr. 2015, 114, 1341–1359. [Google Scholar] [CrossRef] [PubMed]
- McEvoy, C.T.; Cardwell, C.R.; Woodside, J.V.; Young, I.S.; Hunter, S.J.; McKinley, M.C. A Posteriori Dietary Patterns Are Related to Risk of Type 2 Diabetes: Findings from a Systematic Review and Meta—Analysis. J. Acad. Nutr. Diet. 2014, 114, 1759–1775. [Google Scholar] [CrossRef] [PubMed]
- Jannasch, F.; Kröger, J.; Schulze, M.B. Dietary Patterns and Type 2 Diabetes: A Systematic Literature Review and Meta—Analysis of Prospective Studies. J. Nutr. 2017, 147, 1174–1182. [Google Scholar] [CrossRef] [PubMed]
- van de Rest, O.; Berendsen, A.A.; Haveman-Nies, A.; de Groot, L.C. Dietary Patterns, Cognitive Decline, and Dementia: A Systematic Review. Adv. Nutr. 2015, 6, 154–168. [Google Scholar] [CrossRef] [PubMed]
- Devine, C.M. A life course perspective: Understanding food choices in time, social location, and history. J. Nutr. Educ. Behav. 2005, 37, 121–128. [Google Scholar] [CrossRef]
- Kousar, R.; Burns, C.; Lewandowski, P. A culturally appropriate diet and lifestyle intervention can successfully treat the components of metabolic syndrome in female Pakistani immigrants residing in Melbourne, Australia. Metabolism 2008, 57, 1502–1508. [Google Scholar] [CrossRef]
- Maghsoudi, Z.; Azadbakht, L. How dietary patterns could have a role in prevention, progression, or management of diabetes mellitus? Review on the current evidence. J. Res. Med. Sci. 2012, 17, 694–709. [Google Scholar] [PubMed]
- Calton, E.K.; James, A.P.; Pannu, P.K.; Soares, M.J. Certain dietary patterns are beneficial for the metabolic syndrome: Reviewing the evidence. Nutr. Res. 2014, 34, 559–568. [Google Scholar] [CrossRef]
- Azadbakht, L.; Mirmiran, P.; Esmaillzadeh, A.; Azizi, T.; Azizi, F. Beneficial Effects of a Dietary Approaches to Stop Hypertension Eating Plan on Features of the Metabolic Syndrome. Diabetes Care 2005, 28, 2823–2831. [Google Scholar] [CrossRef]
- Adamsson, V.; Reumark, A.; Cederholm, T.; Vessby, B.; Risérus, U.; Johansson, G. What is a healthy Nordic diet? Foods and nutrients in the NORDIET study. Food Nutr. Res. 2012, 56, 18189. [Google Scholar] [CrossRef]
- Pucci, G.; Alcidi, R.; Tap, L.; Battista, F.; Mattace-Raso, F.; Schillaci, G. Sex-and gender-related prevalence, cardiovascular risk and therapeutic approach in metabolic syndrome: A review of the literature. Pharmacol. Res. 2017, 120, 34–42. [Google Scholar] [CrossRef]
- Azadbakht, L.; Esmaillzadeh, A. Red Meat Intake Is Associated with Metabolic Syndrome and the Plasma C—Reactive Protein Concentration in Women. J. Nutr. 2009, 139, 335–339. [Google Scholar] [CrossRef] [PubMed]
- Nettleton, J.A.; Steffen, L.M.; Mayer-Davis, E.J.; Jenny, N.S.; Jiang, R.; Herrington, D.M.; Jacobs, D.R., Jr. Dietary patterns are associated with biochemical markers of inflammation and endothelial activation in the Multi—Ethnic Study of Atherosclerosis (MESA). Am. J. Clin. Nutr. 2006, 83, 1369–1379. [Google Scholar] [CrossRef] [PubMed]
- Deng, F.E.; Shivappa, N.; Tang, Y.; Mann, J.R.; Hebert, J.R. Association between diet-related inflammation, all-cause, all-cancer, and cardiovascular disease mortality, with special focus on prediabetics: Findings from NHANES III. Eur. J. Nutr. 2017, 56, 1085–1093. [Google Scholar] [CrossRef] [PubMed]
- Fung, T.T.; Willett, W.C.; Stampfer, M.J.; Manson, J.E.; Hu, F.B. Dietary patterns and the risk of coronary heart disease in women. Arch. Intern. Med. 2001, 161, 1857–1862. [Google Scholar] [CrossRef] [PubMed]


| First Author Year Location | Study Design, Name, and Population Cases/Controls Follow-Up Incident Cases Age | Assessment of Metabolic Syndrome | Dietary Pattern Assessment and Identification Method | Dietary Pattern Type and Characteristics | Pattern Score | OR/RR (95% CI) | p for Trend | Matched or Adjusted Variables |
|---|---|---|---|---|---|---|---|---|
| Asadi [19] 2019 Iran | Cross-sectional Mashhad stroke and heart atherosclerotic disorder (MASHAD) study Cases: 1890 Age 50.11 ± 7.76 Control: 4005 Age 47.56 ± 8.21 |
| 65-item FFQ6 (IA7) 22 food groups FA8 Varimax rotation EIG9>1 3 factors VE10 23% | 1. Balanced: vegetables, green leafy vegetables, fruit, dairy products, red meats, poultry, legumes | Tertile 1 Tertile 3 | 1.00 (Reference) 0.90 (0.73–1.11) | 0.343 | Age, sex, BMI11, physical activity, smoking, education, marital status, total energy intake |
| 2. Western: sugar, tea, eggs, potato, snacks, organs meat, nuts, butter, pickled foods, carbonated beverages, red meats | Tertile 1 Tertile 3 | 1.00 (Reference) 1.58 (1.21–2.06) | 0.001 | |||||
| 3. High-carbohydrate: refined grains, carbonated beverages, fast foods, snacks, sugar, coffee, sea foods | Tertile 1 Tertile 3 | 1.00 (Reference) 1.17 (1.02–1.33) | 0.023 | |||||
| Czekajlo [20] 2019 Poland | Cross-sectional Prospective Urban and Rural Epidemiological (PURE) study Cases: 721 Age 56.4 ± 9.1 Control: 913 Age 53.0 ± 10.1 |
| 154-item FFQ 22 food groups PCA12 Varimax rotation Loading >0.5 3 factors VE 35.2% | 1. Western: refined grains, processed meat, sweets and sugar, honey | Quartile 1 Quartile 4 | 1.00 (Reference) 0.90 (0.65–1.25) | Age, sex, residence, education, physical activity, smoking, total energy intake | |
| 2. Fruit and vegetables: fruit, vegetables and nuts, seeds and raisins | Quartile 1 Quartile 4 | 1.00 (Reference) 1.13 (0.82–1.54) | ||||||
| 3. Traditional: mixed dishes, soups, fish and red meat | Quartile 1 Quartile 4 | 1.00 (Reference) 1.28 (0.95–1.72) | ||||||
| Agodi [31] 2018 Czech Republic | Cross-sectional Kardiovize Brno 2030 study Cases: 739 Age 54.0 (IQR 15) Control: 1195 Age 41.5 (IQR 17) |
| 43-item FFQ 31 food groups PCA Varimax rotation EIG>2 Loading ≥0.25 2 factors VE 13.73% | 1. Western: white bread, processed meat, fries, hamburger | Tertile 1 Tertile 3 | 1.00 (Reference) 1.24 (0.83–1.85) | 0.132 | Age, sex, marital status, employment, education, smoking, BMI, total energy intake, physical activity |
| 2. Prudent: cereals, jam and honey, fish, fruit | Tertile 1 Tertile 3 | 1.00 (Reference) 0.65 (0.47–0.88) | 0.004 | |||||
| Cattafesta [42] 2018 Brazil | Cross-sectional 515 bankers Age 20–64 Cases: 85 Control: 410 |
| 73-item FFQ (IA) PCA Varimax rotation Loading >0.3 3 factors | 1. Vegetables, fruit, cereals, and tubers: cabbage, carrot, cucumber, pumpkin, zucchini, okra, chayote, cauliflower, beet and pod, lettuce, tomato, papaya, apple, pear, watermelon, guava, mango, pineapple, grape, orange, manioc, polenta, cooked potatoes, onion, garlic, peppers | Quintile 1 Quintile 3 Quintile 5 | 1.00 (Reference) 0.305 (0.138–0.672) 0.447 (0.216–0.926) | 0.003 | NR13 |
| 2. Sweets and snacks: lentils, cake, ice cream, chocolate, pudding, chocolate powder, pizza, salty fish, canned fish and shrimp, wine, viscera, and avocado | NR | |||||||
| 3. Traditional and protein: rice, beans, pork, bone-in beef and beef steak, sausage, eggs, potato chips, hamburger, bacon, mayonnaise, sweet bread, salt bread, butter/margarine | NR | |||||||
| Drake [53] 2018 Sweden | Cohort study Malmö Diet and Cancer Study (MDCS) 2368 subjects Age 45–67 follow-up: 16.7 1131 incident cases |
| 1. 7-d food record 2. 168-items FFQ 3. Diet history interview 38 food groups RRR14 2 factors VE 3.2% | 1. Western: sugar-sweetened beverages, milk (reduced fat), artificially sweetened beverages, red and processed meat, sweets | Quartile 1 Quartile 4 | 1.00 (Reference) 1.47 (1.23–1.77) | <0.001 | Age, sex, total energy intake, height, smoking, education, total physical activity, co-habiting status |
| 2. Drinker: alcoholic beverages, red and processed meat, fish and shellfish, eggs | Quartile 1 Quartile 4 | 1.00 (Reference) 1.00 (0.85–1.19) | 0.88 | |||||
| Hassannejad [54] 2018 Iran | Cohort study Isfahan Cohort Study (ICS) 1387 participants follow-up: 13 |
| 48-item FFQ (IA) 21 food groups PCA Varimax rotation EIG>1.5 loading >0.2 3 factors VE 26.2% | 1. Healthy: fruit, vegetables, olive oils, chicken, fish, nuts and beans | 2 categories | 1.00 (Reference) 0.50 (0.36–0.70) | Age, sex, socioeconomic status, smoking, physical activity, BMI, medications for hypertension and diabetes | |
| 2. Iranian: dairy product, animal fat, sweets, organ meat, red meat and hydrogenated oils | 2 categories | 1.00 (Reference) 1.28 (1.01–1.65) | ||||||
| 3. Western: fried foods, rice, red meat, hydrogenated oils, carbonated beverages, fast foods, canned food, sweets | 2 categories | 1.00 (Reference) 1.14 (0.76–1.71) | ||||||
| Shokrzadeh [55] 2018 Iran | Cross-sectional 304 men and women, Age 20–60 |
| 147-item FFQ (IA) 24 food groups FA 2 factors VE 18.3 | 1. Healthy: fruit, vegetables, olive, nuts, legumes, cereal, low-fat dairy products, liquid oil, olive oil, fish | Tertile 1 Tertile 3 | 1.00 (Reference) 1.3 (0.6–3.0) | 0.55 | Age, sex, physical activity |
| 2. Unhealthy: snacks, red meat, fat dairy, mayonnaise, tuna, organ meats, processed meats, sweets, pizza, spices, ketchup | Tertile 1 Tertile 3 | 1.00 (Reference) 2.8 (1.2–6.6) | 0.09 | |||||
| Wei [56] 2018 China | Cross-sectional 1918 individuals Age 45–59 Cases: 453 Age 54.82 ± 9.63 Control: 1465 51.48 ± 9.56 |
| 138-item FFQ (IA) 30 food groups PCFA16 Varimax rotation EIG≥1.5 Loading ≥0.4 3 factors VE 23% | 1. Traditional Chinese: whole grains, tubers, vegetables, fruit, pickled vegetables, mushrooms, bacon, salted fish, salted and preserved eggs, soya bean and its products, miscellaneous beans, vegetable oil, tea | Quartile 1 Quartile 4 | 1.00 (Reference) 0.72 (0.596–0.952) | <0.05 | Sage, sex, education, physical activity, smoking, total energy intake |
| 2. Animal food: red meats, poultry and organs, processed and cooked meat, fish and shrimp, eggs, seafood, alcoholic beverages, coffee | Quartile 1 Quartile 4 | 1.00 (Reference) 1.28 (1.103–1.697) | <0.05 | |||||
| 3. High-energy: refined grains, milk, cheese, fats, fast foods, nuts, snacks, chocolates, honey, drinks | Quartile 1 Quartile 4 | 1.00 (Reference) 1.09 (0.825–1.495) | 0.44 | |||||
| Drehmer [57] 2017 Brazil | Cross-sectional Brazilian Longitudinal Study of Adult Health (ELSA—Brazil) 9835 participants Age 50.7 ± 8.7 |
| 114-item FFQ PCA Varimax rotation EIG ≥1.5 Loading ≥0.2 4 factors VE 23% | 1. Vegetables/fruit: vegetables and fruit | Quintile 1 Quintile 5 | 1.00 (Reference) 1.07 (0.90–1.28) | 0.366 | Age, sex, race, education, family income, occupational status, study center, menopausal status, family history of diabetes, BMI, physical activity, smoking, alcohol, calorie intake |
| 2. Common Brazilian fast foods/full fat dairy/desserts: fast foods, cakes, milk-based desserts, regular cheese and red meats | Quintile 1 Quintile 5 | 1.00 (Reference) 0.86 (0.71–1.04) | 0.057 | |||||
| 3. Common Brazilian meal: white rice, beans, beer, processed and fresh meats | Quintile 1 Quintile 5 | 1.00 (Reference) 2.13 (1.76–2.58) | <0.001 | |||||
| 4. Diet or light foods and beverages/low-fat dairy: low-fat foods, low or zero sugar beverages with artificial sweeteners and low-fat dairy | Quintile 1 Quintile 5 | 1.00 (Reference) 1.47 (1.23–1.71) | <0.001 | |||||
| Falahi [58] 2017 Iran | Cross-sectional 973 persons Age 18–75 |
| 168-item FFQ (SA) 40 food groups PCFA Loading >0.2 3 factors VE 29.9% | 1. Western: red meat, processed meat, organ meats, margarine, coffee, sweets and desserts, soft drinks, condiments, dried fruit | Quintile 1 Quintile 5 | 1.00 (Reference) 2.70 (1.52–4.79) | 0.002 | Age, sex, smoking, physical activity, drug using, history of diabetes, history of heart disease, BMI |
| 2. Healthy: poultry, dairy products, fish, fruit, yellow vegetables, cruciferous vegetables, green leafy vegetables, other vegetables, legumes, whole grains, olives | Quintile 1 Quintile 5 | 1.00 (Reference) 0.39 (0.21–0.71) | 0.004 | |||||
| 3. Traditional: grains, tea, nuts, fruit juices, eggs, pickles, hydrogenated oils, vegetables oils, sugar, salt | Quintile 1 Quintile 5 | 1.00 (Reference) 1.43 (0.80–2.54) | 0.48 | |||||
| Nasreddine [21] 2017 Lebanon | Cross-sectional 302 subjects Cases: 195 Age 43.4 ± 14.7 Controls: 107 Age 37.2 ± 12.9 |
| 80-item FFQ (IA) 25 food groups FA Varimax rotation Loading >0.4 2 factors VE 22.44% | 1. Ultra-processed: fast foods, snacks, meat, nuts, sweets and liquor | 2 categories | 1.00 (Reference) 1.11 (0.26–4.65) | Age, sex, marital status, area of residence, education, income, smoking, physical activity, total energy intake, BMI | |
| 2. Minimally processed/processed: fruit, vegetables, legumes, breads, cheeses, sugar and fats | 2 categories | 1.00 (Reference) 0.21 (0.05–0.87) | ||||||
| Suliga [22] 2017 Poland | Cross-sectional Polish–Norwegian Study (PONS) Study 7997 participants Age 37–66 |
| 67-item FFQ 33 food groups FA Varimax rotation Loading >0.3 3 factors VE 26.7% | 1. Healthy: fruit and vegetables, sour cabbage, whole grains, yogurt, cottage cheese, fish, nuts | Quartile 1 Quartile 4 | 1.00 (Reference) 1.05 (0.90–1.22) | 0.56 | Age, sex, place of living, education, marital status, smoking, physical activity, BMI |
| 2. Westernized: fried dishes, oil, mayonnaise, red meat, processed meat, eggs, sugar-sweetened beverages, alcohol, sugar, sweets | Quartile 1 Quartile 4 | 1.00 (Reference) 1.04 (0.89–1.21) | 0.88 | |||||
| 3. Traditional-carbohydrate: potatoes, refined grains, soups, sugar, sweets, high-fat milk | Quartile 1 Quartile 4 | 1.00 (Reference) 1.05 (0.90–1.23) | 0.593 | |||||
| Wang [23] 2017 Samoa | Cross-sectional 2774 adults Cases: 1104 Age 49 ± 10 Controls: 1670 Age 42 ± 11 |
| 104-item FFQ 28 food groups PCA Varimax rotation EIG >1.0 Loading ≥0.3 3 factors VE 36% | 1. Modern: pizza, cheeseburgers, breakfast cereal, margarine, sugary drinks, desserts, snacks, egg products, noodles, nuts, breads, and cakes | Quintile 1 Quintile 5 | 1.00 (Reference) 1.00 (0.86–1.15) | 0.62 | Age, sex, material lifestyle score, smoking, total energy intake, physical activity, hypertension medication, diabetes medication |
| 2. Mixed-traditional: fruit, vegetables, soup, poultry, fish, dairy products, breads and cakes | Quintile 1 Quintile 5 | 1.00 (Reference) 0.97 (0.84–1.11) | 0.24 | |||||
| 3. Mixed-modern: red meat, egg products, noodles, grains, seafood and coconut products | Quintile 1 Quintile 5 | 1.00 (Reference) 0.79 (0.69–0.91) | 0.006 | |||||
| Kang [24] 2016 Korea | Cross-sectional KNHANES 5384 men 8026 women Age ≥19 |
| 24-h recall method 24 food groups FA Varimax rotation EIG >1.3 Loading ≥0.25 3 factors VE 20.9% (Men) 20.5% (Women) | 1. Traditional: white rice and kimchi | MEN | MEN | Age, BMI, income, smoking, physical activity, educational level, alcohol, energy intake | |
| Quartile 1 | 1.00 (Reference) | 0.4344 | ||||||
| Quartile 4 | 1.08 (0.87–1.35) | |||||||
| WOMEN | WOMEN | |||||||
| Quartile 1 | 1.00 (Reference) | 0.0003 | ||||||
| Quartile 4 | 1.41 (1.15–1.73) | |||||||
| 2. Westernized: oils, sugar and sweets, vegetables, and fish | MEN | MEN | ||||||
| Quartile 1 | 1.00 (Reference) | |||||||
| Quartile 4 | NR | |||||||
| WOMEN | WOMEN | |||||||
| Quartile 1 | 1.00 (Reference) | |||||||
| Quartile 4 | NR | |||||||
| 3. Healthy: whole grains, legumes, fruit, and seaweed | MEN | MEN | ||||||
| Quartile 1 | 1.00 (Reference) | 0.1341 | ||||||
| Quartile 4 | 0.81 (0.66–1.01) | |||||||
| WOMEN | WOMEN | |||||||
| Quartile 1 | 1.00 (Reference) | 0.7596 | ||||||
| Quartile 4 | 1.02 (0.85–1.21) | |||||||
| Xia [25] 2016 China | Case-control Tianjin Chronic Low-grade Systemic Inflammation and Health (TCLSI Health) 1636 cases 6677 controls |
| 81-item FFQ FA Varimax rotation EIG >1.0 Loading >0.3 3 factors VE 27.4% | 1. High-carbohydrate/sweet: candied fruit, cakes, ice cream, and juice | Quartile 1 Quartile 4 | 1.00 (Reference) 1.04 (0.85–1.28) | 0.91 | Other dietary pattern factor scores |
| 2. Balanced: balance intake of vegetables, mushroom and coarse cereals | Quartile 1 Quartile 4 | 1.00 (Reference) 0.84 (0.68–1.04) | 0.29 | |||||
| 3. High-protein/cholesterol: animal offal, animal blood, and sausage | Quartile 1 Quartile 4 | 1.00 (Reference) 1.36 (1.10, 1.68) | <0.01 | |||||
| Aekplakorn [26] 2015 Thailand | Cross-sectional NHES IV 2693 men 3179 women Age 30–59 |
| FFQ 22 food groups PCA Varimax rotation EIG >1.5 3 factors VE 32.74% (men) 33.1% (women) | 1. Meat: red meat, processed meat, and fried food | MEN | MEN | Age, alcohol drinking, family history of diabetes, smoking, physical activity, BMI | |
| Quartile 1 | 1.00 (Reference) | |||||||
| Quartile 4 | 1.01 (0.82–1.23) | |||||||
| WOMEN | WOMEN | |||||||
| Quartile 1 | 1.00 (Reference) | |||||||
| Quartile 4 | 0.94 (0.72–1.21) | |||||||
| 2. Healthy: beans, vegetables, wheat, and dairy products. | MEN | MEN | ||||||
| Quartile 1 | 1.00 (Reference) | |||||||
| Quartile 4 | 0.91 (0.67–1.23) | |||||||
| WOMEN | WOMEN | |||||||
| Quartile 1 | 1.00 (Reference) | |||||||
| Quartile 4 | 0.72 (0.52–0.99) | |||||||
| 3. Carbohydrate: glutinous rice, fermented fish, chili paste, and bamboo shoots | MEN | MEN | ||||||
| Quartile 1 | 1.00 (Reference) | |||||||
| Quartile 4 | 1.82 (1.31–2.55) | |||||||
| WOMEN | WOMEN | |||||||
| Quartile 1 | 1.00 (Reference) | |||||||
| Quartile 4 | 1.60 (1.24–2.08) | |||||||
| Bell [27] 2015 Australia | Cross-sectional 2011–2012 NNPAS 2415 adults Age >45 |
| 24-h dietary recall 39 food groups PCFA Varimax rotation EIG >1.5 Loadings > 0.25 3 factors VE 21.9% | 1. Red Meat and Vegetable: red meat and several types of vegetables | One standard deviation increase | 0.99 (0.89–1.10) | ||
| 2. Refined and Processed: added sugar, full fat dairy, unsaturated spreads, cakes, pastries, and processed meat | 0.92 (0.81–1.04) | |||||||
| 3. Healthy: wholegrains, fresh fruit, dried fruit, legumes and low-fat dairy loaded | 1.16 (1.04–1.29) | |||||||
| Choi [28] 2015 Korea | Cross-sectional 5189 women Age 31–70 mean 52.2 ± 8.3 |
| 106-item FFQ 37 food groups PCA Varimax rotation 3 factors VE 24.7% | 1. Traditional: vegetables, condiments, shellfish, mushrooms, seaweed, fish, tubers, and kimchi | Quintile 1 Quintile 5 | 1.00 (Reference) 1.09 (0.83–1.44) | 0.44 | Age, marital status, education, household income, smoking status, alcohol consumption, regular exercise, and total energy intake. |
| 2. Western: red meat, oil, cake/pizza, noodles, poultry, processed meats, bread, and sweets | Quintile 1 Quintile 5 | 1.00 (Reference) 0.98 (0.72–1.32) | 0.95 | |||||
| 3. Prudent: fruit and fruit products, bread, dairy products, nuts, cake/pizza, and milk | Quintile 1 Quintile 5 | 1.00 (Reference) 0.50 (0.36–0.68) | <0.001 | |||||
| Gadgil [29] 2015 USA | Cross-sectional MASALA 892 South Asians Age 40–84 | NR | 163-item FFQ 29 food groups PCA Varimax rotation EIG >1.0 Loadings > 0.25 3 factors VE 23.2% | 1. Animal protein: poultry, red meat, eggs, fish | Tertile 1 Tertile 3 | 1.00 (Reference) 0.69 (0.43–1.10) | 0.73 | Age, sex, energy intake, study site, income, education, smoking, alcohol intake, exercise, BMI, waist circumference |
| 2. Fried snacks, sweets, and high-fat dairy: butter/ghee, fried snacks, high-fat dairy, potatoes, sweets | Tertile 1 Tertile 3 | 1.00 (Reference) 0.95 (0.56–1.59) | 0.18 | |||||
| 3. Fruit, vegetables, nuts, and legumes: fruit, legumes, nuts, vegetables, vegetables oil | Tertile 1 Tertile 3 | 1.00 (Reference) 0.65 (0.38–1.11) | 0.08 | |||||
| He [30] 2015 China | Cross-sectional CNNHS Cases: 617 Controls: 1579 Age ≥18 |
| 24-h dietary recall for 3 d FA Varimax rotation EIG >1.0 Loading ≥ 0.5 4 factors VE 48.65% | 1. Refined Grains and Vegetables: refined grains, vegetables and livestock meat | MEN | MEN | Age, occupation, types of area, BMI | |
| Quintile 1 | 1.00 (Reference) | 0.496 | ||||||
| Quintile 5 | 0.60 (0.32–1.14) | |||||||
| WOMEN | WOMEN | |||||||
| Quintile 1 | 1.00 (Reference) | 0.021 | ||||||
| Quintile 5 | 0.98 (0.55–1.77) | |||||||
| 2. Dairy and Eggs: milk, dairy products, eggs, fruit, marine products | MEN | MEN | ||||||
| Quintile 1 | 1.00 (Reference) | <0.001 | ||||||
| Quintile 5 | 1.54 (0.88–2.68) | |||||||
| WOMEN | WOMEN | |||||||
| Quintile 1 | 1.00 (Reference) | 0.008 | ||||||
| Quintile 5 | 0.45 (0.26–0.79) | |||||||
| 3. Organ Meat and Poultry: organ meat and poultry | MEN | MEN | ||||||
| Quintile 1 | 1.00 (Reference) | 0.087 | ||||||
| Quintile 5 | 1.63 (0.93–2.87) | |||||||
| WOMEN | WOMEN | |||||||
| Quintile 1 | 1.00 (Reference) | 0.002 | ||||||
| Quintile 5 | 0.70 (0.41–1.22) | |||||||
| 4. Coarse Grains and Beans: coarse grain, soybean, bean products | MEN | MEN | ||||||
| Quintile 1 | 1.00 (Reference) | 0.467 | ||||||
| Quintile 5 | 0.75 (0.44–1.29) | |||||||
| WOMEN | WOMEN | |||||||
| Quintile 1 | 1.00 (Reference) | 0.655 | ||||||
| Quintile 5 | 1.35 (0.81–2.22) | |||||||
| Suliga [32] 2015 Poland | Cross-sectional PONS 2479 subjects with a normal weight Age 37–66 |
| 134-item FFQ 31 food groups PCFA Varimax rotation Loading ≥ 0.3 4 factors VE 32.95% | 1. Healthy: fruit and vegetables, low-fat milk and dietary products, whole grains food | Tertile 1 Tertile 3 | 1.00 (Reference) 0.87 (0.68–1.13) | Age, level of education, place of residence, smoking cigarettes and physical activity | |
| 2. Fat, meat and alcohol: lard, red meat, cold cured meat, eggs, fried dishes, vegetable oils, mayonnaise and alcoholic drinks | Tertile 1 Tertile 3 | 1.00 (Reference) 1.04 (0.82–1.33) | ||||||
| 3. Prudent: fish and whole grains products | Tertile 1 Tertile 3 | 1.00 (Reference) 0.69 (0.53–0.89) | ||||||
| 4. Coca-Cola, hard cheese and French fries: Coca-Cola, hard cheese and French fries | Tertile 1 Tertile 3 | 1.00 (Reference) 0.82 (0.64–1.04) | ||||||
| Arisawa [33] 2014 Japan | Cross-sectional J–MICC Cases: 91 Age 53.5 ± 8.9 Controls: 422 Age 51.4 ± 9.4 |
| 46-item FFQ PCA EIG ≥1.0 Loading ≥ 0.2 4 factors VE 33% | 1. Prudent: fruit, vegetables and mushrooms | One standard deviation increase | 0.77 (0.56–1.03) | Age, sex, total energy intake, physical activity, smoking and drinking habits | |
| 2. High-fat/Western: meat, meat products, mayonnaise, fried foods, fried dishes, Western-style confectionery | 1.08 (0.83–1.42) | |||||||
| 3. Bread and dairy: bread, margarine, mil and yogurt | 0.89 (0.69–1.14) | |||||||
| 4. Seafood: squid, shrimp, crab, octopus, shellfish, roe | 1.14 (0.91–1.44) | |||||||
| Woo [34] 2014 Korea | Cross-sectional 486 men 771 women Age 31–70 Cases: 205 Age 55.9 ± 9.2 Controls 1052 Age 50.8 ± 9.0 |
| 103-item FFQ 37 food groups PCA Varimax rotation Loading >0.2 3 factors VE 31.9% | 1. Traditional: condiments, green/yellow vegetables, light-colored vegetables, tubers, clams, tofu/soymilk, and seaweed | MEN | MEN | Age, total energy intake, smoking status, alcohol consumption, and physical activity | |
| Quartile 1 | 1.00 (Reference) | 0.33 | ||||||
| Quartile 4 | 1.18 (0.66–2.10) | |||||||
| WOMEN | WOMEN | |||||||
| Quartile 1 | 1.00 (Reference) | 0.978 | ||||||
| Quartile 4 | 1.07 (0.58–1.97) | |||||||
| 2. Meat: red meat, red meat byproducts, other seafood, and high-fat red meat | MEN | MEN | ||||||
| Quartile 1 | 1.00 (Reference) | 0.005 | ||||||
| Quartile 4 | 2.15 (1.10–4.21) | |||||||
| WOMEN | WOMEN | |||||||
| Quartile 1 | 1.00 (Reference) | 0.455 | ||||||
| Quartile 4 | 1.14 (0.68–1.92) | |||||||
| 3. Snack: cake/pizza, snacks, and bread | MEN | MEN | ||||||
| Quartile 1 | 1.00 (Reference) | 0.335 | ||||||
| Quartile 4 | 0.80 (0.49–1.31) | |||||||
| WOMEN | WOMEN | |||||||
| Quartile 1 | 1.00 (Reference) | 0.83 | ||||||
| Quartile 4 | 1.11 (0.66–1.85) | |||||||
| Akter [35] 2013 Japan | Cross-sectional 460 subjects Age 21–67 Cases: 59 |
| 46-item diet history questionnaire PCA Varimax rotation Loading >0.15 3 factors VE 19.5% | 1. Healthy Japanese: vegetables, fruit, soy products, mushrooms, green tea | Tertile 1 Tertile 3 | 1.00 (Reference) 1.35 (0.55–3.30) | 0.43 | Age, sex, workplace, occupational physical activity, job position, marital status, non-occupational physical activity, smoking |
| 2. Animal food: fish and shellfish, meat, processed meat, mayonnaise, and egg | Tertile 1 Tertile 3 | 1.00 (Reference) 1.54 (0.73–3.24) | 0.25 | |||||
| 3. Westernized breakfast: bread, confectioneries, milk and yogurt, mayonnaise, and egg | Tertile 1 Tertile 3 | 1.00 (Reference) 0.39 (0.16–0.95) | 0.02 | |||||
| Baik [36] 2013 Korea | Cohort 5251 male and female Age 40–69 6-year follow-up Incident cases:1325 |
| 103-item FFQ 27 food groups FA Varimax rotation EIG >2.0 2 factors VE 21% | 1. Healthy: fish, seafood, vegetables, seaweed, protein foods, fruit, dairy products, and grains | Quintile 1 Quintile 5 | 1.00 (Reference) 0.76 (0.60–0.97) | <0.05 | Age, sex, income, occupation, education, smoking, alcohol intake, quartiles of MET-hours/day, FTO genotypes, and quartiles of energy intake. |
| 2. Unhealthy: refined white rice, meat, sweetened carbonated beverage, and noodles | Quintile 1 Quintile 5 | 1.00 (Reference) 1.12 (0.92–1.37) | 0.38 | |||||
| Liu [37] 2013 USA | Cross-sectional 1775 African Americans Jackson Heart Study (JHS) Cases: 1053 Age 21–94 |
| 158-item FFQ 31 food groups PCA EIG >1.0 Loading > 0.3 3 factors | 1. Southern: beans and legumes, corn products, fried fish and chicken, meat, processed meat, margarine, butter, rice and pasta | Tertile 1 Tertile 3 | 1.00 (Reference) 2.16 (1.30–3.60) | Age, sex, smoking and alcohol status, education, and physical activity | |
| 2. Fast food: sugar and candy juice, fast food and salty snacks | Tertile 1 Tertile 3 | 1.00 (Reference) 2.40 (1.40–4.20) | ||||||
| 3. Prudent: fruit and vegetables, cold and hot cereals, nuts and seeds | Tertile 1 Tertile 3 | 1.00 (Reference) 0.75 (0.50–1.10) | ||||||
| Naja [38] 2013 Lebanon | Cross-sectional Subjects: 323 Age ≥ 18 Cases:112 Age 42.83 ± 15.34 Controls: 211 Age 36.50 ± 13.91 |
| 61-item FFQ 25 food groups FA Varimax rotation Loading >0.4 3 factors VE 30.62% | 1. Fast Food/Dessert: fast foods sandwiches, hamburger, shawarma, falafel, pizzas, pies, desserts, carbonated beverages and juices, and mayonnaise | Quintile 1 Quintile 5 | 1.00 (Reference) 3.13 (1.36–7.22) | 0.06 | Age, sex, marital status, education, crowding index, physical activity, and smoking |
| 2. Traditional Lebanese: dairy products, olives, fruit, legumes, grains, eggs, vegetable oil, dried fruit, and traditional sweets | Quintile 1 Quintile 5 | 1.00 (Reference) 1.96 (0.82–4.34) | 0.1 | |||||
| 3. High-Protein: fish, chicken, meat, dairy products—low-fat | Quintile 1 Quintile 5 | 1.00 (Reference) 1.22 (0.54–2.77) | 0.76 | |||||
| Oh [39] 2013 Korea | Cross-sectional KNHANES 5320 subjects Age 30–80 2239 men 3081 women |
| 24-h dietary recall 33 food groups PCA Varimax rotation EIG >1.5 3 factors | 1. Balanced Korean: rice, kimchi, whole grains, fish, sea products, vegetables, fruit, dairy products, eggs, meats, and mushrooms. | MEN | MEN | Age, smoking history, alcohol behavior and physical activity | |
| Quintile 1 | 1.00 (Reference) | 0.92 | ||||||
| Quintile 5 | 0.88 (0.61–1.26) | |||||||
| WOMEN | WOMEN | |||||||
| Quintile 1 | 1.00 (Reference) | <0.05 | ||||||
| Quintile 5 | 0.67 (0.47–0.96) | |||||||
| 2. Unbalanced Korean: rice, kimchi and excessive carbohydrate | MEN | MEN | ||||||
| Quintile 1 | 1.00 (Reference) | 0.89 | ||||||
| Quintile 5 | 0.99 (0.68–1.45) | |||||||
| WOMEN | WOMEN | |||||||
| Quintile 1 | 1.00 (Reference) | <0.05 | ||||||
| Quintile 5 | 1.44 (1.03–2.01) | |||||||
| 3. Semi-Western: meats, poultry, eggs, vegetables, and alcoholic beverages | MEN | MEN | ||||||
| Quintile 1 | 1.00 (Reference) | 0.64 | ||||||
| Quintile 5 | 0.95 (0.66–1.39) | |||||||
| WOMEN | WOMEN | |||||||
| Quintile 1 | 1.00 (Reference) | 0.17 | ||||||
| Quintile 5 | 0.87 (0.63–1.20) | |||||||
| Hong [40] 2012 Korea | Cross-sectional 406 subjects Age 22–78 Mean 50.6 |
| 24-h recall and a 3-day food record 33 food groups PCA Varimax rotation EIG >1.5 Loading >0.2 4 factors VE 28.8% | 1. Korean traditional: refined and whole grains, Korean seasonings, onions and garlic, vegetable oil, soy products, starch syrup, and sugar | Quartile 1 Quartile 4 | 1.00 (Reference) 2.03 (1.05–3.92) | 0.047 | Age, sex, taking medications, smoking, physical activity, and BMI |
| 2. Alcohol and meat: processed meats, eggs, fish paste, animal fat, and alcohol | Quartile 1 Quartile 4 | 1.00 (Reference) 1.16 (0.58–2.34) | 0.945 | |||||
| 3. Sweets and fast foods: fruit juices, chocolate, ice cream, pizza, and hamburgers | Quartile 1 Quartile 4 | 1.00 (Reference) 0.81 (0.41–1.61) | 0.687 | |||||
| 4. Fruit and dairy: fruit and dairy products, rice cakes and nuts | Quartile 1 Quartile 4 | 1.00 (Reference) 0.46 (0.22–0.95) | 0.025 | |||||
| Wagner [41] 2012 France | Cross-sectional MONA LISA 3090 subjects Age 35–64 Mean: 50.4 ± 8.4 Cases: 420 men, 259 women Controls: 1141 men, 1271 women |
| 3-day food diary 31 food groups PCA EIG >1.0 Loading >0.2 2 factors VE 13.3% | 1. Energy-dense: red meat, potatoes, vegetable oils, alcohol, delicatessen products, sodas and sauce | MEN | MEN | Age, center, educational level, smoking, total calorie intake, time spent sitting, physical activity, heart rate, menopause, BMI | |
| Quartile 1 | 1.00 (Reference) | <0.04 | ||||||
| Quartile 4 | 1.63 (1.03–2.56) | |||||||
| WOMEN | WOMEN | |||||||
| Quartile 1 | 1.00 (Reference) | 0.1 | ||||||
| Quartile 4 | 1.53 (0.88–2.66) | |||||||
| 2. Convenience-food: pizza, prepared dishes, cake, cream, grains, junk food, sodas and fruit juices | MEN | MEN | ||||||
| Quartile 1 | 1.00 (Reference) | |||||||
| Quartile 4 | 0.82 (0.53–1.28) | |||||||
| WOMEN | WOMEN | |||||||
| Quartile 1 | 1.00 (Reference) | 0.16 | ||||||
| Quartile 4 | 0.69 (0.39–1.24) | |||||||
| Cho [43] 2011 Korea | Cross-sectional 4984 women Age 30–79 |
| FFQ 16 food groups FA Varimax rotation Loading >0.2 3 factors VE 35.8% | 1. Western: fast foods, animal fat-rich foods, fried foods, grilled meat and seafoods, and sweet foods | Quartile 1 Quartile 4 | 1.00 (Reference) 0.87 (0.54–1.20) | 0.304 | Age |
| 2. Healthy: green-yellow vegetables, healthy-protein foods, seaweeds, and bonefish | Quartile 1 Quartile 4 | 1.00 (Reference) 0.58 (0.50–0.91) | 0.012 | |||||
| 3. Traditional: salted vegetables and seafoods, cereals, and light-colored vegetables | Quartile 1 Quartile 4 | 1.00 (Reference) 1.05 (0.79–1.40) | 0.873 | |||||
| Heidemann [44] 2011 Germany | Cross-sectional 4025 subjects Age 18–79 |
| 2678 items 4 weeks face-to-face dietary history 133 food groups PCA Varimax rotation EIG >1.0 2 factors | 1. Processed foods: refined grains, processed meat, red meat, high-sugar beverages, eggs, potatoes, beer, sweets and cakes, snacks and butter | Quintile 1 Quintile 5 | 1.00 (Reference) 1.64 (1.10–2.43) | 0.001 | Age, sex, total energy intake, socioeconomic status, sport activity, smoking |
| 2. Health-conscious: cruciferous vegetables, fruity vegetables, leafy vegetables, all other vegetables, vegetable oils, legumes, fruit, fish and whole grains | Quintile 1 Quintile 5 | 1.00 (Reference) 0.98 (0.72–1.34) | 0.67 | |||||
| Kim [45] 2011 Korea | Cross-sectional second and third KNHANES 9850 adults Age 19 ≥ |
| 24-h recall 23 food groups FA Varimax rotation EIG >1.0 4 factors VE 26.7% | 1. White rice and kimchi: White rice, kimchi, vegetables | Tertile 1 Tertile 3 | 1.00 (Reference) 0.97 (0.85–1.11) | 0.61 | Age, sex, BMI, energy intake, alcohol intake, smoking status, and physical activity |
| 2. Meat and alcohol: noodles and dumplings, meat and its products, alcohol | Tertile 1 Tertile 3 | 1.00 (Reference) 1.04 (0.91–1.19) | 0.6 | |||||
| 3. High-fat, sweets, and coffee: sugar and sweets, eggs, oils, coffee | Tertile 1 Tertile 3 | 1.00 (Reference) 1.04 (0.93–1.17) | 0.51 | |||||
| 4. Grains, vegetables, and fish: grains, nuts, vegetables, fish and shellfish, seasonings | Tertile 1 Tertile 3 | 1.00 (Reference) 0.86 (0.76–0.98) | 0.02 | |||||
| Amini [46] 2010 Iran | Cross-sectional 425 subjects Age 35–55 |
| 39-item FFQ PCA Varimax rotation EIG ≥1.5 5 factors VE 26.4% | 1. Western: sweets, butter, soda, mayonnaise, sugar, cookies, tail of a lamb, hydrogenated fat, eggs | Tertile 1 Tertile 3 | 1.00 (Reference) 2.32 (1.27–4.21) | 0.006 | Age, sex, education, and physical activity |
| 2. Prudent: fish, peas, honey, nuts, juice, dry fruit, vegetable oil, liver and organic meat, coconuts | Tertile 1 Tertile 3 | 1.00 (Reference) 0.58 (0.32–1.04) | 0.06 | |||||
| 3. Vegetarian: potatoes, legumes, fruit rich in vitamin C, rice, green leafy vegetables, and fruit rich in vitamin A | Tertile 1 Tertile 3 | 1.00 (Reference) 1.36 (0.78–2.38) | 0.27 | |||||
| 4. High-fat dairy: high-fat yogurt and high-fat milk | Tertile 1 Tertile 3 | 1.00 (Reference) 1.25 (0.71–2.29) | 0.4 | |||||
| 5. Chicken and plant: chicken, fruit rich in vitamin A, green leafy vegetables, mayonnaise | Tertile 1 Tertile 3 | 1.00 (Reference) 1.05 (0.6–1.84) | 0.84 | |||||
| Denova–Gutierrez [47] 2010 Mexico | Cross-sectional HWCS (Health Workers Cohort Study) 5240 subjects Age 20–70 |
| 116-item FFQ 28 food groups FA Varimax rotation EIG >1.5 Loading ≥0.3 3 factors VE 20.6% | 1. Prudent: processed vegetable juices, potatoes, fresh fruit, fresh vegetables, legumes | Tertile 1 Tertile 3 | 1.00 (Reference) 0.99 (0.85–1.17) | 0.9 | Age, sex, smoking, physical activity, weight change, place of residence, estrogen use, menopausal status, energy intake |
| 2. Western: pastries, refined cereals, corn tortillas, soft drinks | Tertile 1 Tertile 3 | 1.00 (Reference) 1.58 (1.35–1.85) | 0.001 | |||||
| 3. High-protein/fat: red meat, processed meat, margarine (saturated fats), eggs | Tertile 1 Tertile 3 | 1.00 (Reference) 1.18 (1.01–1.39) | 0.04 | |||||
| DiBello [48] (A) 2009 Samoan Islands | Cross-sectional American Samoan (n = 723) |
| 42-item FFQ 13 food groups “Partial least squares regression” 3 factors | 1. Neo-traditional: crab and lobster, fish, coconut cream dishes, papaya soup, coconut milk, papaya, and taro | Quintile 1 Quintile 5 | 1.00 (Reference) 0.89 (0.72–1.06) | 0.23 | Age, sex, modern lifestyle score, smoking, physical activity, total energy intake |
| 2. Factor 2: meat and coconut products such as coconut cream dishes and lamb | Quintile 1 Quintile 5 | 1.00 (Reference) 0.99 (0.81–1.23) | 0.64 | |||||
| 3. Modern: sausage, eggs, milk, cheese, coconut cream, rice, instant noodle soup, bread, pancakes, cereal, butter/margarine, cake, potato chips | Quintile 1 Quintile 5 | 1.00 (Reference) 1.13 (0.93–1.38) | 0.08 | |||||
| DiBello [48] (B) 2009 Samoan Islands | Cross-sectional Samoan (n = 785) Age >18 |
| 42-item FFQ 13 food groups “Partial least squares regression” 3 factors | 1. Neo-traditional: crab and lobster, ripe coconut, coconut cream and coconut cream dishes, and papaya soup | Quintile 1 Quintile 5 | 1.00 (Reference) 0.74 (0.54–1.01) | 0.13 | Age, sex, modern lifestyle score, smoking, physical activity, total energy intake |
| 2. Factor 3: meat and coconut products such as coconut cream dishes and lamb | Quintile 1 Quintile 5 | 1.00 (Reference) 0.98 (0.71–1.35) | 0.99 | |||||
| 3. Modern: sausage, eggs, rice, instant noodle soup, pancakes, cereal, papaya, cake, potato chips, ripe coconut, chop suey, rice dishes, crackers, and soup with vegetables | Quintile 1 Quintile 5 | 1.00 (Reference) 1.21 (0.93–1.57) | 0.05 | |||||
| Noel [49] 2009 USA | Cross-sectional 1167 Puerto Ricans Age 45–75 |
| 126-item FFQ 34 food groups PCA Varimax rotation Loading ≥0.2 3 factors | 1. Meat and French fries: meat, processed meat, French fries, pizza and Mexican foods, eggs, alcohol, and other grains and pasta | Quintile 1 Quintile 5 | 1.00 (Reference) 1.20 (0.76–2.00) | Age, sex, smoking, alcohol use, education, physical activity, total energy, acculturation, lipid-lowering medication and multivitamin use, BMI | |
| 2. Traditional: beans and legumes, rice, oil, vegetables | Quintile 1 Quintile 5 | 1.00 (Reference) 1.70 (1.04–2.70) | ||||||
| 3. Sweets: candy, sugar and chocolate candy, soft drinks, sugary beverages, sweet baked goods, dairy desserts, and salty snacks | Quintile 1 Quintile 5 | 1.00 (Reference) 1.30 (0.83–2.10) | ||||||
| Lutsey [50] 2008 USA | Cohort ARIC 9514 participants Age mean: 53.6 Follow-up 9 3782 incident cases |
| 66-item FFQ 29 food groups PCA Varimax rotation EIG >2.0 Loading ≥0.2 2 factors VE 19.9% | 1. Western: refined grains, processed meat, fried foods, and red meat | Quintile 1 Quintile 5 | 1.00 (Reference) 1.18 (1.03–1.37) | 0.03 | Age, sex, race, education, center, total calories, smoking and physical activity |
| 2. Prudent: cruciferous and carotenoid vegetables, fruit, fish, and poultry | Quintile 1 Quintile 5 | 1.00 (Reference) 1.07 (0.95–1.20) | 0.11 | |||||
| Esmaillzadeh [51] 2007 Iran | Cross-sectional 486 Women Age 40–60 |
| 168-item FFQ (IA) 41 food groups PCA Varimax rotation EIG >1.0 Loading ≥0.2 3 factors | 1. Healthy: fruit, tomatoes, poultry, legumes, cruciferous and green leafy vegetables, other vegetables, tea, fruit juices, and whole grains | Quintile 1 Quintile 5 | 1.00 (Reference) 0.69 (0.36–0.92) | <0.01 | Age, smoking, physical activity, current estrogen use, menopausal status, and family history of diabetes and stroke, energy intake, BMI |
| 2. Western: refined grains, red meat, butter, processed meat, high-fat dairy products, sweets and desserts, pizza, potatoes, eggs, hydrogenated fats, and soft drinks | Quintile 1 Quintile 5 | 1.00 (Reference) 1.60 (1.06–1.88) | <0.01 | |||||
| 3. Traditional: refined grains, potatoes, tea, whole grains, hydrogenated fats, legumes, and broth | Quintile 1 Quintile 5 | 1.00 (Reference) 1.07 (0.86–1.22) | 0.11 | |||||
| Panagiotakos [52] 2007 Greece | Cross-sectional ATTICA study 1518 men Age 46 ± 13 1524 women Age 45 ± 13 |
| 156-item FFQ (SA) 22 food groups Varimax rotation PCA EIG >1.0 Loading >0.4 6 factors VE 56% | 1. Healthful: fish, vegetables, legumes, cereals, and fruit | Logistic regression analysis | 0.87 (0.79–0.97) | 0.013 | Smoking, years of school, income, use of medication, BMI |
| 2. High glycemic index and high-fat: red or white meat and meat products, and potatoes | 1.13 (1.05–1.21) | 0.004 | ||||||
| 3. Component: bread, pasta | 0.97 (0.87–1.08) | 0.564 | ||||||
| 4. Component: dairy, eggs | 1.04 (0.93–1.15) | 0.516 | ||||||
| 5. Component: sweets | 1.06 (0.96–1.18) | 0.268 | ||||||
| 6. Component: alcoholic beverages | 1.26 (1.21–1.33) | 0.001 |
| Combined Risk Estimate | Test of Heterogeneity | Publication Bias | |||||
|---|---|---|---|---|---|---|---|
| Dietary Patterns | Value (95% CI) | p | Q | I2% | p | P (Egger Test) | P (Begg Test) |
| “Healthy” | |||||||
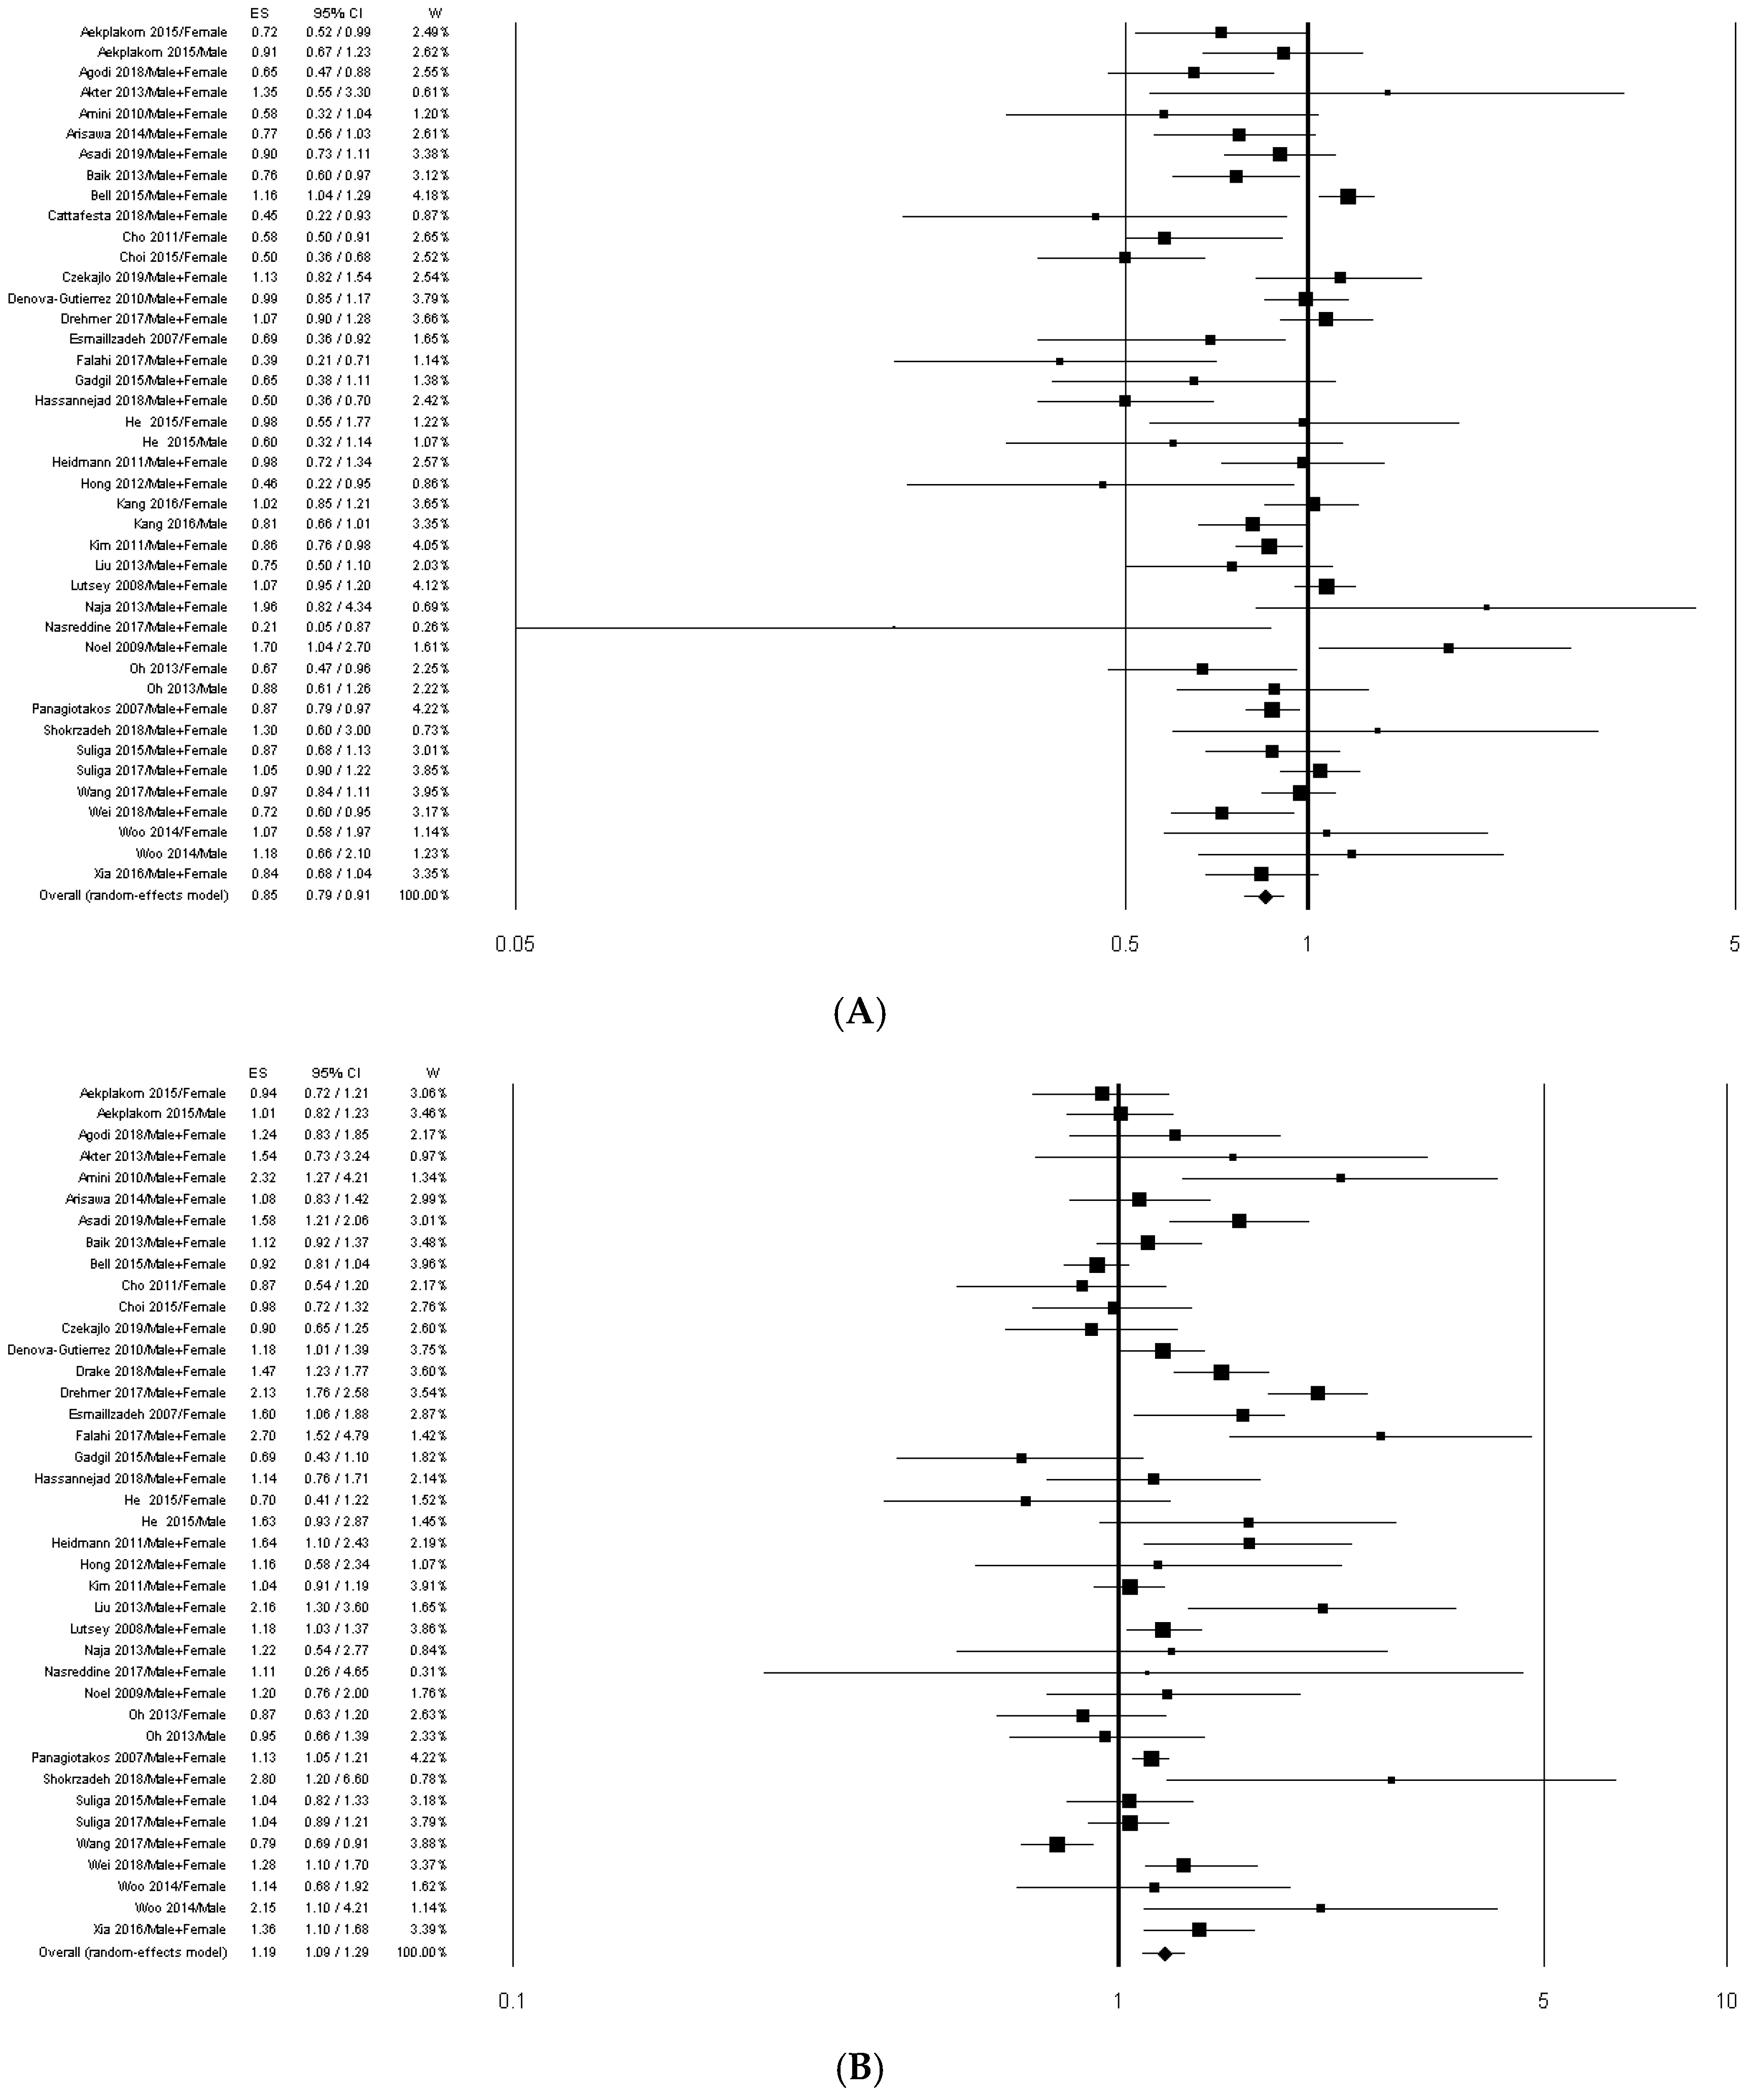
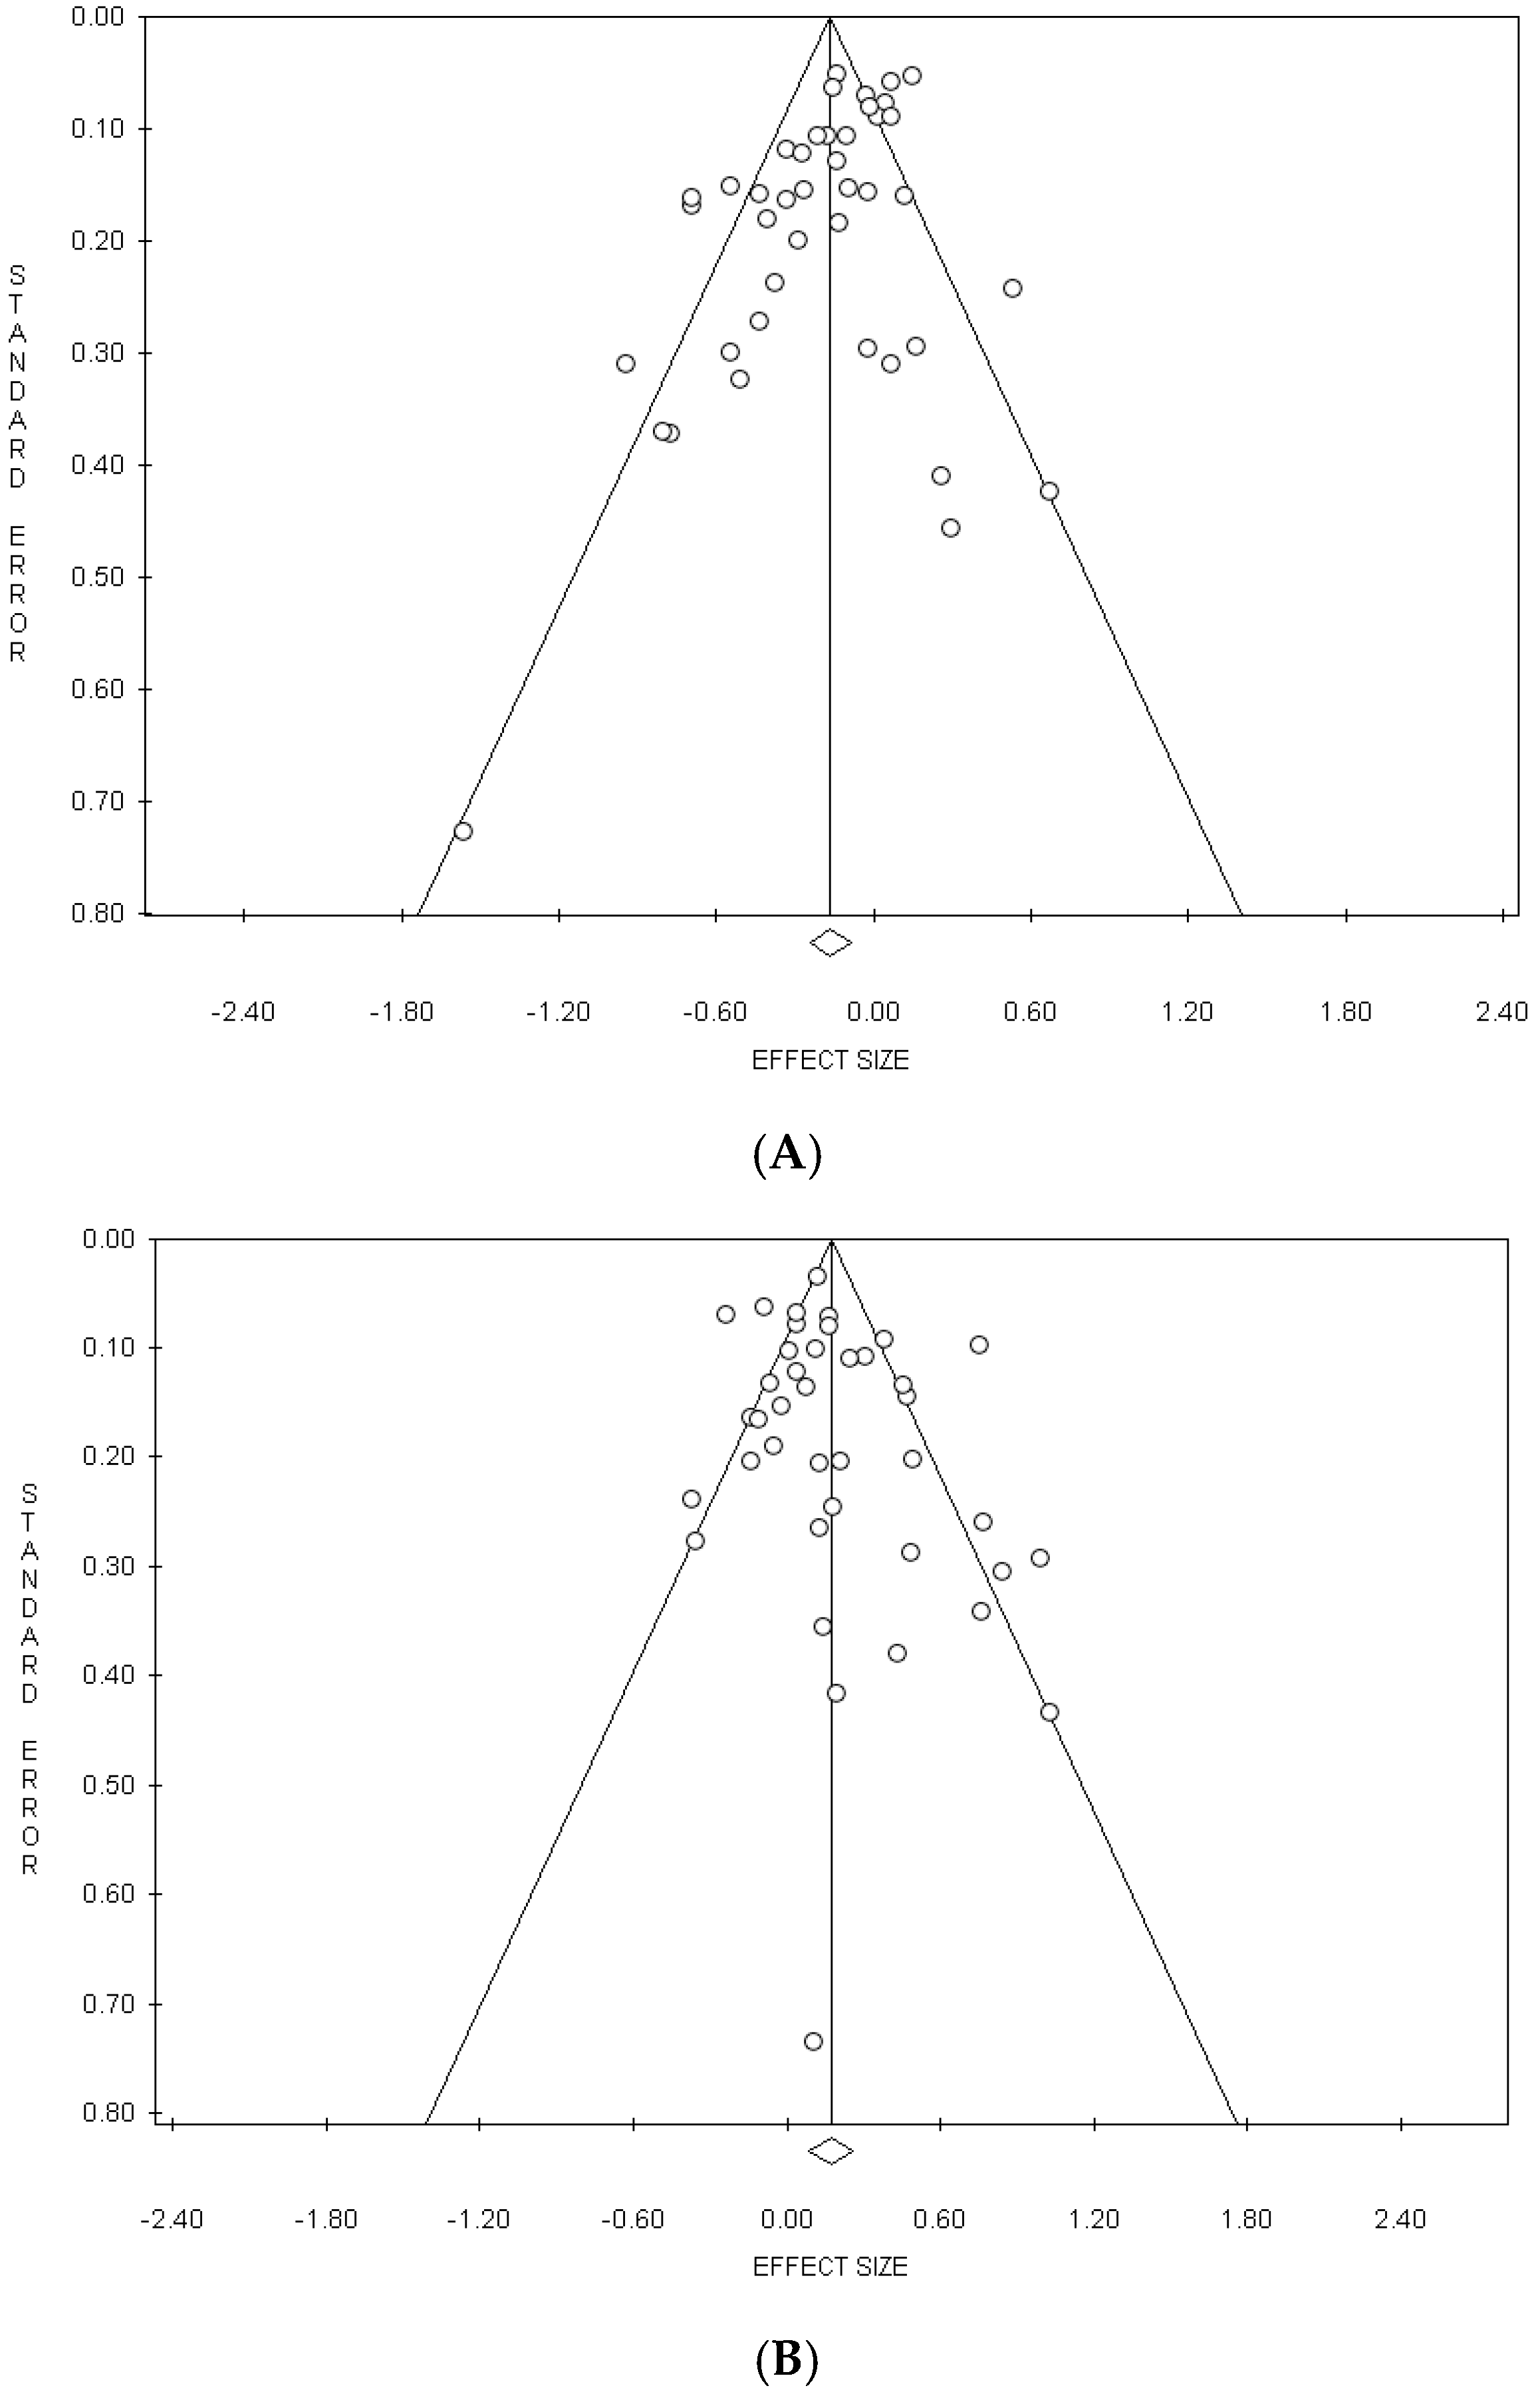
| All (n = 42) c | 0.85 (0.79–0.91) | <0.0001 | 132.11 | 68.97 | <0.0001 | 0.005 | 0.074 |
| Excluding: Bell [27], Arisawa [33] and Panagiotakos [52] (n = 39) d | 0.84 (0.77–0.91) | <0.0001 | 110.23 | 65.53 | <0.0001 | 0.011 | 0.088 |
| Study design | |||||||
| Cohort studies (n = 3) | 0.76 (0.50–1.15) | 0.195 | 21.58 | 90.73 | <0.0001 | 0.081 | 0.117 |
| Cross-sectional studies (n = 39) | 0.86 (0.79–0.92) | <0.0001 | 110.22 | 65.52 | <0.0001 | 0.016 | 0.097 |
| Geographic location | |||||||
| Eastern countries (n = 28) | 0.78 (0.71–0.86) | <0.0001 | 63.57 | 57.53 | <0.0001 | 0.098 | 0.343 |
| Western countries (n = 14) | 0.97 (0.88–1.07) | 0.557 | 39.61 | 67.18 | 0.0002 | 0.255 | 0.208 |
| Geographic area | |||||||
| Asia (n = 27) | 0.77 (0.70–0.85) | <0.0001 | 57.22 | 54.56 | 0.0003 | 0.215 | 0.466 |
| Europe (n = 6) | 0.92 (0.81–1.04) | 0.188 | 10.70 | 53.27 | 0.058 | 0.952 | 0.851 |
| America (n = 7) | 0.98 (0.84–1.15) | 0.806 | 15.43 | 61.12 | 0.017 | 0.272 | 0.099 |
| Sex | |||||||
| Women (n = 8) | 0.74 (0.59–0.92) | 0.007 | 22.95 | 69.50 | 0.002 | 0.422 | 0.322 |
| Men (n = 5) | 0.85 (0.73–0.99) | 0.032 | 2.81 | 0.00 | 0.589 | 0.831 | 1.000 |
| “Meat/Western” | |||||||
| All (n = 40) | 1.19 (1.09–1.29) | <0.0001 | 158.62 | 75.41 | <0.0001 | 0.121 | 0.155 |
| Excluding: Bell [27], Arisawa [33] and Panagiotakos [52] (n = 37) d | 1.21 (1.10–1.34) | <0.0001 | 146.92 | 75.50 | <0.0001 | 0.151 | 0.209 |
| Study design | |||||||
| Cohort studies (n = 4) | 1.24 (1.08–1.41) | 0.002 | 4.99 | 39.84 | 0.173 | 0.911 | 1.000 |
| Cross-sectional studies (n = 36) | 1.18 (1.08–1.30) | 0.0004 | 149.62 | 76.61 | <0.0001 | 0.119 | 0.120 |
| Geographic location | |||||||
| Eastern countries (n = 26) | 1.17 (1.05–1.32) | 0.006 | 77.75 | 67.85 | <0.0001 | 0.021 | 0.193 |
| Western countries (n = 14) | 1.21 (1.06–1.38) | 0.004 | 77.65 | 83.26 | <0.0001 | 0.471 | 0.477 |
| Geographic area | |||||||
| Asia (n = 25) | 1.20 (1.08–1.33) | 0.001 | 53.66 | 55.28 | 0.0005 | 0.100 | 0.112 |
| Europe (n = 7) | 1.15 (1.03–1.31) | 0.014 | 14.88 | 59.68 | 0.021 | 0.682 | 0.881 |
| America (n = 6) | 1.33 (1.00–1.77) | 0.047 | 39.30 | 87.28 | <0.0001 | 0.970 | 0.348 |
| Gender | |||||||
| Women (n = 7) | 1.01 (0.82–1.23) | 0.945 | 13.47 | 55.47 | 0.036 | 0.481 | 0.293 |
| Men (n = 4) | 1.21 (0.89–1.65) | 0.226 | 6.96 | 56.91 | 0.073 | 0.163 | 0.042 |
© 2019 by the authors. Licensee MDPI, Basel, Switzerland. This article is an open access article distributed under the terms and conditions of the Creative Commons Attribution (CC BY) license (http://creativecommons.org/licenses/by/4.0/).
Share and Cite
Fabiani, R.; Naldini, G.; Chiavarini, M. Dietary Patterns and Metabolic Syndrome in Adult Subjects: A Systematic Review and Meta-Analysis. Nutrients 2019, 11, 2056. https://doi.org/10.3390/nu11092056
Fabiani R, Naldini G, Chiavarini M. Dietary Patterns and Metabolic Syndrome in Adult Subjects: A Systematic Review and Meta-Analysis. Nutrients. 2019; 11(9):2056. https://doi.org/10.3390/nu11092056
Chicago/Turabian StyleFabiani, Roberto, Giulia Naldini, and Manuela Chiavarini. 2019. "Dietary Patterns and Metabolic Syndrome in Adult Subjects: A Systematic Review and Meta-Analysis" Nutrients 11, no. 9: 2056. https://doi.org/10.3390/nu11092056
APA StyleFabiani, R., Naldini, G., & Chiavarini, M. (2019). Dietary Patterns and Metabolic Syndrome in Adult Subjects: A Systematic Review and Meta-Analysis. Nutrients, 11(9), 2056. https://doi.org/10.3390/nu11092056