No Difference in Lactoferrin Levels between Metabolically Healthy and Unhealthy Obese Women


 ,
, 
Abstract
1. Introduction
2. Materials and Methods
2.1. Study Population
2.2. Sample Size Calculation
2.3. Anthropometry Parameters
2.4. Body Composition
2.5. Blood Pressure
2.6. Blood Collection
2.7. Biochemical Measurements
2.8. Statistical Analysis
3. Results
3.1. Study Cohort
3.2. Association between Lactoferrin Levels and Metabolic Parameters
4. Discussion
5. Conclusions
Supplementary Materials
Author Contributions
Funding
Acknowledgments
Conflicts of Interest
References
- World Health Organization. Obesity and Overweight. Available online: http://www.who.int/news-room/fact-sheets/detail/obesity-and-overweight (accessed on 9 July 2019).
- Messier, V.; Karelis, A.D.; Prud’Homme, D.; Primeau, V.; Brochu, M.; Rabasa-Lhoret, R. Identifying Metabolically Healthy but Obese Individuals in Sedentary Postmenopausal Women. Obesity 2009, 18, 911–917. [Google Scholar] [CrossRef] [PubMed]
- Velho, S.; Paccaud, F.; Waeber, G.; Vollenweider, P.; Marques-Vidal, P. Metabolically healthy obesity: Different prevalences using different criteria. Eur. J. Clin. Nutr. 2010, 64, 1043–1051. [Google Scholar] [CrossRef] [PubMed]
- Ward, P.P.; Paz, E.; Conneely, O.M. Multifunctional roles of lactoferrin: A critical overview. Cell. Mol. Life Sci. 2005, 62, 2540–2548. [Google Scholar] [CrossRef] [PubMed]
- Morishita, S.; Kawaguchi, H.; Ono, T.; Miura, N.; Murakoshi, M.; Sugiyama, K.; Kato, H.; Tanimoto, A.; Nishino, H. Enteric lactoferrin attenuates the development of high-fat and high-cholesterol diet-induced hypercholesterolemia and atherosclerosis in Microminipigs. Biosci. Biotechnol. Biochem. 2016, 80, 295–303. [Google Scholar] [CrossRef] [PubMed]
- Nakamura, K.; Morishita, S.; Ono, T.; Murakoshi, M.; Sugiyama, K.; Ikeda, I.; Kato, H.; Nishino, H. Lactoferrin interacts with bile acids and increases fecal cholesterol excretion in rats. Biochem. Cell Boil. 2017, 95, 142–147. [Google Scholar] [CrossRef] [PubMed]
- Takeuchi, T.; Shimizu, H.; Ando, K.; Harada, E. Bovine lactoferrin reduces plasma triacylglycerol and NEFA accompanied by decreased hepatic cholesterol and triacylglycerol contents in rodents. Br. J. Nutr. 2004, 91, 533–538. [Google Scholar] [CrossRef] [PubMed]
- Moreno-Navarrete, J.M.; Ortega, F.J.; Bassols, J.; Castro, A.; Ricart, W.; Fernández-Real, J.M. Association of Circulating Lactoferrin Concentration and 2 Nonsynonymous LTF Gene Polymorphisms with Dyslipidemia in Men Depends on Glucose-Tolerance Status. Clin. Chem. 2008, 54, 301–309. [Google Scholar] [CrossRef]
- Moreno-Navarrete, J.M.; Ortega, F.J.; Bassols, J.; Ricart, W.; Fernández-Real, J.M. Decreased Circulating Lactoferrin in Insulin Resistance and Altered Glucose Tolerance as a Possible Marker of Neutrophil Dysfunction in Type 2 Diabetes. J. Clin. Endocrinol. Metab. 2009, 94, 4036–4044. [Google Scholar] [CrossRef]
- Legrand, D. Lactoferrin, a key molecule in immune and inflammatory processes. Biochem. Cell Biol. 2012, 90, 252–268. [Google Scholar] [CrossRef]
- Kruzel, M.L.; Harari, Y.; Chen, C.Y.; Castro, G.A. The gut. A key metabolic organ protected by lactoferrin during experimental systemic inflammation in mice. Single Mol. Single Cell Seq. 1998, 443, 167–173. [Google Scholar]
- Moreno-Navarrete, J.M.; Ortega, F.J.; Moreno, M.; Serrano, M.; Ricart, W.; Fernández-Real, J.M. Lactoferrin gene knockdown leads to similar effects to iron chelation in human adipocytes. J. Cell. Mol. Med. 2014, 18, 391–395. [Google Scholar] [CrossRef] [PubMed]
- Moreno-Navarrete, J.M.; Ortega, F.J.; Ricart, W.; Fernández-Real, J.M. Lactoferrin increases 172ThrAMPK phosphorylation and insulin-induced p473SerAKT while impairing adipocyte differentiation. Int. J. Obes. 2009, 33, 991–1000. [Google Scholar] [CrossRef] [PubMed]
- Fernández-Musoles, R.; Castelló-Ruiz, M.; Arce, C.; Manzanares, P.; Ivorra, M.D.; Salom, J.B. Antihypertensive mechanism of lactoferrin-derived peptides: Angiotensin receptor blocking effect. J. Agric. Food Chem. 2014, 62, 173–181. [Google Scholar] [CrossRef] [PubMed]
- Kim, J.Y.; Campbell, L.E.; Shaibi, G.Q.; Coletta, D.K. Gene expression profiling and association of circulating lactoferrin level with obesity-related phenotypes in Latino youth. Pediatr. Obes. 2015, 10, 338–344. [Google Scholar] [CrossRef] [PubMed]
- Bennett, R.M.; Mohla, C. A solid-phase radioimmunoassay for the measurement of lactoferrin in human plasma: Variations with age, sex, and disease. J. Lab. Clin. Med. 1976, 88, 156–166. [Google Scholar] [PubMed]
- Expert Panel on Detection, Evaluation, and Treatment of High Blood Cholesterol in Adults. Executive Summary of the Third Report of the National Cholesterol Education Program (NCEP) Expert Panel on Detection, Evaluation, and Treatment of High Blood Cholesterol in Adults (Adult Treatment Panel III). JAMA 2001, 285, 2486–2497. [Google Scholar] [CrossRef] [PubMed]
- Mayeur, S.; Veilleux, A.; Pouliot, Y.; Lamarche, B.; Beaulieu, J.-F.; Hould, F.S.; Richard, D.; Tchernof, A.; Levy, E. Plasma Lactoferrin Levels Positively Correlate with Insulin Resistance despite an Inverse Association with Total Adiposity in Lean and Severely Obese Patients. PLoS ONE 2016, 11, e0166138. [Google Scholar] [CrossRef] [PubMed]
- World Health Organization. Global Database on Body Mass Index. Available online: http://apps.who.int/bmi/index.jsp?introPage=intro_3.html (accessed on 9 July 2019).
- Seger, J.C.; Horn, D.B.; Westman, E.C.; Lindquist, R.; Scinta, W.; Richardson, L.A.; Primack, C.; Bryman, D.A.; McCarthy, W.; Hendricks, E.; et al. American Society of Bariatric Physicians Obesity Algorithm: Adult Adiposity Evaluation and Treatment 2013. Available online: www.obesityalgorithm.org (accessed on 9 July 2019).
- Parati, G.; Stergiou, G.S.; Asmar, R.; Bilo, G.; de Leeuw, P.; Imai, Y.; Kario, K.; Lurbe, E.; Manolis, A.; Mengden, T.; et al. European Society of Hypertension guidelines for blood pressure monitoring at home: A summary report of the Second International Consensus Conference on Home Blood Pressure Monitoring. J. Hypertens. 2008, 26, 1505–1526. [Google Scholar] [CrossRef]
- Matthews, D.R.; Hosker, J.P.; Rudenski, A.S.; Naylor, B.A.; Treacher, D.F.; Turner, R.C. Homeostasis model assessment: Insulin resistance and beta-cell function from fasting plasma glucose and insulin concentrations in man. Diabetologia 1985, 28, 412–419. [Google Scholar] [CrossRef]
- Gayoso-Diz, P.; Otero-González, A.; Rodriguez-Alvarez, M.X.; Gude, F.; García, F.; De Francisco, A.; Quintela, A.G. Insulin resistance (HOMA-IR) cutoff values and the metabolic syndrome in a general adult population: Effect of gender and age: EPIRCE cross-sectional study. BMC Endocr. Disord. 2013, 13, 47. [Google Scholar] [CrossRef]
- Moreno-Navarrete, J.M.; Serrano, M.; Sabater, M.; Ortega, F.; Serino, M.; Pueyo, N.; Luche, E.; Waget, A.; Rodriguez-Hermosa, J.I.; Ricart, W.; et al. Study of lactoferrin gene expression in human and mouse adipose tissue, human preadipocytes and mouse 3T3-L1 fibroblasts. Association with adipogenic and inflammatory markers. J. Nutr. Biochem. 2013, 24, 1266–1275. [Google Scholar] [CrossRef] [PubMed]
- Fernández-Real, J.M.; García-Fuentes, E.; Moreno-Navarrete, J.M.; Murri-Pierri, M.; Garrido-Sánchez, L.; Ricart, W.; Tinahones, F. Fat overload induces changes in circulating lactoferrin that are associated with postprandial lipemia and oxidative stress in severely obese subjects. Obesity 2010, 18, 482–488. [Google Scholar] [CrossRef] [PubMed]
- Marcil, V.; Mayeur, S.; Lamarche, B.; England, J.; Henderson, M.; Delvin, E.; Amre, D.; Levy, E. Cardiometabolic risk factors and lactoferrin: Polymorphisms and plasma levels in French-Canadian children. Pediatr. Res. 2017, 82, 741–748. [Google Scholar] [CrossRef] [PubMed]
- Maekawa, Y.; Sugiyama, A.; Takeuchi, T. Lactoferrin potentially facilitates glucose regulation and enhances the incretin effect. Biochem. Cell Boil. 2017, 95, 155–161. [Google Scholar] [CrossRef] [PubMed]
- Takeuchi, T.; Kitagawa, H.; Harada, E. Evidence of lactoferrin transportation into blood circulation from intestine via lymphatic pathway in adult rats. Exp. Physiol. 2004, 89, 263–270. [Google Scholar] [CrossRef] [PubMed]
- Troost, F.J.; Steijns, J.; Saris, W.H.M.; Brummer, R.-J.M. Gastric Digestion of Bovine Lactoferrin in vivo in Adults. J. Nutr. 2001, 131, 2101–2104. [Google Scholar] [CrossRef] [PubMed]
- Delgado-Lista, J.; Perez-Martinez, P.; Solivera, J.; Garcia-Rios, A.; Perez-Caballero, A.I.; Lovegrove, J.A.; Drevon, C.A.; Defoort, C.; Blaak, E.E.; Dembinska-Kiec, A.; et al. Top Single Nucleotide Polymorphisms Affecting Carbohydrate Metabolism in Metabolic Syndrome: From the LIPGENE Study. J. Clin. Endocrinol. Metab. 2014, 99, E384–E389. [Google Scholar] [CrossRef] [PubMed]
- Yousuf, O.; Mohanty, B.D.; Martin, S.S.; Joshi, P.H.; Blaha, M.J.; Nasir, K.; Blumenthal, R.S.; Budoff, M.J. High-Sensitivity C-Reactive Protein and Cardiovascular Disease. J. Am. Coll. Cardiol. 2013, 62, 397–408. [Google Scholar] [CrossRef] [PubMed]
- Siqueiros-Cendón, T.; Arévalo-Gallegos, S.; Iglesias-Figueroa, B.F.; García-Montoya, I.A.; Salazar-Martínez, J.; Rascón-Cruz, Q. Immunomodulatory effects of lactoferrin. Acta Pharmacol. Sin. 2014, 35, 557–566. [Google Scholar] [CrossRef]
- Vengen, I.T.; Dale, A.C.; Wiseth, R.; Midthjell, K.; Videm, V. Lactoferrin is a novel predictor of fatal ischemic heart disease in diabetes mellitus type 2: Long-term follow-up of the HUNT 1 study. Atherosclerosis 2010, 212, 614–620. [Google Scholar] [CrossRef]
- Adeyemi, E.O.; Hodgson, H.J. Augmented release of human leucocyte lactoferrin (and elastase) during coagulation. J. Clin. Lab. Immunol. 1988, 27, 1–4. [Google Scholar] [PubMed]

| Median (IQR) | |
|---|---|
| Age (years) | 57 (52–62) |
| Height (cm) | 161 (157–165) |
| Weight (kg) | 90.4 (82.4–101.6) |
| BMI (kg/m2) | 35.16 (31.83–38.14) |
| Waist circumference (cm) | 108 (103–115) |
| FM (g) | 38151 (32,091–44,026) |
| FM (%) | 43.1 (38.9–47.0) |
| VAT mass (g) | 1065 (883–1274) |
| SBP (mmHg) | 138 (129–149) |
| DPB (mmHg) | 85 (79–90) |
| Glucose (mg/dL) | 97 (90–106) |
| Insulin (µU/mL) | 13.05 (8.80–17.70) |
| HOMA-IR | 3.00 (2.12–4.35) |
| TC (mg/dL) | 219 (186–246) |
| LDL-C (mg/dL) | 134 (107–160) |
| HDL-C (mg/dL) | 54 (45–62) |
| TG (mg/dL) | 135 (101–178) |
| hs-CRP (mg/L) | 3.10 (1.50–5.90) |
| Lactoferrin (ng/mL) | 1628 (1019–2374) |
| MHO (n = 101) | MUHO (n = 199) | p | |
|---|---|---|---|
| Age (years) | 57 (52–62) | 58 (52–63) | 0.4730 |
| Height (cm) | 161 (157–165) | 161 (157–166) | 0.5124 |
| Weight (kg) | 90.7 (82.0–100.7) | 90.4 (83.5–101.9) | 0.2934 |
| BMI (kg/m2) | 34.30 (31.90–37.40) | 35.36 (31.79–38.85) | 0.2126 |
| Waist circumference (cm) | 107 (99–113) | 109 (104–116) | 0.0112 |
| FM (g) | 37487 (31,697–43,868) | 38690 (32,586–44,620) | 0.2638 |
| FM (%) | 42.6 (38.9–47.2) | 43.5 (38.9–47.0) | 0.3945 |
| VAT mass (g) | 1035 (877–1230) | 1072 (887–1314) | 0.1998 |
| SBP (mmHg) | 131 (125–140) | 140 (131–152) | <0.0001 |
| DPB (mmHg) | 83 (78–88) | 85 (79–93) | 0.0539 |
| Glucose (mg/dL) | 93 (89–96) | 101 (92–109) | <0.0001 |
| Insulin (µU/mL) | 10.10 (7.10–14.60) | 14.20 (10.60–19.00) | <0.0001 |
| HOMA-IR | 2.35 (1.64–3.31) | 3.38 (2.49–5.10) | <0.0001 |
| TC (mg/dL) | 220 (184–244) | 219 (190–247) | 0.5621 |
| LDL-C (mg/dL) | 135 (99–158) | 133 (109–161) | 0.5156 |
| HDL-C (mg/dL) | 60 (56–71) | 48 (43–57) | <0.0001 |
| TG (mg/dL) | 106 (86–122) | 155 (120–199) | <0.0001 |
| hs-CRP (mg/L) | 2.85 (1.45–5.15) | 3.35 (1.60–6.35) | 0.2481 |
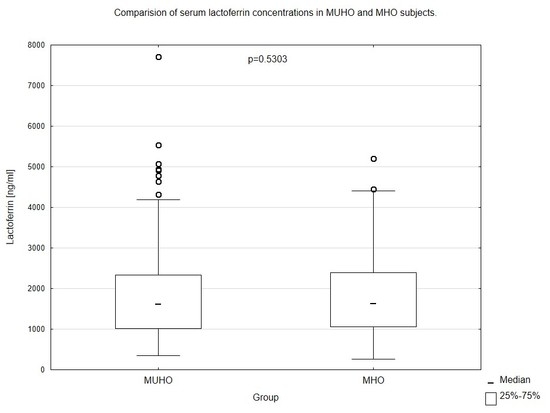
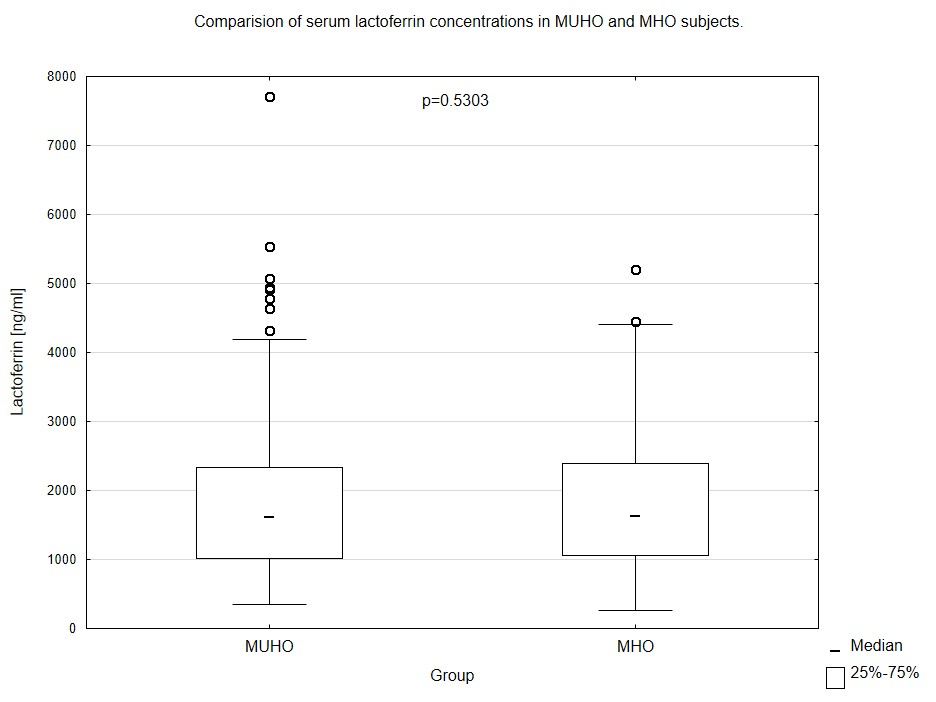
| Lactoferrin (ng/mL) | 1639 (1055–2396) | 1622 (1009–2335) | 0.5303 |
| Lactoferrin (ng/mL) adjusted for BMI and hs-CRP | 1790 (1667–1915) | 1809 (1653–1981) | 0.3440 |
| Lactoferrin (ng/mL) adjusted for waist circumference and hs-CRP | 1780 (1646–1954) | 1823 (1691–1981) | 0.0900 |
| Lactoferrin (ng/mL) adjusted for FM and hs-CRP | 1882 (1777–2006) | 1898 (1794–2009) | 0.4406 |
| Lactoferrin (ng/mL) adjusted for VAT mass and hs-CRP | 1815 (1725–1956) | 1867 (1739–2033) | 0.0944 |
| Total Population (n = 300) | MHO (n = 101) | MUHO (n = 199) | ||||
|---|---|---|---|---|---|---|
| r | p | r | p | r | p | |
| Age (years) | −0.058 | 0.3132 | −0.013 | 0.8981 | −0.081 | 0.2545 |
| Weight (kg) | 0.161 | 0.0052 | 0.231 | 0.0201 | 0.119 | 0.0931 |
| BMI (kg/m2) | 0.187 | 0.0011 | 0.286 | 0.0037 | 0.137 | 0.0529 |
| Waist circumference (cm) | 0.186 | 0.0012 | 0.258 | 0.0092 | 0.166 | 0.0191 |
| FM (g) | 0.121 | 0.0488 | 0.177 | 0.0911 | 0.095 | 0.2083 |
| FM (%) | 0.087 | 0.1565 | 0.133 | 0.2052 | 0.057 | 0.4523 |
| VAT mass (g) | 0.115 | 0.0550 | 0.246 | 0.0162 | 0.054 | 0.4668 |
| SBP (mmHg) | −0.018 | 0.7563 | −0.004 | 0.9654 | −0.010 | 0.8840 |
| DPB (mmHg) | −0.072 | 0.2142 | −0.005 | 0.9574 | −0.091 | 0.2015 |
| Glucose (mg/dL) | −0.108 | 0.0620 | −0.250 | 0.0115 | −0.079 | 0.2640 |
| Insulin (µU/mL) | 0.131 | 0.0234 | 0.190 | 0.0573 | 0.132 | 0.0630 |
| HOMA-IR | 0.101 | 0.0806 | 0.168 | 0.0937 | 0.097 | 0.1724 |
| TC (mg/dL) | −0.039 | 0.5042 | −0.027 | 0.7889 | −0.047 | 0.5068 |
| LDL-C (mg/dL) | −0.028 | 0.6276 | 0.046 | 0.6443 | −0.065 | 0.3614 |
| HDL-C (mg/dL) | −0.046 | 0.4242 | −0.203 | 0.0411 | −0.027 | 0.7066 |
| TG (mg/dL) | 0.037 | 0.5244 | 0.047 | 0.6380 | 0.032 | 0.6477 |
| hs-CRP (mg/L) | 0.165 | 0.0045 | 0.184 | 0.0672 | 0.159 | 0.0262 |
| Total Population (n = 300) | MHO (n = 101) | MUHO (n = 199) | ||||||||||
|---|---|---|---|---|---|---|---|---|---|---|---|---|
| β | SE | t | p | β | SE | t | p | β | SE | t | p | |
| Age (years) | −0.065 | 0.058 | −1.133 | 0.2582 | −0.019 | 0.100 | −0.189 | 0.8503 | −0.083 | 0.071 | −1.176 | 0.2410 |
| BMI (kg/m2) | 0.197 | 0.057 | 3.465 | 0.0006 | 0.256 | 0.097 | 2.631 | 0.0098 | 0.174 | 0.070 | 2.482 | 0.0139 |
| Waist circumference (cm) | 0.187 | 0.057 | 3.287 | 0.0011 | 0.192 | 0.099 | 1.947 | 0.0544 | 0.193 | 0.070 | 2.755 | 0.0064 |
| Fat mass (%) | 0.103 | 0.061 | 1.680 | 0.0940 | 0.115 | 0.105 | 1.097 | 0.2757 | 0.098 | 0.076 | 1.291 | 0.1982 |
| VAT mass (g) | 0.138 | 0.059 | 2.318 | 0.0212 | 0.267 | 0.100 | 2.671 | 0.0089 | 0.088 | 0.074 | 1.194 | 0.2340 |
| SBP (mmHg) | −0.007 | 0.058 | −0.122 | 0.9031 | −0.053 | 0.100 | −0.528 | 0.5989 | 0.021 | 0.071 | 0.290 | 0.7722 |
| DPB (mmHg) | −0.051 | 0.058 | −0.882 | 0.3783 | −0.027 | 0.100 | −0.269 | 0.7887 | −0.059 | 0.071 | −0.834 | 0.4051 |
| Glucose (mg/dL) | −0.048 | 0.058 | −0.824 | 0.4105 | −0.124 | 0.100 | −1.249 | 0.2145 | −0.022 | 0.071 | −0.308 | 0.7585 |
| Insulin (µU/mL) | 0.081 | 0.058 | 1.399 | 0.1628 | 0.142 | 0.099 | 1.423 | 0.1577 | 0.072 | 0.071 | 1.017 | 0.3103 |
| HOMA-IR | 0.061 | 0.058 | 1.056 | 0.2917 | 0.116 | 0.100 | 1.165 | 0.2466 | 0.058 | 0.071 | 0.817 | 0.4151 |
| TC (mg/dL) | −0.052 | 0.058 | −0.902 | 0.3675 | −0.046 | 0.100 | −0.456 | 0.6491 | −0.053 | 0.071 | −0.748 | 0.4550 |
| LDL-C (mg/dL) | −0.057 | 0.058 | −0.989 | 0.3234 | 0.021 | 0.100 | 0.205 | 0.8380 | −0.090 | 0.071 | −1.269 | 0.2060 |
| HDL-C (mg/dL) | −0.089 | 0.058 | −1.550 | 0.1221 | −0.222 | 0.098 | −2.264 | 0.0257 | −0.065 | 0.071 | −0.918 | 0.3595 |
| TG (mg/dL) | 0.021 | 0.058 | 0.370 | 0.7119 | 0.001 | 0.100 | 0.011 | 0.9914 | 0.040 | 0.071 | 0.561 | 0.5752 |
| hs-CRP (mg/L) | 0.110 | 0.058 | 1.898 | 0.0586 | 0.088 | 0.101 | 0.880 | 0.3811 | 0.123 | 0.071 | 1.723 | 0.0864 |
| β | SE | t | p | |
|---|---|---|---|---|
| Total Population (n = 300) | ||||
| Model 1 | ||||
| BMI (kg/m2) | 0.188 | 0.062 | 3.019 | 0.0028 |
| hs-CRP (mg/L) | 0.036 | 0.062 | 0.572 | 0.5674 |
| Model 2 | ||||
| Waist circumference (cm) | 0.179 | 0.060 | 2.990 | 0.0030 |
| hs-CRP (mg/L) | 0.057 | 0.060 | 0.945 | 0.3453 |
| Model 3 | ||||
| Fat mass (%) | 0.115 | 0.061 | 1.873 | 0.0621 |
| hs-CRP (mg/L) | 0.129 | 0.061 | 2.113 | 0.0355 |
| Model 4 | ||||
| VAT mass (g) | 0.127 | 0.061 | 2.094 | 0.0371 |
| hs-CRP (mg/L) | 0.104 | 0.061 | 1.717 | 0.0871 |
© 2019 by the authors. Licensee MDPI, Basel, Switzerland. This article is an open access article distributed under the terms and conditions of the Creative Commons Attribution (CC BY) license (http://creativecommons.org/licenses/by/4.0/).
Share and Cite
Jamka, M.; Krzyżanowska-Jankowska, P.; Mądry, E.; Lisowska, A.; Bogdański, P.; Walkowiak, J. No Difference in Lactoferrin Levels between Metabolically Healthy and Unhealthy Obese Women. Nutrients 2019, 11, 1976. https://doi.org/10.3390/nu11091976
Jamka M, Krzyżanowska-Jankowska P, Mądry E, Lisowska A, Bogdański P, Walkowiak J. No Difference in Lactoferrin Levels between Metabolically Healthy and Unhealthy Obese Women. Nutrients. 2019; 11(9):1976. https://doi.org/10.3390/nu11091976
Chicago/Turabian StyleJamka, Małgorzata, Patrycja Krzyżanowska-Jankowska, Edyta Mądry, Aleksandra Lisowska, Paweł Bogdański, and Jarosław Walkowiak. 2019. "No Difference in Lactoferrin Levels between Metabolically Healthy and Unhealthy Obese Women" Nutrients 11, no. 9: 1976. https://doi.org/10.3390/nu11091976
APA StyleJamka, M., Krzyżanowska-Jankowska, P., Mądry, E., Lisowska, A., Bogdański, P., & Walkowiak, J. (2019). No Difference in Lactoferrin Levels between Metabolically Healthy and Unhealthy Obese Women. Nutrients, 11(9), 1976. https://doi.org/10.3390/nu11091976