Effects of Gelidium elegans on Weight and Fat Mass Reduction and Obesity Biomarkers in Overweight or Obese Adults: A Randomized Double-Blinded Study


Abstract
1. Introduction
2. Materials and Methods
2.1. Ethics
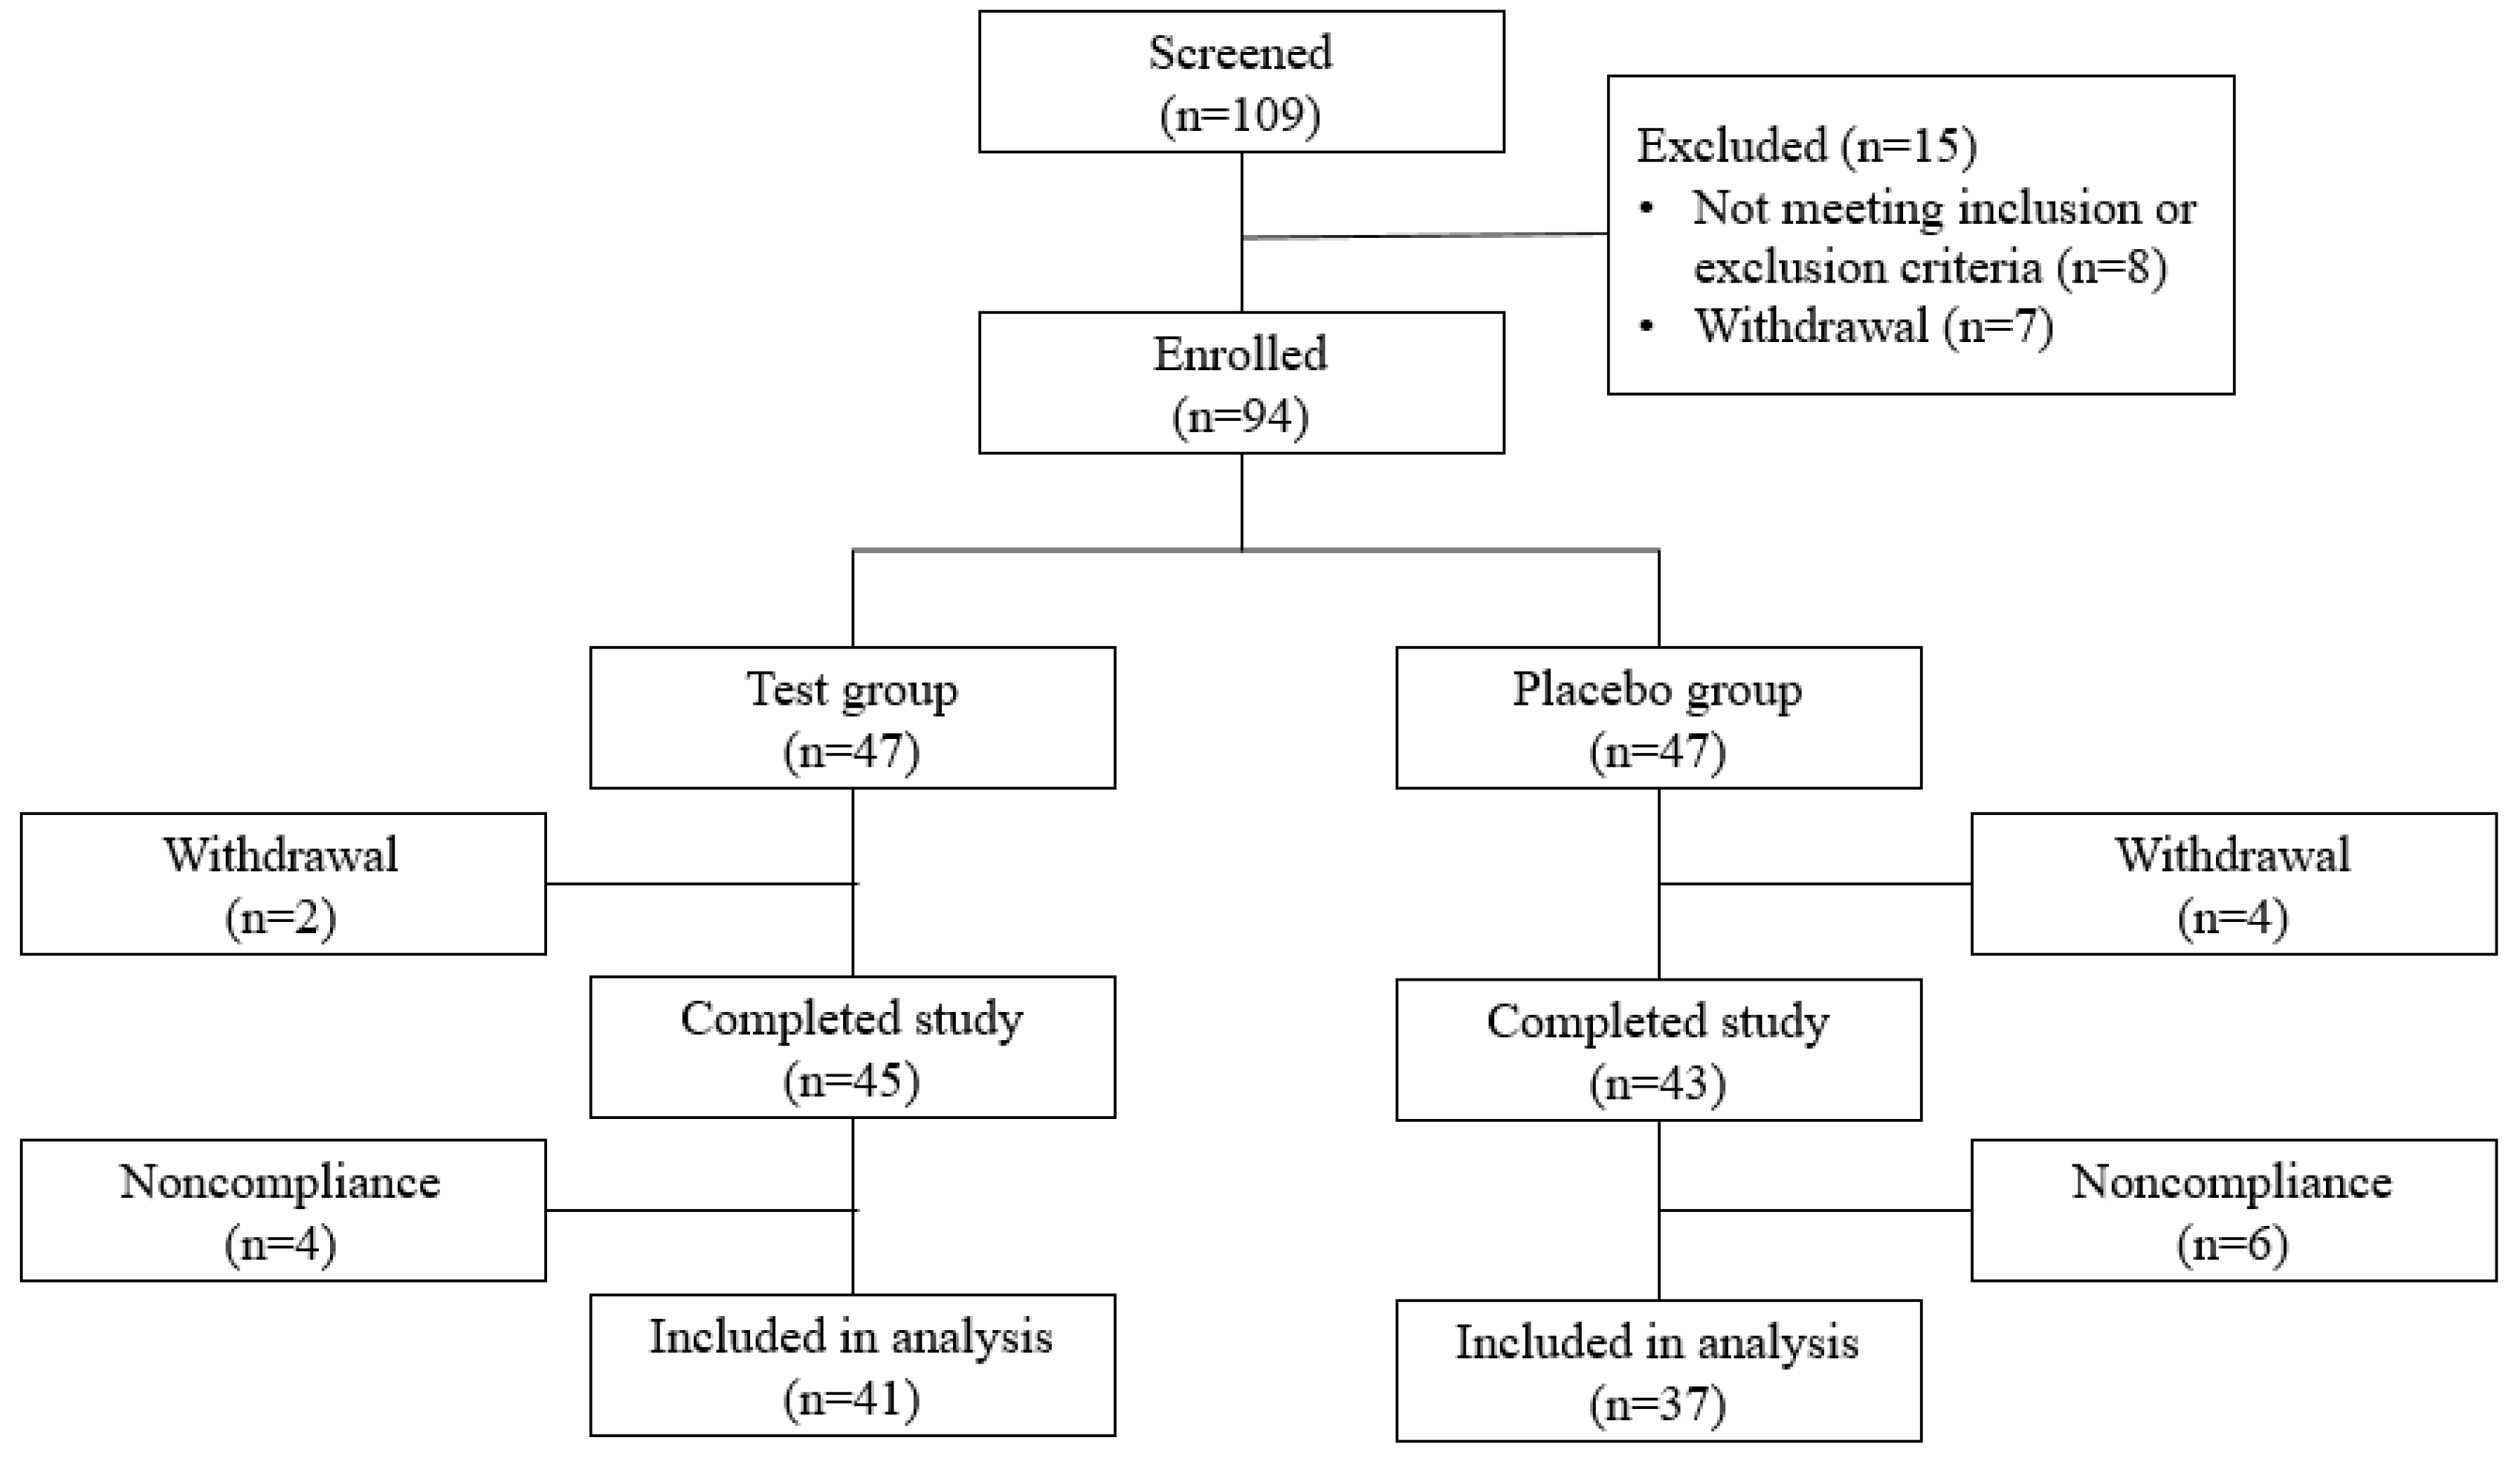
2.2. Participants
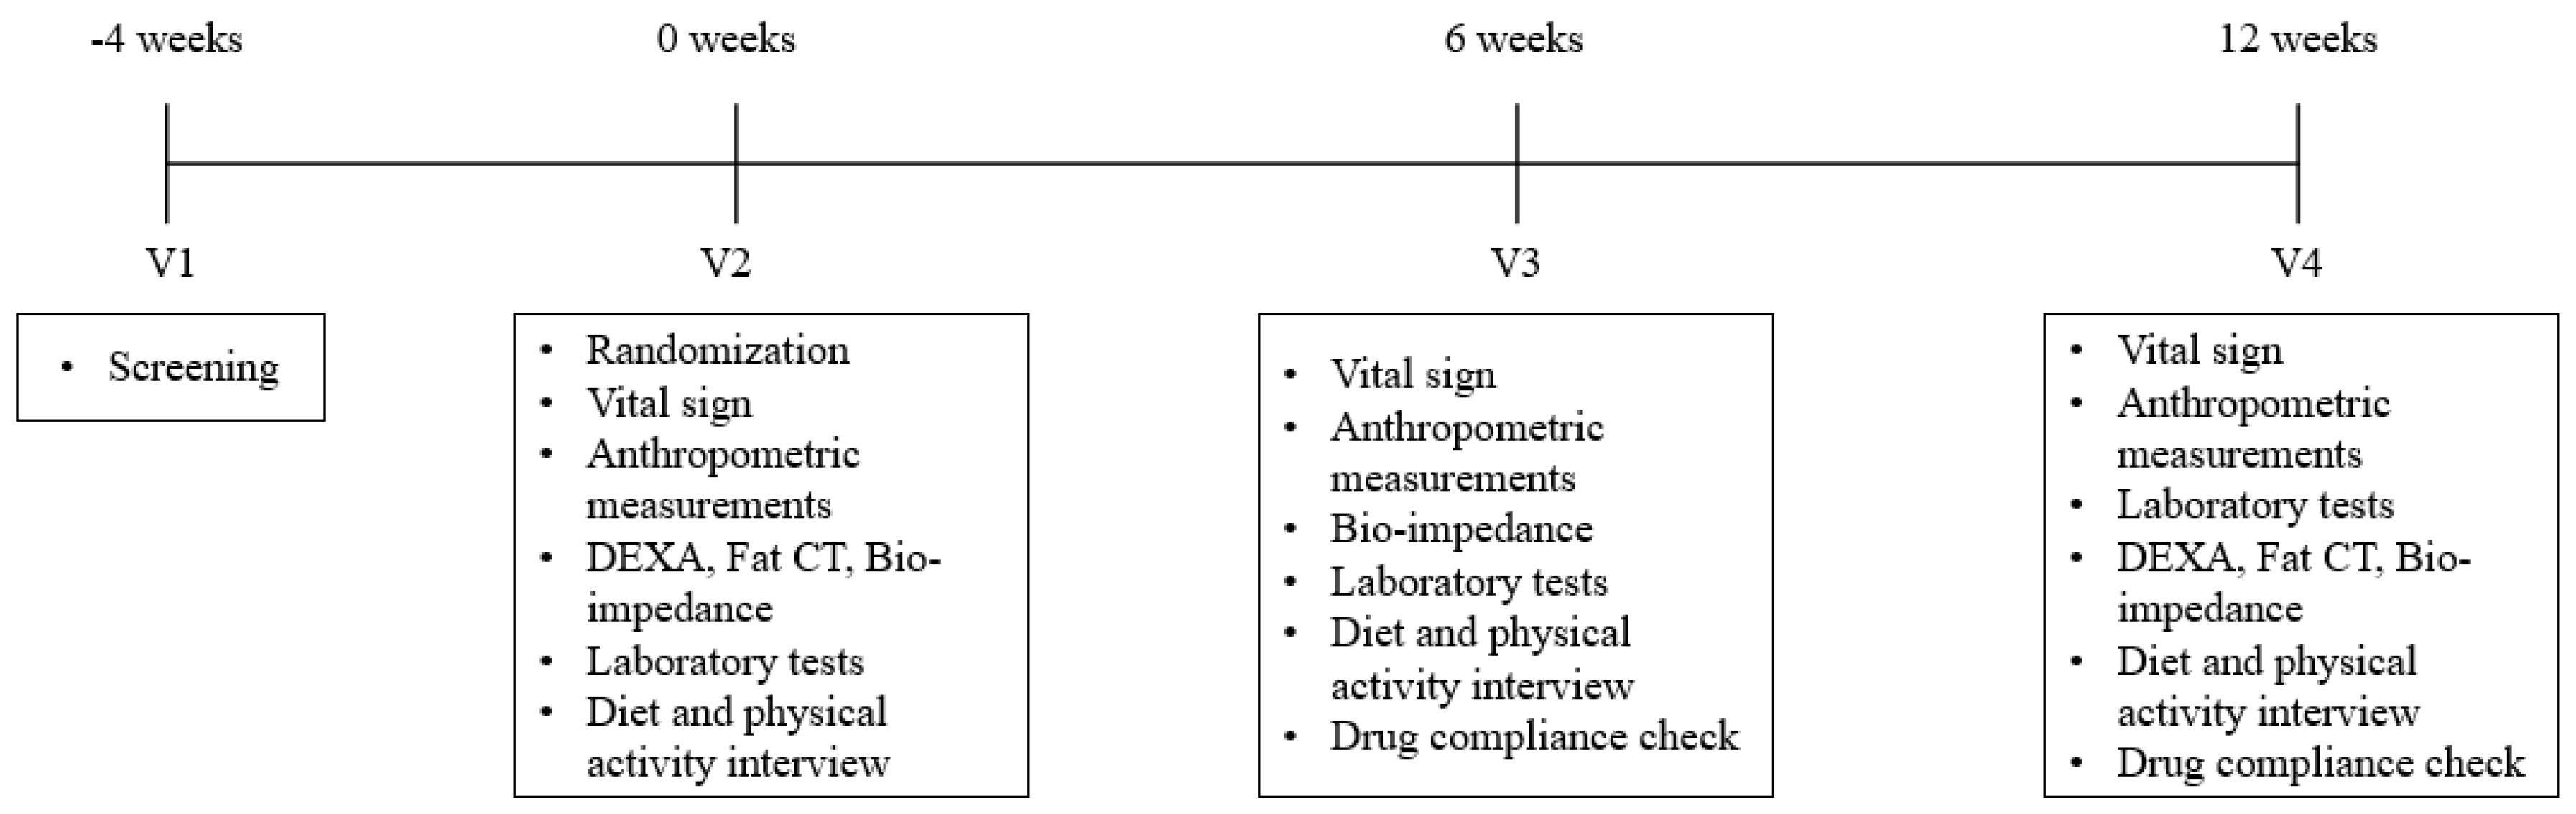
2.3. Study Design and Intervention
2.4. Anthropometric Measurement and Body Composition
2.5. Blood Collection and Analysis
2.6. Dietary and Physical Activity Assessment
2.7. Statistical Analysis
3. Results
3.1. Baseline Characteristics
3.2. Diet and Physical Activity
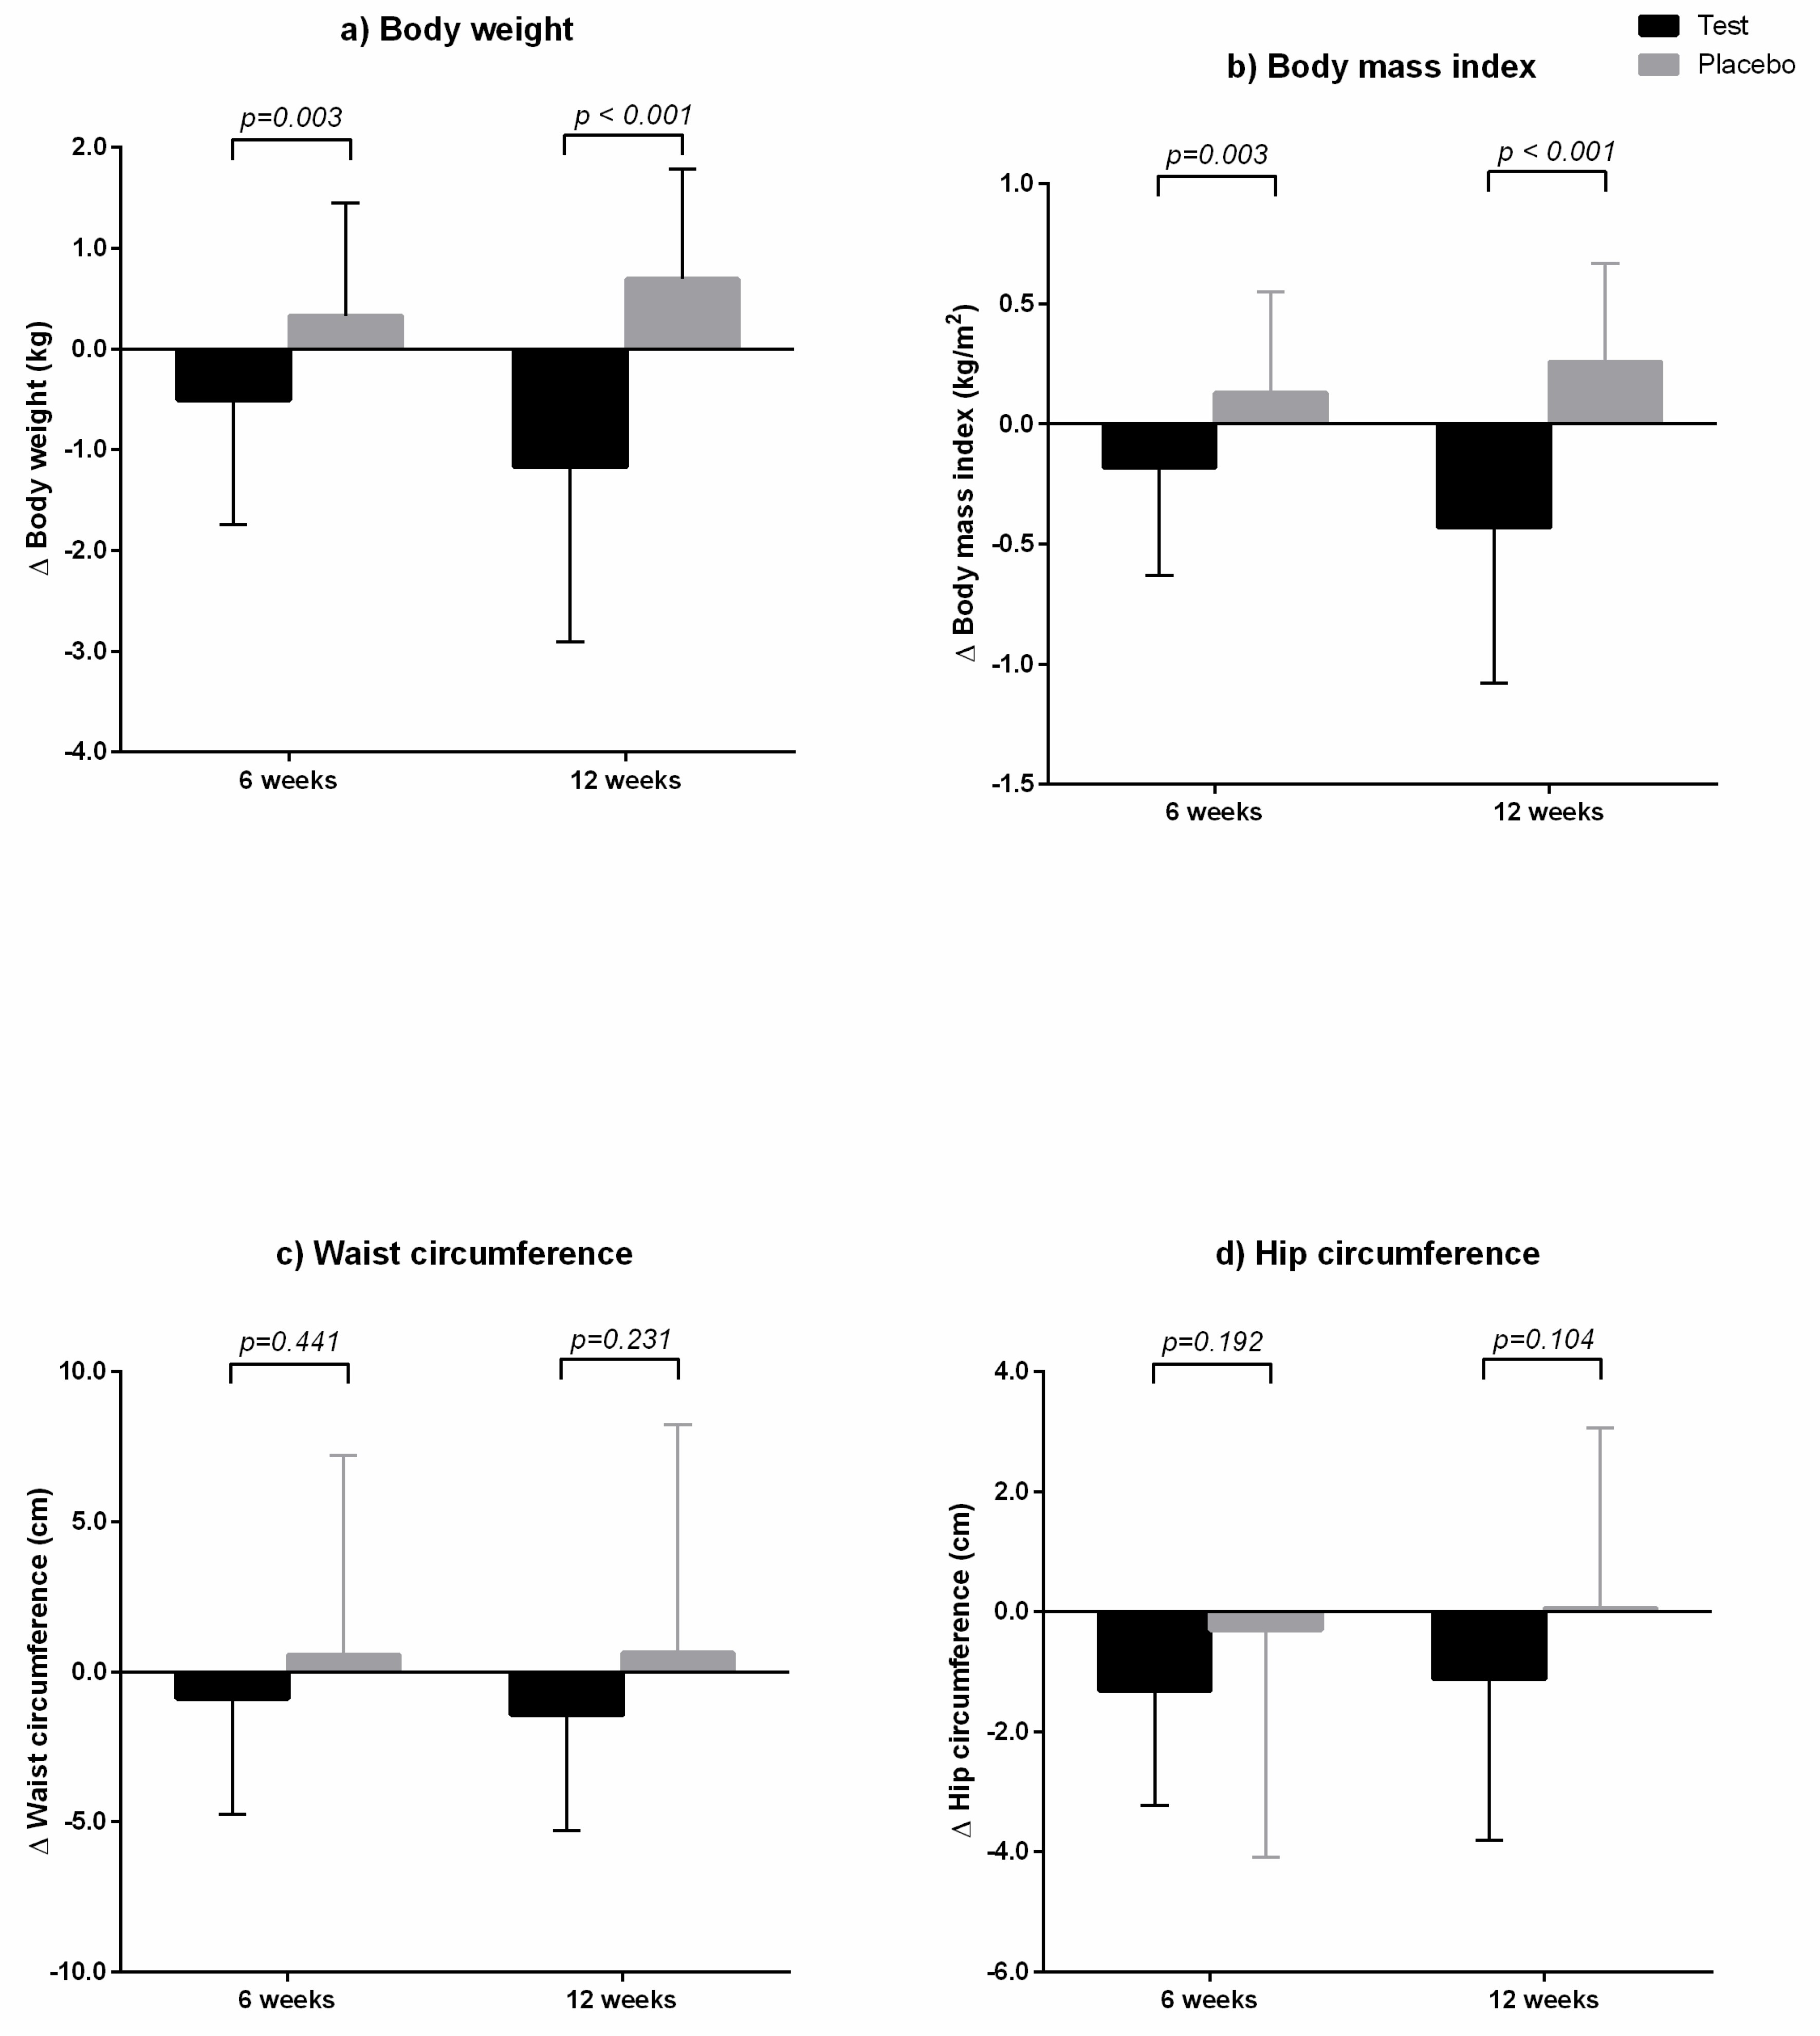
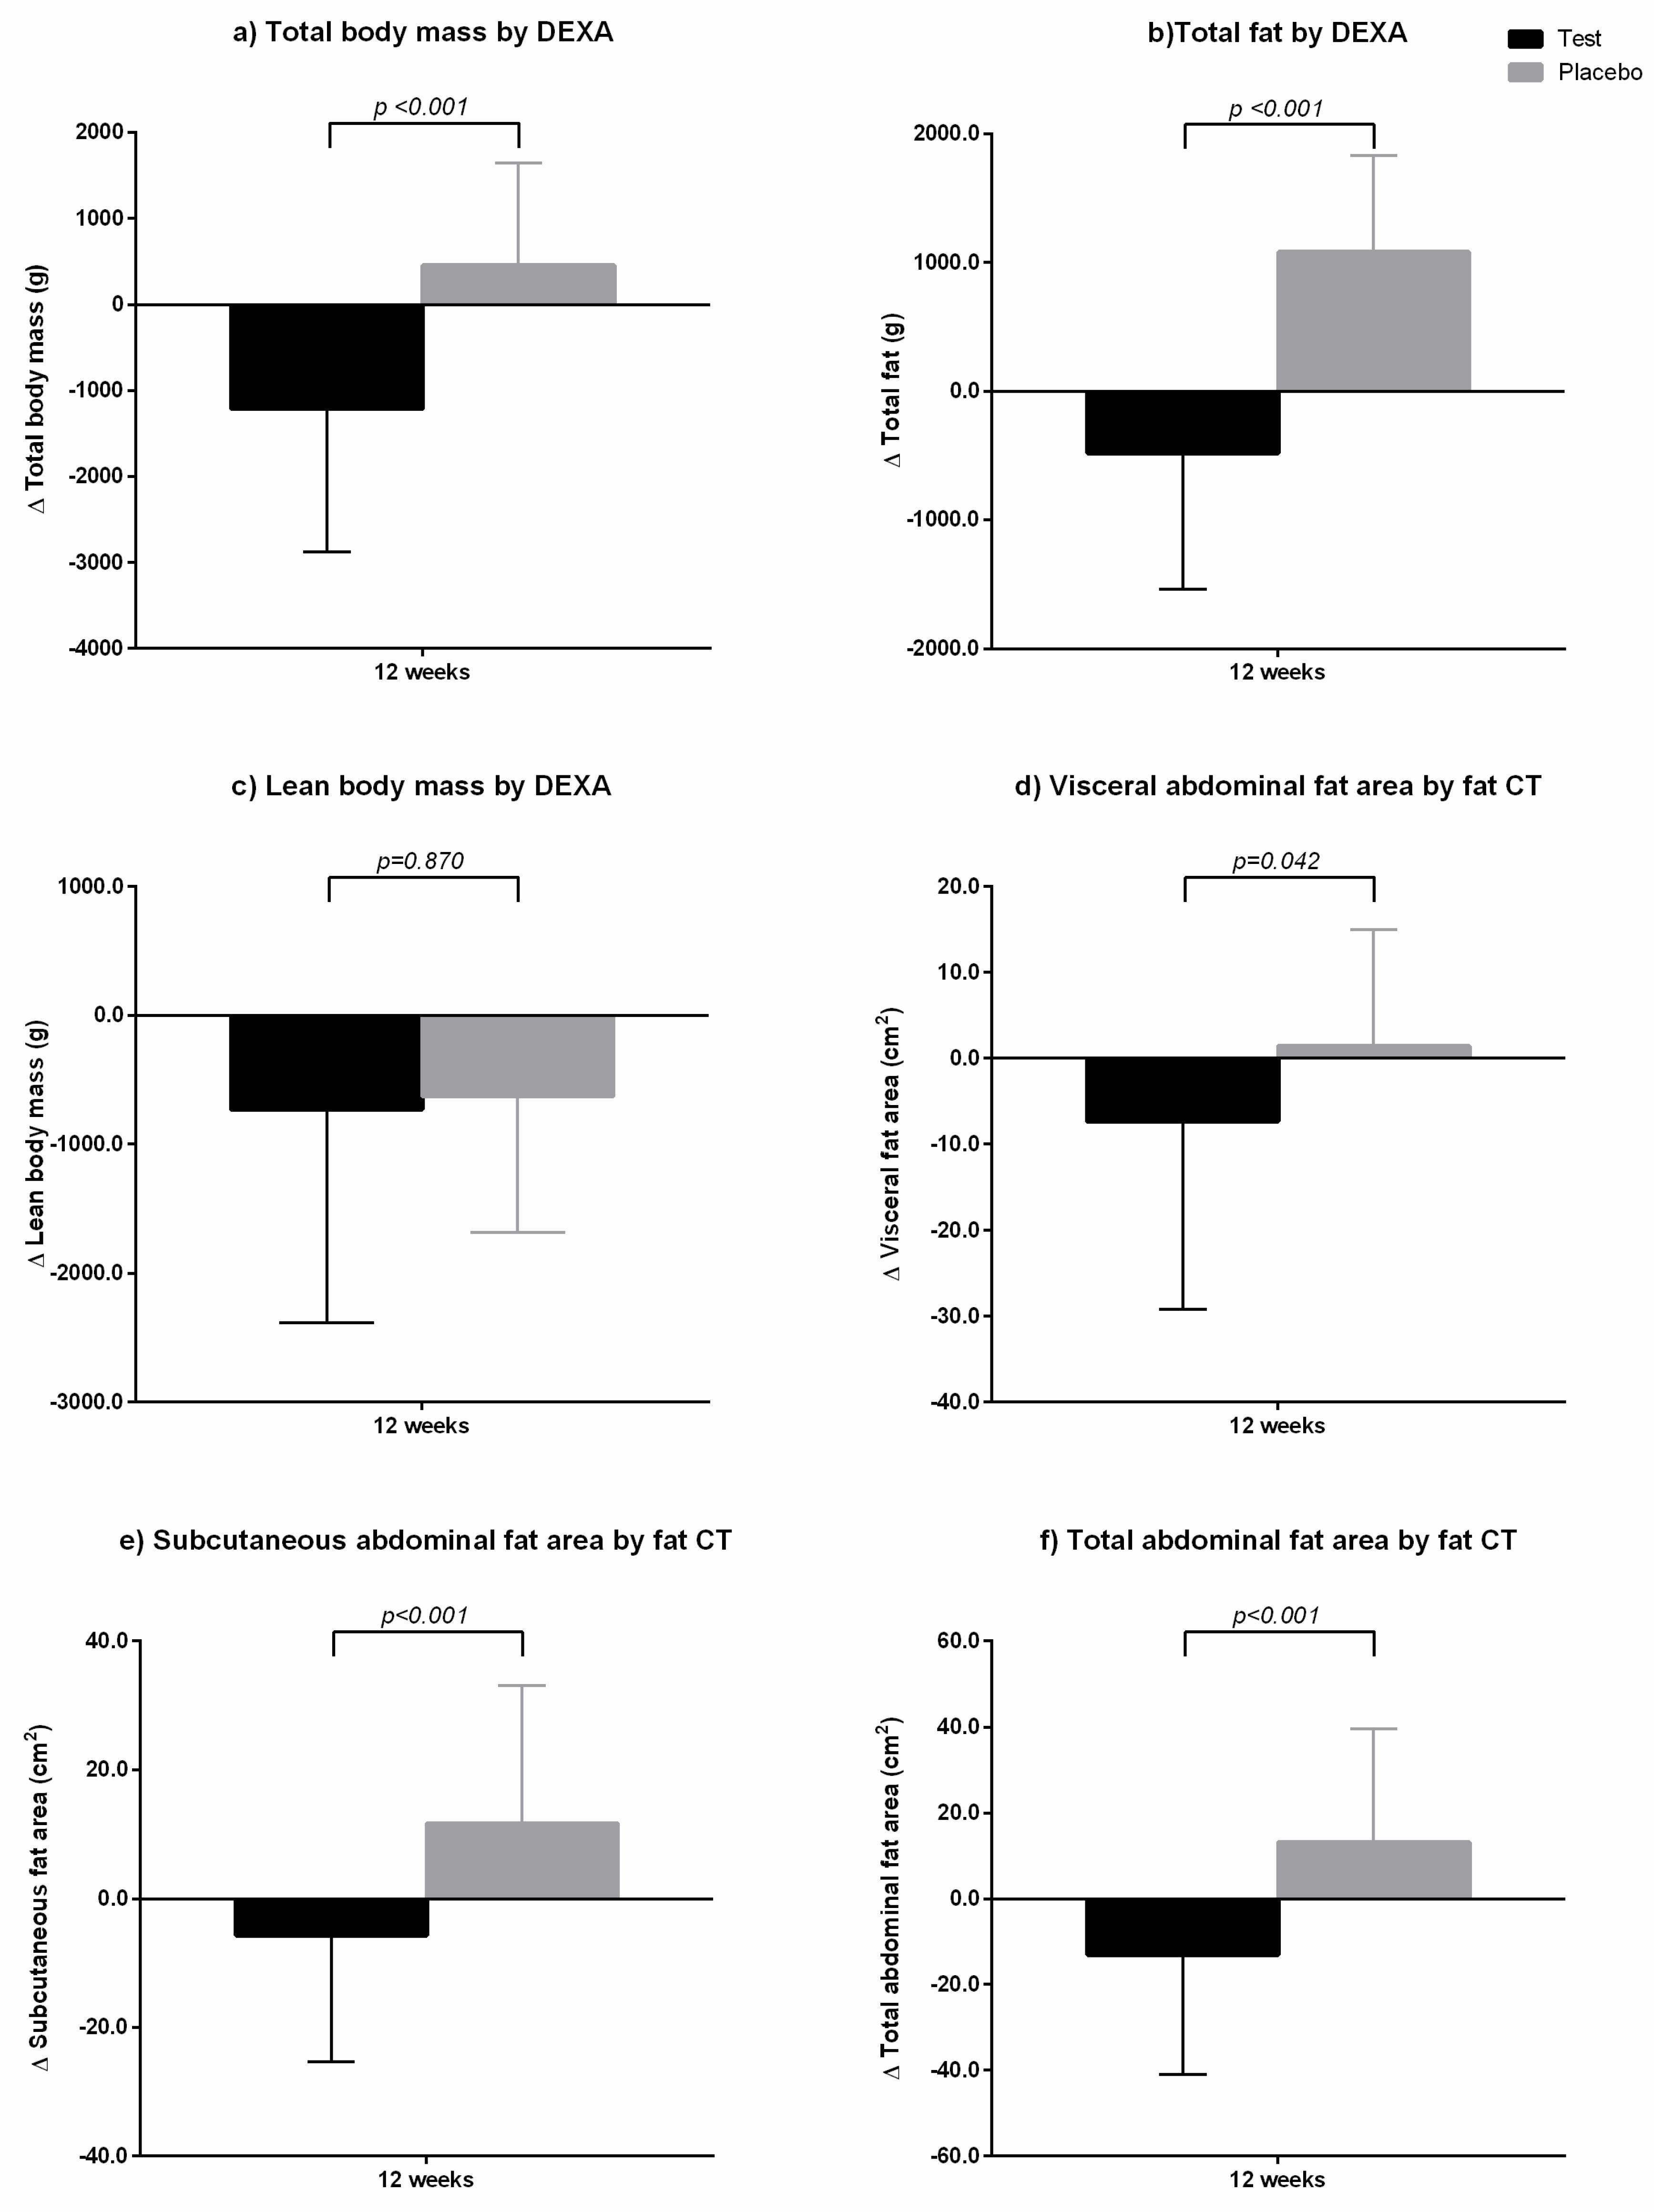
3.3. Anthropometrics and Body Composition
3.4. Laboratory Parameters
4. Discussion
5. Conclusions
Author Contributions
Funding
Conflicts of Interest
References
- Kelly, T.; Yang, W.; Chen, C.S.; Reynolds, K.; He, J. Global burden of obesity in 2005 and projections to 2030. Int. J. Obes. 2008, 32, 1431–1437. [Google Scholar] [CrossRef]
- Kopelman, P.G. Obesity as a medical problem. Nature 2000, 404, 635–643. [Google Scholar] [CrossRef]
- Hruby, A.; Hu, F.B. The epidemiology of obesity: a big picture. Pharmacoeconomics 2015, 33, 673–689. [Google Scholar] [CrossRef]
- Blüher, M. Obesity: Global epidemiology and pathogenesis. Nat. Rev. Endocrinol. 2019, 1. [Google Scholar] [CrossRef]
- Tsai, A.G.; Bessesen, D.H. Obesity. Ann. Intern. Med. 2019, 170, ITC33–ITC48. [Google Scholar] [CrossRef]
- Kushner, R.F. Weight loss strategies for treatment of obesity. Prog. Cardiovasc. Dis. 2014, 56, 465–472. [Google Scholar] [CrossRef]
- Apovian, C.M.; Aronne, L.J.; Bessesen, D.H.; McDonnell, M.E.; Murad, M.H.; Pagotto, U.; Ryan, D.H.; Still, C.D. Pharmacological management of obesity: An endocrine society clinical practice guideline. J. Clin. Endocrinol. Metab. 2015, 100, 342–362. [Google Scholar] [CrossRef]
- Kraschnewski, J.L.; Boan, J.; Esposito, J.; Sherwood, N.E.; Lehman, E.B.; Kephart, D.K.; Sciamanna, C.N. Long-term weight loss maintenance in the United States. Int. J. Obes. 2010, 34, 1644–1654. [Google Scholar] [CrossRef]
- Egan, B.M.; White, K. Weight Loss Pharmacotherapy: brief summary of the clinical literature and comments on racial differences. Ethn. Dis. 2015, 25, 511–514. [Google Scholar] [CrossRef]
- Epstein, L.H.; Gordy, C.C.; Raynor, H.A.; Beddome, M.; Kilanowski, C.K.; Paluch, R. Increasing fruit and vegetable intake and decreasing fat and sugar intake in families at risk for childhood obesity. Obes. Res. 2001, 9, 171–178. [Google Scholar] [CrossRef]
- Choi, J.; Kim, K.; Koh, E.; Lee, B. Gelidium elegans Regulates the AMPK-PRDM16-UCP-1 Pathway and has a synergistic effect with orlistat on obesity-associated features in mice fed a high-fat diet. Nutrients 2017, 9, 342. [Google Scholar] [CrossRef]
- Meydani, M.; Hasan, S.T. Dietary polyphenols and obesity. Nutrients 2010, 2, 737–751. [Google Scholar] [CrossRef]
- Sugizaki, C.S.A.; Naves, M.M.V. Potential prebiotic properties of nuts and edible seeds and their relationship to obesity. Nutrients 2018, 10, 1645. [Google Scholar] [CrossRef]
- Kang, J.; Lee, H.; Kim, H.; Han, J. Gelidium amansii extract ameliorates obesity by down-regulating adipogenic transcription factors in diet-induced obese mice. Nutr. Res. Pract. 2017, 11, 17–24. [Google Scholar] [CrossRef]
- Park, M.; Kang, J.; Kim, H.; Han, J. Gelidium amansii ethanol extract suppresses fat accumulation by down-regulating adipogenic transcription factors in ob/ob mice model. Food Sci. Biotechnol. 2017, 26, 207–212. [Google Scholar] [CrossRef]
- Eloi, J.C.; Epifanio, M.; de Gonçalves, M.M.; Pellicioli, A.; Vieira, P.F.; Dias, H.B.; Bruscato, N.; Soder, R.B.; Santana, J.C.; Mouzaki, M.; et al. Quantification of abdominal fat in obese and healthy adolescents using 3 Tesla magnetic resonance imaging and free software for image analysis. PLoS ONE 2017, 12, e0167625. [Google Scholar] [CrossRef]
- Matthews, D.R.; Hosker, J.P.; Rudenski, A.S.; Naylor, B.A.; Treacher, D.F.; Turner, R.C. Homeostasis model assessment: Insulin resistance and beta-cell function from fasting plasma glucose and insulin concentrations in man. Diabetologia 1985, 28, 412–419. [Google Scholar] [CrossRef]
- Bae, S.; Kim, S.; Sung, M. Impaired antioxidant status and decreased dietary intake of antioxidants in patients with systemic lupus erythematosus. Rheumatol. Int. 2002, 22, 238–243. [Google Scholar] [CrossRef]
- Committee, I.R. Guidelines for Data Processing and Analysis of the International Physical Activity Questionnaire (IPAQ)-Short and Long Forms. Available online: http://www.ipaq.ki.se/scoring.pdf (accessed on 12 October 2018).
- Ainsworth, B.E.; Haskell, W.L.; Herrmann, S.D.; Meckes, N.; Bassett, D.R.; Tudor Locke, C.; Greer, J.L.; Vezina, J.; Whitt Glover, M.C.; Leon, A. 2011 Compendium of physical activities: A second update of codes and MET values. Med. Sci. Sports Exerc. 2011, 43, 1575–1581. [Google Scholar] [CrossRef]
- Spalding, K.L.; Arner, E.; Westermark, P.O.; Bernard, S.; Buchholz, B.A.; Bergmann, O.; Blomqvist, L.; Hoffstedt, J.; Näslund, E.; Britton, T.; et al. Dynamics of fat cell turnover in humans. Nature 2008, 453, 783–787. [Google Scholar] [CrossRef]
- Khalilpourfarshbafi, M.; Gholami, K.; Murugan, D.D.; Abdul Sattar, M.Z.; Abdullah, N.A. Differential effects of dietary flavonoids on adipogenesis. Eur. J. Nutr. 2019, 58, 5–25. [Google Scholar] [CrossRef] [PubMed]
- Lefterova, M.I.; Lazar, M.A. New developments in adipogenesis. Trends Endocrinol. Metab. 2009, 20, 107–114. [Google Scholar] [CrossRef] [PubMed]
- Jeon, H.; Seo, M.; Choi, H.; Lee, O.; Lee, B. Gelidium elegans, an edible red seaweed, and hesperidin inhibit lipid accumulation and production of reactive oxygen species and reactive nitrogen species in 3T3-L1 and RAW264.7 cells. Phytother. Res. 2014, 28, 1701–1709. [Google Scholar] [CrossRef] [PubMed]
- Hsu, C.; Yen, G. Effects of flavonoids and phenolic acids on the inhibition of adipogenesis in 3T3-L1 adipocytes. J. Agric. Food Chem. 2007, 55, 8404–8410. [Google Scholar] [CrossRef] [PubMed]
- Choi, J.; Kim, K.J.; Koh, E.J.; Lee, B.Y. Altered gelidium elegans extract-stimulated beige-like phenotype attenuates adipogenesis in 3t3-l1 cells. J. Food Nutr. Res 2016, 4, 448–453. [Google Scholar]
- Kawano, Y.; Cohen, D.E. Mechanisms of hepatic triglyceride accumulation in non-alcoholic fatty liver disease. J. Gastroenterol. 2013, 48, 434–441. [Google Scholar] [CrossRef] [PubMed]
- Donnelly, K.L.; Smith, C.I.; Schwarzenberg, S.J.; Jessurun, J.; Boldt, M.D.; Parks, E.J. Sources of fatty acids stored in liver and secreted via lipoproteins in patients with nonalcoholic fatty liver disease. J. Clin. Investig. 2005, 115, 1343–1351. [Google Scholar] [CrossRef] [PubMed]
- Csaki, L.S.; Reue, K. Lipins: Multifunctional lipid metabolism proteins. Annu. Rev. Nutr. 2010, 30, 257–272. [Google Scholar] [CrossRef]
- Horton, J.D.; Goldstein, J.L.; Brown, M.S. SREBPs: Activators of the complete program of cholesterol and fatty acid synthesis in the liver. J. Clin. Investig. 2002, 109, 1125–1131. [Google Scholar] [CrossRef]


| Demographic Variables | Test (n = 41) | Placebo (n = 37) | p-Value |
|---|---|---|---|
| Age (years) | 36.66 ± 8.55 | 34.22 ± 6.89 | 0.172 |
| Sex | |||
| Male | 17 (41.5) | 14 (37.8) | 0.924 |
| Body weight (kg) | 72.11 ± 11.88 | 70.87 ± 10.56 | 0.629 |
| Body mass index (kg/m2) | 25.78 ± 1.95 | 25.85 ± 1.92 | 0.863 |
| Waist circumference (cm) | 89.29 ± 7.84 | 87.29 ± 10.07 | 0.328 |
| Hip circumference (cm) | 102.59 ± 5.03 | 101.71 ± 4.83 | 0.438 |
| Waist-to-hip ratio | 0.87 ± 0.05 | 0.86 ± 0.09 | 0.493 |
| SBP (mmHg) | 125.85 ± 13.71 | 124.73 ± 13.71 | 0.734 |
| DBP (mmHg) | 77.56 ± 8.92 | 75.22 ± 11.77 | 0.322 |
| Fasting glucose (mg/dL) | 93.49 ± 10.38 | 93.49 ± 9.51 | 0.9995 |
| Fasting insulin (uIU/mL) | 8.45 ± 4.93 | 9.51 ± 5.62 | 0.377 |
| HOMA-IR | 1.98 ± 1.25 | 2.24 ± 1.45 | 0.396 |
| HOMA-β | 94.52 ± 94.34 | 120.53 ± 70.79 | 0.176 |
| hs-CRP (mg/dL) | 1.36 ± 1.96 | 2.14 ± 5.79 | 0.442 |
| Total cholesterol (mg/dL) | 190.37 ± 28.98 | 190.03 ± 36.68 | 0.964 |
| LDL (mg/dL) | 112.95 ± 27.99 | 112.81 ± 34.57 | 0.985 |
| HDL (mg/dL) | 56.59 ± 10.97 | 57.19 ± 12.51 | 0.821 |
| Triglyceride (mg/dL) | 125.22 ± 123.37 | 121.81 ± 83.08 | 0.886 |
| AST (IU/L) | 19.00 (6.00) | 17.00 (4.00) | 0.022 |
| ALT (IU/L) | 18.00 (10.00) | 15.00 (8.00) | 0.045 |
| BUN (mg/dL) | 12.20 ± 3.21 | 12.56 ± 2.55 | 0.583 |
| Creatinine (mg/dL) | 0.74 ± 0.17 | 0.71 ± 0.17 | 0.471 |
| TSH (mIU/mL) | 1.50 ± 1.29 | 1.55 ± 0.75 | 0.828 |
| Calorie (kcal/day) | 1715.64 ± 507.85 | 1737.11 ± 449.70 | 0.845 |
| Physical activity (MET-min/week) | 1696.71 ± 2204.96 | 2981.16 ± 3601.92 | 0.066 |
| Variables | Test (n = 41) | Placebo (n = 37) | p-Value * | |
|---|---|---|---|---|
| Calories (kcal/day) | ||||
| Baseline | 1687 (685) | 1728 (623) | 0.777 | |
| 6 weeks | 1577 (336) | 1676 (391) | 0.495 | |
| 12 weeks | 1597 (521) | 1732 (732) | 0.255 | |
| Δ6 week-baseline | −94 (522) | −106 (537) | 0.948 | |
| Δ12 week-baseline | −63 (853) | 17 (653) | 0.508 | |
| Physical activity (MET-min/week) | ||||
| Vigorous | Baseline | 0 (720) | 0 (720) | 0.923 |
| 6 weeks | 0 (800) | 0 (720) | 0.839 | |
| 12 weeks | 0 (1200) | 0 (720) | 0.577 | |
| Δ6 week-baseline | 0 (240) | 0 (0) | 0.216 | |
| Δ12 week-baseline | 0 (240) ** | 0 (320) | 0.043 | |
| Moderate | Baseline | 0 (360) | 0 (240) | 0.978 |
| 6 weeks | 0 (480) | 0 (360) | 0.848 | |
| 12 weeks | 0 (360) | 0 (320) | 0.342 | |
| Δ6 week-baseline | 0 (360) | 0 (120) | 0.881 | |
| Δ12 week-baseline | 0 (360) | 0 (160) | 0.436 | |
| Walking | Baseline | 495 (7590) | 693 (924) | 0.027 |
| 6 weeks | 594 (4158) | 693 (1320) | 0.157 | |
| 12 weeks | 792 (1056) | 924 (1386) | 0.344 | |
| Δ6 week-baseline | 0 (561) | 198 (957) | 0.753 | |
| Δ12 week-baseline | 0 (660) ** | 0 (462) | 0.146 | |
| Total | Baseline | 990 (1941) | 1746 (3465) | 0.080 |
| 6 weeks | 1386 (1839) | 1386 (2493) | 0.473 | |
| 12 weeks | 1386 (2319) | 1710 (2136) | 0.625 | |
| Δ6 week-baseline | 141 (1287) | 247 (2331) | 0.705 | |
| Δ12 week-baseline | 240 (1761) ** | –9 (1062) | 0.043 | |
| Variables | Test (n = 41) | Placebo (n = 37) | p-Value * | |
|---|---|---|---|---|
| Body weight (kg) | Baseline | 72.11 ± 11.88 | 70.87 ± 10.56 | 0.629 |
| 6 weeks | 71.60 ± 11.72 | 71.20 ± 10.34 | 0.873 | |
| 12 weeks | 70.94 ± 11.88 | 71.56 ± 10.38 | 0.807 | |
| Δ6 week-baseline | −0.51 ± 1.23 ** | 0.33 ± 1.12 | 0.002 | |
| Δ12 week-baseline | −1.17 ± 1.74 ** | 0.69 ± 1.10** | <0.0001 | |
| Body mass index (kg/m2) | Baseline | 25.78 ± 1.95 | 25.85 ± 1.92 | 0.863 |
| 6 weeks | 25.60 ± 1.92 | 25.98 ± 1.95 | 0.387 | |
| 12 weeks | 25.35 ± 1.97 | 26.11 ± 1.96 | 0.090 | |
| Δ6 week-baseline | −0.18 ± 0.45 ** | 0.13 ± 0.42 | 0.003 | |
| Δ12 week-baseline | −0.43 ± 0.65 ** | 0.26 ± 0.41 ** | <0.0001 | |
| Waist circumference (cm) | Baseline | 89.29 ± 7.84 | 87.29 ± 10.07 | 0.328 |
| 6 weeks | 88.41 ± 7.79 | 87.85 ± 7.18 | 0.742 | |
| 12 weeks | 87.85 ± 8.56 | 87.91 ± 8.33 | 0.974 | |
| Δ6 week-baseline | −0.88 ± 3.85 | 0.56 ± 6.64 | 0.254 | |
| Δ12 week-baseline | −1.44 ± 3.84 ** | 0.63 ± 7.60 | 0.142 | |
| Hip circumference (cm) | Baseline | 102.59 ± 5.03 | 101.71 ± 4.83 | 0.438 |
| 6 weeks | 101.27 ± 4.67 | 101.41 ± 5.35 | 0.902 | |
| 12 weeks | 101.47 ± 5.06 | 101.77 ± 4.79 | 0.786 | |
| Δ6 week-baseline | −1.31 ± 1.92 ** | −0.30 ± 3.79 | 0.150 | |
| Δ12 week-baseline | −1.12 ± 2.69 ** | 0.06 ± 3.00 | 0.071 | |
| Waist-to-hip ratio | Baseline | 0.87 ± 0.05 | 0.86 ± 0.09 | 0.493 |
| 6 weeks | 0.87 ± 0.06 | 0.87 ± 0.05 | 0.605 | |
| 12 weeks | 0.87 ± 0.06 | 0.86 ± 0.06 | 0.890 | |
| Δ6 week-baseline | 0.00 ± 0.04 | 0.01 ± 0.07 | 0.688 | |
| Δ12 week-baseline | 0.00 ± 0.03 | 0.01 ± 0.08 | 0.485 |
| Variables | Test (n = 41) | Placebo (n = 37) | p-Value * | |
|---|---|---|---|---|
| DEXA | ||||
| Total body mass | Baseline | 72.78 ± 12.08 | 71.64 ± 10.61 | 0.662 |
| (kg) | 12 weeks | 71.57 ± 11.90 | 72.10 ± 10.50 | 0.836 |
| Δ12 week-baseline | −1.21 ± 1.66 ** | 0.46 ± 1.19 ** | <0.0001 | |
| Total fat mass | Baseline | 19.66 ± 3.89 | 19.76 ± 4.23 | 0.919 |
| (kg) | 12 weeks | 19.18 ± 3.80 | 20.84 ± 4.30 | 0.075 |
| Δ12 week-baseline | −0.48 ± 1.06 ** | 1.08 ± 0.75 ** | <0.0001 | |
| Lean body mass | Baseline | 50.68 ± 11.12 | 49.48 ± 10.51 | 0.626 |
| (kg) | 12 weeks | 49.95 ± 10.91 | 48.85 ± 10.46 | 0.652 |
| Δ12 week-baseline | −0.73 ± 1.65 ** | −0.63 ± 1.05** | 0.743 | |
| Fat CT | ||||
| Visceral fat | Baseline | 99.12 ± 43.75 | 93.97 ± 43.73 | 0.605 |
| (cm2) | 12 weeks | 91.76 ± 38.95 | 95.42 ± 45.48 | 0.703 |
| Δ12 week-baseline | −7.36 ± 21.83 ** | 1.45 ± 13.53 | 0.034 | |
| Subcutaneous fat | Baseline | 191.24 ± 56.72 | 198.49 ± 64.07 | 0.598 |
| (cm2) | 12 weeks | 185.58 ± 54.96 | 210.12 ± 67.08 | 0.080 |
| Δ12 week-baseline | −5.67 ± 19.68 | 11.63 ± 21.49 ** | 0.0004 | |
| Total abdominal fat | Baseline | 290.36 ± 81.59 | 292.46 ± 81.79 | 0.910 |
| (cm2) | 12 weeks | 277.33 ± 75.03 | 305.54 ± 80.18 | 0.113 |
| Δ12 week-baseline | −13.03 ± 27.95 ** | 13.08 ± 26.51 ** | <0.0001 |
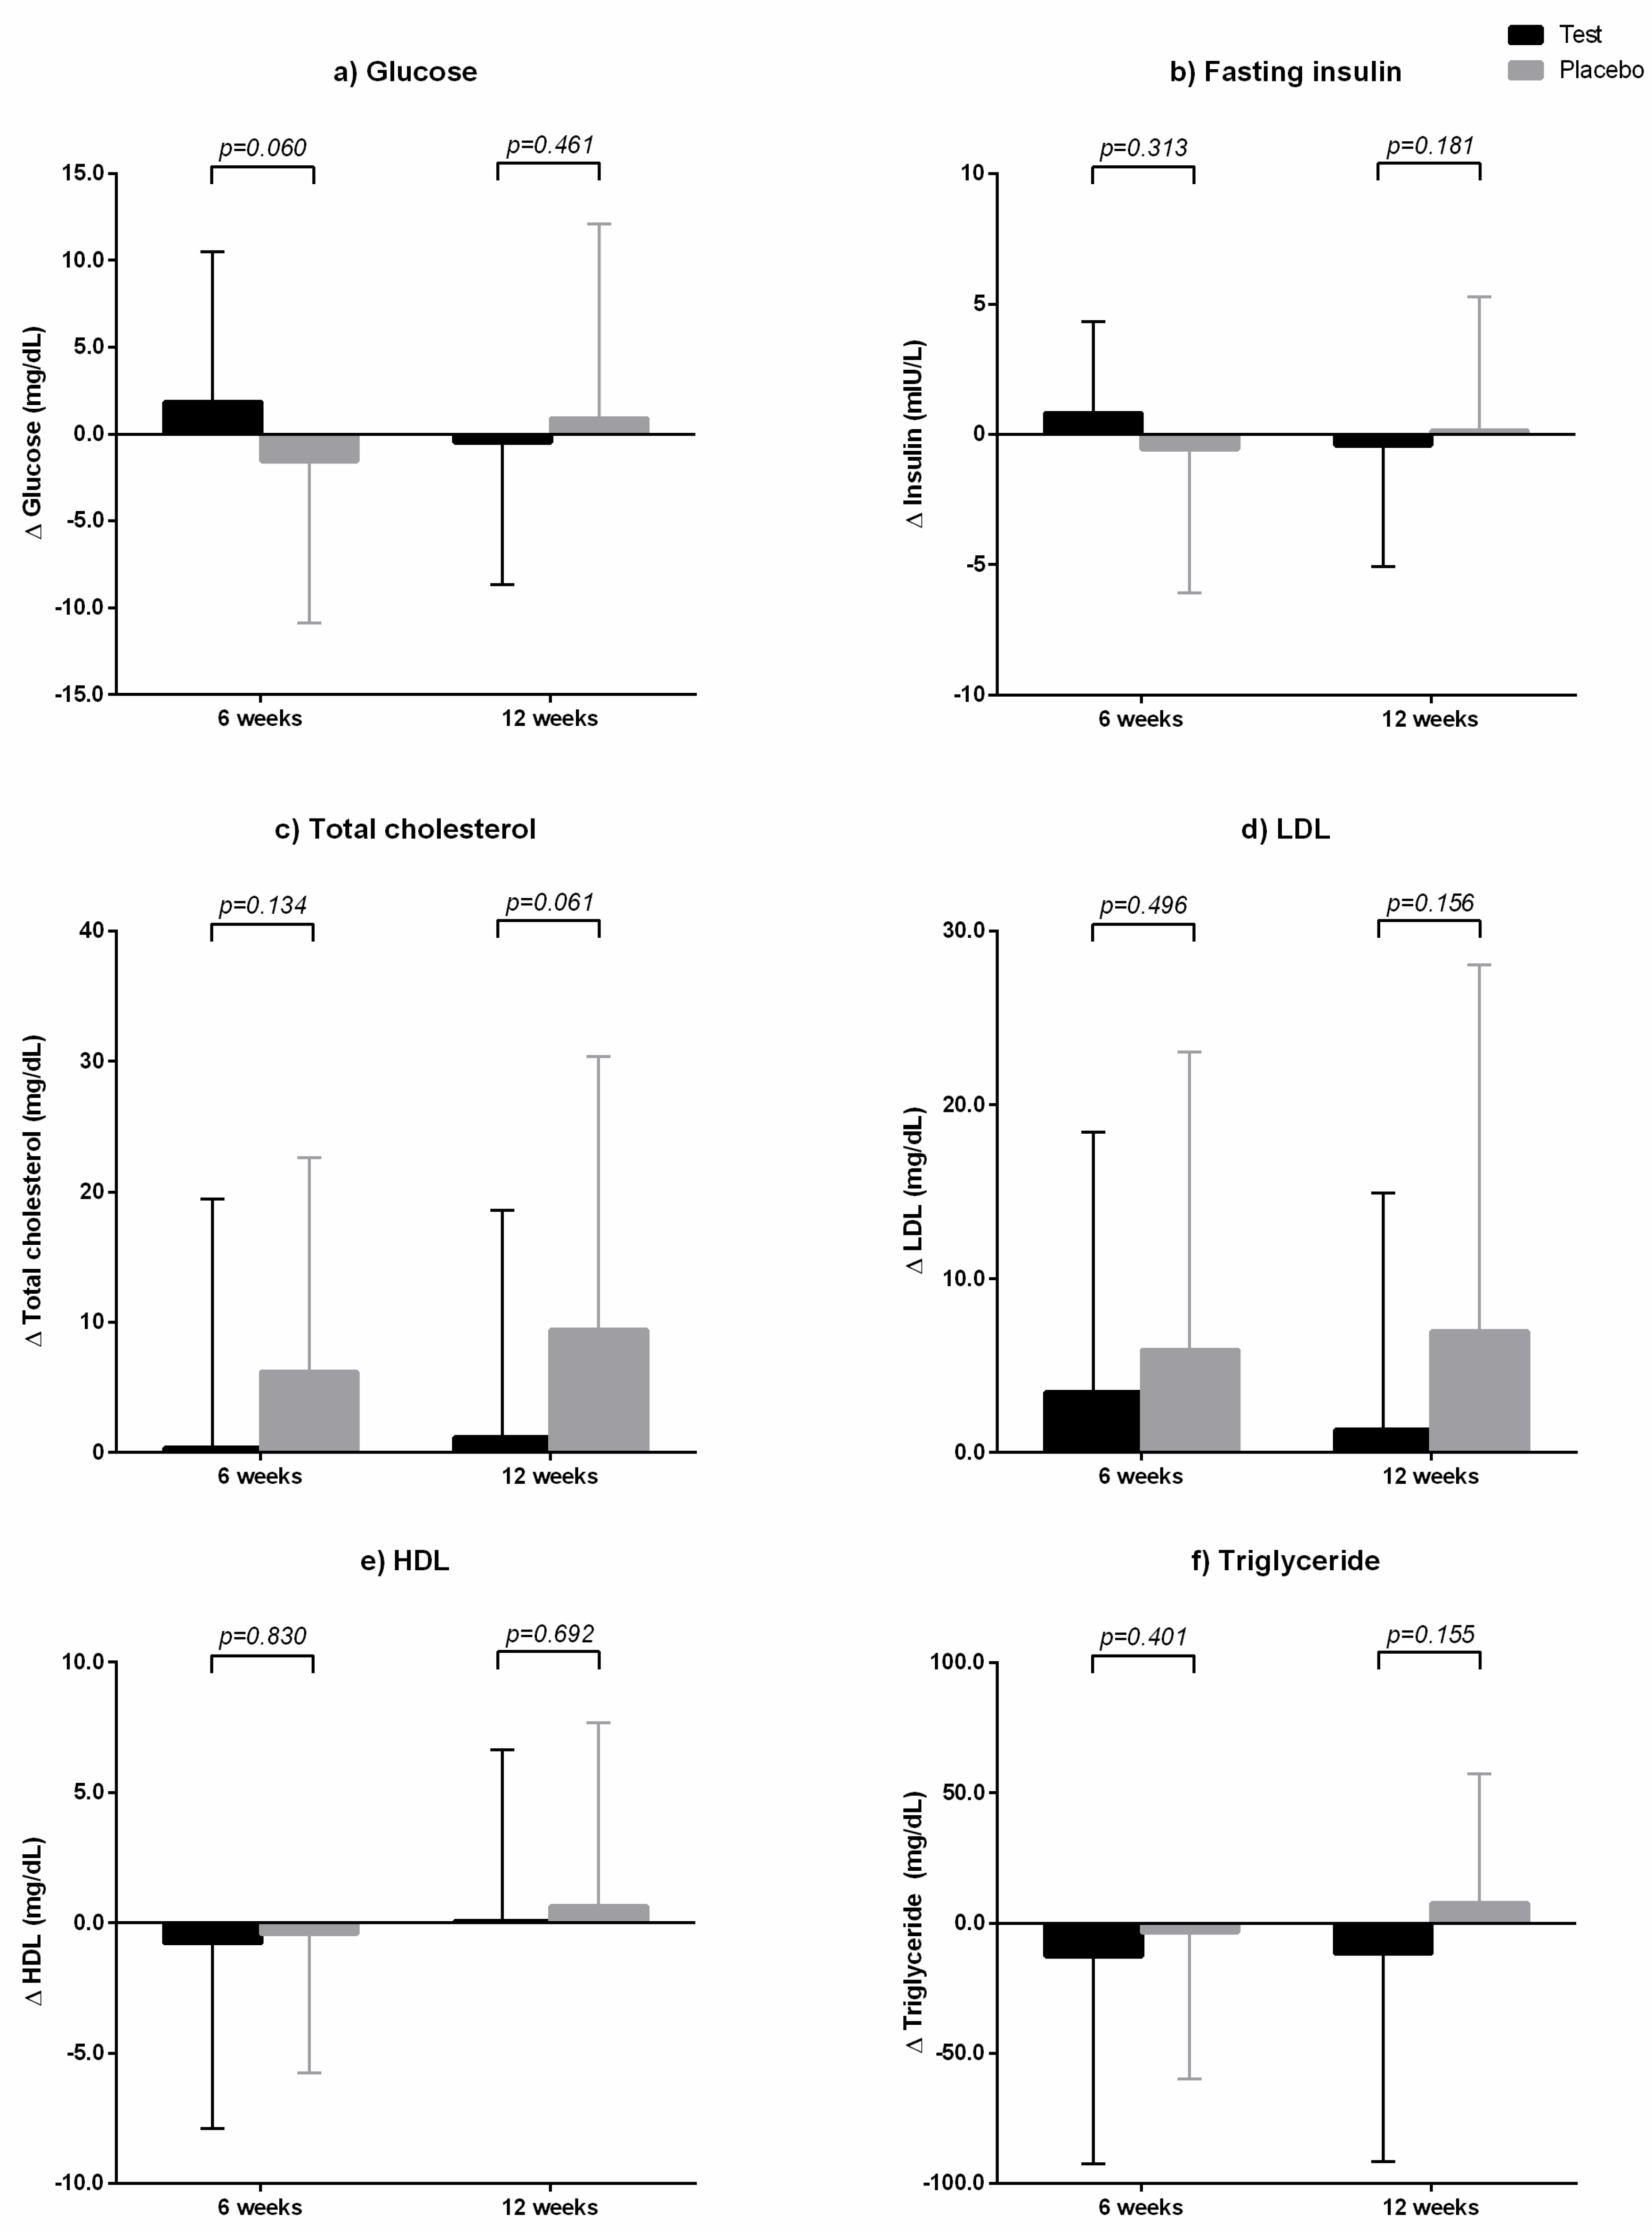
| Variables | Test (n = 41) | Placebo (n = 37) | p-Value * | |
|---|---|---|---|---|
| Fasting glucose | Baseline | 93.49 ± 10.38 | 93.49 ± 9.51 | 0.9995 |
| (mg/dL) | 6 weeks | 95.34 ± 9.37 | 91.92 ± 8.23 | 0.092 |
| 12 weeks | 93.00 ± 10.33 | 94.38 ± 10.44 | 0.560 | |
| Δ6 week-baseline | 1.85 ± 8.66 | –1.57 ± 9.28 | 0.096 | |
| Δ12 week-baseline | –0.49 ± 8.18 | 0.89 ± 11.20 | 0.534 | |
| Fasting insulin | Baseline | 8.45 ± 4.93 | 9.51 ± 5.62 | 0.377 |
| (mIU/L) | 6 weeks | 9.27 ± 5.93 | 8.94 ± 4.83 | 0.791 |
| 12 weeks | 8.03 ± 4.04 | 9.65 ± 4.81 | 0.110 | |
| Δ6 week-baseline | 0.82 ± 3.51 | –0.57 ± 5.51 | 0.194 | |
| Δ12 week-baseline | –0.42 ± 4.65 | 0.14 ± 5.14 | 0.617 | |
| HOMA-IR | Baseline | 1.98 ± 1.25 | 2.24 ± 1.45 | 0.396 |
| 6 weeks | 2.24 ± 1.56 | 2.08 ± 1.24 | 0.611 | |
| 12 weeks | 1.88 ± 1.05 | 2.31 ± 1.31 | 0.116 | |
| Δ6 week-baseline | 0.26 ± 0.94 | –0.17 ± 1.40 | 0.124 | |
| Δ12 week-baseline | –0.10 ± 1.20 | 0.06 ± 1.31 | 0.567 | |
| HOMA-β | Baseline | 94.52 ± 94.34 | 120.53 ± 70.79 | 0.176 |
| 6 weeks | 104.39 ± 56.21 | 113.28 ± 56.87 | 0.490 | |
| 12 weeks | 104.83 ± 61.57 | 115.35 ± 59.39 | 0.446 | |
| Δ6 week-baseline | 9.87 ± 83.36 | –7.25 ± 73.65 | 0.342 | |
| Δ12 week-baseline | 10.31 ± 91.36 | –5.18 ± 76.32 | 0.422 | |
| hs-CRP | Baseline | 1.36 ± 1.96 | 2.14 ± 5.79 | 0.442 |
| (mg/L) | 6 weeks | 1.06 ± 1.25 | 1.61 ± 2.94 | 0.298 |
| 12 weeks | 1.06 ± 0.91 | 1.13 ± 0.98 | 0.722 | |
| Δ6 week-baseline | –0.30 ± 2.10 | –0.53 ± 6.46 | 0.839 | |
| Δ12 week-baseline | –0.30 ± 1.79 | –1.00 ± 5.75 | 0.482 | |
| Total cholesterol | Baseline | 190.37 ± 28.98 | 190.03 ± 36.68 | 0.964 |
| (mg/dL) | 6 weeks | 190.76 ± 26.02 | 196.22 ± 33.84 | 0.424 |
| 12 weeks | 191.51 ± 30.39 | 199.46 ± 36.02 | 0.294 | |
| Δ6 week-baseline | 0.39 ± 19.05 | 6.19 ± 16.47 ** | 0.157 | |
| Δ12 week-baseline | 1.15 ± 17.44 | 9.43 ± 20.94 ** | 0.061 | |
| LDL | Baseline | 112.95 ± 27.99 | 112.81 ± 34.57 | 0.985 |
| (mg/dL) | 6 weeks | 116.44 ± 26.48 | 118.73 ± 31.15 | 0.727 |
| 12 weeks | 114.27 ± 28.81 | 119.81 ± 32.60 | 0.428 | |
| Δ6 week-baseline | 3.49 ± 14.99 | 5.92 ± 17.13 ** | 0.507 | |
| Δ12 week-baseline | 1.32 ± 13.64 | 7.00 ± 21.06 | 0.168 | |
| HDL | Baseline | 56.59 ± 10.97 | 57.19 ± 12.51 | 0.821 |
| (mg/dL) | 6 weeks | 55.80 ± 11.12 | 56.78 ± 12.58 | 0.716 |
| 12 weeks | 56.66 ± 11.32 | 57.84 ± 12.73 | 0.666 | |
| Δ6 week-baseline | –0.78 ± 7.12 | –0.41 ± 5.36 | 0.795 | |
| Δ12 week-baseline | 0.07 ± 6.57 | 0.65 ± 7.04 | 0.710 | |
| Triglyceride | Baseline | 125.22 ± 123.37 | 121.81 ± 83.08 | 0.886 |
| (mg/dL) | 6 weeks | 112.41 ± 64.58 | 118.24 ± 65.10 | 0.693 |
| 12 weeks | 113.56 ± 87.94 | 129.30 ± 83.00 | 0.420 | |
| Δ6 week-baseline | –12.80 ± 79.59 | –3.57 ± 56.33 | 0.553 | |
| Δ12 week-baseline | –11.66 ± 79.86 | 7.49 ± 49.92 | 0.204 |
© 2019 by the authors. Licensee MDPI, Basel, Switzerland. This article is an open access article distributed under the terms and conditions of the Creative Commons Attribution (CC BY) license (http://creativecommons.org/licenses/by/4.0/).
Share and Cite
Kim, C.O.; Kim, Y.N.; Lee, D.-C. Effects of Gelidium elegans on Weight and Fat Mass Reduction and Obesity Biomarkers in Overweight or Obese Adults: A Randomized Double-Blinded Study. Nutrients 2019, 11, 1513. https://doi.org/10.3390/nu11071513
Kim CO, Kim YN, Lee D-C. Effects of Gelidium elegans on Weight and Fat Mass Reduction and Obesity Biomarkers in Overweight or Obese Adults: A Randomized Double-Blinded Study. Nutrients. 2019; 11(7):1513. https://doi.org/10.3390/nu11071513
Chicago/Turabian StyleKim, Choon Ok, Youn Nam Kim, and Duk-Chul Lee. 2019. "Effects of Gelidium elegans on Weight and Fat Mass Reduction and Obesity Biomarkers in Overweight or Obese Adults: A Randomized Double-Blinded Study" Nutrients 11, no. 7: 1513. https://doi.org/10.3390/nu11071513
APA StyleKim, C. O., Kim, Y. N., & Lee, D.-C. (2019). Effects of Gelidium elegans on Weight and Fat Mass Reduction and Obesity Biomarkers in Overweight or Obese Adults: A Randomized Double-Blinded Study. Nutrients, 11(7), 1513. https://doi.org/10.3390/nu11071513