Validation of a Dietary Questionnaire to Screen Omega-3 Fatty Acids Levels in Healthy Adults

 ,
,
Abstract
1. Introduction
2. Methods
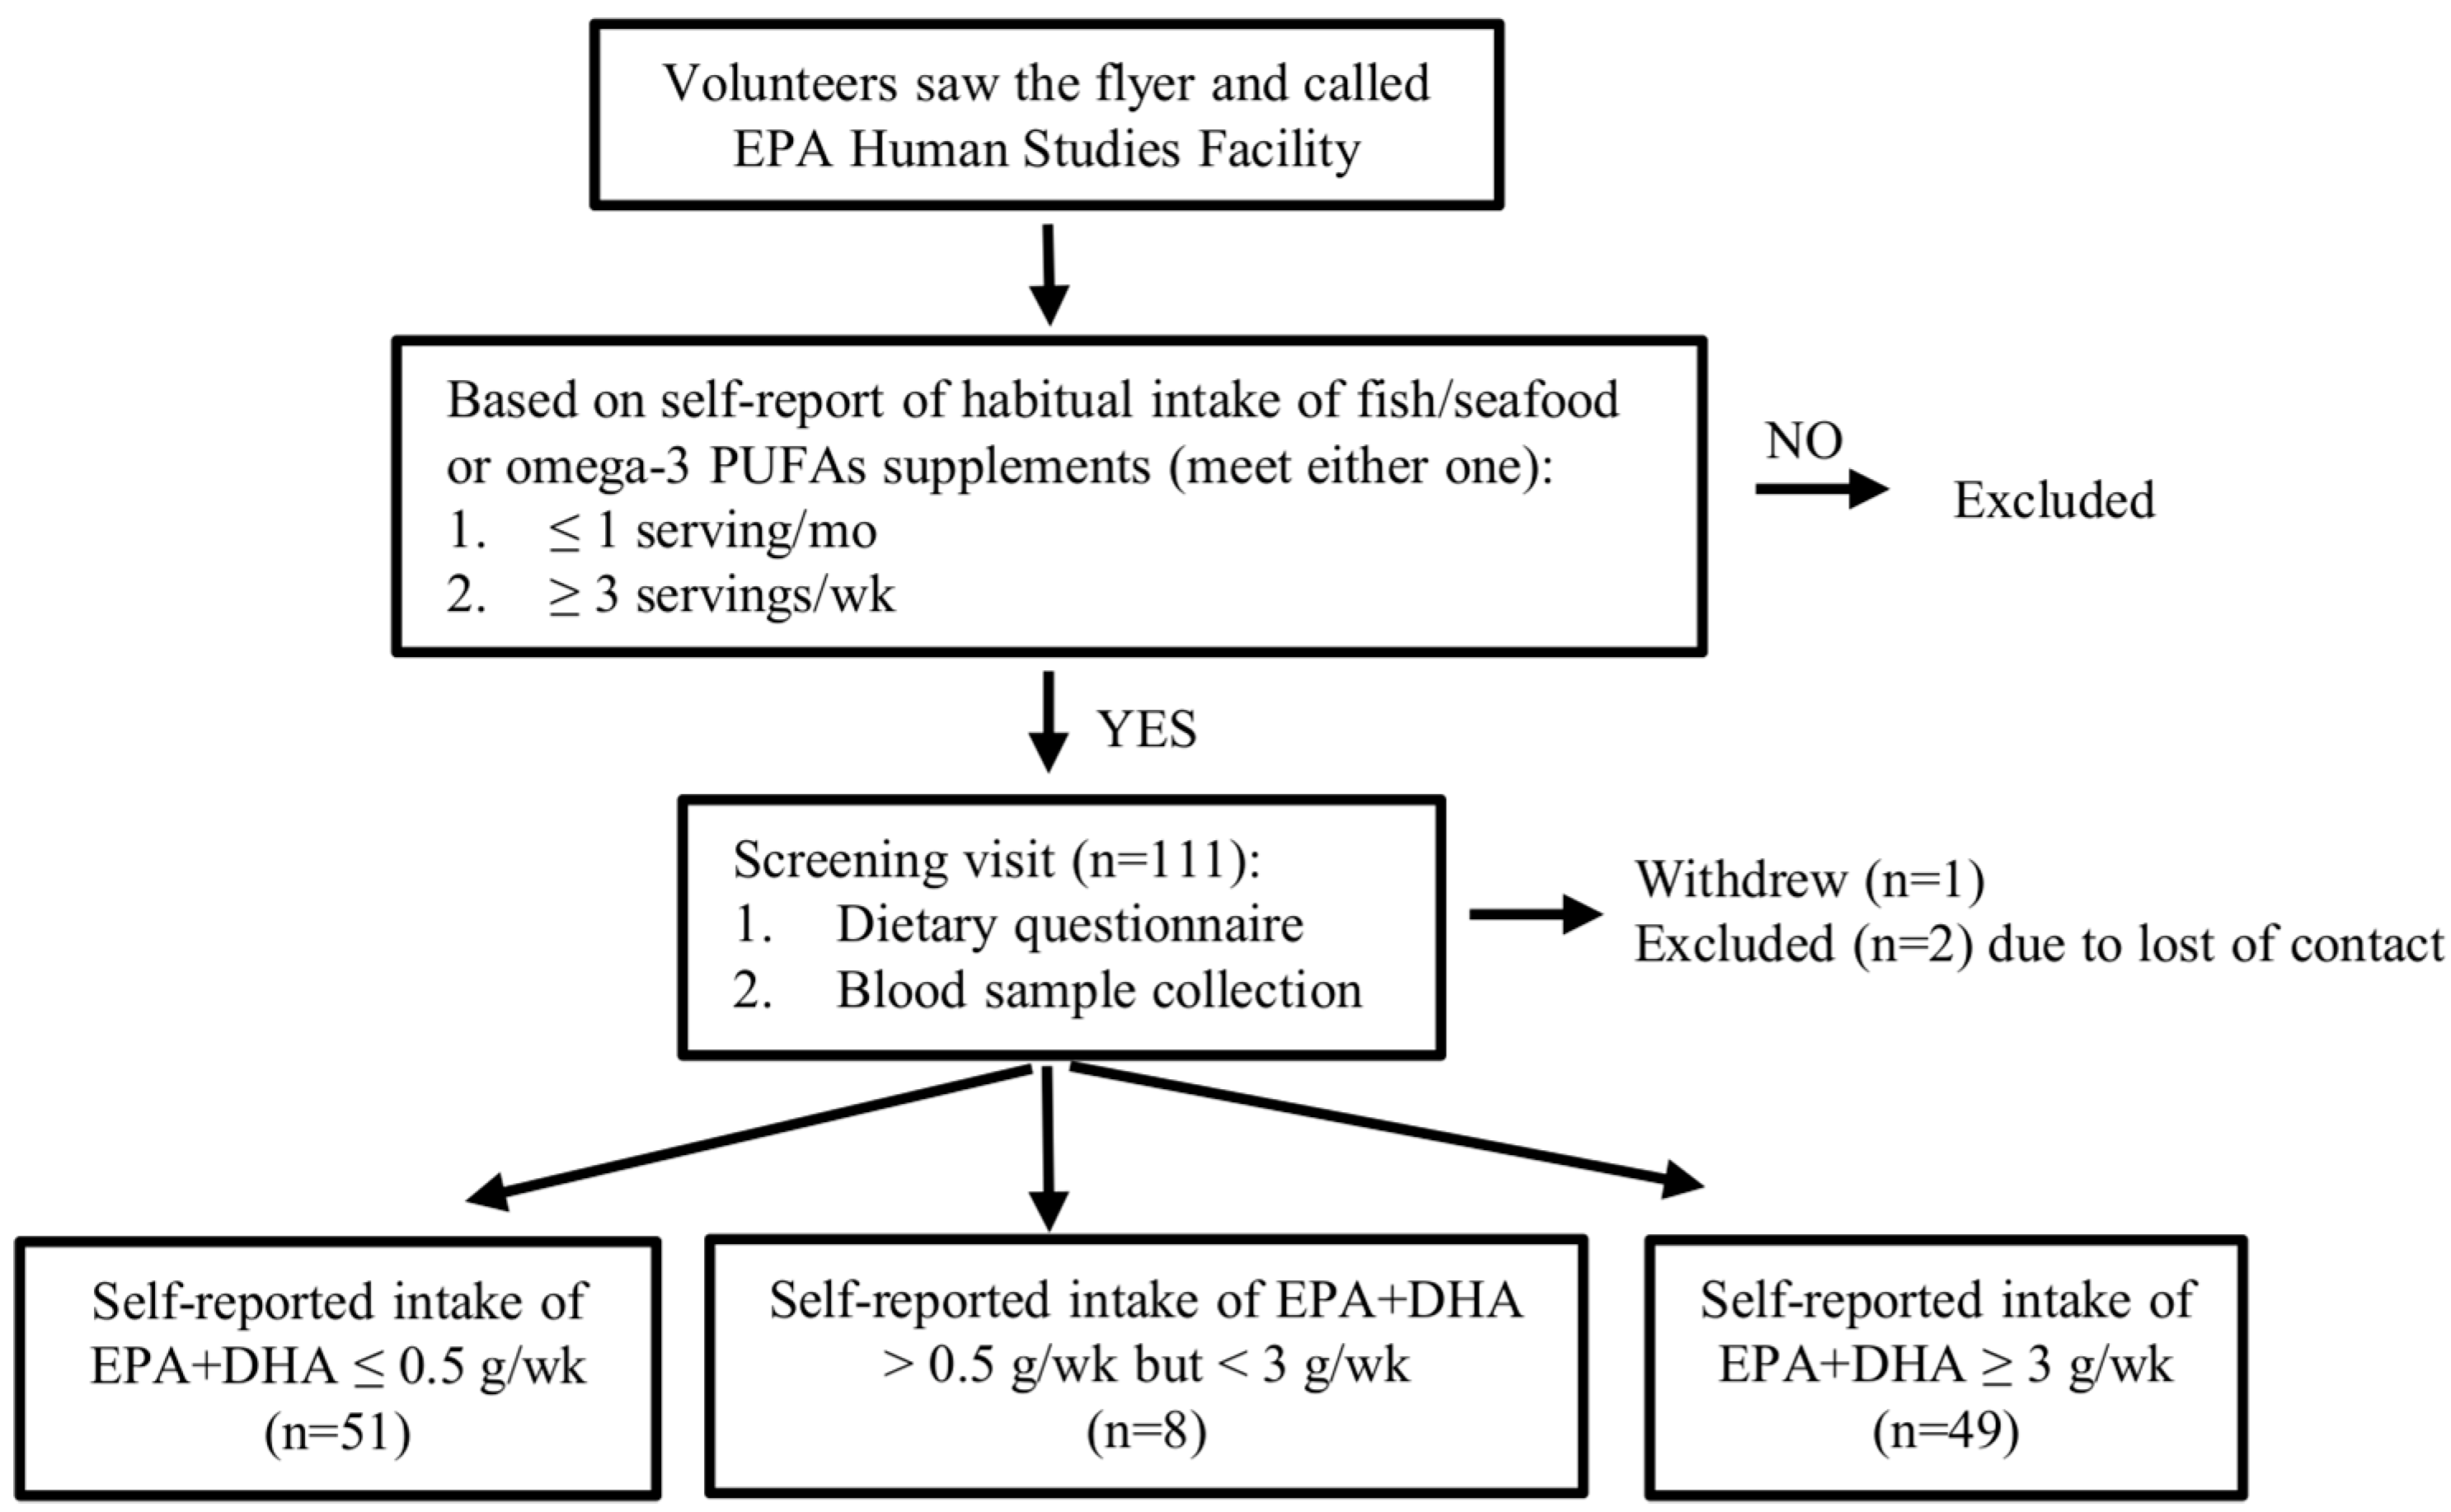
2.1. Recruitment
2.2. Determination of the Dietary Criteria
2.3. Dietary Assessment Questionnaire
2.4. Calculation of Dietary Intake of EPA and DHA
2.5. Omega-3 Index and Blood Fatty Acids Levels
2.6. Sample Size
2.7. Statistical Analysis
3. Results
3.1. Volunteer Characteristics and Blood Levels of Omega-3 PUFAs
3.2. Dietary Consumption of EPA and DHA
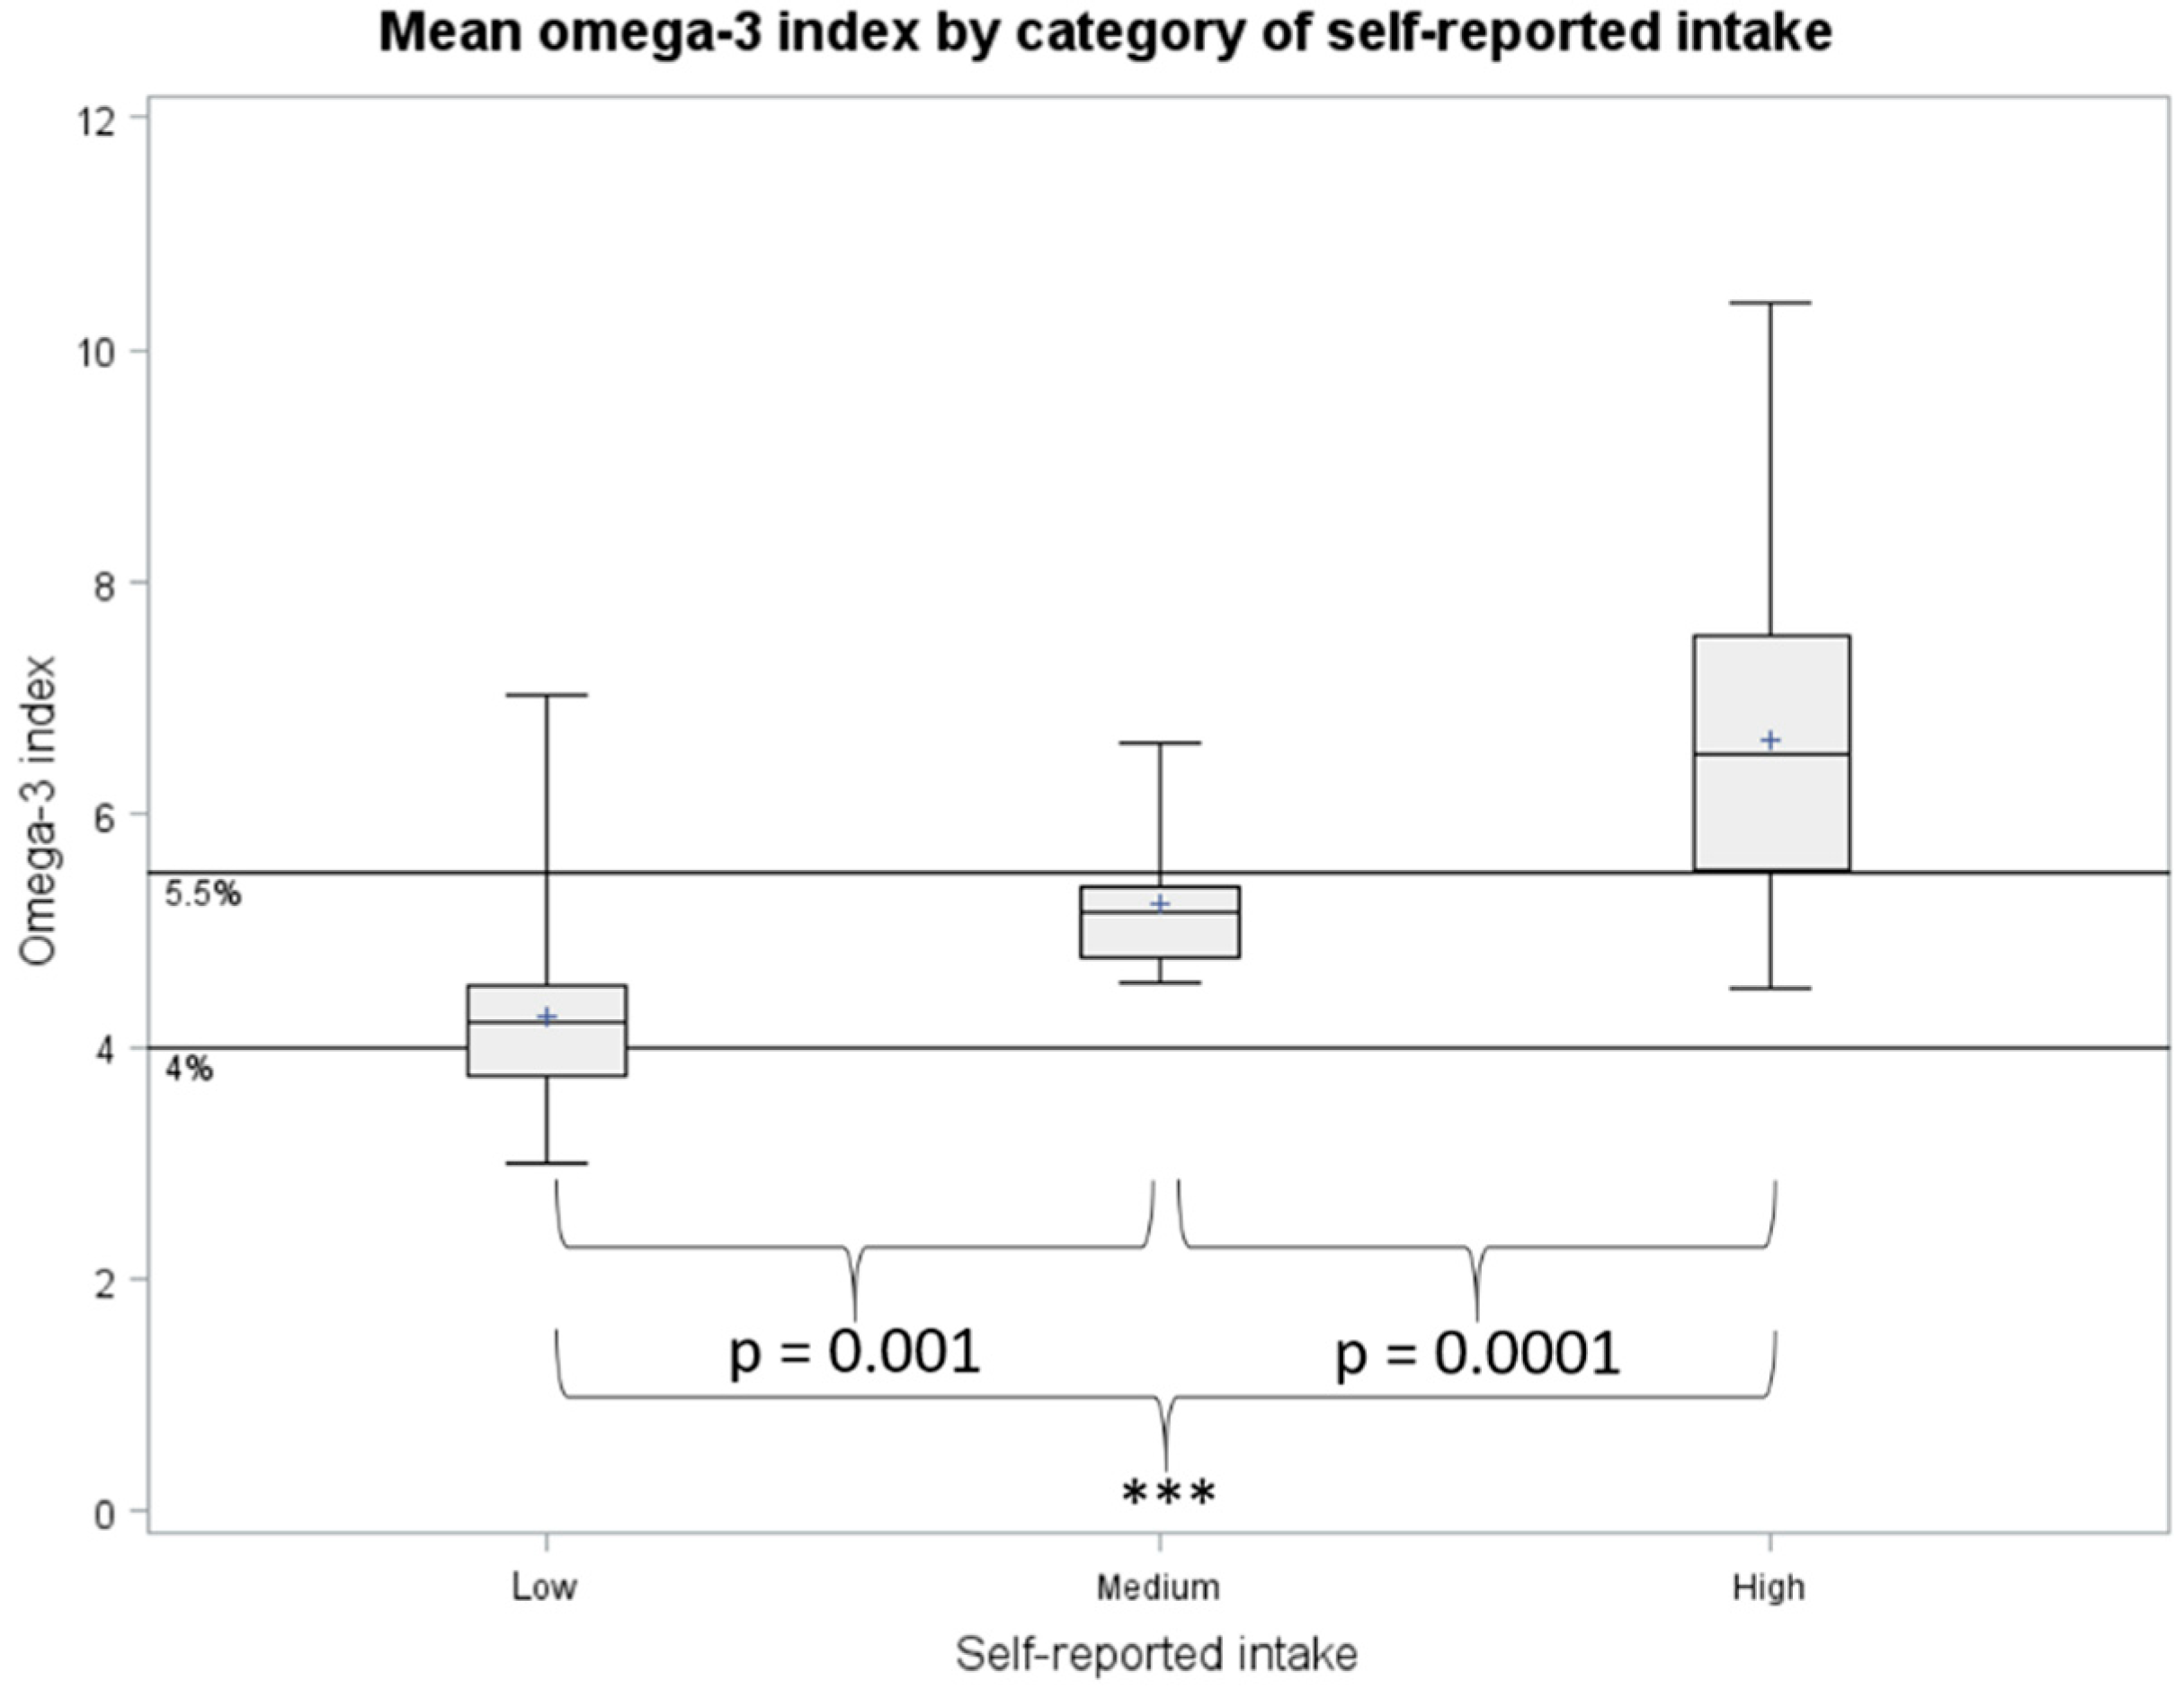
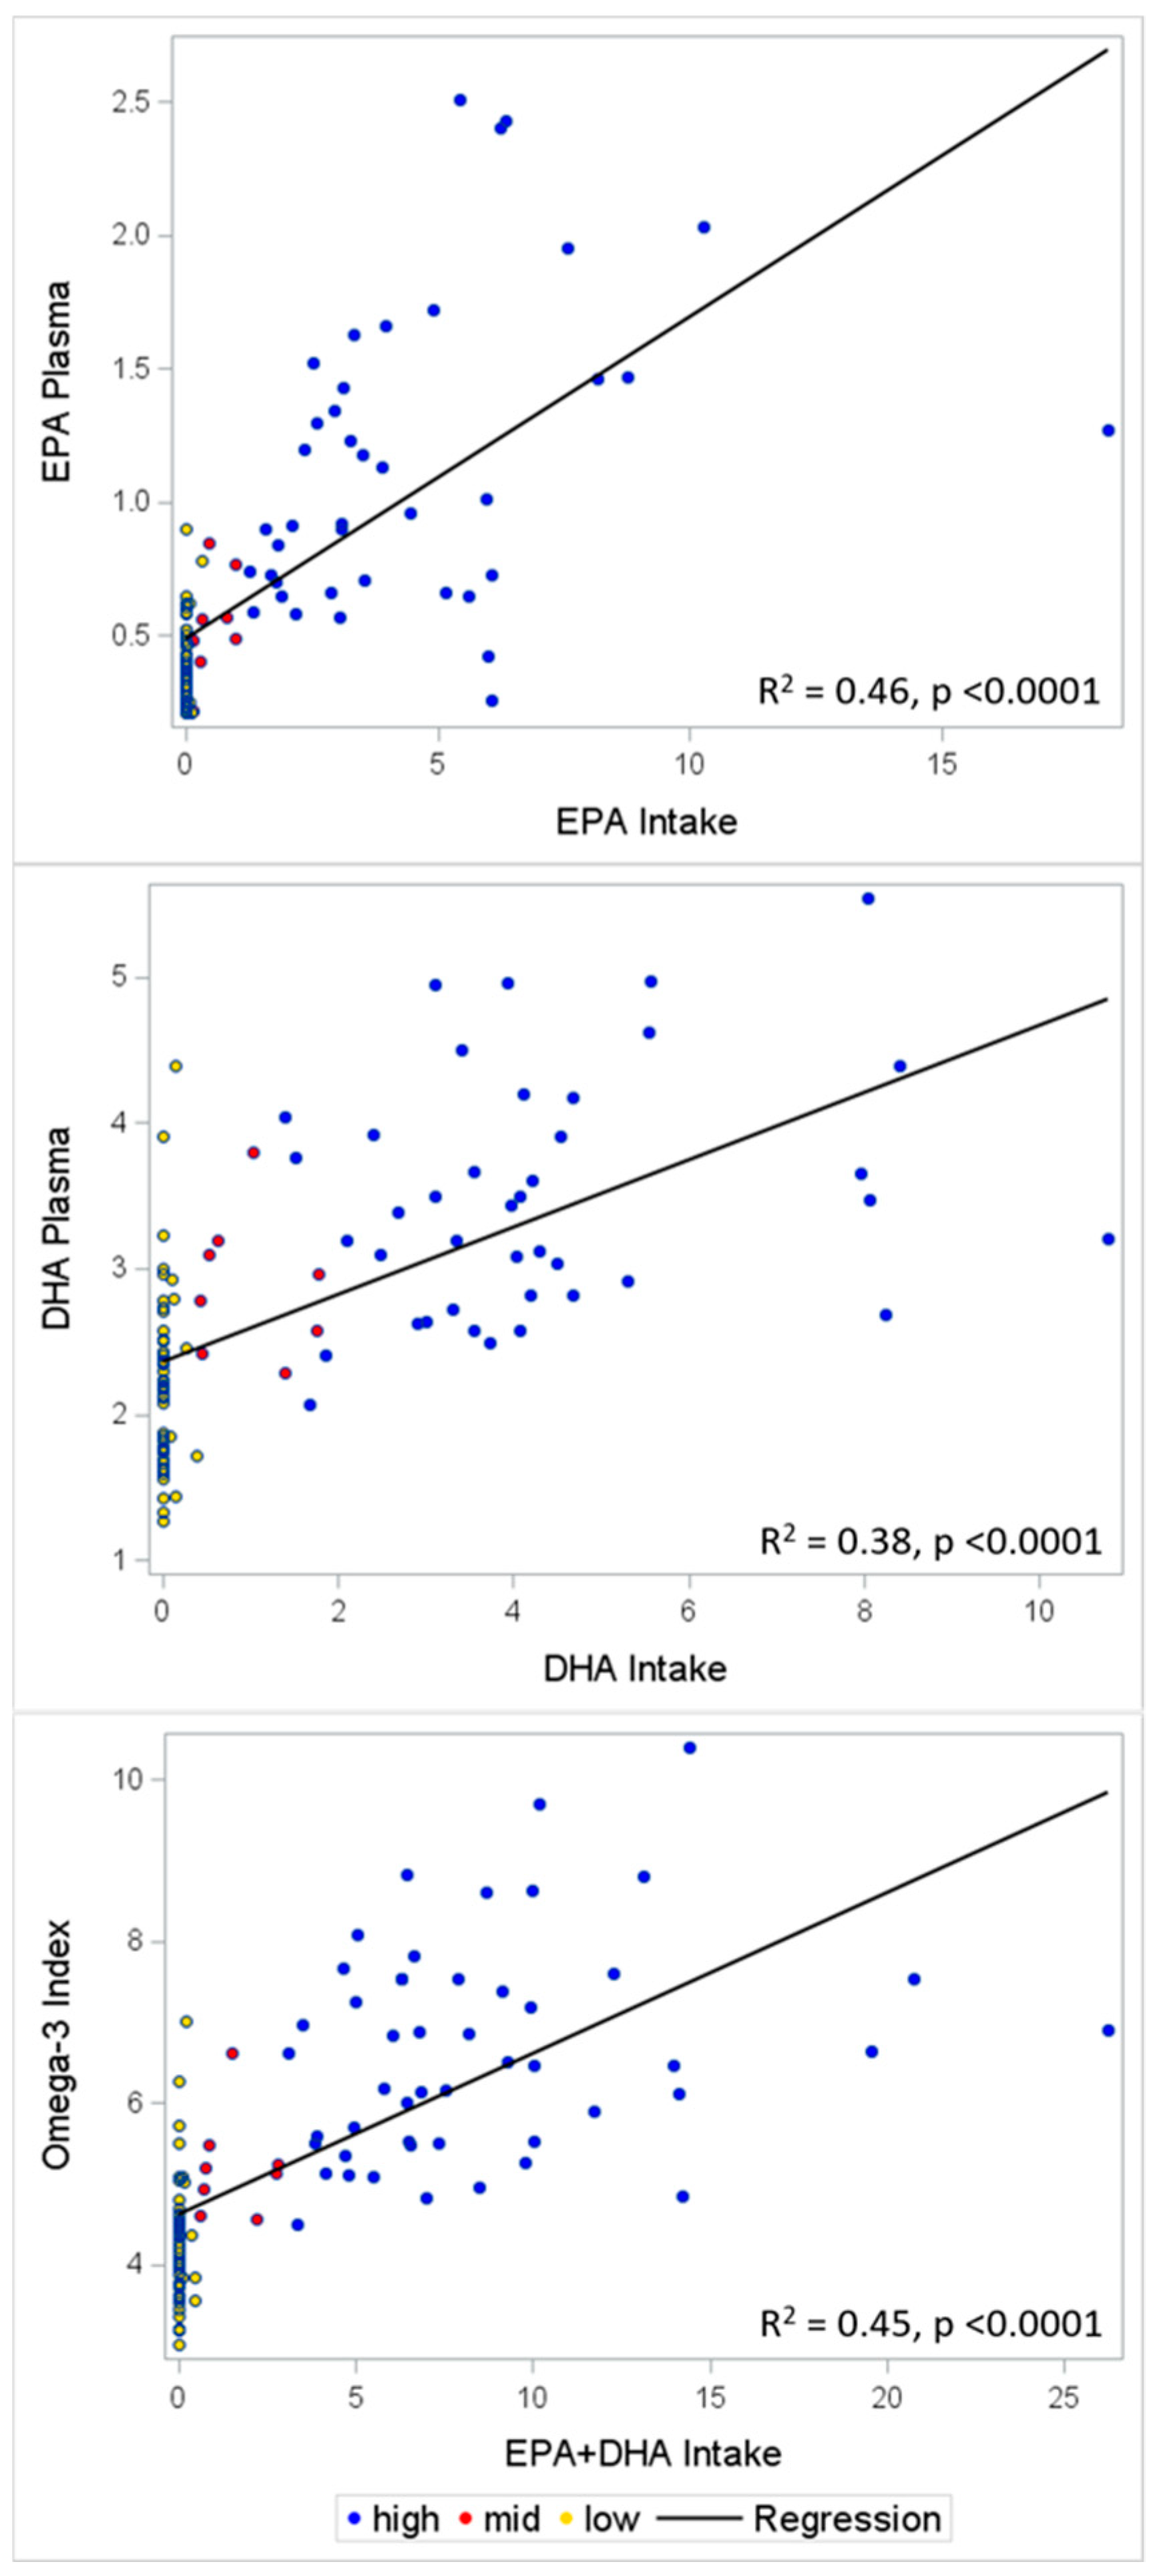
3.3. Validation
3.4. Sensitivity and Specificity Analyses
4. Discussion
5. Conclusions
Supplementary Materials
Author Contributions
Funding
Acknowledgments
Conflicts of Interest
Disclaimer
Abbreviations
| ALA | alpha-linolenic acid |
| BMI | body mass index |
| DHA | docosahexaenoic acid |
| EPA | eicosapentaenoic acid |
| FFQ | food frequency questionnaire |
| PUFAs | polyunsaturated fatty acids |
| USDA | United States Department of Agriculture |
References
- Penberthy, L.T.; Dahman, B.A.; Petkov, V.I.; DeShazo, J.P. Effort required in eligibility screening for clinical trials. J. Oncol. Pract. 2012, 8, 365–370. [Google Scholar] [CrossRef] [PubMed]
- Rubin, R.R.; Fujimoto, W.Y.; Marrero, D.G.; Brenneman, T.; Charleston, J.B.; Edelstein, S.L.; Fisher, E.B.; Jordan, R.; Knowler, W.C.; Lichterman, L.C.; et al. The Diabetes Prevention Program: recruitment methods and results. Control. Clin. Trials 2002, 23, 157–171. [Google Scholar] [PubMed]
- Clark, M.A.; Neighbors, C.J.; Wasserman, M.R.; Armstrong, G.F.; Drnach, M.L.; Howie, S.L.; Hawthorne, T.L. Strategies and cost of recruitment of middle-aged and older unmarried women in a cancer screening study. Cancer Epidemiol. Biomarkers Prev. 2007, 16, 2605–2614. [Google Scholar] [CrossRef] [PubMed]
- Gismondi, P.M.; Hamer, D.H.; Leka, L.S.; Dallal, G.; Fiatarone Singh, M.A.; Meydani, S.N. Strategies, time, and costs associated with the recruitment and enrollment of nursing home residents for a micronutrient supplementation clinical trial. J. Gerontol. A Biol. Sci. Med. Sci. 2005, 60, 1469–1474. [Google Scholar] [CrossRef] [PubMed]
- 2015–2020 Dietary Guidelines—Health.gov. Available online: https://health.gov/dietaryguidelines/2015/guidelines/ (accessed on 7 May 2019).
- Qin, Y.; Zhou, Y.; Chen, S.-H.; Zhao, X.-L.; Ran, L.; Zeng, X.-L.; Wu, Y.; Chen, J.-L.; Kang, C.; Shu, F.-R.; et al. Fish Oil Supplements Lower Serum Lipids and Glucose in Correlation with a Reduction in Plasma Fibroblast Growth Factor 21 and Prostaglandin E2 in Nonalcoholic Fatty Liver Disease Associated with Hyperlipidemia: A Randomized Clinical Trial. PLoS ONE 2015, 10, e0133496. [Google Scholar] [CrossRef] [PubMed]
- Yokoyama, M.; Origasa, H.; Matsuzaki, M.; Matsuzawa, Y.; Saito, Y.; Ishikawa, Y.; Oikawa, S.; Sasaki, J.; Hishida, H.; Itakura, H.; et al. Effects of eicosapentaenoic acid on major coronary events in hypercholesterolaemic patients (JELIS): A randomised open-label, blinded endpoint analysis. Lancet 2007, 369, 1090–1098. [Google Scholar] [CrossRef]
- Maki, K.C.; Palacios, O.M.; Bell, M.; Toth, P.P. Use of supplemental long-chain omega-3 fatty acids and risk for cardiac death: An updated meta-analysis and review of research gaps. J. Clin. Lipidol. 2017, 11, 1152–1160. [Google Scholar] [CrossRef]
- Alexander, D.D.; Miller, P.E.; Van Elswyk, M.E.; Kuratko, C.N.; Bylsma, L.C. A Meta-Analysis of Randomized Controlled Trials and Prospective Cohort Studies of Eicosapentaenoic and Docosahexaenoic Long-Chain Omega-3 Fatty Acids and Coronary Heart Disease Risk. Mayo Clin. Proc. 2017, 92, 15–29. [Google Scholar] [CrossRef]
- Nielsen, A.A.; Jørgensen, L.G.M.; Nielsen, J.N.; Eivindson, M.; Grønbaek, H.; Vind, I.; Hougaard, D.M.; Skogstrand, K.; Jensen, S.; Munkholm, P.; et al. Omega-3 fatty acids inhibit an increase of proinflammatory cytokines in patients with active Crohn’s disease compared with omega-6 fatty acids. Aliment. Pharmacol. Ther. 2005, 22, 1121–1128. [Google Scholar] [CrossRef]
- Shen, W.; Gaskins, H.R.; McIntosh, M.K. Influence of dietary fat on intestinal microbes, inflammation, barrier function and metabolic outcomes. J. Nutr. Biochem. 2014, 25, 270–280. [Google Scholar] [CrossRef]
- Kaliannan, K.; Wang, B.; Li, X.-Y.; Kim, K.-J.; Kang, J.X. A host-microbiome interaction mediates the opposing effects of omega-6 and omega-3 fatty acids on metabolic endotoxemia. Sci. Rep. 2015, 5, 11276. [Google Scholar] [CrossRef] [PubMed]
- Menni, C.; Zierer, J.; Pallister, T.; Jackson, M.A.; Long, T.; Mohney, R.P.; Steves, C.J.; Spector, T.D.; Valdes, A.M. Omega-3 fatty acids correlate with gut microbiome diversity and production of N-carbamylglutamate in middle aged and elderly women. Sci. Rep. 2017, 7, 11079. [Google Scholar] [CrossRef] [PubMed]
- Witte, A.V.; Kerti, L.; Hermannstädter, H.M.; Fiebach, J.B.; Schreiber, S.J.; Schuchardt, J.P.; Hahn, A.; Flöel, A. Long-chain omega-3 fatty acids improve brain function and structure in older adults. Cereb. Cortex 2014, 24, 3059–3068. [Google Scholar] [CrossRef]
- Shinto, L.; Quinn, J.; Montine, T.; Dodge, H.H.; Woodward, W.; Baldauf-Wagner, S.; Waichunas, D.; Bumgarner, L.; Bourdette, D.; Silbert, L.; et al. A randomized placebo-controlled pilot trial of omega-3 fatty acids and alpha lipoic acid in Alzheimer’s disease. J. Alzheimers Dis. 2014, 38, 111–120. [Google Scholar] [CrossRef] [PubMed]
- Bauer, I.; Hughes, M.; Rowsell, R.; Cockerell, R.; Pipingas, A.; Crewther, S.; Crewther, D. Omega-3 supplementation improves cognition and modifies brain activation in young adults. Hum. Psychopharmacol. 2014, 29, 133–144. [Google Scholar] [CrossRef] [PubMed]
- Kuroda, T.; Ohta, H.; Onoe, Y.; Tsugawa, N.; Shiraki, M. Intake of omega-3 fatty acids contributes to bone mineral density at the hip in a younger Japanese female population. Osteoporos. Int. 2017, 28, 2887–2891. [Google Scholar] [CrossRef] [PubMed]
- Mangano, K.M.; Kerstetter, J.E.; Kenny, A.M.; Insogna, K.L.; Walsh, S.J. An investigation of the association between omega 3 FA and bone mineral density among older adults: Results from the National Health and Nutrition Examination Survey years 2005–2008. Osteoporos. Int. 2014, 25, 1033–1041. [Google Scholar] [CrossRef] [PubMed]
- Koren, N.; Simsa-Maziel, S.; Shahar, R.; Schwartz, B.; Monsonego-Ornan, E. Exposure to omega-3 fatty acids at early age accelerate bone growth and improve bone quality. J. Nutr. Biochem. 2014, 25, 623–633. [Google Scholar] [CrossRef]
- Rodriguez-Santana, Y.; Ochoa, J.J.; Lara-Villoslada, F.; Kajarabille, N.; Saavedra-Santana, P.; Hurtado, J.A.; Peña, M.; Diaz-Castro, J.; Sebastian-Garcia, I.; Machin-Martin, E.; et al. Cytokine distribution in mothers and breastfed children after omega-3 LCPUFAs supplementation during the last trimester of pregnancy and the lactation period: A randomized, controlled trial. Prostaglandins Leukot. Essent. Fatty Acids 2017, 126, 32–38. [Google Scholar] [CrossRef]
- Brantsæter, A.L.; Englund-Ögge, L.; Haugen, M.; Birgisdottir, B.E.; Knutsen, H.K.; Sengpiel, V.; Myhre, R.; Alexander, J.; Nilsen, R.M.; Jacobsson, B.; et al. Maternal intake of seafood and supplementary long chain n-3 poly-unsaturated fatty acids and preterm delivery. BMC Pregnancy Childbirth 2017, 17, 41. [Google Scholar]
- Haghiac, M.; Yang, X.; Presley, L.; Smith, S.; Dettelback, S.; Minium, J.; Belury, M.A.; Catalano, P.M.; Hauguel-de Mouzon, S. Dietary Omega-3 Fatty Acid Supplementation Reduces Inflammation in Obese Pregnant Women: A Randomized Double-Blind Controlled Clinical Trial. PLoS ONE 2015, 10, e0137309. [Google Scholar] [CrossRef] [PubMed]
- Jedrychowski, W.; Perera, F.; Maugeri, U.; Mrozek-Budzyn, D.; Miller, R.L.; Flak, E.; Mroz, E.; Jacek, R.; Spengler, J.D. Effects of prenatal and perinatal exposure to fine air pollutants and maternal fish consumption on the occurrence of infantile eczema. Int. Arch. Allergy Immunol. 2011, 155, 275–281. [Google Scholar] [CrossRef] [PubMed]
- Burdge, G.C.; Calder, P.C. Dietary alpha-linolenic acid and health-related outcomes: A metabolic perspective. Nutr. Res. Rev. 2006, 19, 26–52. [Google Scholar] [CrossRef] [PubMed]
- Pawlosky, R.J.; Hibbeln, J.R.; Novotny, J.A.; Salem, N. Physiological compartmental analysis of alpha-linolenic acid metabolism in adult humans. J. Lipid Res. 2001, 42, 1257–1265. [Google Scholar] [PubMed]
- Hodson, L.; Skeaff, C.M.; Fielding, B.A. Fatty acid composition of adipose tissue and blood in humans and its use as a biomarker of dietary intake. Prog. Lipid Res. 2008, 47, 348–380. [Google Scholar] [CrossRef] [PubMed]
- Harris, W.S.; Von Schacky, C. The Omega-3 Index: A new risk factor for death from coronary heart disease? Prev. Med. 2004, 39, 212–220. [Google Scholar] [CrossRef] [PubMed]
- Harris, W.S.; Del Gobbo, L.; Tintle, N.L. The Omega-3 Index and relative risk for coronary heart disease mortality: Estimation from 10 cohort studies. Atherosclerosis 2017, 262, 51–54. [Google Scholar] [CrossRef] [PubMed]
- Bigornia, S.J.; Harris, W.S.; Falcón, L.M.; Ordovás, J.M.; Lai, C.-Q.; Tucker, K.L. The Omega-3 Index Is Inversely Associated with Depressive Symptoms among Individuals with Elevated Oxidative Stress Biomarkers. J. Nutr. 2016, 146, 758–766. [Google Scholar] [CrossRef] [PubMed]
- Van der Wurff, I.S.M.; von Schacky, C.; Berge, K.; Zeegers, M.P.; Kirschner, P.A.; de Groot, R.H.M. Association between Blood Omega-3 Index and Cognition in Typically Developing Dutch Adolescents. Nutrients 2016, 8, 13. [Google Scholar] [CrossRef]
- Ferguson, J.J.A.; Veysey, M.; Lucock, M.; Niblett, S.; King, K.; MacDonald-Wicks, L.; Garg, M.L. Association between omega-3 index and blood lipids in older Australians. J. Nutr. Biochem. 2016, 27, 233–240. [Google Scholar] [CrossRef]
- Meyer, B.J.; Byrne, M.K.; Collier, C.; Parletta, N.; Crawford, D.; Winberg, P.C.; Webster, D.; Chapman, K.; Thomas, G.; Dally, J.; et al. Baseline omega-3 index correlates with aggressive and attention deficit disorder behaviours in adult prisoners. PLoS ONE 2015, 10, e0120220. [Google Scholar]
- Parker, H.M.; O’Connor, H.T.; Keating, S.E.; Cohn, J.S.; Garg, M.L.; Caterson, I.D.; George, J.; Johnson, N.A. Efficacy of the Omega-3 Index in predicting non-alcoholic fatty liver disease in overweight and obese adults: A pilot study. Br. J. Nutr. 2015, 114, 780–787. [Google Scholar] [CrossRef] [PubMed]
- Sands, S.A.; Reid, K.J.; Windsor, S.L.; Harris, W.S. The impact of age, body mass index, and fish intake on the EPA and DHA content of human erythrocytes. Lipids 2005, 40, 343–347. [Google Scholar] [CrossRef] [PubMed]
- McBurney, M.I.; Bird, J.K. Impact of Biological Feedback and Incentives on Blood Fatty Acid Concentrations, Including Omega-3 Index, in an Employer-Based Wellness Program. Nutrients 2017, 9, 842. [Google Scholar] [CrossRef] [PubMed]
- Matusheski, N.; Marshall, K.; Hartunian-Sowa, S.; McBurney, M. Omega-3 Status among Family Physicians: A Catalyst for Increased Patient Recommendations. FASEB J. 2017, 31, 971.6. [Google Scholar]
- Harris, W.S.; Pottala, J.V.; Lacey, S.M.; Vasan, R.S.; Larson, M.G.; Robins, S.J. Clinical correlates and heritability of erythrocyte eicosapentaenoic and docosahexaenoic acid content in the Framingham Heart Study. Atherosclerosis 2012, 225, 425–431. [Google Scholar] [CrossRef] [PubMed]
- Parks, C.A.; Brett, N.R.; Agellon, S.; Lavery, P.; Vanstone, C.A.; Maguire, J.L.; Rauch, F.; Weiler, H.A. DHA and EPA in red blood cell membranes are associated with dietary intakes of omega-3-rich fish in healthy children. Prostaglandins Leukot. Essent. Fatty Acids 2017, 124, 11–16. [Google Scholar] [CrossRef]
- Jackson, K.H.; Polreis, J.M.; Tintle, N.L.; Kris-Etherton, P.M.; Harris, W.S. Association of reported fish intake and supplementation status with the omega-3 index. Prostaglandins Leukot. Essent. Fatty Acids 2019, 142, 4–10. [Google Scholar] [CrossRef]
- Molfino, A.; Amabile, M.I.; Mazzucco, S.; Biolo, G.; Farcomeni, A.; Ramaccini, C.; Antonaroli, S.; Monti, M.; Muscaritoli, M. Effect of Oral Docosahexaenoic Acid (DHA) Supplementation on DHA Levels and Omega-3 Index in Red Blood Cell Membranes of Breast Cancer Patients. Front. Physiol. 2017, 8, 549. [Google Scholar] [CrossRef]
- Bailey, R.L.; Miller, P.E.; Mitchell, D.C.; Hartman, T.J.; Lawrence, F.R.; Sempos, C.T.; Smiciklas-Wright, H. Dietary screening tool identifies nutritional risk in older adults. Am. J. Clin. Nutr. 2009, 90, 177–183. [Google Scholar] [CrossRef]
- Rifas-Shiman, S.L.; Willett, W.C.; Lobb, R.; Kotch, J.; Dart, C.; Gillman, M.W. PrimeScreen, a brief dietary screening tool: Reproducibility and comparability with both a longer food frequency questionnaire and biomarkers. Public Health Nutr. 2001, 4, 249–254. [Google Scholar] [CrossRef] [PubMed]
- Duffy, V.B.; Lanier, S.A.; Hutchins, H.L.; Pescatello, L.S.; Johnson, M.K.; Bartoshuk, L.M. Food preference questionnaire as a screening tool for assessing dietary risk of cardiovascular disease within health risk appraisals. J. Am. Diet Assoc. 2007, 107, 237–245. [Google Scholar] [CrossRef] [PubMed]
- Stratton, R.J.; Hackston, A.; Longmore, D.; Dixon, R.; Price, S.; Stroud, M.; King, C.; Elia, M. Malnutrition in hospital outpatients and inpatients: Prevalence, concurrent validity and ease of use of the “malnutrition universal screening tool” (‘MUST’) for adults. Br. J. Nutr. 2004, 92, 799–808. [Google Scholar] [CrossRef] [PubMed]
- Ferguson, M.; Capra, S.; Bauer, J.; Banks, M. Development of a valid and reliable malnutrition screening tool for adult acute hospital patients. Nutrition 1999, 15, 458–464. [Google Scholar] [CrossRef]
- Ritenbaugh, C.; Aickin, M.; Taren, D.; Teufel, N.; Graver, E.; Woolf, K.; Alberts, D.S. Use of a food frequency questionnaire to screen for dietary eligibility in a randomized cancer prevention phase III trial. Cancer Epidemiol. Biomarkers Prev. 1997, 6, 347–354. [Google Scholar] [PubMed]
- Kondrup, J.; Rasmussen, H.H.; Hamberg, O.; Stanga, Z.; Ad Hoc ESPEN Working Group. Nutritional risk screening (NRS 2002): A new method based on an analysis of controlled clinical trials. Clin. Nutr. 2003, 22, 321–336. [Google Scholar] [CrossRef]
- Subar, A.F. Developing dietary assessment tools. J. Am. Diet Assoc. 2004, 104, 769–770. [Google Scholar] [CrossRef] [PubMed]
- Kretser, A.; Murphy, D.; Starke-Reed, P. A partnership for public health: USDA branded food products database. J. Food Compost. Anal. 2017, 64, 10–12. [Google Scholar] [CrossRef]
- Cade, J.; Thompson, R.; Burley, V.; Warm, D. Development, validation and utilisation of food-frequency questionnaires—A review. Public Health Nutr. 2002, 5, 567–587. [Google Scholar] [CrossRef]
- Office of Dietary Supplements - Omega-3 Fatty Acids. Available online: https://ods.od.nih.gov/factsheets/Omega3FattyAcids-HealthProfessional/ (accessed on 7 May 2019).
- Kris-Etherton, P.M.; Harris, W.S.; Appel, L.J.; American Heart Association. Nutrition Committee Fish consumption, fish oil, omega-3 fatty acids, and cardiovascular disease. Circulation 2002, 106, 2747–2757. [Google Scholar] [CrossRef]
- Papanikolaou, Y.; Brooks, J.; Reider, C.; Fulgoni, V.L. U.S. adults are not meeting recommended levels for fish and omega-3 fatty acid intake: Results of an analysis using observational data from NHANES 2003–2008. Nutr. J. 2014, 13, 31. [Google Scholar] [CrossRef] [PubMed]
- Harris, W.S.; Polreis, J. Measurement of the Omega-3 Index in Dried Blood Spots. Ann. Clin. Res. 2016, 4. [Google Scholar] [CrossRef]
- Shiraishi, M.; Haruna, M.; Matsuzaki, M.; Murayama, R.; Sasaki, S. The biomarker-based validity of a brief-type diet history questionnaire for estimating eicosapentaenoic acid and docosahexaenoic acid intakes in pregnant Japanese women. Asia. Pac. J. Clin. Nutr. 2015, 24, 316–322. [Google Scholar] [PubMed]
- Brenna, J.T.; Salem, N.; Sinclair, A.J.; Cunnane, S.C. International Society for the Study of Fatty Acids and Lipids, ISSFAL alpha-Linolenic acid supplementation and conversion to n-3 long-chain polyunsaturated fatty acids in humans. Prostaglandins Leukot. Essent. Fatty Acids 2009, 80, 85–91. [Google Scholar] [CrossRef] [PubMed]
- Saunders, A.V.; Davis, B.C.; Garg, M.L. Omega-3 polyunsaturated fatty acids and vegetarian diets. Med. J. Aust. 2013, 199, S22–S26. [Google Scholar] [CrossRef]
- Rosell, M.S.; Lloyd-Wright, Z.; Appleby, P.N.; Sanders, T.A.B.; Allen, N.E.; Key, T.J. Long-chain n-3 polyunsaturated fatty acids in plasma in British meat-eating, vegetarian, and vegan men. Am. J. Clin. Nutr. 2005, 82, 327–334. [Google Scholar] [CrossRef] [PubMed]
- Welch, A.A.; Shakya-Shrestha, S.; Lentjes, M.A.H.; Wareham, N.J.; Khaw, K.-T. Dietary intake and status of n-3 polyunsaturated fatty acids in a population of fish-eating and non-fish-eating meat-eaters, vegetarians, and vegans and the product-precursor ratio [corrected] of α-linolenic acid to long-chain n-3 polyunsaturated fatty acids: Results from the EPIC-Norfolk cohort. Am. J. Clin. Nutr. 2010, 92, 1040–1051. [Google Scholar]
- Nakamura, M.T.; Nara, T.Y. Structure, function, and dietary regulation of delta6, delta5, and delta9 desaturases. Annu. Rev. Nutr. 2004, 24, 345–376. [Google Scholar] [CrossRef]
- Köhler, A.; Sarkkinen, E.; Tapola, N.; Niskanen, T.; Bruheim, I. Bioavailability of fatty acids from krill oil, krill meal and fish oil in healthy subjects—A randomized, single-dose, cross-over trial. Lipids Health Dis. 2015, 14, 19. [Google Scholar] [CrossRef]
- Yurko-Mauro, K.; Kralovec, J.; Bailey-Hall, E.; Smeberg, V.; Stark, J.G.; Salem, N. Similar eicosapentaenoic acid and docosahexaenoic acid plasma levels achieved with fish oil or krill oil in a randomized double-blind four-week bioavailability study. Lipids Health Dis. 2015, 14, 99. [Google Scholar] [CrossRef]
- Ulven, S.M.; Kirkhus, B.; Lamglait, A.; Basu, S.; Elind, E.; Haider, T.; Berge, K.; Vik, H.; Pedersen, J.I. Metabolic effects of krill oil are essentially similar to those of fish oil but at lower dose of EPA and DHA, in healthy volunteers. Lipids 2011, 46, 37–46. [Google Scholar] [CrossRef] [PubMed]
- Ramprasath, V.R.; Eyal, I.; Zchut, S.; Jones, P.J.H. Enhanced increase of omega-3 index in healthy individuals with response to 4-week n-3 fatty acid supplementation from krill oil versus fish oil. Lipids Health Dis. 2013, 12, 178. [Google Scholar] [CrossRef] [PubMed]
- Sung, H.H.; Sinclair, A.J.; Lewandowski, P.A.; Su, X.Q. Postprandial long-chain n-3 polyunsaturated fatty acid response to krill oil and fish oil consumption in healthy women: A randomised controlled, single-dose, crossover study. Asia. Pac. J. Clin. Nutr. 2018, 27, 148–157. [Google Scholar] [PubMed]
- Cicero, A.F.; Colletti, A. Krill oil: Evidence of a new source of polyunsaturated fatty acids with high bioavailability. Clin. Lipidol. 2015, 10, 1–4. [Google Scholar] [CrossRef]
- Swierk, M.; Williams, P.G.; Wilcox, J.; Russell, K.G.; Meyer, B.J. Validation of an Australian electronic food frequency questionnaire to measure polyunsaturated fatty acid intake. Nutrition 2011, 27, 641–646. [Google Scholar] [CrossRef] [PubMed][Green Version]
- Ingram, M.A.; Stonehouse, W.; Russell, K.G.; Meyer, B.J.; Kruger, R. The New Zealand PUFA semiquantitative food frequency questionnaire is a valid and reliable tool to assess PUFA intakes in healthy New Zealand adults. J. Nutr. 2012, 142, 1968–1974. [Google Scholar] [CrossRef] [PubMed]


| Low Intake (n = 51) 2 | Medium Intake (n = 8) 3 | High Intake (n = 49) 4 | |
|---|---|---|---|
| Age (years) | 37.2 (8.8) | 40.5 (8.3) | 39.8 (9.9) |
| Gender | |||
| Male | 16 (31%) | 1 (13%) | 21 (43%) |
| Female | 35 (69%) | 7 (88%) | 28 (57%) |
| Race/Ethnicity | |||
| Non-Hispanic white | 33 (65%) | 3 (38%) | 28 (57%) |
| African American | 15 (29%) | 4 (50%) | 13 (26%) |
| Asian American | 1 (2%) | 0 (0%) | 4 (8%) |
| Other 5 | 2 (4%) | 1 (13%) | 4 (8%) |
| Marital status | |||
| Single | 27 (53%) | 5 (63%) | 19 (39%) |
| Married | 19 (37%) | 3 (38%) | 25 (51%) |
| Separated or divorced | 5 (10%) | 0 (0%) | 5 (10%) |
| Education | |||
| High school or trade school | 6 (12%) | 1 (13%) | 6 (12%) |
| College | 25 (49%) | 1 (13%) | 22 (45%) |
| Graduate school | 20 (39%) | 6 (75%) | 21 (43%) |
| BMI (kg/m2) 6 | |||
| Self-report (n = 108) | 24.7 (3.8) | 23.7 (3.0) | 25.3 (3.2) |
| Actual (n = 75) | 25.8 (4.2) | 22.6 (3.8) | 25.6 (3.9) |
| Self-reported intake (g/week) | |||
| EPA † | 0.013 (0.049) | 0.52 (0.37) | 4.5 (3.1) *** |
| DHA † | 0.025 (0.074) | 1.0 (0.58) | 4.3 (2.1) *** |
| EPA + DHA † | 0.038 (0.11) | 1.5 (0.93) | 8.6 (4.7) *** |
| Blood level (weight% from the whole fatty acids) | |||
| EPA † | 0.39 (0.15) | 0.54 (0.20) | 1.2 (0.52) *** |
| DHA † | 2.2 (0.61) | 2.9 (0.49) | 3.5 (0.8) *** |
| Omega-3 index | |||
| ≤4% † | 21 (41%) | 0 (0%) | 0 *** |
| 4–5.5% † | 26 (51%) | 7 (88%) | 10 (20%) *** |
| ≥5.5% † | 4 (8%) | 1 (13%) | 39 (80%) *** |
| Omega-6:Omega-3 † | 9.6 (1.8) | 7.5 (1.2) | 5.9 (1.3) *** |
| Food Item | Number of People Reported any Intake | Averaged Servings Consumed per Week (Servings) 1 | Averaged EPA Content per Serving 2 | Averaged DHA Content per Serving 2 | |
|---|---|---|---|---|---|
| Mean | Range | (g/Serving) | (g/Serving) | ||
| Seafood | |||||
| Bass, seabass | 4 | 1.69 | 0.75–3 | 0.175 | 0.473 |
| Catfish, farmed | 1 | 1 | na 3 | 0.042 | 0.109 |
| Clams | 2 | 0.32 | 0.3–0.33 | 0.117 | 0.124 |
| Cod | 7 | 1.3 | 0.33–3 | 0.003 | 0.131 |
| Crab | 7 | 2.88 | 0.33–16 | 0.251 | 0.1 |
| Flounder | 5 | 1.22 | 0.5–3 | 0.207 | 0.219 |
| Halibut | 1 | 0.25 | na | 0.077 | 0.318 |
| Herring, canned | 2 | 0.75 | 0.5–1 | 0.825 | 1.002 |
| Grouper | 1 | 0.5 | na | 0.03 | 0.181 |
| Lobster | 2 | 0.63 | 0.25–1 | 0.29 | 0.118 |
| Mackerel, canned | 4 | 3.08 | 1.33–6 | 0.369 | 0.677 |
| Mahi Mahi | 1 | 1 | na | 0.022 | 0.096 |
| Oyster, farmed | 2 | 0.5 | 0.5–0.5 | 0.195 | 0.179 |
| Porgy | 1 | 0.25 | na | 0.088 | 0.451 |
| Salmon 4 | |||||
| Canned | 3 | 1.21 | 0.67–1.67 | 0.402 | 0.597 |
| Steak | 43 | 1.92 | 0.25–6.67 | 0.341–0.587 | 0.595–1.238 |
| Sardine, canned | 5 | 1.02 | 0.67–2 | 0.402 | 0.433 |
| Scallop | 1 | 1.33 | na | 0.141 | 0.169 |
| Shrimp | 17 | 1.73 | 0.25–5 | 0.145 | 0.122 |
| Snapper | 1 | 1 | na | 0.041 | 0.232 |
| Tilapia | 11 | 1.62 | 0.5–4 | 0.004 | 0.111 |
| Trout, rainbow, farmed | 6 | 0.7 | 0.25–2 | 0.284 | 0.697 |
| Tuna 4 | |||||
| Canned, albacore or white | 35 | 1.54 | 0.25–8.33 | 0.198 | 0.535 |
| Steak | 6 | 0.74 | 0.33–1.33 | 0.04–0.309 | 0.19–0.97 |
| Fortified food | |||||
| DHA fortified eggs 5 | 5 | 6.5 | 1.5–12 | 0 | 0.075 |
| DHA fortified milk | 4 | 2.1 | 1–3.5 | 0 | 0.032 |
| Self-Reported EPA Intake | Self-Reported DHA Intake | Self-Reported EPA + DHA Intake | EPA Level in the Blood | DHA Level in the Blood | Omega-3 Index | |
|---|---|---|---|---|---|---|
| Self-reported EPA intake | 1 | |||||
| Self-reported DHA intake | 0.82 *** | 1 | ||||
| Self-reported EPA + DHA intake | 0.96 *** | 0.95 *** | 1 | |||
| EPA level in the blood | 0.67 *** | 0.67 *** | 0.68 *** | 1 | ||
| DHA level in the blood | 0.51 *** | 0.62 *** | 0.59 *** | 0.71 *** | 1 | |
| Omega-3 index | 0.62 *** | 0.69 *** | 0.67 *** | 0.87 *** | 0.96 *** | 1 |
| EPA | DHA | Omega-3 Index | |
|---|---|---|---|
| β (95% CI) | β (95% CI) | β (95% CI) | |
| Self-reported intake | |||
| Crude | 0.12 (0.09, 0.15) | 0.23 (0.17, 0.29) | 0.20 (0.16, 0.24) |
| Adjusted 1 | 0.12 (0.10, 0.15) | 0.25 (0.19, 0.30) | 0.20 (0.16, 0.24) |
| Reported Intake | Sensitivity | Specificity | Positive Predictive Value | Negative Predictive Value | Agreement | Kappa |
|---|---|---|---|---|---|---|
| (95% CI) | (95% CI) | (95% CI) | (95% CI) | (95% CI) | (95% CI) | |
| Low | 100% (100%, 100%) | 66% (53%, 78%) | 41% (32%, 50%) | 100% (100%, 100%) | 72% (64%, 81%) | 0.42 (0.28, 0.57) |
| High | 89% (79%, 99%) | 84% (75%, 94%) | 80% (72%, 87%) | 92% (86%, 97%) | 86% (80%, 93%) | 0.72 (0.59, 0.85) |
© 2019 by the authors. Licensee MDPI, Basel, Switzerland. This article is an open access article distributed under the terms and conditions of the Creative Commons Attribution (CC BY) license (http://creativecommons.org/licenses/by/4.0/).
Share and Cite
Shen, W.; Weaver, A.M.; Salazar, C.; Samet, J.M.; Diaz-Sanchez, D.; Tong, H. Validation of a Dietary Questionnaire to Screen Omega-3 Fatty Acids Levels in Healthy Adults. Nutrients 2019, 11, 1470. https://doi.org/10.3390/nu11071470
Shen W, Weaver AM, Salazar C, Samet JM, Diaz-Sanchez D, Tong H. Validation of a Dietary Questionnaire to Screen Omega-3 Fatty Acids Levels in Healthy Adults. Nutrients. 2019; 11(7):1470. https://doi.org/10.3390/nu11071470
Chicago/Turabian StyleShen, Wan, Anne M. Weaver, Claudia Salazar, James M. Samet, David Diaz-Sanchez, and Haiyan Tong. 2019. "Validation of a Dietary Questionnaire to Screen Omega-3 Fatty Acids Levels in Healthy Adults" Nutrients 11, no. 7: 1470. https://doi.org/10.3390/nu11071470
APA StyleShen, W., Weaver, A. M., Salazar, C., Samet, J. M., Diaz-Sanchez, D., & Tong, H. (2019). Validation of a Dietary Questionnaire to Screen Omega-3 Fatty Acids Levels in Healthy Adults. Nutrients, 11(7), 1470. https://doi.org/10.3390/nu11071470