Macronutrient Intake in Soccer Players—A Meta-Analysis


Abstract
1. Introduction
2. Methods
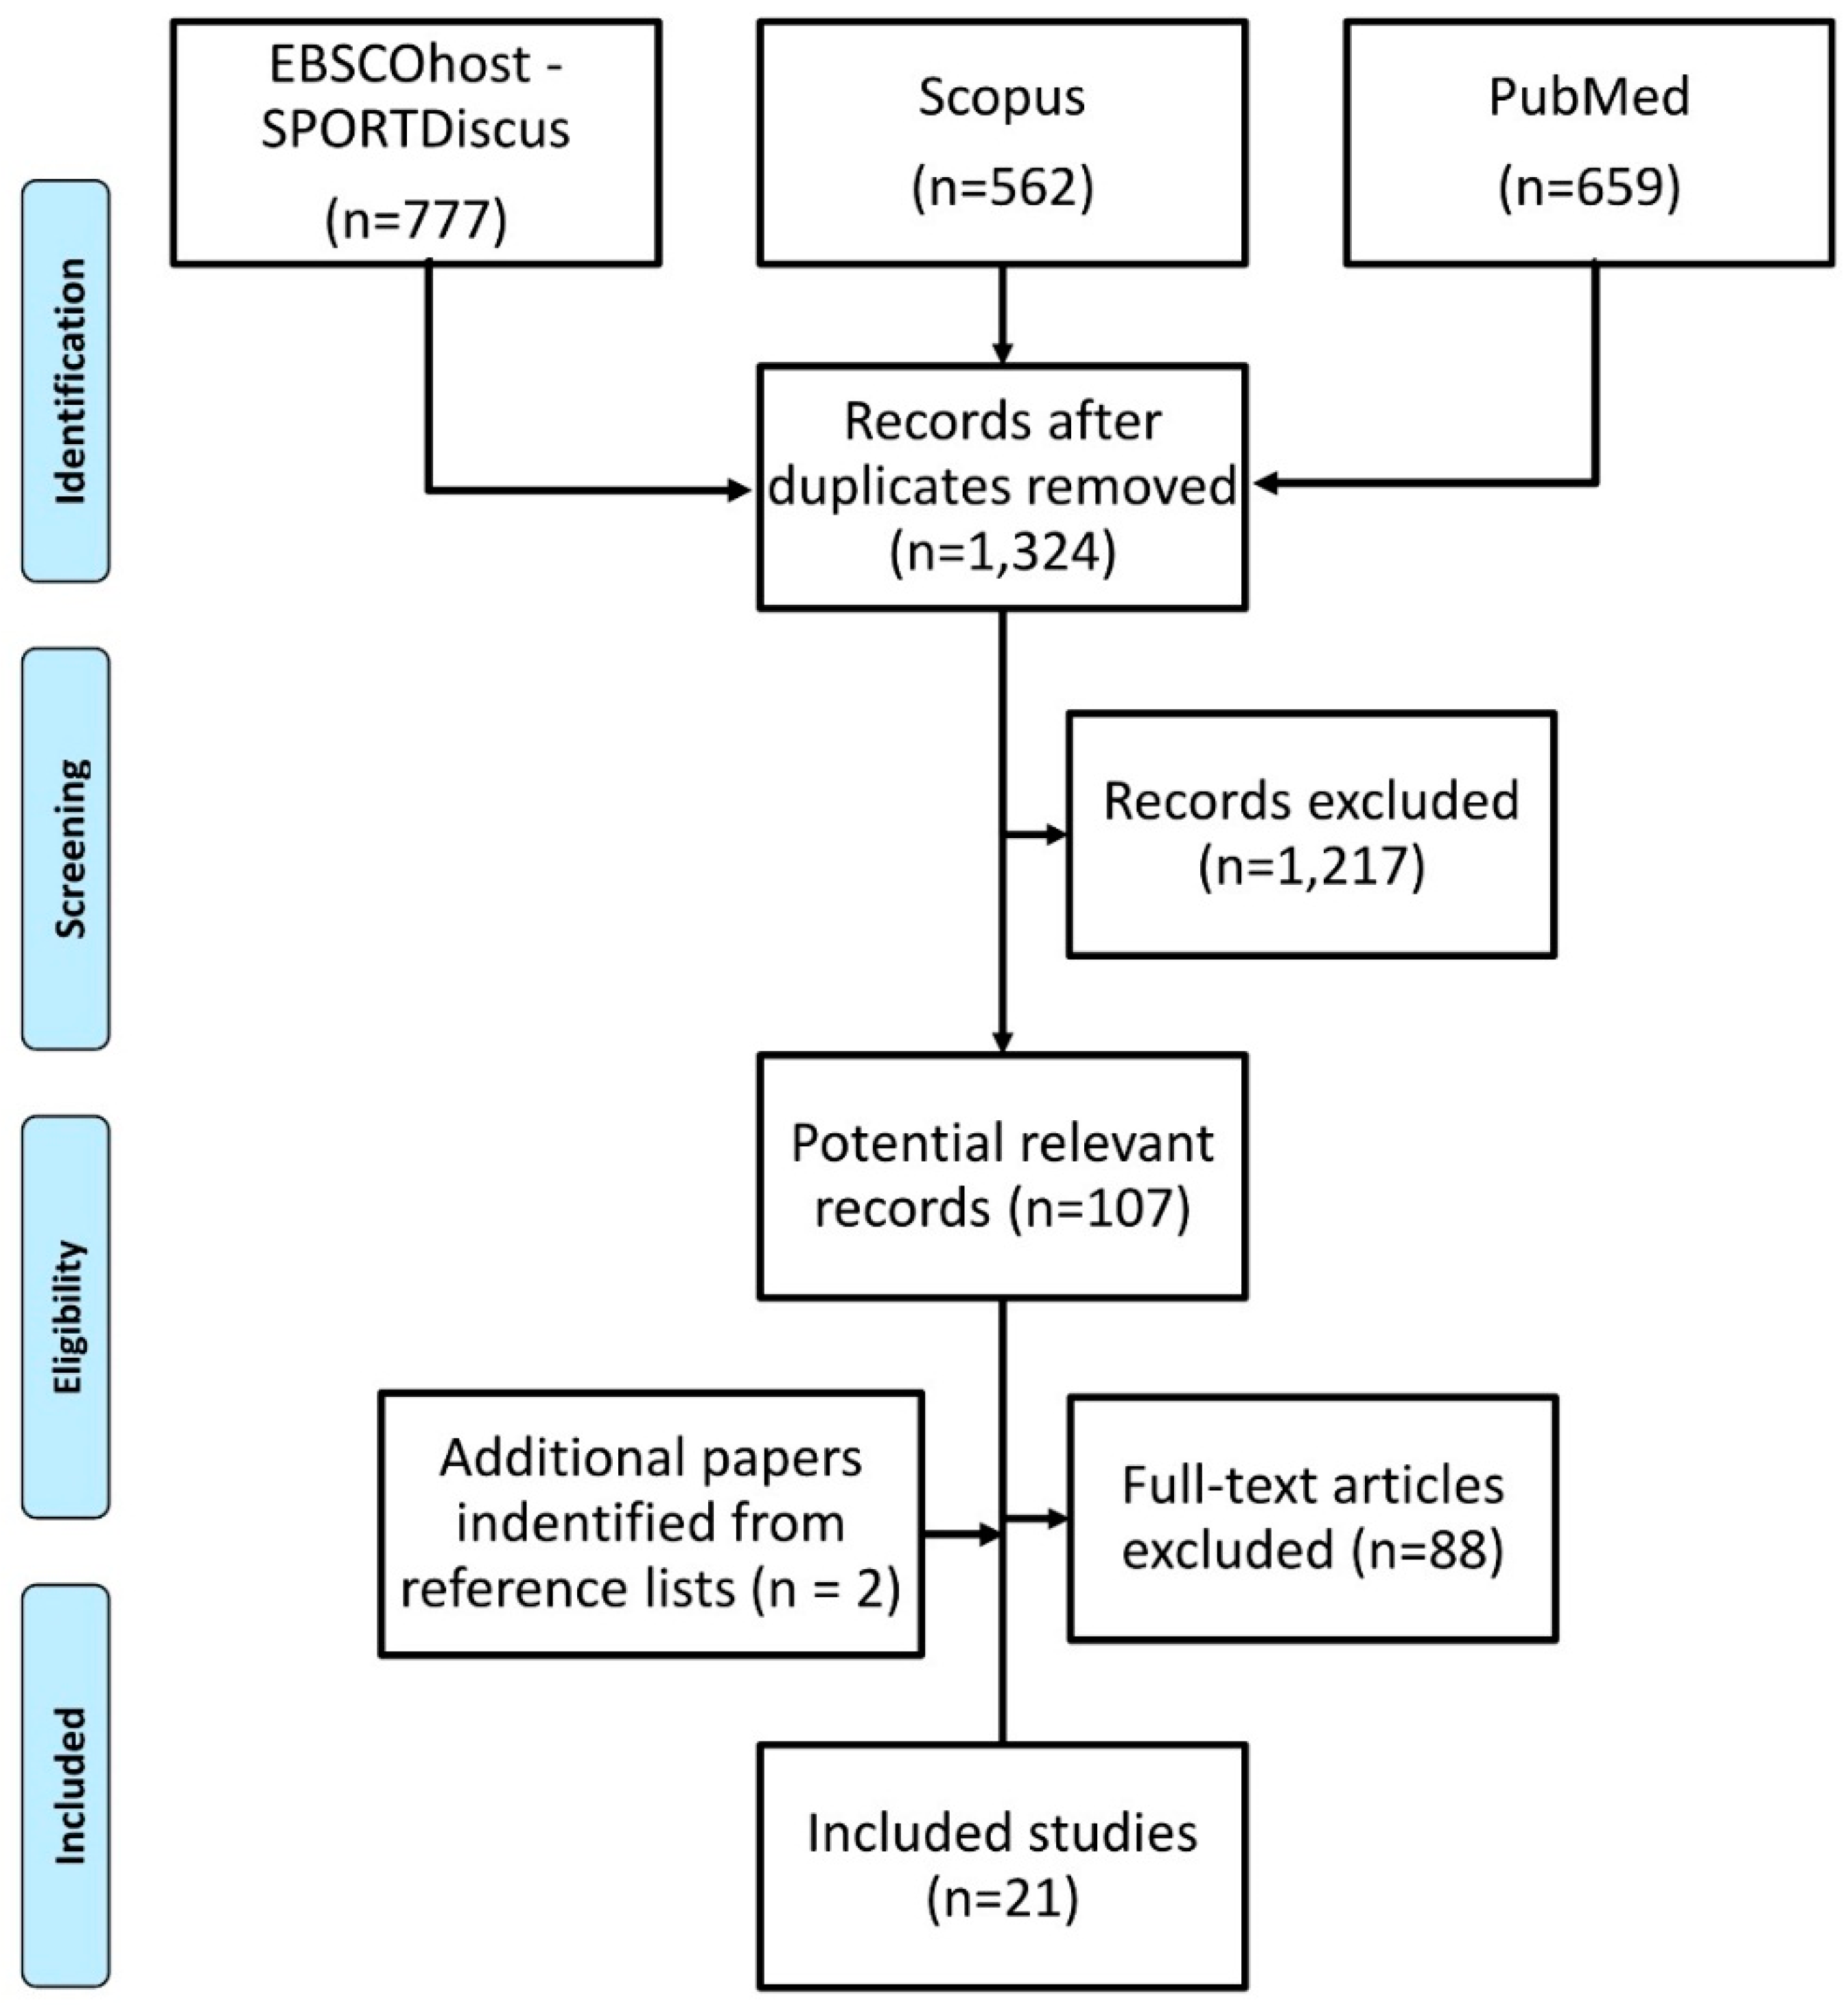
2.1. Search Strategy
2.2. Inclusion Criteria
2.3. Data Collection and Quality Assessment
2.4. Calculation of Weighted Averages Nutritional Intake
3. Results
3.1. Description of Studies and Study Population
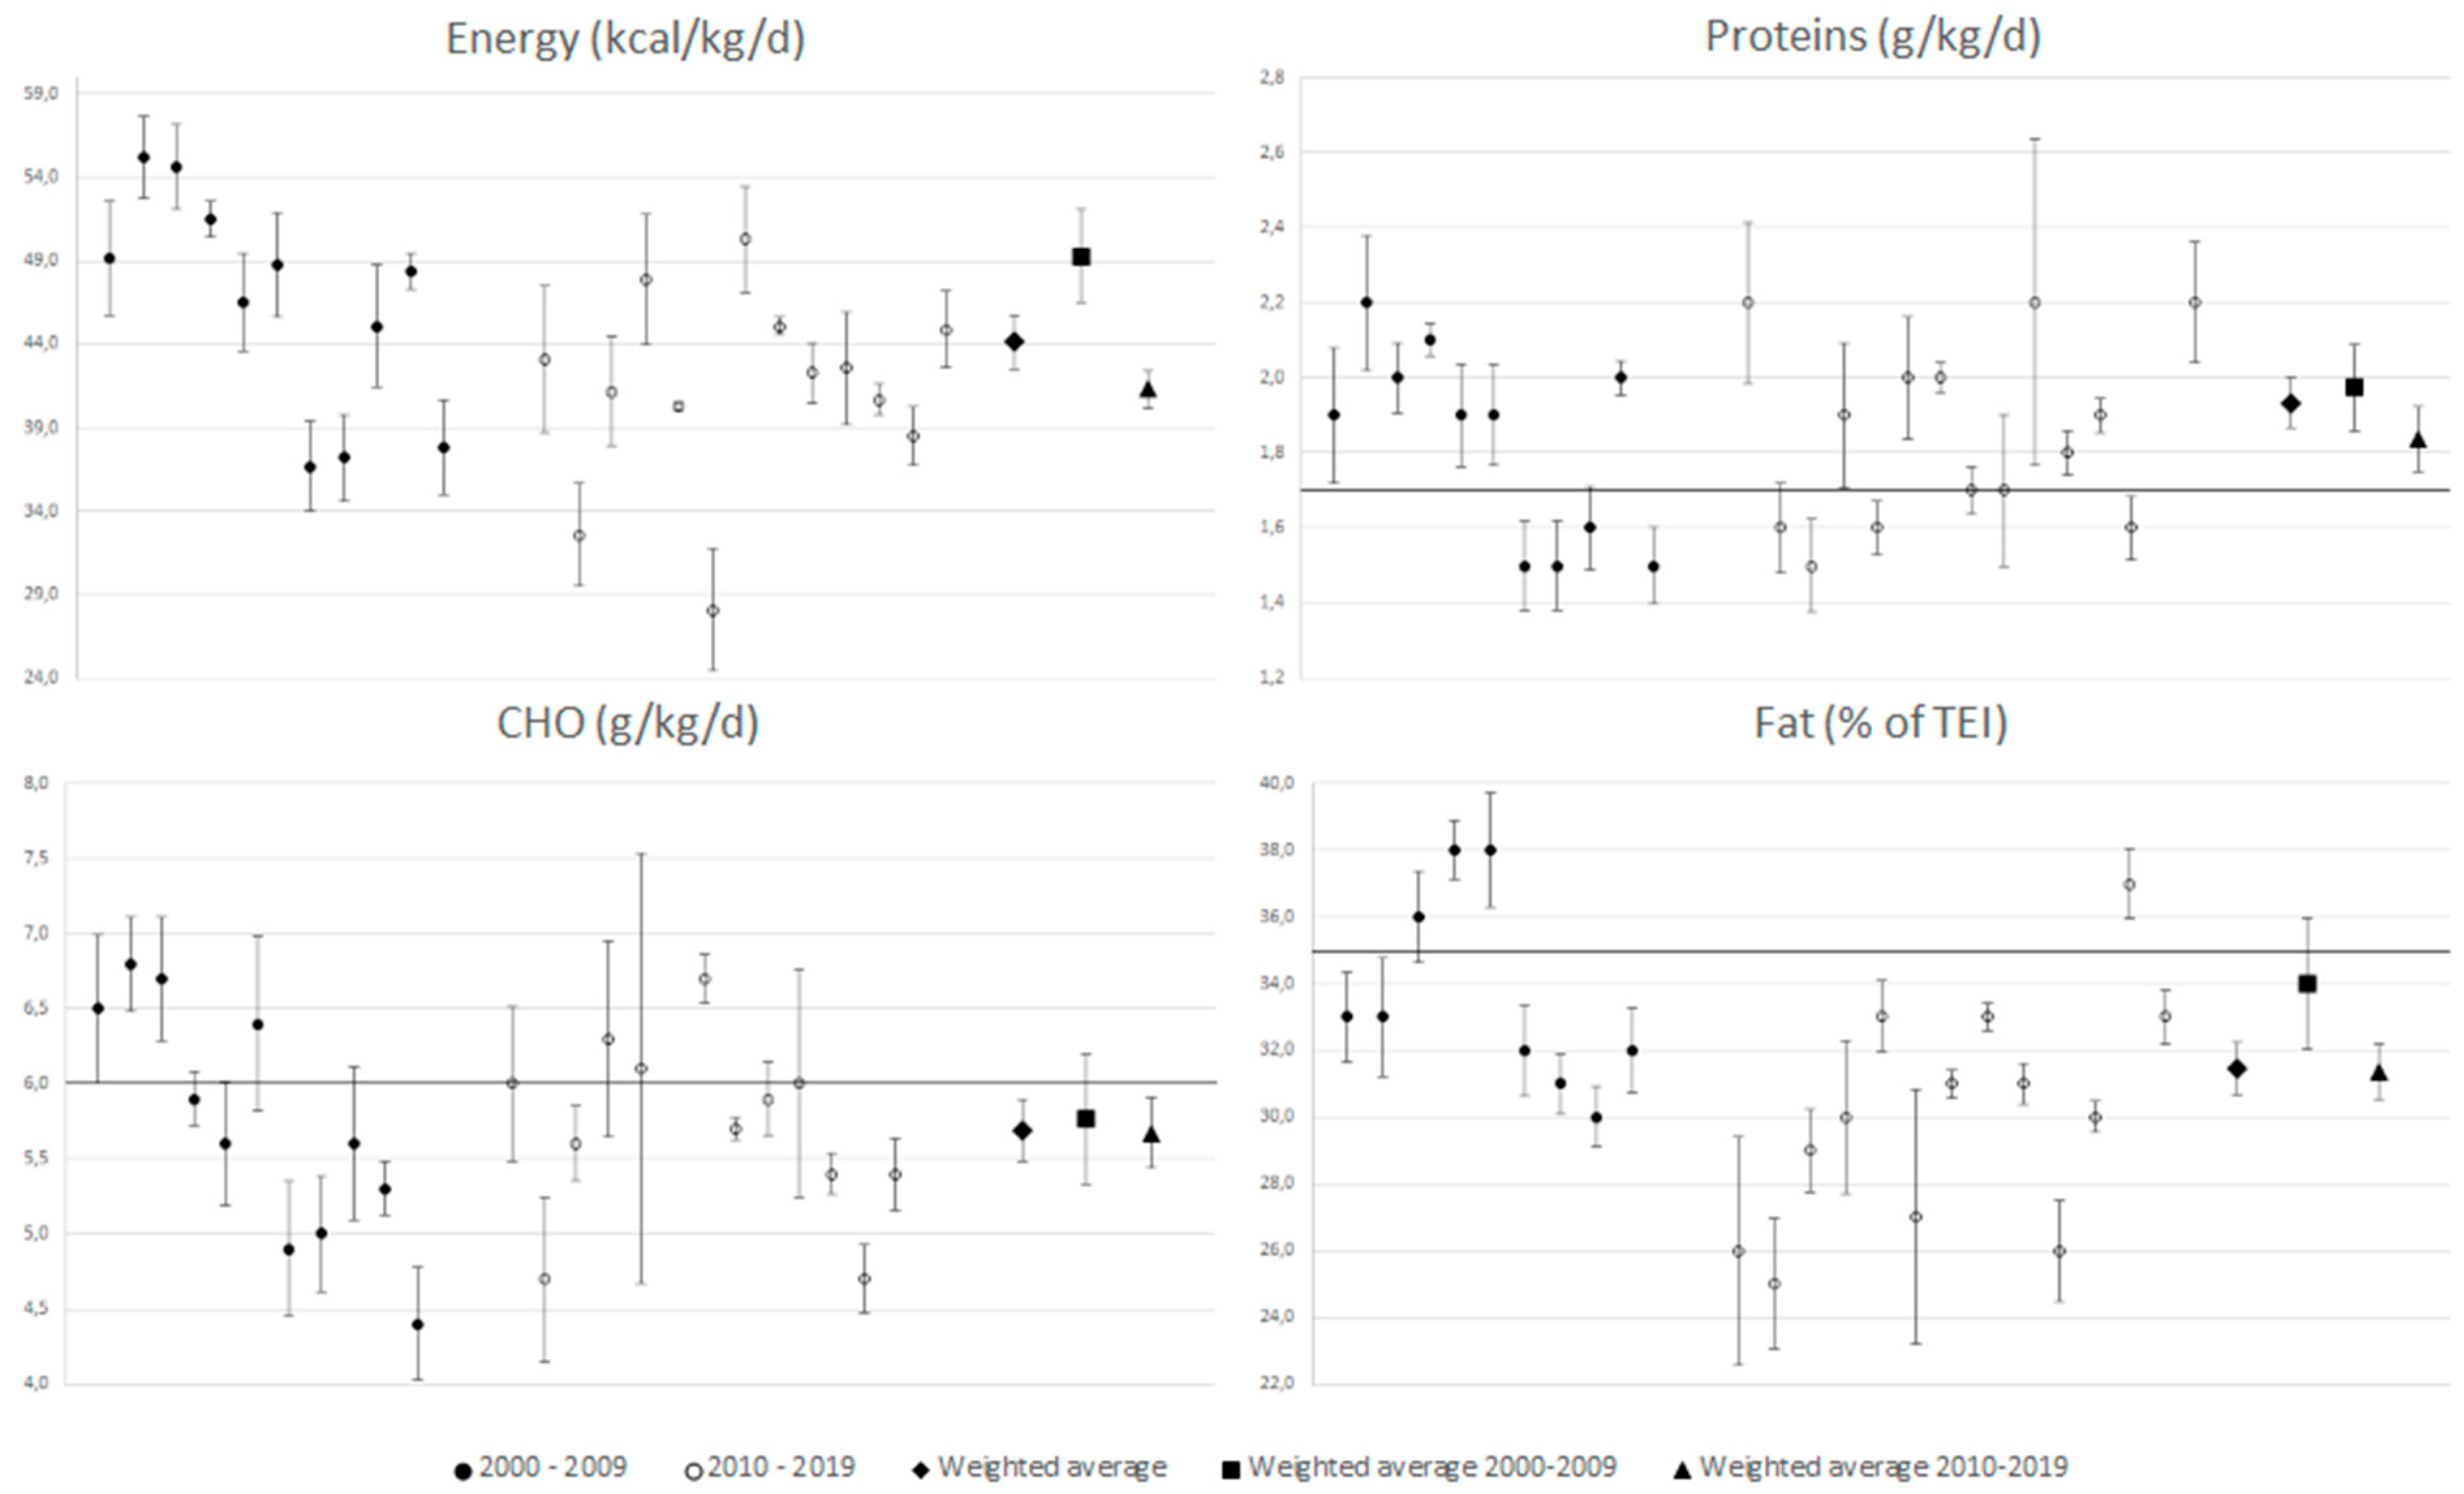
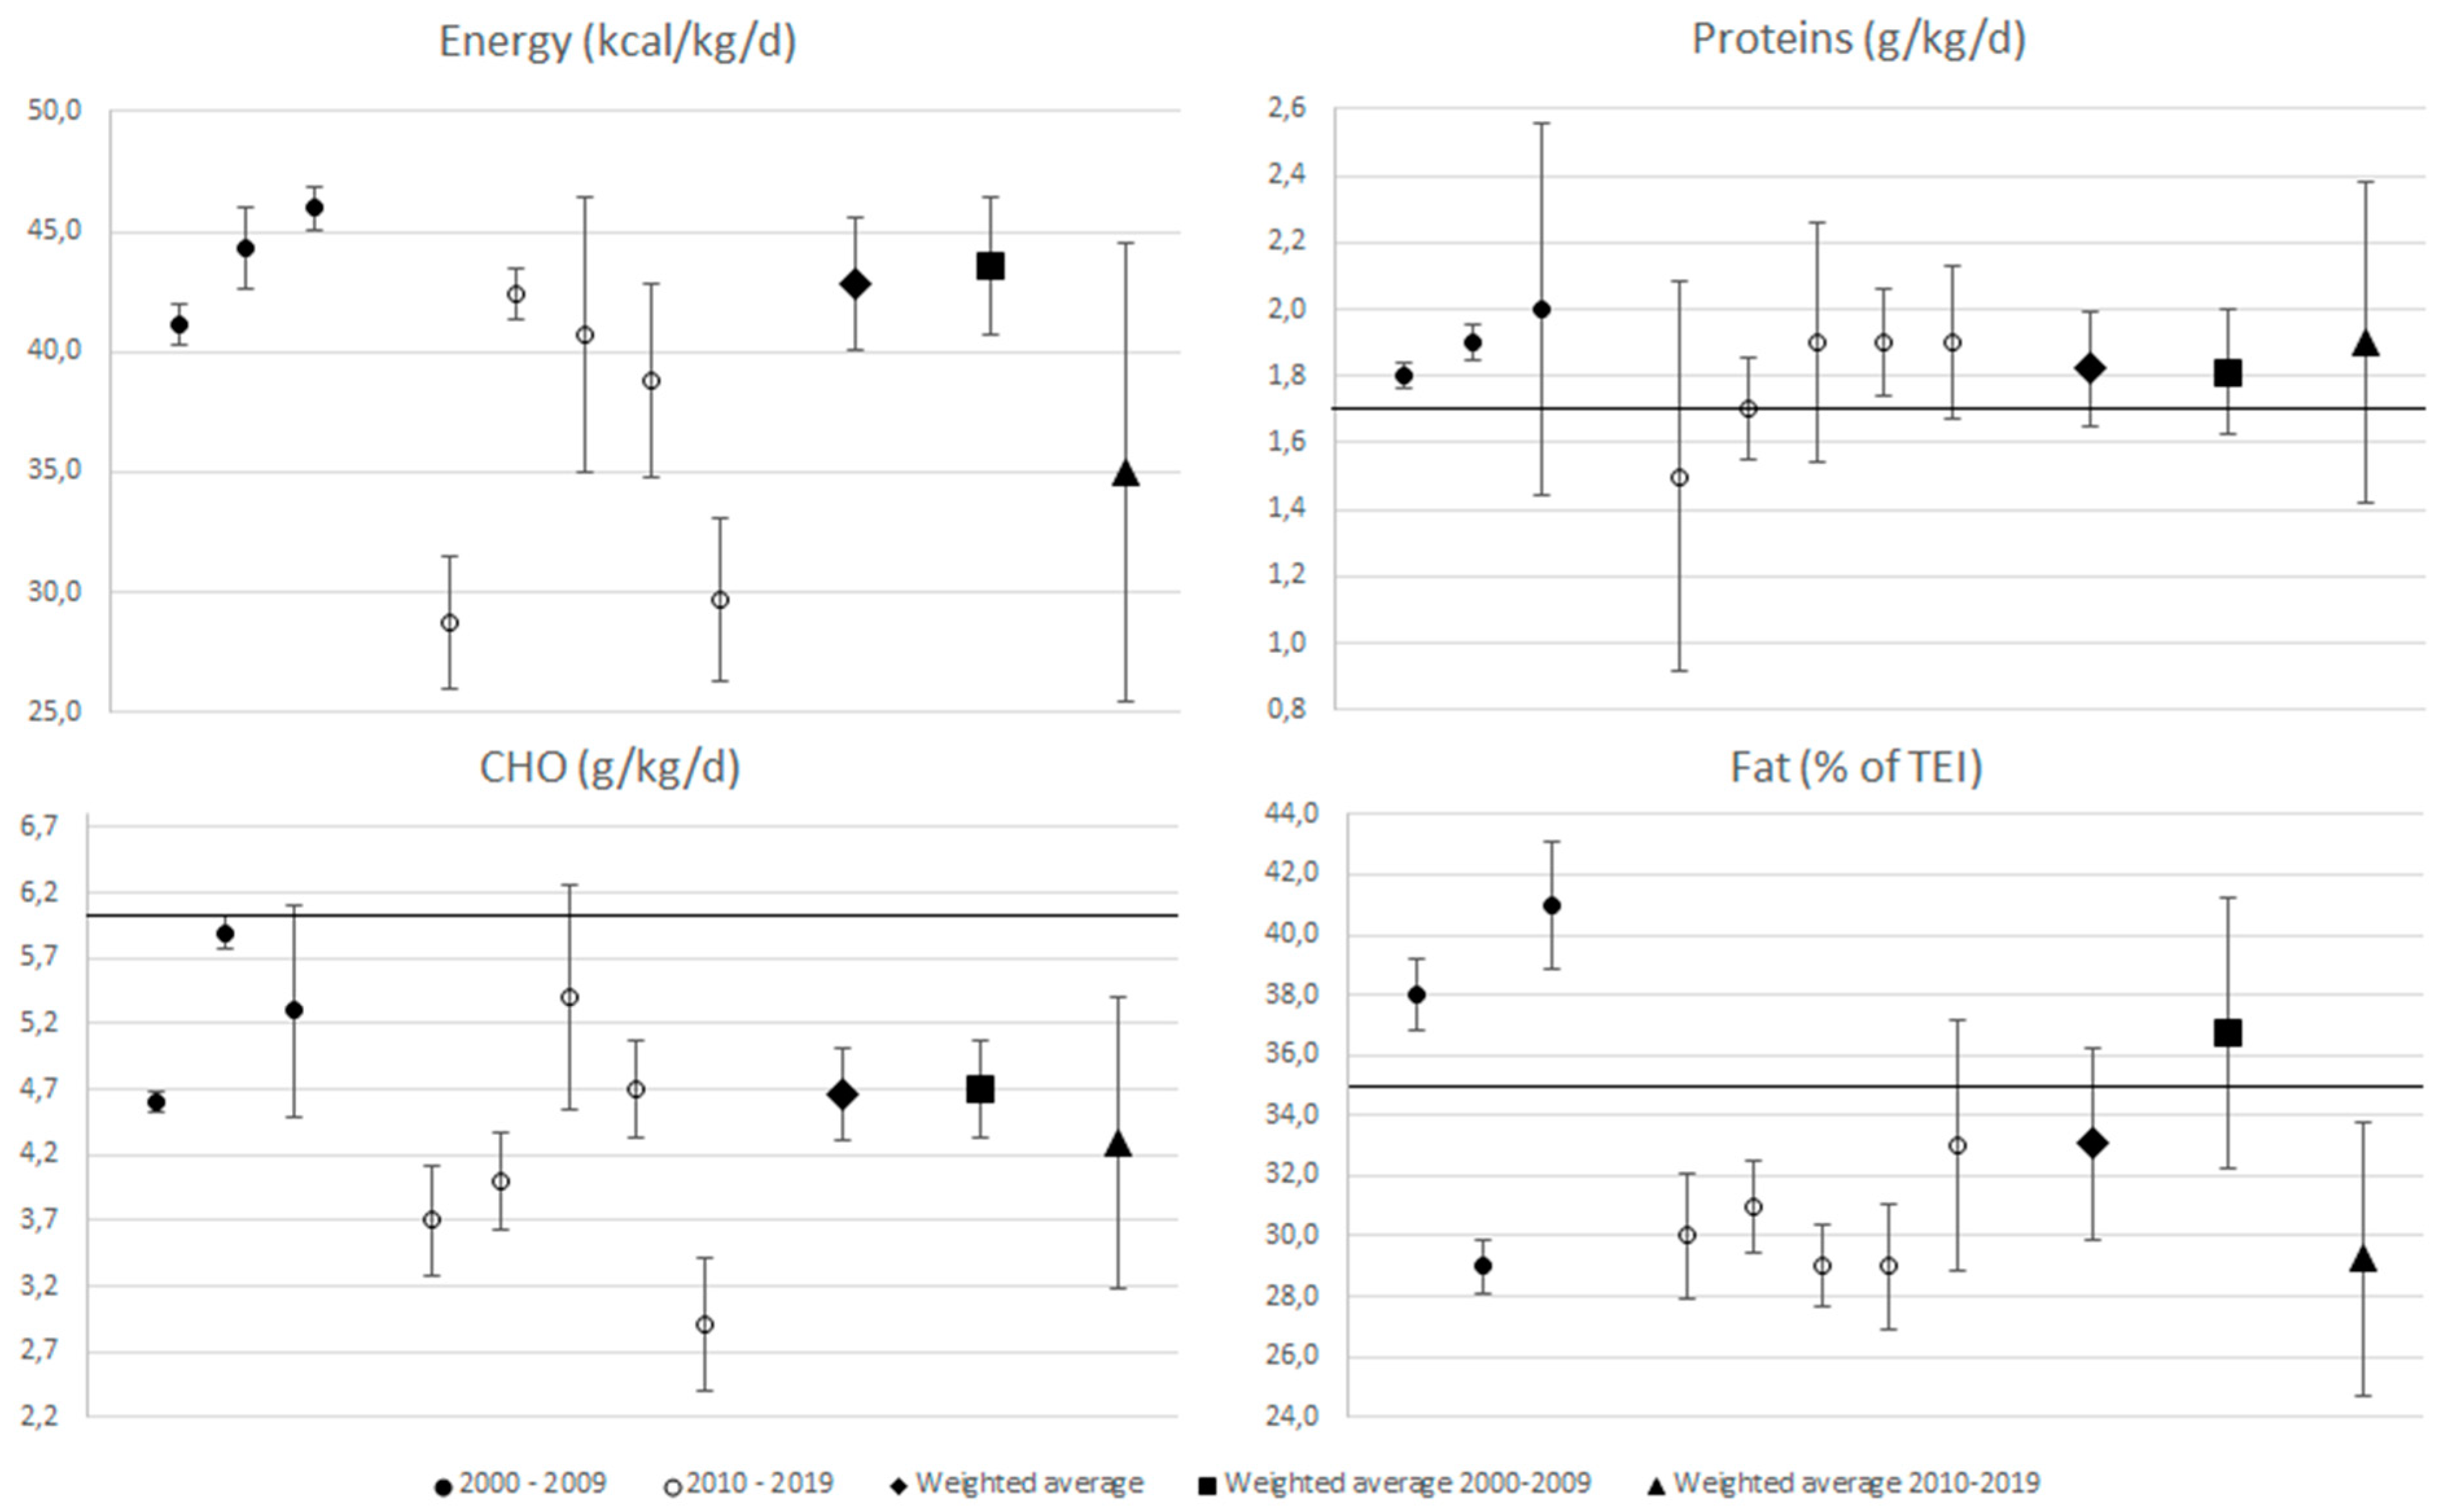
3.2. Dietary Intake in Individual Groups
3.3. Meta-Analysis
4. Discussion
Limitations
5. Conclusions
Author Contributions
Funding
Acknowledgments
Conflicts of Interest
References
- Giulianotti, R.R.; Robertson, R. The globalization of football: A study in the glocalization of the ‘serious life’. Br. J. Sociol. 2004, 55, 545–568. [Google Scholar] [CrossRef] [PubMed]
- Di Salvo, V.; Gregson, W.; Atkinson, G.; Tordoff, P.; Drust, B. Analysis of high intensity activity in Premier League soccer. Int. J. Sports Med. 2009, 30, 205–212. [Google Scholar] [CrossRef] [PubMed]
- García, P.M.R.; García-Zapico, P.; Patterson, Á.M.; Iglesias-Gutiérrez, E. Nutrient intake and food habits of soccer players: Analyzing the correlates of eating practice. Nutrients 2014, 6, 2697–2717. [Google Scholar] [CrossRef] [PubMed]
- Oliveira, C.C.; Ferreira, D.; Caetano, C.; Granja, D.; Pinto, R.; Mendes, B.; Sousa, M. Nutrition and Supplementation in Soccer. Sports 2017, 5, 28. [Google Scholar] [CrossRef] [PubMed]
- Thein, L.A.; Thein, J.M.; Landry, G.L. Ergogenic aids. Physical. Ther. 1995, 75, 426–439. [Google Scholar] [CrossRef]
- Applegate, E. Effective nutritional ergogenic aids. Int. J. Sport Nutr. 1999, 9, 229–239. [Google Scholar] [CrossRef]
- Kerksick, C.M.; Wilborn, C.D.; Roberts, M.D.; Smith-Ryan, A.; Kleiner, S.M.; Jager, R.; Collins, R.; Cooke, M.; Davis, J.N.; Galvan, E.; et al. ISSN exercise & sports nutrition review update: Research & recommendations. J. Int. Soc. Sports Nutr. 2018, 15, 38. [Google Scholar] [PubMed]
- Thomas, D.T.; Erdman, K.A.; Burke, L.M. Position of the Academy of Nutrition and Dietetics, Dietitians of Canada, and the American College of Sports Medicine: Nutrition and Athletic Performance. J. Acad. Nutr. Diet. 2016, 116, 501–528. [Google Scholar] [CrossRef] [PubMed]
- Burke, L.M. Energy needs of athletes. Can. J. Appl. Physiol. 2001, 26, S202–S219. [Google Scholar] [CrossRef]
- Shephard, R.J.; Leatt, P. Carbohydrate and fluid needs of the soccer player. Sports Med. 1987, 4, 164–176. [Google Scholar] [CrossRef]
- Hawley, J.A.; Dennis, S.C.; Noakes, T.D. Carbohydrate, fluid, and electrolyte requirements of the soccer player: A review. Int. J. Sport Nutr. 1994, 4, 221–236. [Google Scholar] [CrossRef] [PubMed]
- Williams, C. Carbohydrate intake and recovery from exercise. Sci. Sport 2004, 19, 239–244. [Google Scholar] [CrossRef]
- Maughan, R.J.; Burke, L.M. Diets for soccer player during training and competition. Sci. Sport 1999, 14, 227–232. [Google Scholar] [CrossRef]
- Phillips, S.M. Carbohydrate supplementation and prolonged intermittent high-intensity exercise in adolescents. Sports Med. 2012, 42, 817–828. [Google Scholar] [CrossRef] [PubMed]
- Folli, S. Nutrition and football. Rev. Med. Suisse 2001, 59, 1539–1546. [Google Scholar]
- Lemon, P.W.R. Protein requirements of soccer. J. Sports Sci. 1994, 12, S17–S22. [Google Scholar] [CrossRef] [PubMed]
- Bar-Or, O.; Unnithan, V.B. Nutritional requirements of young soccer players. J. Sports Sci. 1994, 12, S39–S42. [Google Scholar] [CrossRef]
- Hargreaves, M. Carbohydrate and lipid requirements of soccer. J. Sports Sci. 1994, 12, S13–S16. [Google Scholar] [CrossRef]
- Clark, K. Nutritional guidance to soccer players for training and competition. J. Sports Sci. 1994, 12, S43–S50. [Google Scholar] [CrossRef]
- Burke, L.M.; Hawley, J.A.; Wong, S.H.; Jeukendrup, A.E. Carbohydrates for training and competition. J. Sports Sci. 2011, 29, S17–S27. [Google Scholar] [CrossRef]
- American Dietetic Association; Dietitians of Canada; American College of Sports Medicine; Rodriguez, N.R.; Di Marco, N.M.; Langley, S. American College of Sports Medicine position stand. Nutrition and athletic performance. Med. Sci. Sports Exerc. 2009, 41, 709–731. [Google Scholar] [PubMed]
- Thomas, D.T.; Erdman, K.A.; Burke, L.M. American College of Sports Medicine joint position statement. Nutrition and athletic performance. Med. Sci. Sports Exerc. 2016, 48, 543–568. [Google Scholar] [PubMed]
- Kerksick, C.M.; Arent, S.; Schoenfeld, B.J.; Stout, J.R.; Campbell, B.; Wilborn, C.D.; Taylor, L.; Kalman, D.; Smith-Ryan, A.E.; Kreider, R.B.; et al. International society of sports nutrition position stand: Nutrient timing. J. Int. Soc. Sports Nutr. 2017, 14, 33. [Google Scholar] [CrossRef] [PubMed]
- Jager, R.; Kerksick, C.M.; Campbell, B.I.; Cribb, P.J.; Wells, S.D.; Skwiat, T.M.; Purpura, M.; Ziegenfuss, T.N.; Ferrando, A.A.; Arent, S.M.; et al. International Society of Sports Nutrition Position Stand: Protein and exercise. J. Int. Soc. Sports Nutr. 2017, 14, 20. [Google Scholar] [CrossRef] [PubMed]
- Moher, D.; Liberati, A.; Tetzlaff, J.; Altman, D.G.; Group, P. Preferred reporting items for systematic reviews and meta-analyses: The PRISMA statement. PLoS Med. 2009, 6, e1000097. [Google Scholar] [CrossRef] [PubMed]
- Moola, S.; Munn, Z.; Tufanaru, C.; Aromataris, E.; Sears, K.; Sfetcu, R.; Currie, M.; Qureshi, R.; Mattis, P.; Lisy, K.; et al. Chapter 7: Systematic reviews of etiology and risk. In Joanna Briggs Institute Reviewer’s Manual; Aromataris, E., Munn, Z., Eds.; The Joanna Briggs Institute: Adelaide, Australia; The University of Adelaide: Adelaide, Australia, 2017. [Google Scholar]
- Borenstein, M.; Hedges, L.V.; Higgins, J.P.; Rothstein, H.R. A basic introduction to fixed-effect and random-effects models for meta-analysis. Res. Synth. Methods 2010, 1, 97–111. [Google Scholar] [CrossRef] [PubMed]
- Higgins, J.P.; Thompson, S.G.; Deeks, J.J.; Altman, D.G. Measuring inconsistency in meta-analyses. BMJ 2003, 327, 557–560. [Google Scholar] [CrossRef]
- Briggs, M.A.; Cockburn, E.; Rumbold, P.L.S.; Rae, G.; Stevenson, E.J.; Russell, M. Assessment of energy intake and energy expenditure of male adolescent academy-level soccer players during a competitive week. Nutrients 2015, 7, 8392–8401. [Google Scholar] [CrossRef]
- Murphy, S.; Jeanes, Y. Nutritional knowledge and dietary intakes of young professional football players. Nutr. Food. Sci. 2006, 36, 343–348. [Google Scholar] [CrossRef]
- Naughton, R.J.; Drust, B.; O’Boyle, A.; Morgans, R.; Abayomi, J.; Davies, I.G.; Morton, J.P.; Mahon, E. Daily distribution of carbohydrate, protein and fat intake in elite youth academy soccer players over a 7-day training period. International. Int. J. Sport Nutr. Exerc. Metab. 2016, 26, 473–480. [Google Scholar] [CrossRef]
- Russell, M.; Pennock, A. Dietary analysis of young professional soccer players for 1 week during the competitive season. J. Strength Cond. Res. 2011, 25, 1816–1823. [Google Scholar] [CrossRef] [PubMed]
- Garrido, G.; Webster, A.L.; Chamorro, M. Nutritional adequacy of different menu settings in elite Spanish adolescent soccer players. Int. J. Sport Nutr. Exerc. Metab. 2007, 17, 421–432. [Google Scholar] [CrossRef] [PubMed]
- Iglesias-Gutiérrez, E.; García, Á.; García-Zapico, P.; Pérez-Landaluce, J.; Patterson, Á.M.; García-Rovés, P.M. Is there a relationship between the playing position of soccer players and their food and macronutrient intake? Appl. Physiol. Nutr. Metab. 2012, 37, 225–232. [Google Scholar] [CrossRef] [PubMed]
- Iglesias-Gutiérrez, E.; García-Rovés, P.M.; Rodríguez, C.; Braga, S.; García-Zapico, P.; Patterson, Á.M. Food habits and nutritional status assessment of adolescent soccer players. A necessary and accurate approach. Can. J. Appl. Physiol. 2005, 30, 18–32. [Google Scholar] [CrossRef] [PubMed]
- Ruiz, F.; Irazusta, A.; Gil, S.; Irazusta, J.; Casis, L.; Gil, J. Nutritional intake in soccer players of different ages. J. Sports Sci. 2005, 23, 235–242. [Google Scholar] [CrossRef] [PubMed]
- Do Prado, W.L.; Botero, J.P.; Guerra, R.L.F.; Rodrigues, C.L.; Cuvello, L.C.; Dâmaso, A.R. Anthropometric profile and macronutrient intake in professional Brazilian soccer players according to their field positioning. Rev. Bras. Med. Esporte 2006, 12, 52e–55e. [Google Scholar]
- Raizel, R.; da Mata Godois, A.; Coqueiro, A.Y.; Voltarelli, F.A.; Fett, C.A.; Tirapegui, J.; de Paula Ravagnani, F.C.; de Faria Coelho-Ravagnani, C. Pre-season dietary intake of professional soccer players. Nutr. Health 2017, 23, 215–222. [Google Scholar] [CrossRef]
- Caccialanza, R.; Cameletti, B.; Cavallaro, G. Nutritional intake of young Italian high-level soccer players: Under-reporting is the essential outcome. J. Sports Sci. Med. 2007, 6, 538–542. [Google Scholar]
- Galanti, G.; Stefani, L.; Scacciati, I.; Mascherini, G.; Buti, G.; Maffulli, N. Eating and nutrition habits in young competitive athletes: A comparison between soccer players and cyclists. Transl. Med. UniSa 2014, 11, 44–47. [Google Scholar]
- Bettonviel, A.E.O.; Brinkmans, N.Y.J.; Russcher, K.; Wardenaar, F.C.; Witard, O.C. Nutritional status and daytime pattern of protein intake on match, post-match, rest and training days in senior professional and youth elite soccer players. Int. J. Sport Nutr. Exerc. Metab. 2016, 26, 285–293. [Google Scholar] [CrossRef]
- Brinkmans, N.Y.J.; Iedema, N.; Plasqui, G.; Wouters, L.; Saris, W.H.M.; van Loon, L.J.C.; van Dijk, J.W. Energy expenditure and dietary intake in professional football players in the Dutch Premier League: Implications for nutritional counselling. J. Sports Sci. 2019, 1–9. [Google Scholar] [CrossRef] [PubMed]
- Devlin, B.L.; Leveritt, M.D.; Kingsley, M.; Belski, R. Dietary intake, body composition, and nutrition knowledge of Australian football and soccer players: Implications for sports nutrition professionals in practice. Int. J. Sport Nutr. Exerc. Metab. 2017, 27, 130–138. [Google Scholar] [CrossRef] [PubMed]
- Hassapidou, M.N.; Grammatikopoulou, M.G.; Liarigovinos, T. Dietary intakes of Greek professional football players. Nutr. Food. Sci. 2000, 30, 191–194. [Google Scholar] [CrossRef][Green Version]
- Hidalgo y Teran Elizondo, R.; Martin Bermudo, F.M.; Penaloza Mendez, R.; Berna Amoros, G.; Lara Padilla, E.; Berral de la Rosa, F.J. Nutritional intake and nutritional status in elite Mexican teenagers soccer players of different ages. Nutr. Hosp. 2015, 32, 1735–1743. [Google Scholar] [PubMed]
- Caruana Bonnici, D.; Akubat, I.; Greig, M.; Sparks, A.; Mc Naughton, L.R. Dietary habits and energy balance in an under 21 male international soccer team. Res. Sports Med. 2018, 26, 168–177. [Google Scholar] [CrossRef] [PubMed]
- Ersoy, N.; Kalkan, I.; Ersoy, G. Assessment of nutrition status of Turkish elite young male soccer players in the pre-competition period. Prog. Nutr. 2019, 21, 12–18. [Google Scholar]
- Cherian, K.S.; Sainoji, A.; Nagalla, B.; Yagnambhatt, V.R. Energy balance coexists with disproportionate macronutrient consumption across pretraining, during training, and posttraining among Indian junior soccer players. Pediatr. Exerc. Sci. 2018, 30, 506–515. [Google Scholar] [CrossRef]
- Leblanc, J.C.; Le Gall, F.; Grandjean, V.; Verger, P. Nutritional intake of French soccer players at the Clairefontaine Training Center. Int. J. Sport Nutr. Exerc. Metab. 2002, 12, 268–280. [Google Scholar] [CrossRef]
- Bradley, P.S.; Archer, D.T.; Hogg, B.; Schuth, G.; Bush, M.; Carling, C.; Barnes, C. Tier-specific evolution of match performance characteristics in the English Premier League: it’s getting tougher at the top. J. Sports Sci. 2016, 34, 980–987. [Google Scholar] [CrossRef]
- Bush, M.; Barnes, C.; Archer, D.T.; Hogg, B.; Bradley, P.S. Evolution of match performance parameters for various playing positions in the English Premier League. Hum. Mov. Sci. 2015, 39, 1–11. [Google Scholar] [CrossRef]
- Chmura, P.; Konefal, M.; Chmura, J.; Kowalczuk, E.; Zajac, T.; Rokita, A.; Andrzejewski, M. Match outcome and running performance in different intensity ranges among elite soccer players. Biol. Sport 2018, 35, 197–203. [Google Scholar] [PubMed]
- Lemon, P.W.; Proctor, D.N. Protein intake and athletic performance. Sports Med. 1991, 12, 313–325. [Google Scholar] [CrossRef] [PubMed]
- Boisseau, N.; Le Creff, C.; Loyens, M.; Poortmans, J.R. Protein intake and nitrogen balance in male non-active adolescents and soccer players. Eur. J. Appl. Physiol. 2002, 88, 288–293. [Google Scholar] [PubMed]
- Boisseau, N.; Vermorel, M.; Rance, M.; Duche, P.; Patureau-Mirand, P. Protein requirements in male adolescent soccer players. Eur. J. Appl. Physiol. 2007, 100, 27–33. [Google Scholar] [CrossRef] [PubMed]
- Tipton, K.D.; Wolfe, R.R. Protein and amino acids for athletes. J. Sports Sci. 2004, 22, 65–79. [Google Scholar] [CrossRef] [PubMed]
- Antonio, J.; Peacock, C.A.; Ellerbroek, A.; Fromhoff, B.; Silver, T. The effects of consuming a high protein diet (4.4 g/kg/d) on body composition in resistance-trained individuals. J. Int. Soc. Sports Nutr. 2014, 11, 19. [Google Scholar] [CrossRef] [PubMed]
- Maughan, R.J.; Shirreffs, S.M. Nutrition for soccer players. Curr. Sports Med. Rep. 2007, 6, 279–280. [Google Scholar] [PubMed]
- Burke, L.M.; Loucks, A.B.; Broad, N. Energy and carbohydrate for training and recovery. J. Sports Sci. 2006, 24, 675–685. [Google Scholar] [CrossRef]
- Souglis, A.G.; Chryssanthopoulos, C.I.; Travlos, A.K.; Zorzou, A.E.; Gissis, I.T.; Papadopoulos, C.N.; Sotiropoulos, A.A. The effect of high vs. low carbohydrate diets on distances covered in soccer. J. Strength Cond. Res. 2013, 27, 2235–2247. [Google Scholar] [CrossRef]
- Anderson, L.; Orme, P.; Di Michele, R.; Close, G.L.; Morgans, R.; Drust, B.; Morton, J.P. Quantification of training load during one-, two- and three-game week schedules in professional soccer players from the English Premier League: Implications for carbohydrate periodisation. J. Sports Sci. 2016, 34, 1250–1259. [Google Scholar] [CrossRef]
- Krustrup, P.; Mohr, M.; Steensberg, A.; Bencke, J.; Kjaer, M.; Bangsbo, J. Muscle and blood metabolites during a soccer game: Implications for sprint performance. Med. Sci. Sports Exerc. 2006, 38, 1165–1174. [Google Scholar] [CrossRef] [PubMed]
- Balsom, P.D.; Gaitanos, G.C.; Soderlund, K.; Ekblom, B. High-intensity exercise and muscle glycogen availability in humans. Acta Physiol. Scand. 1999, 165, 337–345. [Google Scholar] [CrossRef] [PubMed]
- Zehnder, M.; Rico-Sanz, J.; Kuhne, G.; Boutellier, U. Resynthesis of muscle glycogen after soccer specific performance examined by 13C-magnetic resonance spectroscopy in elite players. Eur. J. Appl. Physiol. 2001, 84, 443–447. [Google Scholar] [CrossRef] [PubMed]
- Achten, J.; Halson, S.L.; Moseley, L.; Rayson, M.P.; Casey, A.; Jeukendrup, A.E. Higher dietary carbohydrate content during intensified running training results in better maintenance of performance and mood state. J. Appl. Physiol. 2004, 96, 1331–1340. [Google Scholar] [CrossRef] [PubMed]
- Russell, M.; Benton, D.; Kingsley, M. Influence of carbohydrate supplementation on skill performance during a soccer match simulation. J. Sci. Med. Sport 2012, 15, 348–354. [Google Scholar] [CrossRef] [PubMed]
- Ali, A.; Williams, C. Carbohydrate ingestion and soccer skill performance during prolonged intermittent exercise. J. Sports Sci. 2009, 27, 1499–1508. [Google Scholar] [CrossRef] [PubMed]
- Ali, A.; Williams, C.; Nicholas, C.W.; Foskett, A. The influence of carbohydrate-electrolyte ingestion on soccer skill performance. Med. Sci. Sports Exerc. 2007, 39, 1969–1976. [Google Scholar] [CrossRef]
- Balsom, P.D.; Wood, K.; Olsson, P.; Ekblom, B. Carbohydrate intake and multiple sprint sports: With special reference to football (soccer). Minerva Pediatr. 1999, 51, 1–9. [Google Scholar] [CrossRef]
- Harper, L.D.; Briggs, M.A.; McNamee, G.; West, D.J.; Kilduff, L.P.; Stevenson, E.; Russell, M. Physiological and performance effects of carbohydrate gels consumed prior to the extra-time period of prolonged simulated soccer match-play. J. Sci. Med. Sport 2016, 19, 509–514. [Google Scholar] [CrossRef]
- Harper, L.D.; Stevenson, E.J.; Rollo, I.; Russell, M. The influence of a 12% carbohydrate-electrolyte beverage on self-paced soccer-specific exercise performance. J. Sci. Med. Sport 2017, 20, 1123–1129. [Google Scholar] [CrossRef]
- Maughan, R.J. Nutrition and Football: The FIFA/FMARC Consensus on Sports Nutrition, 1st ed.; Routledge Taylor & Francis Group: Abingdon-on-Thames, UK, 2006. [Google Scholar]
- Kanter, M. High-quality carbohydrates and physical performance: Expert panel report. Nutr. Today 2018, 53, 35–39. [Google Scholar] [CrossRef] [PubMed]
- Gavin, J.P.; Myers, S.D.; Willems, M.E. Neuromuscular responses to mild-muscle damaging eccentric exercise in a low glycogen state. J. Electromyogr. Kinesiol. 2015, 25, 53–60. [Google Scholar] [CrossRef] [PubMed]
- Burke, L.M.; Ross, M.L.; Garvican-Lewis, L.A.; Welvaert, M.; Heikura, I.A.; Forbes, S.G.; Mirtschin, J.G.; Cato, L.E.; Strobel, N.; Sharma, A.P.; et al. Low carbohydrate, high fat diet impairs exercise economy and negates the performance benefit from intensified training in elite race walkers. J. Physiol. 2017, 595, 2785–2807. [Google Scholar] [CrossRef] [PubMed]


| DATABASE | KEY | NUMBER |
|---|---|---|
| EBSCOhost—SPORTDiscus | (soccer OR football) AND (nutrition OR diet OR macronutrient) Limiters: Published Date: 20000101-20191231; Source Types: Academic Journals | 777 |
| Scopus | ((TITLE-ABS-KEY (soccer) OR TITLE-ABS-KEY (football))) AND ((TITLE-ABS-KEY (nutrition) OR TITLE-ABS-KEY (diet) OR TITLE-ABS-KEY (macronutrient))) AND (LIMIT-TO (PUBYEAR, 2019–2000) AND (LIMIT-TO (DOCTYPE, “ar”)) | 562 |
| PubMed | Search (((soccer) OR football)) AND (((nutrition) OR diet) OR macronutrient) From 2000/01/01 to 2019/12/31 | 659 |
| Study | Year | Country | Level | Recording Season | Recording Period (Days) | Note |
|---|---|---|---|---|---|---|
| Bettonviel [41] | 2016 | Netherlands | Dutch Premier League (Eredivisie) | The first half of the competitive season | 4 nonconsecutive days (1 match day, 1 post match day, 1 rest day, 1 training day) | Self-reported, 24-h web-based recall method |
| Bonnicci [46] | 2018 | Malta | Malta BOV Premier League | The end of the competitive season | 4 consecutive days (Monday to Thursday) | Self-reported, normal habitual diet |
| Briggs [29] | 2015 | UK | English Premier League | The second half of the competitive season | 7 nonconsecutive days (4 training days, 2 rest days, 1 match day) | Self-reported, weighed food diary and 24-h recall |
| Brinkmans [42] | 2019 | Netherlands | Dutch Premier League (Eredivisie) | November until April | 24-h × 3 | Three unannounced face-to-face 24-h dietary recalls for a match-, training, and rest day |
| Caccialanza [39] | 2007 | Italy | Italian First Division | - | 4 consecutive days (2 training days, 1 match day, 1 rest day) | Self-reported food records on a time zero (T0) and after 3 months (T1) |
| Devlin [43] | 2016 | Australia | Australian A-league | The end of the pre-competition period | 24-h (training day) | Multiple-pass dietary recalls for a ‘training day’ during the end of preseason period |
| do Prado [37] | 2006 | Brazil | Brazilian Campeonato Paulista Série A1 | The whole competitive season | - | Self-reported food consumed more than three times per week regardless whether the athlete was or not on a match day |
| Ersoy [47] | 2019 | Turkey | Pro-professional soccer | The pre-competition period | 3 consecutive days | Three-day food consumption registration form |
| Galanti [40] | 2015 | Italy | Italian First Division | The competitive season | - | Questions about the type of food, the portions and frequency of consumption of various foods and beverages. The quantification of food intake was undertaken using pictures of food depicted in different portions with known weights from a dedicated photographic archive. |
| Garrido [33] | 2007 | Spain | Spain División de Honor Juvenil | The second half of the competitive season | 5 consecutive days (4 weekdays and a weekend match day) | Self-reported; food intake was assessed on 2 occasions “buffet-style” diet and a fixed “menu-style” diet |
| Hassapidou [44] | 2000 | Greece | Elite Greek team | The competitive season | 3 consecutive days (including the match day) | Self-recorded weighed dietary record |
| Hidalgo [45] | 2015 | Mexico | Mexican National Soccer League | The competitive season | 4 consecutive days (excluding the match day) | Self-recorded weighed dietary record |
| Cherian [48] | 2018 | India | Junior national-level | - | 3 consecutive days | Self-recorded weighed dietary record |
| Iglesias-Gutiérrez [34] | 2012 | Spain | Spanish First Division | The first half of the competitive season | 6 consecutive days (a whole week, excluding the match-day) | Self-recorded weighed dietary record |
| Iglesias-Gutiérrez [35] | 2005 | Spain | Spanish First Division | The first half of the competitive season | 6 consecutive days (a whole week, excluding the match-day) | Self-recorded weighed dietary record |
| Leblanc [49] | 2002 | French | French National Training Centre | The beginning of the year | 5 consecutive days (including 3 weekdays and 2 weekend days) | Self-recorded using household measures such as cups, dishes, and spoons |
| Murphy [30] | 2006 | UK | English Premier League and a League One | The mid-season | 7 consecutive days | Self-reported; to eliminate the possibility of under-reporting, the basal metabolic rate (BMR) of all participants was calculated. Any subjects thought to be underreporting were eliminated from the study. |
| Naughton [31] | 2016 | UK | English Premier League | - | 7 consecutive days | Self-recorded |
| Raizel [38] | 2017 | Brazil | Brazilian professional soccer players | The pre-season | 3 nonconsecutive days (2 nonconsecutive weekdays and a weekend day) | Semi-structured food record in pre-season |
| Ruiz [36] | 2005 | Spain | Spain Tercera División | - | 3 consecutive days (Sunday, Monday, and Tuesday) | Self-recorded with a weighing scale and a questionnaire to record the type and quantity of food eaten. |
| Russell [32] | 2011 | UK | UK Championship soccer team | The first half of the competitive season | 7 days (a match day, 4 training days, and 2 rest days in the first half of the competitive season) | Self-recorded using household measures such as cups, dishes, and spoons |
| Study | Year | Age | n | Energy (kcal/day) | Energy (kcal/kg/day) | Proteins (g/kg/day) | CHO (g/kg/day) | Fat (% of TEI) |
|---|---|---|---|---|---|---|---|---|
| Bettonviel [41] | 2016 | 17.3 (1.1) | 15 | 2938 (465) | 42.6 (6.7) | 1.7 (0.4) | 6.0 (1.5) | 26 (3) |
| Briggs [29] | 2015 | 15.4 (0.3) | 10 | 2237 (320) | 41.2 (5.3) | 1.5 (0.2) | 5.6 (0.4) | 29 (2) |
| Caccialanza [39] | 2007 | 16 (1) | 43 | 2560 (636) | 36.7 (9.1) | 1.5 (0.4) | 4.9 (1.5) | 31 (3) |
| 16 (1) | 43 | 2640 (614) | 37.2 (8.7) | 1.5 (0.4) | 5.0 (1.3) | 30 (3) | ||
| Ersoy [47] | 2019 | 16 (1.2) | 26 | 3225 (692) | 47.9 (10.2) | 1.9 (0.5) | 6.3 (1.7) | 30 (6) |
| Galanti [40] | 2015 | 15–16 | 30 | 2844 (51) | 40.3 (0.7) | 1.6 (0.2) | 6.1 (0.4) | 33 (3) |
| Garrido [33] | 2007 | 16.9 (1.5) | 33 | 2740 (531) | 37.8 (8.3) | 1.5 (0.3) | 4.4 (1.1) | - |
| 16.1 (1.4) | 29 | 3148 (619) | 45.1 (10.0) | 1.6 (0.3) | 5.6 (1.4) | - | ||
| Hidalgo [45] | 2015 | 15.5 (0.0) | 24 | 3067 (151) | 50.3 (8.0) | 2.2 (0.1) | 6.7 (0.4) | 31 (0) |
| 16.5 (0.0) | 24 | 2930 (73) | 45.1 (1.4) | 2.0 (0.1) | 5.7 (0.2) | 33 (0) | ||
| 17.3 (0.0) | 18 | 2715 (131) | 40.7 (2.0) | 1.9 (0.1) | 5.4 (0.3) | 30 (0) | ||
| 19.3 (0.2) | 6 | 3042 (117) | 44.9 (2.9) | 2.2 (0.2) | 5.4 (0.3) | 33 (0) | ||
| Cherian [48] | 2018 | 10.0 (0.8) | 10 | 2871 (279) | 77.8 (7.6) | 2.2 (0.7) | 12.9 (3.0) | 24 (2) |
| 13.3 (1.5) | 11 | 3237 (303) | 59.6 (5.6) | 1.8 (0.1) | 9.3 (0.7) | 26 (2) | ||
| Iglesias-Gutiérrez [34] | 2012 | 18 (2) | 87 | 2794 (526) | 38.5 (8.5) | 1.6 (0.4) | 4.7 (1.1) | 37 (5) |
| Iglesias-Gutiérrez [35] | 2005 | 14–16 | 33 | 3003 (437) | 46.5 (8.6) | 1.9 (0.4) | 5.6 (1.2) | 38 (5) |
| Leblanc [49] | 2002 | 13 | 19 | 2436 (374) | 49.2 (7.6) | 1.9 (0.4) | 6.5 (1.1) | 33 (3) |
| 14 | 19 | 2916 (286) | 55.2 (5.4) | 2.2 (0.4) | 6.8 (0.7) | 33 (4) | ||
| 15 | 19 | 3010 (427) | 48.8 (6.9) | 1.9 (0.3) | 6.4 (1.3) | 32 (3) | ||
| Murphy [30] | 2006 | 16–19 | 22 | 2452 (430) | 33.9 (5.9) | 1.3 (0.2) | 4.3 (0.3) | 32 (3) |
| Naughton [31] | 2016 | 12.7 (0.6) | 21 | 1903 (432) | 43.1 (10.3) | 2.2 (0.5) | 6.0 (1.2) | 26 (8) |
| 14.4 (0.5) | 25 | 1927 (317) | 32.6 (7.9) | 1.6 (0.3) | 4.7 (1.4) | 25 (5) | ||
| 16.4 (0.5) | 13 | 1958 (390) | 28.1 (6.8) | 2.0 (0.3) | 3.2 (1.3) | 27 (7) | ||
| Ruiz [36] | 2005 | 14.0 (0.1) | 18 | 3456 (309) | 54.6 (5.5) | 2.0 (0.2) | 6.7 (0.9) | 36 (3) |
| 14.9 (0.5) | 20 | 3418 (182) | 51.5 (2.5) | 2.1 (0.1) | 5.9 (0.4) | 38 (2) | ||
| 16.6 (0.2) | 19 | 3478 (223) | 48.4 (2.4) | 2.0 (0.1) | 5.3 (0.4) | 39 (1) | ||
| Russell [32] | 2011 | 17 (1) | 10 | 2831 (164) | 42.3 (2.9) | 1.7 (0.1) | 5.9 (0.4) | 31 (1) |
| Seniors | ||||||||
| Bettonviel [41] | 2016 | 22.8 (3.7) | 14 | 2988 (583) | 38.8 (7.6) | 1.9 (0.3) | 4.7 (0.7) | 29 (4) |
| Bonnicci [46] | 2018 | 27.1 (4.2) | 22 | 2164 (498) | 28.7 (6.6) | 1.5 (0.4) | 3.7 (1.0) | 30 (5) |
| Brinkmans [42] | 2019 | 23 (4) | 41 | 3285 (354) | 42.4 (3.5) | 1.7 (0.5) | 4.0 (1.2) | 31 (5) |
| Devlin [43] | 2016 | 27 (5) | 18 | 2247 (550) | 29.7 (7.3) | 1.9 (0.5) | 2.9 (1.1) | 33 (9) |
| do Prado [37] | 2006 | 23 (7) | 118 | 3371 (721) | 44.3 (9.5) | 1.9 (0.3) | 5.9 (0.7) | 29 (5) |
| Hassapidou [44] | 2000 | 24.8 (5.5) | 21 | 3442 (158) | 46.0 (2.1) | 2.0 (1.3) | 5.3 (1.9) | 41 (5) |
| Raizel [38] | 2017 | 20.7 (2.0) | 19 | 2924 (460) | 40.7 (12.8) | 1.9 (0.8) | 5.4 (1.9) | 29 (3) |
| Ruiz [36] | 2005 | 20.9 (0.5) | 24 | 3030 (141) | 41.1 (2.1) | 1.8 (0.1) | 4.6 (0.2) | 38 (3) |
| Junior Players | Heterogeneity | Senior Players | Heterogeneity | |
|---|---|---|---|---|
| Weighted Average (95% CI) | I2 | Weighted Average (95% CI) | I2 | |
| Energy (kcal/kg/day) | 44.1 (42.5–45.7) | 3.3 | 42.9 (40.1–45.6) | 0 |
| 2000–2010 | 49.3 (46.5–52.1) | 0 | 43.6 (40.7–46.4) † | 0 |
| 2010–2019 | 41.3 (40.2–42.4) * | 22.2 | 35.0 (25.5–44.6) | 0 |
| Proteins (g/kg/day) | 1.9 (1.8–2.0) | 24.7 | 1.8 (1.6–2.0) | 0 |
| 2000–2010 | 2.0 (1.9–2.1) | 5.6 | 1.8 (1.6–2.0) | 0 |
| 2010–2019 | 1.8 (1.7–1.9) | 23.4 | 1.9 (1.4–2.4) | 0 |
| CHO (g/kg/day) | 5.7 (5.5–5.9) | 0 | 4.7 (4.3–5.0) † | 0 |
| 2000–2010 | 5.8 (5.3–6.2) | 0 | 4.7 (4.3–5.1) † | 0 |
| 2010–2019 | 5.7 (5.4–5.9) | 13.3 | 4.3 (3.2–5.4) † | 0 |
| Fat (% of TEI) | 31.5 (32.0–35.9) | 4.4 | 33.1 (29.9–36.2) | 20.5 |
| 2000–2010 | 34.0 (32.0–35.9) | 0 | 36.7 (32.3–41.2) | 39.4 |
| 2010–2019 | 31.4 (30.5–32.2) * | 25.7 | 29.3 (24.7–33.8) * | 0 |
© 2019 by the authors. Licensee MDPI, Basel, Switzerland. This article is an open access article distributed under the terms and conditions of the Creative Commons Attribution (CC BY) license (http://creativecommons.org/licenses/by/4.0/).
Share and Cite
Steffl, M.; Kinkorova, I.; Kokstejn, J.; Petr, M. Macronutrient Intake in Soccer Players—A Meta-Analysis. Nutrients 2019, 11, 1305. https://doi.org/10.3390/nu11061305
Steffl M, Kinkorova I, Kokstejn J, Petr M. Macronutrient Intake in Soccer Players—A Meta-Analysis. Nutrients. 2019; 11(6):1305. https://doi.org/10.3390/nu11061305
Chicago/Turabian StyleSteffl, Michal, Ivana Kinkorova, Jakub Kokstejn, and Miroslav Petr. 2019. "Macronutrient Intake in Soccer Players—A Meta-Analysis" Nutrients 11, no. 6: 1305. https://doi.org/10.3390/nu11061305
APA StyleSteffl, M., Kinkorova, I., Kokstejn, J., & Petr, M. (2019). Macronutrient Intake in Soccer Players—A Meta-Analysis. Nutrients, 11(6), 1305. https://doi.org/10.3390/nu11061305