Nutrient Intakes from Meals and Snacks Differ with Age in Middle-Aged and Older Americans

 , ,
, ,
Abstract
1. Introduction
2. Materials and Methods
2.1. Dietary Intake Data
2.2. Statistical Analysis
3. Results
3.1. Meal and Snack Intakes
3.2. Mean and Percent Macronutrient Intakes from Meals and Snacks
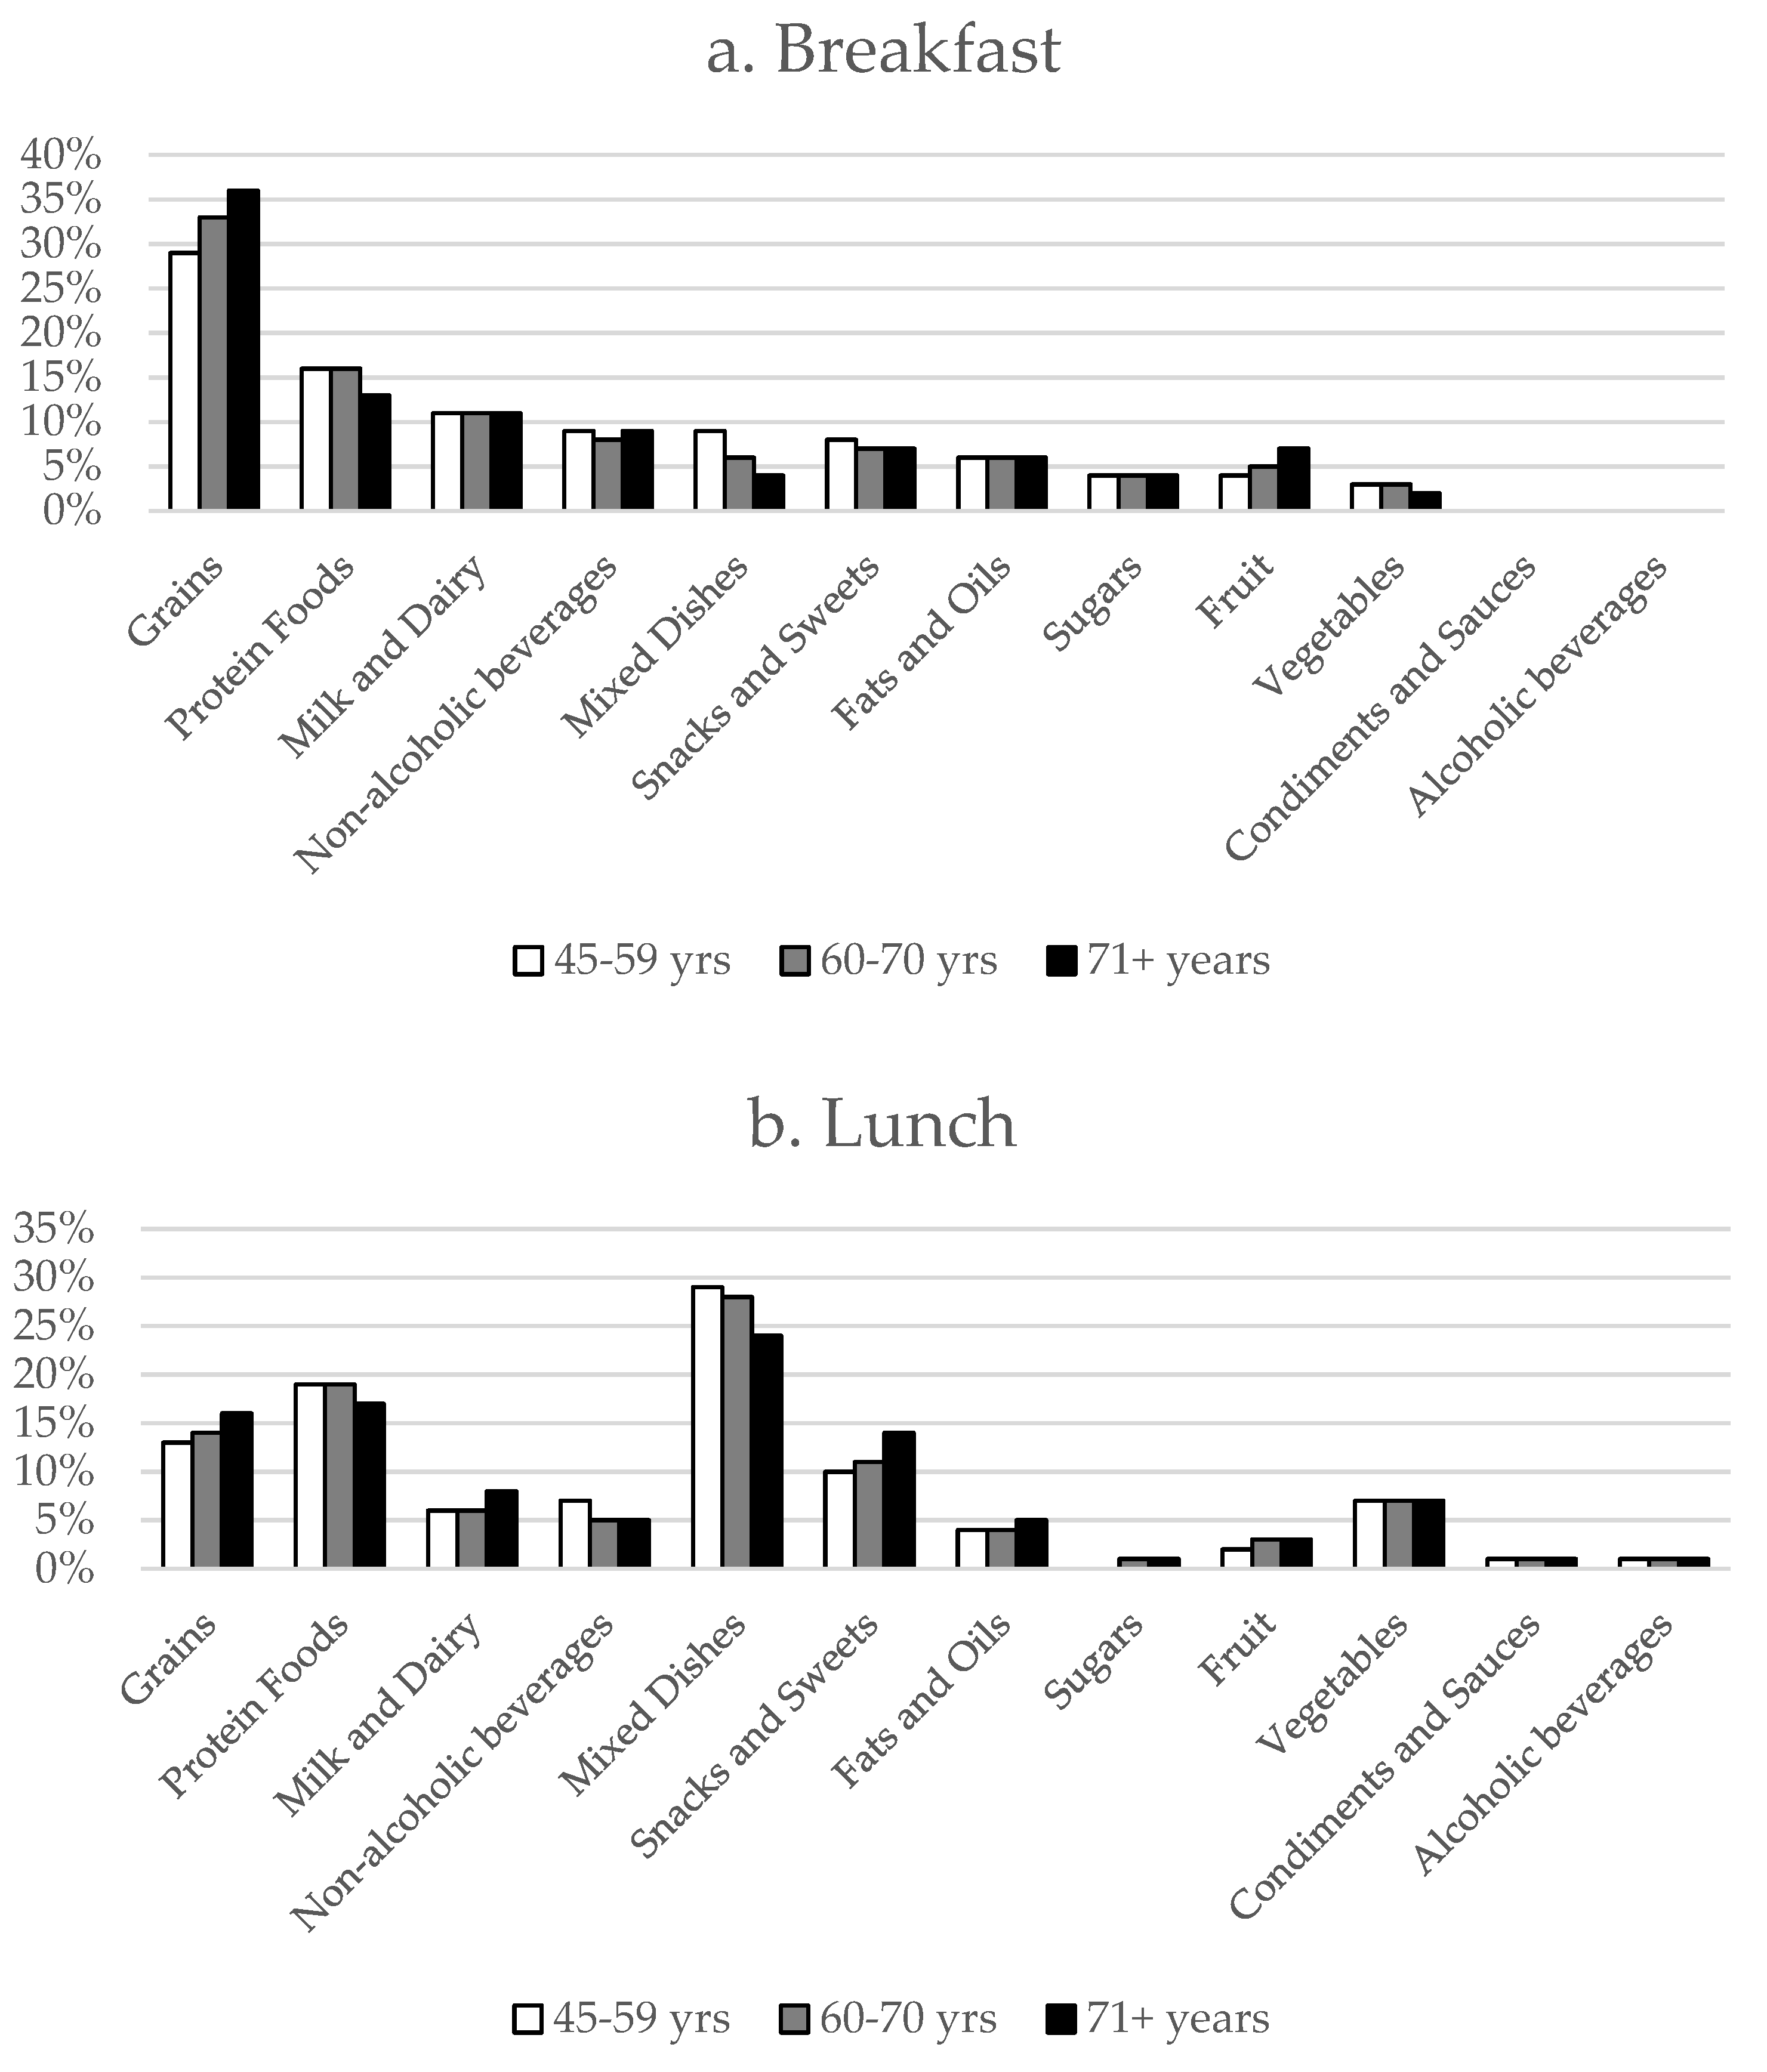
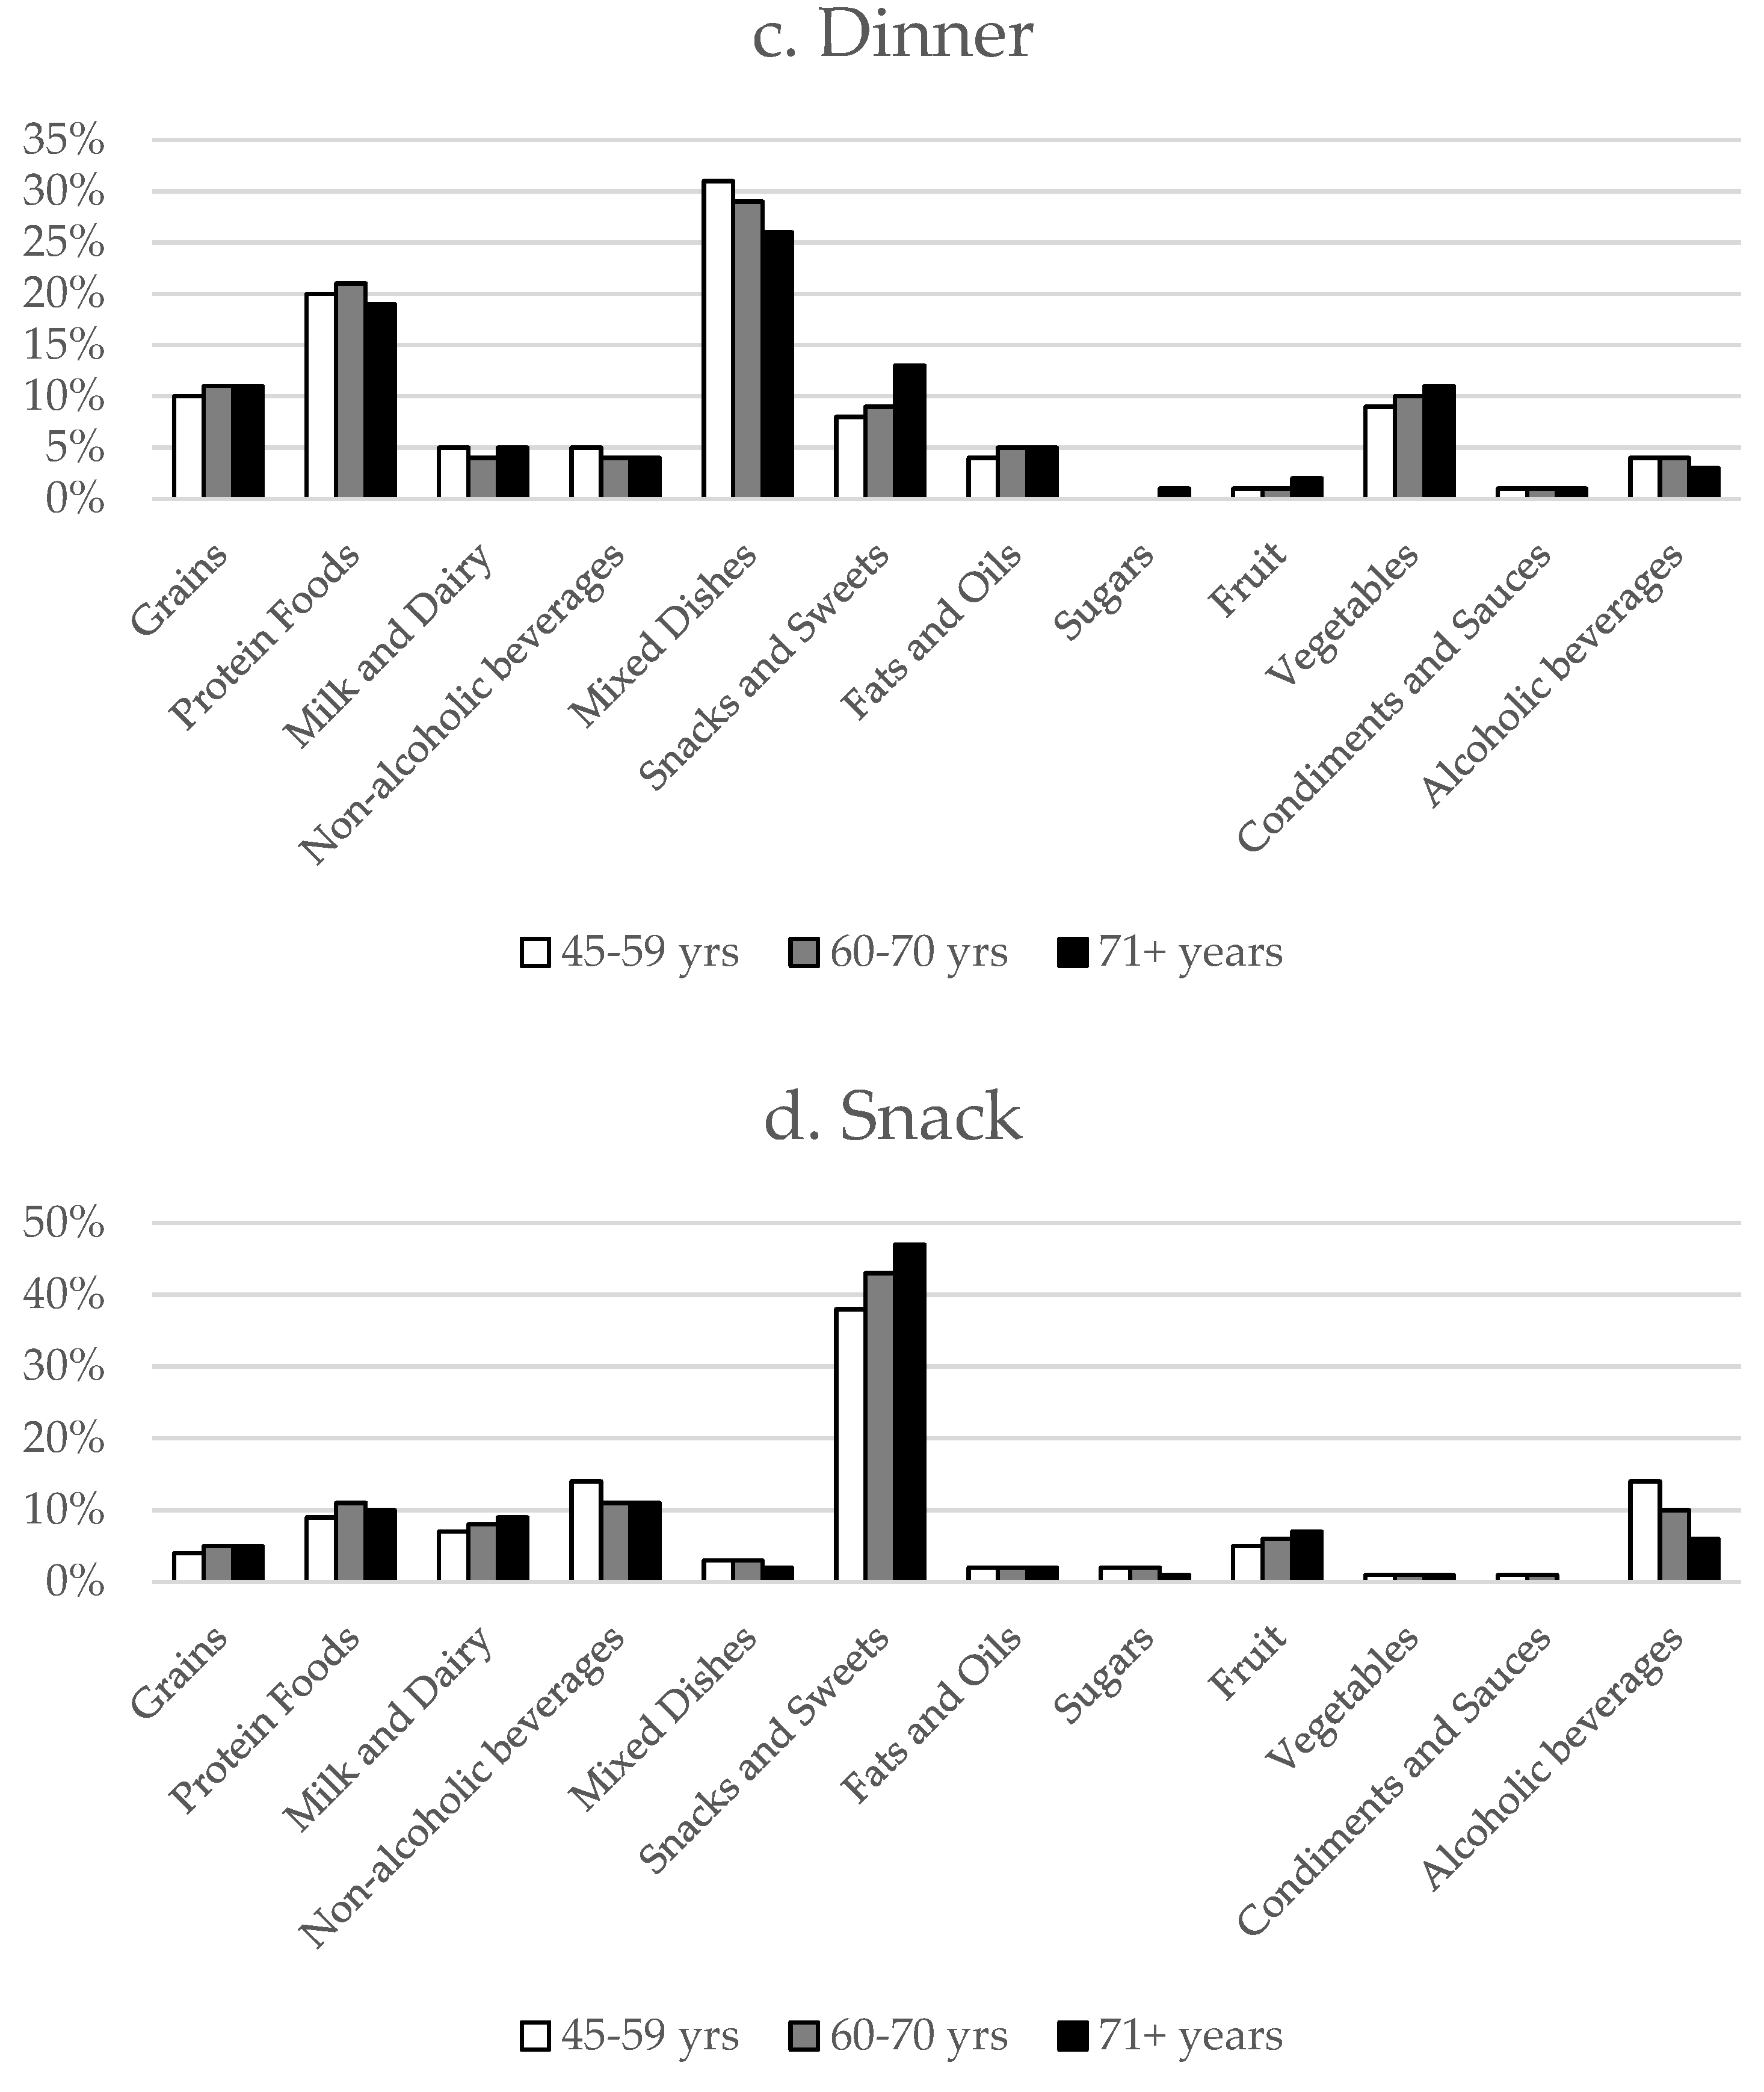
3.3. Food Sources of Energy from Meals and Snacks
4. Discussion
Strengths and Limitations
5. Conclusions
Author Contributions
Funding
Conflicts of Interest
References
- Mustafa, J.; Ellison, R.C.; Singer, M.R.; Bradlee, M.L.; Kalesan, B.; Holick, M.F.; Moore, L.L. Dietary protein and preservation of physical functioning among middle-aged and older adults in the Framingham Offspring study. Am. J. Epidemiol. 2018, 187, 1411–1419. [Google Scholar] [CrossRef] [PubMed]
- Welch, A.A. Nutritional influences on age-related skeletal muscle loss. Proc. Nutr. Soc. 2014, 73, 16–33. [Google Scholar] [CrossRef] [PubMed]
- Artaud, F.; Sabia, S.; Dugravot, A.; Kivimaki, M.; Singh-Manoux, A.; Elbaz, A. Trajectories of unhealthy behaviors in midlife and risk of disability at older ages in the Whitehall II cohort study. J. Gerontol. A Biol. Sci. Med. Sci. 2016, 71, 1500–1506. [Google Scholar] [CrossRef] [PubMed]
- Parsons, T.J.; Papachristou, E.; Atkins, J.L.; Papacosta, O.; Ash, S.; Lennon, L.T.; Whincup, P.H.; Ramsay, S.E.; Wannamethee, S.G. Healthier diet quality and dietary patterns are associated with lower risk of mobility limitation in older men. Eur. J. Nutr. 2018, 1–9. [Google Scholar] [CrossRef]
- Shlisky, J.; Bloom, D.E.; Beaudreault, A.R.; Tucker, K.L.; Keller, H.H.; Freund-Levi, Y.; Fielding, R.A.; Cheng, F.W.; Jensen, G.L.; Wu, D.; et al. Nutritional considerations for healthy aging and reduction in age-related chronic disease. Adv. Nutr. 2017, 8, 17–26. [Google Scholar] [CrossRef] [PubMed]
- Morley, J.E. Undernutrition in older adults. Fam. Pract. 2012, 29, i89–i93. [Google Scholar] [CrossRef] [PubMed]
- Bowman, S.A.; Clemens, J.C.; Friday, J.E.; Lynch, K.L.; Moshfegh, A.J. Food Patterns Equivalents Database 2013–2014: Methodology and User Guide [Online]; United States Department of Agriculture: Beltsville, MD, USA, 2017.
- Ter Borg, S.; Verlaan, S.; Hemsworth, J.; Mijnarends, D.M.; Schols, J.M.; Luiking, Y.C.; de Groot, L.C. Micronutrient intakes and potential inadequacies of community-dwelling older adults: A systematic review. Br. J. Nutr. 2015, 113, 1195–1206. [Google Scholar] [CrossRef]
- Johnston, R.; Poti, J.M.; Popkin, B.M. Eating and aging: Trends in dietary intake among older Americans from 1977–2010. J. Nutr. Health Aging 2014, 18, 234–242. [Google Scholar] [CrossRef]
- Nielsen, S.J.; Popkin, B.M. Patterns and trends in food portion sizes, 1977–1998. JAMA 2003, 289, 450–453. [Google Scholar] [CrossRef]
- Nielsen, S.J.; Popkin, B.M. Changes in beverage intake between 1977 and 2001. Am. J. Prev. Med. 2004, 27, 205–210. [Google Scholar] [CrossRef]
- Piernas, C.; Popkin, B.M. Snacking increased among U. S. adults between 1977 and 2006. J. Nutr. 2010, 140, 325–332. [Google Scholar] [CrossRef] [PubMed]
- Krok-Schoen, J.L.; Price, A.A.; Luo, M.; Kelly, O.J.; Taylor, C.A. Low dietary protein intakes and associated dietary patterns and functional limitations in an aging population: A NHANES analysis. J. Nutr. Health Aging 2019, 23, 338–347. [Google Scholar] [CrossRef] [PubMed]
- Leech, R.M.; Worsley, A.; Timperio, A.; McNaughton, S.A. Understanding meal patterns: Definitions, methodology and impact on nutrient intake and diet quality. Nutr. Res. Rev. 2015, 28, 1–21. [Google Scholar] [CrossRef] [PubMed]
- Ahmed, T.; Haboubi, N. Assessment and management of nutrition in older people and its importance to health. Clin. Interv. Aging 2010, 5, 207–216. [Google Scholar] [PubMed]
- Ahluwalia, N.; Dwyer, J.; Terry, A.; Moshfegh, A.; Johnson, C. Update on NHANES dietary data: Focus on collection, release, analytical considerations, and uses to inform public policy. Adv. Nutr. 2016, 7, 121–134. [Google Scholar] [CrossRef] [PubMed]
- USDA Food and Nutrient Database for Dietary Studies 2011–2012. Available online: https://www.ars.usda.gov/northeast-area/beltsville-md-bhnrc/beltsville-human-nutrition-researchcenter/food-surveys-research-group/docs/fndds-versions-and-citations/ba/bhnrc/fsrg (accessed on 1 September 2014).
- Food Surveys Research Group. What We Eat in America. Available online: http://www.barc.usda. gov/bhnrc/foodsurvey/home.htm (accessed on 15 January 2019).
- Drewnowski, A.; Shultz, J.M. Impact of aging on eating behaviors, food choices, nutrition, and health status. J. Nutr. Health Aging 2001, 5, 75–79. [Google Scholar] [PubMed]
- Volpi, E.; Campbell, W.W.; Dwyer, J.T.; Johnson, M.A.; Jensen, G.L.; Morley, J.E.; Wolfe, R.R. Is the optimal level of protein intake for older adults greater than the recommended dietary allowance? J. Gerontol. A Biol. Sci. Med. Sci. 2013, 68, 677–681. [Google Scholar] [CrossRef] [PubMed]
- Kerver, J.M.; Yang, E.J.; Obayashi, S.; Bianchi, L.; Song, W.O. Meal and snack patterns are associated with dietary intake of energy and nutrients in US adults. J. Am. Diet. Assoc. 2006, 106, 46–53. [Google Scholar] [CrossRef]
- Holmbäck, I.; Ericson, U.; Gullberg, B.; Wirfält, E. A high eating frequency is associated with an overall healthy lifestyle in middle-aged men and women and reduced likelihood of general and central obesity in men. Br. J. Nutr. 2010, 104, 1065–1073. [Google Scholar] [CrossRef]
- Aljuraiban, G.S.; Chan, Q.; Griep, L.M.; Brown, I.J.; Daviglus, M.L.; Stamler, J.; Van Horn, L.; Elliott, P.; Frost, G.S. INTERMAP Research Group. The impact of eating frequency and time of intake on nutrient quality and body mass index: The INTERMAP study, a population-based study. J. Acad. Nutr. Diet. 2015, 115, 528–536. [Google Scholar] [CrossRef]
- Howarth, N.C.; Huang, T.T.; Roberts, S.B.; Lin, B.H.; McCrory, M.A. Eating patterns and dietary composition in relation to BMI in younger and older adults. Int. J. Obes. 2007, 31, 675–684. [Google Scholar] [CrossRef] [PubMed]
- Haines, P.S.; Guilkey, D.K.; Popkin, B. Trends in breakfast consumption of US adults between 1965 and 1991. J. Am. Diet. Assoc. 1996, 96, 464–470. [Google Scholar] [CrossRef]
- Reicks, M.; Degeneffe, D.; Rendahl, A.; Smith Edge, M.; Burns, K.; O’Meara, B.; Blevins, G. Associations between eating occasion characteristics and age, gender, presence of children and BMI among US adults. J. Am. Coll. Nutr. 2014, 33, 315–327. [Google Scholar] [CrossRef] [PubMed]
- Gollub, E.A.; Weddle, D.O. Improvements in nutritional intake and quality of life among frail homebound older adults receiving home-delivered breakfast and lunch. J. Am. Diet. Assoc. 2004, 104, 1227–1235. [Google Scholar] [CrossRef] [PubMed]
- Norton, C.; Toomey, C.; McCormack, W.G.; Francis, P.; Saunders, J.; Kerin, E.; Jakeman, P. Protein supplementation at breakfast and lunch for 24 weeks beyond habitual intakes increases whole-body lean tissue mass in healthy older adults. J. Nutr. 2015, 146, 65–69. [Google Scholar] [CrossRef]
- Anderson, A.L.; Harris, T.B.; Tylavsky, F.A.; Perry, S.E.; Houston, D.K.; Hue, T.F.; Strotmeyer, E.S.; Sahyoun, N.R.; Study, H.A. Dietary patterns and survival of older adults. J. Am. Diet. Assoc. 2011, 111, 84–91. [Google Scholar] [CrossRef]
- Bellisle, F. Meals and snacking, diet quality and energy balance. Physiol. Behav. 2014, 134, 38–43. [Google Scholar] [CrossRef]
- Ovaskainen, M.L.; Reinivuo, H.; Tapanainen, H.; Hannila, M.L.; Korhonen, T.; Pakkala, H. Snacks as an element of energy intake and food consumption. Eur. J. Clin. Nutr. 2006, 60, 494–501. [Google Scholar] [CrossRef]
- Zizza, C.A.; Xu, B. Snacking is associated with overall diet quality among adults. J. Acad. Nutr. Diet. 2012, 112, 291–296. [Google Scholar] [CrossRef]
- Zizza, C.A.; Arsiwalla, D.D.; Ellison, K.J. Contribution of snacking to older adults’ vitamin, carotenoid, and mineral intakes. J. Am. Diet. Assoc. 2010, 110, 768–772. [Google Scholar] [CrossRef]
- Murakami, K.; Livingstone, M.B. Associations between meal and snack frequency and diet quality in US adults: National Health and nutrition examination survey 2003–2012. J. Acad. Nutr. Diet. 2016, 116, 1101–1113. [Google Scholar] [CrossRef] [PubMed]
- Hsiao, P.Y.; Mitchell, D.C.; Coffman, D.L.; Allman, R.M.; Locher, J.L.; Sawyer, P.; Jensen, G.L.; Hartman, T.J. Dietary patterns and diet quality among diverse older adults: The University of Alabama at Birmingham Study of Aging. J. Nutr. Health Aging 2013, 17, 19–25. [Google Scholar] [CrossRef] [PubMed]
- Moshfegh, A.J.; Rhodes, D.G.; Baer, D.J.; Murayi, T.; Clemens, J.C.; Rumpler, W.V.; Paul, D.R.; Sebastian, R.S.; Kuczynski, K.J.; Ingwersen, L.A.; et al. The US Department of Agriculture Automated Multiple-Pass Method reduces bias in the collection of energy intakes. Am. J. Clin. Nutr. 2008, 88, 324–332. [Google Scholar] [CrossRef] [PubMed]
- Subar, A.F.; Freedman, L.S.; Tooze, J.A.; Kirkpatrick, S.I.; Boushey, C.; Neuhouser, M.L.; Thompson, F.E.; Potischman, N.; Guenther, P.M.; Tarasuk, V.; et al. Addressing current criticism regarding the value of self-report dietary data. J. Nutr. 2015, 145, 2639–2645. [Google Scholar] [CrossRef] [PubMed]


| Age Categories (Years) | ||||||||
|---|---|---|---|---|---|---|---|---|
| 45–59 (n = 7366) | 60–70 (n = 5348) | ≥71 (n = 4647) | ||||||
| Meal Data 1,2 | Category | n | % | n | % | n | % | p |
| Meal Consumed | Breakfast | 6369 | 87.7% | 4805 | 91.3% | 4382 | 95.4% | <0.001 |
| Lunch | 5533 | 79.8% | 3849 | 78.2% | 3372 | 77.1% | 0.064 | |
| Dinner | 6660 | 93.3% | 4772 | 93.9% | 4209 | 93.1% | 0.469 | |
| All Snacks | 6983 | 96.4% | 5013 | 96.3% | 4301 | 93.3% | <0.001 | |
| Number of Meal Occasions Reported | 0 | 25 | 0.2% | 22 | 0.3% | 8 | 0.1% | 0.007 |
| 1 | 469 | 4.9% | 328 | 4.1% | 179 | 2.2% | ||
| 2 | 2523 | 28.7% | 1896 | 27.7% | 1596 | 29.6% | ||
| 3 | 4349 | 66.2% | 3102 | 68.0% | 2864 | 68.1% | ||
| Personal Characteristics 2 | Category | n | % | n | % | n | % | p |
| Gender | Male | 3587 | 48.3% | 2653 | 47.2% | 2305 | 42.7% | <0.001 |
| Female | 3779 | 51.7% | 2695 | 52.8% | 2342 | 57.3% | ||
| Marital Status | Single/Widowed/Divorced | 2600 | 31.8% | 2025 | 30.7% | 2215 | 45.2% | <0.001 |
| Married/Living as Married | 4761 | 68.2% | 3320 | 69.3% | 2431 | 54.8% | ||
| Race/Ethnicity | Mexican American | 1125 | 6.4% | 906 | 5.1% | 367 | 3.3% | 0.809 |
| Other Hispanic | 733 | 4.6% | 640 | 3.5% | 275 | 2.5% | ||
| Non-Hispanic White | 3112 | 70.7% | 2090 | 76.5% | 3047 | 82.0% | ||
| Non-Hispanic Black | 1695 | 11.5% | 1349 | 9.5% | 717 | 7.7% | ||
| Other or Multiracial | 701 | 6.7% | 363 | 5.5% | 241 | 4.6% | ||
| Intake | Meal | Age Categories (Years) | p | ||
|---|---|---|---|---|---|
| 45–59 | 60–70 | ≥71 | |||
| Energy (kcal) | Breakfast | 373 (6) | 384 (5) | 398 (6) | 0.009 |
| Lunch | 502 (8) | 434 (9) | 407 (8) | <0.001 | |
| Dinner | 773 (10) | 683 (11) | 631 (11) | <0.001 | |
| All Snacks | 513 (11) | 429 (11) | 315 (9) | <0.001 | |
| Protein (g) | Breakfast | 13.6 (0.3) | 14.1 (0.2) | 14.0 (0.3) | 0.208 |
| Lunch | 23.0 (0.4) | 20.0 (0.4) | 18.5 (0.4) | <0.001 | |
| Dinner | 37.0 (0.5) | 32.5 (0.5) | 29.1 (0.5) | <0.001 | |
| All Snacks | 10.8 (0.2) | 9.6 (0.3) | 7.2 (0.2) | <0.001 | |
| Carbohydrate (g) | Breakfast | 49.6 (0.8) | 51.8 (0.8) | 57.9 (0.9) | <0.001 |
| Lunch | 56.0 (0.9) | 48.0 (1.1) | 46.5 (0.9) | <0.001 | |
| Dinner | 79.9 (1.2) | 72.2 (1.4) | 69.2 (1.3) | <0.001 | |
| All Snacks | 69.1 (1.5) | 57.6 (1.3) | 42.6 (1.2) | <0.001 | |
| Added sugars (g) | Breakfast | 12.4 (0.3) | 10.9 (0.3) | 10.7 (0.3) | <0.001 |
| Lunch | 12.9 (0.4) | 9.7 (0.4) | 9.1 (0.5) | <0.001 | |
| Dinner | 16.4 (0.6) | 13.7 (0.5) | 13.7 (0.6) | 0.001 | |
| All Snacks | 28.3 (0.9) | 21.3 (0.7) | 13.9 (0.6) | <0.001 | |
| Dietary fiber (g) | Breakfast | 3.2 (0.1) | 3.7 (0.1) | 4.4 (0.1) | <0.001 |
| Lunch | 4.3 (0.1) | 3.9 (0.1) | 3.8 (0.1) | <0.001 | |
| Dinner | 6.3 (0.1) | 6.3 (0.1) | 5.9 (0.1) | 0.021 | |
| All Snacks | 3.4 (0.1) | 3.2 (0.1) | 2.6 (0.1) | <0.001 | |
| Total fat (g) | Breakfast | 14.0 (0.3) | 14.1 (0.3) | 13.3 (0.3) | 0.079 |
| Lunch | 20.8 (0.4) | 18.1 (0.4) | 16.5 (0.5) | <0.001 | |
| Dinner | 31.9 (0.5) | 27.4 (0.5) | 25.2 (0.5) | <0.001 | |
| All Snacks | 16.8 (0.4) | 15.4 (0.5) | 12.0 (0.4) | <0.001 | |
| Saturated fat (g) | Breakfast | 4.7 (0.1) | 4.7 (0.1) | 4.5 (0.1) | 0.242 |
| Lunch | 6.3 (0.1) | 5.4 (0.1) | 5.1 (0.2) | <0.001 | |
| Dinner | 10.2 (0.2) | 8.6 (0.2) | 7.8 (0.2) | <0.001 | |
| All Snacks | 5.7 (0.1) | 5.1 (0.2) | 4.0 (0.2) | <0.001 | |
| Monounsaturated fat (g) | Breakfast | 5.1 (0.1) | 5.2 (0.1) | 4.7 (0.1) | 0.013 |
| Lunch | 7.5 (0.2) | 6.5 (0.2) | 5.9 (0.2) | <0.001 | |
| Dinner | 11.3 (0.2) | 9.8 (0.2) | 9.0 (0.2) | <0.001 | |
| All Snacks | 6.1 (0.2) | 5.7 (0.2) | 4.5 (0.2) | <0.001 | |
| Polyunsaturated fat (g) | Breakfast | 3.0 (0.1) | 3.1 (0.1) | 2.9 (0.1) | 0.577 |
| Lunch | 5.0 (0.1) | 4.6 (0.2) | 4.1 (0.1) | <0.001 | |
| Dinner | 7.4 (0.2) | 6.4 (0.2) | 6.0 (0.1) | <0.001 | |
| All Snacks | 3.6 (0.1) | 3.3 (0.1) | 2.6 (0.1) | <0.001 | |
| Intake | Meal | Age Categories (Years) | p | ||
|---|---|---|---|---|---|
| 45–59 | 60–70 | ≥71 | |||
| Energy | Breakfast | 17.8 (0.3) | 20.4 (0.2) | 23.4 (0.4) | <0.001 |
| Lunch | 23.4 (0.3) | 22.8 (0.4) | 23.2 (0.4) | 0.506 | |
| Dinner | 35.9 (0.4) | 35.5 (0.5) | 36.0 (0.5) | 0.722 | |
| All Snacks | 22.9 (0.4) | 21.3 (0.4) | 17.4 (0.4) | <0.001 | |
| Protein | Breakfast | 16.7 (0.3) | 19.0 (0.3) | 21.3 (0.4) | <0.001 |
| Lunch | 26.7 (0.4) | 25.9 (0.5) | 26.5 (0.5) | 0.368 | |
| Dinner | 43.4 (0.5) | 42.3 (0.5) | 41.6 (0.6) | 0.033 | |
| All Snacks | 13.2 (0.3) | 12.8 (0.4) | 10.7 (0.3) | <0.001 | |
| Carbohydrate | Breakfast | 19.8 (0.3) | 22.8 (0.3) | 27.2 (0.4) | <0.001 |
| Lunch | 22.3 (0.3) | 21.3 (0.4) | 21.6 (0.4) | 0.082 | |
| Dinner | 31.7 (0.4) | 31.7 (0.5) | 32.1 (0.5) | 0.762 | |
| All Snacks | 26.2 (0.4) | 24.1 (0.4) | 19.1 (0.4) | <0.001 | |
| Added sugars | Breakfast | 22.6 (0.5) | 24.9 (0.5) | 27.0 (0.6) | <0.001 |
| Lunch | 19.2 (0.4) | 17.9 (0.4) | 18.7 (0.6) | 0.084 | |
| Dinner | 23.0 (0.5) | 24.4 (0.6) | 26.9 (0.6) | <0.001 | |
| All Snacks | 35.1 (0.6) | 32.9 (0.7) | 27.4 (0.7) | <0.001 | |
| Dietary fiber | Breakfast | 17.8 (0.3) | 20.9 (0.3) | 26.1 (0.5) | <0.001 |
| Lunch | 25.0 (0.4) | 22.9 (0.5) | 23.0 (0.4) | <0.001 | |
| Dinner | 37.8 (0.5) | 37.5 (0.6) | 35.9 (0.5) | 0.021 | |
| All Snacks | 19.4 (0.4) | 18.6 (0.4) | 15.1 (0.4) | <0.001 | |
| Total fat | Breakfast | 17.3 (0.3) | 19.2 (0.3) | 20.6 (0.4) | <0.001 |
| Lunch | 25.1 (0.4) | 24.8 (0.5) | 24.9 (0.5) | 0.886 | |
| Dinner | 38.5 (0.5) | 37.0 (0.5) | 37.7 (0.6) | 0.135 | |
| All Snacks | 19.2 (0.4) | 19.1 (0.5) | 16.8 (0.5) | <0.001 | |
| Saturated fat | Breakfast | 18.4 (0.3) | 20.3 (0.3) | 21.9 (0.4) | <0.001 |
| Lunch | 23.9 (0.4) | 23.8 (0.5) | 23.9 (0.5) | 0.988 | |
| Dinner | 37.7 (0.5) | 36.2 (0.6) | 36.5 (0.6) | 0.128 | |
| All Snacks | 19.9 (0.4) | 19.6 (0.5) | 17.6 (0.5) | 0.001 | |
| Monounsaturated fat | Breakfast | 17.2 (0.3) | 19.2 (0.3) | 20.3 (0.4) | <0.001 |
| Lunch | 25.3 (0.4) | 24.6 (0.5) | 24.9 (0.5) | 0.574 | |
| Dinner | 38.4 (0.5) | 37.1 (0.5) | 38.0 (0.6) | 0.165 | |
| All Snacks | 19.1 (0.4) | 19.1 (0.5) | 16.8 (0.5) | <0.001 | |
| Polyunsaturated fat | Breakfast | 16.6 (0.4) | 18.5 (0.4) | 20.1 (0.5) | <0.001 |
| Lunch | 26.6 (0.5) | 26.4 (0.6) | 26.1 (0.6) | 0.803 | |
| Dinner | 38.7 (0.5) | 37.2 (0.6) | 38.4 (0.6) | 0.198 | |
| All Snacks | 18.1 (0.4) | 17.9 (0.5) | 15.5 (0.5) | <0.001 | |
| Energy-Adjusted (per 1000 kcals) | Meal | Age Categories (Years) | p | ||
|---|---|---|---|---|---|
| 45–59 | 60–70 | ≥71 | |||
| Protein (g) | Breakfast | 37.1 (0.5) | 38.1 (0.6) | 35.5 (0.4) | 0.004 |
| Lunch | 47.1 (0.5) | 47.5 (0.6) | 46.9 (0.7) | 0.767 | |
| Dinner | 51.1 (0.5) | 50.8 (0.6) | 48.5 (0.5) | 0.001 | |
| All Snacks | 22 (0.4) | 22.4 (0.5) | 22.8 (0.4) | 0.336 | |
| Carbohydrate (g) | Breakfast | 141 (1.0) | 142 (1.0) | 152 (1.0) | <0.001 |
| Lunch | 117 (1.0) | 116 (1.2) | 120 (1.3) | 0.084 | |
| Dinner | 106 (1.0) | 108 (1.0) | 113 (1.0) | <0.001 | |
| All Snacks | 149 (1.0) | 149 (2) | 149 (1.0) | 0.914 | |
| Added sugars (g) | Breakfast | 39.1 (1.0) | 31.7 (0.9) | 27.6 (0.7) | <0.001 |
| Lunch | 26.2 (0.7) | 21.7 (0.8) | 21.7 (1.0) | <0.001 | |
| Dinner | 19.8 (0.5) | 18.9 (0.5) | 20.0 (0.6) | 0.211 | |
| All Snacks | 56.9 (1.1) | 49.7 (1.1) | 47.1 (1.1) | <0.001 | |
| Dietary fiber (g) | Breakfast | 8.8 (0.2) | 9.9 (0.3) | 11.5 (0.2) | <0.001 |
| Lunch | 9.5 (0.22) | 10.1 (0.2) | 10.3 (0.2) | 0.022 | |
| Dinner | 9.1 (0.1) | 10.1 (0.2) | 10.1 (0.2) | <0.001 | |
| All Snacks | 7.9 (0.2) | 8.9 (0.2) | 9.2 (0.2) | <0.001 | |
| Total fat (g) | Breakfast | 33.3 (0.4) | 32.7 (0.4) | 30.8 (0.4) | <0.001 |
| Lunch | 38.7 (0.44) | 39.4 (0.55) | 38.0 (0.4) | 0.095 | |
| Dinner | 39.5 (0.3) | 38.5 (0.4) | 38.3 (0.3) | 0.006 | |
| All Snacks | 29.9 (0.4) | 31.9 (0.5) | 32.8 (0.5) | <0.001 | |
| Saturated fat (g) | Breakfast | 11.6 (0.2) | 11.2 (0.2) | 10.7 (0.2) | 0.002 |
| Lunch | 11.7 (0.1) | 11.7 (0.2) | 11.6 (0.2) | 0.893 | |
| Dinner | 12.4 (0.1) | 12 (0.2) | 11.8 (0.1) | 0.008 | |
| All Snacks | 10.1 (0.1) | 10.7 (0.2) | 11.3 (0.2) | <0.001 | |
| Monounsaturated fat (g) | Breakfast | 12 (0.2) | 11.8 (0.2) | 10.9 (0.2) | <0.001 |
| Lunch | 13.9 (0.22) | 13.9 (0.22) | 13.5 (0.22) | 0.110 | |
| Dinner | 14 (0.1) | 13.8 (0.1) | 13.7 (0.1) | 0.060 | |
| All Snacks | 10.8 (0.2) | 11.7 (0.3) | 12 (0.2) | <0.001 | |
| Polyunsaturated fat (g) | Breakfast | 6.8 (0.1) | 6.9 (0.2) | 6.5 (0.1) | 0.145 |
| Lunch | 9.5 (0.1) | 10.2 (0.2) | 9.5 (0.22) | 0.026 | |
| Dinner | 9.3 (0.1) | 9.1 (0.2) | 9.2 (0.1) | 0.658 | |
| All Snacks | 6.4 (0.1) | 6.9 (0.2) | 6.8 (0.2) | 0.042 | |
© 2019 by the authors. Licensee MDPI, Basel, Switzerland. This article is an open access article distributed under the terms and conditions of the Creative Commons Attribution (CC BY) license (http://creativecommons.org/licenses/by/4.0/).
Share and Cite
Krok-Schoen, J.L.; Jonnalagadda, S.S.; Luo, M.; Kelly, O.J.; Taylor, C.A. Nutrient Intakes from Meals and Snacks Differ with Age in Middle-Aged and Older Americans. Nutrients 2019, 11, 1301. https://doi.org/10.3390/nu11061301
Krok-Schoen JL, Jonnalagadda SS, Luo M, Kelly OJ, Taylor CA. Nutrient Intakes from Meals and Snacks Differ with Age in Middle-Aged and Older Americans. Nutrients. 2019; 11(6):1301. https://doi.org/10.3390/nu11061301
Chicago/Turabian StyleKrok-Schoen, Jessica L., Satya S. Jonnalagadda, Menghua Luo, Owen J. Kelly, and Christopher A. Taylor. 2019. "Nutrient Intakes from Meals and Snacks Differ with Age in Middle-Aged and Older Americans" Nutrients 11, no. 6: 1301. https://doi.org/10.3390/nu11061301
APA StyleKrok-Schoen, J. L., Jonnalagadda, S. S., Luo, M., Kelly, O. J., & Taylor, C. A. (2019). Nutrient Intakes from Meals and Snacks Differ with Age in Middle-Aged and Older Americans. Nutrients, 11(6), 1301. https://doi.org/10.3390/nu11061301