Circulating Saturated Fatty Acids and Incident Type 2 Diabetes: A Systematic Review and Meta-Analysis


Abstract
:1. Introduction
2. Materials and Methods
2.1. Literature Search
2.2. Study Selection Criteria
2.3. Data Extraction
2.4. Quality Assessments
2.5. Data Analysis
3. Results
4. Discussion
5. Conclusions
Supplementary Materials
Author Contributions
Funding
Conflicts of Interest
References
- Alberti, K.G.; Zimmet, P.Z. Definition, diagnosis and classification of diabetes mellitus and its complications. Part 1: Diagnosis and classification of diabetes mellitus provisional report of a who consultation. Diabet. Med. 1998, 15, 539–553. [Google Scholar] [CrossRef]
- Cho, N.H.; Shaw, J.E.; Karuranga, S.; Huang, Y.; da Rocha Fernandes, J.D.; Ohlrogge, A.W.; Malanda, B. Idf diabetes atlas: Global estimates of diabetes prevalence for 2017 and projections for 2045. Diabetes Res. Clin. Pract. 2018, 138, 271–281. [Google Scholar] [CrossRef]
- Jacobs, E.; Hoyer, A.; Brinks, R.; Icks, A.; Kuss, O.; Rathmann, W. Healthcare costs of type 2 diabetes in germany. Diabet. Med. 2017, 34, 855–861. [Google Scholar] [CrossRef] [PubMed]
- American Diabetes, A. Economic costs of diabetes in the u.S. In 2017. Diabetes Care 2018, 41, 917–928. [Google Scholar] [CrossRef]
- Reis, J.P.; Loria, C.M.; Sorlie, P.D.; Park, Y.; Hollenbeck, A.; Schatzkin, A. Lifestyle factors and risk for new-onset diabetes: A population-based cohort study. Ann. Intern. Med. 2011, 155, 292–299. [Google Scholar] [CrossRef] [PubMed]
- Tsai, A.C.; Lee, S.H. Determinants of new-onset diabetes in older adults-results of a national cohort study. Clin. Nutr. 2015, 34, 937–942. [Google Scholar] [CrossRef]
- Khazrai, Y.M.; Defeudis, G.; Pozzilli, P. Effect of diet on type 2 diabetes mellitus: A review. Diabetes Metab. Res. Rev. 2014, 30 (Suppl. 1), 24–33. [Google Scholar] [CrossRef]
- Ludwig, D.S.; Willett, W.C.; Volek, J.S.; Neuhouser, M.L. Dietary fat: From foe to friend? Science 2018, 362, 764–770. [Google Scholar] [CrossRef]
- Feskens, E.J.; Virtanen, S.M.; Rasanen, L.; Tuomilehto, J.; Stengard, J.; Pekkanen, J.; Nissinen, A.; Kromhout, D. Dietary factors determining diabetes and impaired glucose tolerance. A 20-year follow-up of the finnish and dutch cohorts of the seven countries study. Diabetes Care 1995, 18, 1104–1112. [Google Scholar] [CrossRef]
- Parker, D.R.; Weiss, S.T.; Troisi, R.; Cassano, P.A.; Vokonas, P.S.; Landsberg, L. Relationship of dietary saturated fatty acids and body habitus to serum insulin concentrations: The normative aging study. Am. J. Clin. Nutr. 1993, 58, 129–136. [Google Scholar] [CrossRef]
- Wang, L.; Folsom, A.R.; Zheng, Z.J.; Pankow, J.S.; Eckfeldt, J.H.; Investigators, A.S. Plasma fatty acid composition and incidence of diabetes in middle-aged adults: The atherosclerosis risk in communities (aric) study. Am. J. Clin. Nutr. 2003, 78, 91–98. [Google Scholar]
- Lam, T.K.; Carpentier, A.; Lewis, G.F.; van de Werve, G.; Fantus, I.G.; Giacca, A. Mechanisms of the free fatty acid-induced increase in hepatic glucose production. Am. J. Physiol. Endocrinol. Metab. 2003, 284, E863–E873. [Google Scholar] [CrossRef]
- Zhang, Y.; Dong, L.; Yang, X.; Shi, H.; Zhang, L. Alpha-linolenic acid prevents endoplasmic reticulum stress-mediated apoptosis of stearic acid lipotoxicity on primary rat hepatocytes. Lipids Health Dis. 2011, 10, 81. [Google Scholar] [CrossRef]
- Cheon, H.G.; Cho, Y.S. Protection of palmitic acid-mediated lipotoxicity by arachidonic acid via channeling of palmitic acid into triglycerides in c2c12. J. Biomed. Sci. 2014, 21, 13. [Google Scholar] [CrossRef]
- Astrup, A.; Dyerberg, J.; Elwood, P.; Hermansen, K.; Hu, F.B.; Jakobsen, M.U.; Kok, F.J.; Krauss, R.M.; Lecerf, J.M.; LeGrand, P.; et al. The role of reducing intakes of saturated fat in the prevention of cardiovascular disease: Where does the evidence stand in 2010? Am. J. Clin. Nutr. 2011, 93, 684–688. [Google Scholar] [CrossRef]
- Aune, D.; Norat, T.; Romundstad, P.; Vatten, L.J. Dairy products and the risk of type 2 diabetes: A systematic review and dose-response meta-analysis of cohort studies. Am. J. Clin. Nutr. 2013, 98, 1066–1083. [Google Scholar] [CrossRef]
- de Souza, R.J.; Mente, A.; Maroleanu, A.; Cozma, A.I.; Ha, V.; Kishibe, T.; Uleryk, E.; Budylowski, P.; Schunemann, H.; Beyene, J.; et al. Intake of saturated and trans unsaturated fatty acids and risk of all cause mortality, cardiovascular disease, and type 2 diabetes: Systematic review and meta-analysis of observational studies. BMJ 2015, 351, h3978. [Google Scholar] [CrossRef]
- Hodson, L.; Skeaff, C.M.; Fielding, B.A. Fatty acid composition of adipose tissue and blood in humans and its use as a biomarker of dietary intake. Prog. Lipid Res. 2008, 47, 348–380. [Google Scholar] [CrossRef]
- Hodge, A.M.; English, D.R.; O’Dea, K.; Sinclair, A.J.; Makrides, M.; Gibson, R.A.; Giles, G.G. Plasma phospholipid and dietary fatty acids as predictors of type 2 diabetes: Interpreting the role of linoleic acid. Am. J. Clin. Nutr. 2007, 86, 189–197. [Google Scholar] [CrossRef]
- Krachler, B.; Norberg, M.; Eriksson, J.W.; Hallmans, G.; Johansson, I.; Vessby, B.; Weinehall, L.; Lindahl, B. Fatty acid profile of the erythrocyte membrane preceding development of type 2 diabetes mellitus. Nutr. Metab. Cardiovasc. Dis. 2008, 18, 503–510. [Google Scholar] [CrossRef]
- Mozaffarian, D.; Cao, H.; King, I.B.; Lemaitre, R.N.; Song, X.; Siscovick, D.S.; Hotamisligil, G.S. Trans-palmitoleic acid, metabolic risk factors, and new-onset diabetes in u.S. Adults: A cohort study. Ann. Intern. Med. 2010, 153, 790–799. [Google Scholar] [CrossRef] [PubMed]
- Patel, P.S.; Sharp, S.J.; Jansen, E.; Luben, R.N.; Khaw, K.T.; Wareham, N.J.; Forouhi, N.G. Fatty acids measured in plasma and erythrocyte-membrane phospholipids and derived by food-frequency questionnaire and the risk of new-onset type 2 diabetes: A pilot study in the european prospective investigation into cancer and nutrition (epic)-norfolk cohort. Am. J. Clin. Nutr. 2010, 92, 1214–1222. [Google Scholar] [PubMed]
- Kroger, J.; Zietemann, V.; Enzenbach, C.; Weikert, C.; Jansen, E.H.; Doring, F.; Joost, H.G.; Boeing, H.; Schulze, M.B. Erythrocyte membrane phospholipid fatty acids, desaturase activity, and dietary fatty acids in relation to risk of type 2 diabetes in the european prospective investigation into cancer and nutrition (epic)-potsdam study. Am. J. Clin. Nutr. 2011, 93, 127–142. [Google Scholar] [CrossRef]
- Mozaffarian, D.; de Oliveira Otto, M.C.; Lemaitre, R.N.; Fretts, A.M.; Hotamisligil, G.; Tsai, M.Y.; Siscovick, D.S.; Nettleton, J.A. Trans-palmitoleic acid, other dairy fat biomarkers, and incident diabetes: The multi-ethnic study of atherosclerosis (mesa). Am. J. Clin. Nutr. 2013, 97, 854–861. [Google Scholar] [CrossRef] [PubMed]
- Zong, G.; Zhu, J.; Sun, L.; Ye, X.; Lu, L.; Jin, Q.; Zheng, H.; Yu, Z.; Zhu, Z.; Li, H.; et al. Associations of erythrocyte fatty acids in the de novo lipogenesis pathway with risk of metabolic syndrome in a cohort study of middle-aged and older chinese. Am. J. Clin. Nutr. 2013, 98, 319–326. [Google Scholar] [CrossRef]
- Alhazmi, A.; Stojanovski, E.; Garg, M.L.; McEvoy, M. Fasting whole blood fatty acid profile and risk of type 2 diabetes in adults: A nested case control study. PLoS ONE 2014, 9, e97001. [Google Scholar] [CrossRef]
- Forouhi, N.G.; Koulman, A.; Sharp, S.J.; Imamura, F.; Kroger, J.; Schulze, M.B.; Crowe, F.L.; Huerta, J.M.; Guevara, M.; Beulens, J.W.; et al. Differences in the prospective association between individual plasma phospholipid saturated fatty acids and incident type 2 diabetes: The epic-interact case-cohort study. Lancet Diabetes Endocrinol. 2014, 2, 810–818. [Google Scholar] [CrossRef]
- Santaren, I.D.; Watkins, S.M.; Liese, A.D.; Wagenknecht, L.E.; Rewers, M.J.; Haffner, S.M.; Lorenzo, C.; Hanley, A.J. Serum pentadecanoic acid (15:0), a short-term marker of dairy food intake, is inversely associated with incident type 2 diabetes and its underlying disorders. Am. J. Clin. Nutr. 2014, 100, 1532–1540. [Google Scholar] [CrossRef] [PubMed]
- Lankinen, M.A.; Stancakova, A.; Uusitupa, M.; Agren, J.; Pihlajamaki, J.; Kuusisto, J.; Schwab, U.; Laakso, M. Plasma fatty acids as predictors of glycaemia and type 2 diabetes. Diabetologia 2015, 58, 2533–2544. [Google Scholar] [CrossRef] [PubMed]
- Lemaitre, R.N.; Fretts, A.M.; Sitlani, C.M.; Biggs, M.L.; Mukamal, K.; King, I.B.; Song, X.; Djousse, L.; Siscovick, D.S.; McKnight, B.; et al. Plasma phospholipid very-long-chain saturated fatty acids and incident diabetes in older adults: The cardiovascular health study. Am. J. Clin. Nutr. 2015, 101, 1047–1054. [Google Scholar] [CrossRef] [PubMed]
- Ma, W.; Wu, J.H.; Wang, Q.; Lemaitre, R.N.; Mukamal, K.J.; Djousse, L.; King, I.B.; Song, X.; Biggs, M.L.; Delaney, J.A.; et al. Prospective association of fatty acids in the de novo lipogenesis pathway with risk of type 2 diabetes: The cardiovascular health study. Am. J. Clin. Nutr. 2015, 101, 153–163. [Google Scholar] [CrossRef]
- Harris, W.S.; Luo, J.; Pottala, J.V.; Margolis, K.L.; Espeland, M.A.; Robinson, J.G. Red blood cell fatty acids and incident diabetes mellitus in the women’s health initiative memory study. PLoS ONE 2016, 11, e0147894. [Google Scholar] [CrossRef]
- Takkunen, M.J.; Schwab, U.S.; de Mello, V.D.; Eriksson, J.G.; Lindstrom, J.; Tuomilehto, J.; Uusitupa, M.I.; Group, D.P.S.S. Longitudinal associations of serum fatty acid composition with type 2 diabetes risk and markers of insulin secretion and sensitivity in the finnish diabetes prevention study. Eur. J. Nutr. 2016, 55, 967–979. [Google Scholar] [CrossRef]
- Yakoob, M.Y.; Shi, P.; Willett, W.C.; Rexrode, K.M.; Campos, H.; Orav, E.J.; Hu, F.B.; Mozaffarian, D. Circulating biomarkers of dairy fat and risk of incident diabetes mellitus among men and women in the united states in two large prospective cohorts. Circulation 2016, 133, 1645–1654. [Google Scholar] [CrossRef]
- Akter, S.; Kurotani, K.; Sato, M.; Hayashi, T.; Kuwahara, K.; Matsushita, Y.; Nakagawa, T.; Konishi, M.; Honda, T.; Yamamoto, S.; et al. High serum phospholipid dihomo-gamma-linoleic acid concentration and low delta5-desaturase activity are associated with increased risk of type 2 diabetes among japanese adults in the hitachi health study. J. Nutr. 2017, 147, 1558–1566. [Google Scholar] [CrossRef]
- Lin, J.S.; Dong, H.L.; Chen, G.D.; Chen, Z.Y.; Dong, X.W.; Zheng, J.S.; Chen, Y.M. Erythrocyte saturated fatty acids and incident type 2 diabetes in chinese men and women: A prospective cohort study. Nutrients 2018, 10, 1393. [Google Scholar] [CrossRef]
- Lu, Y.; Wang, Y.; Zou, L.; Liang, X.; Ong, C.N.; Tavintharan, S.; Yuan, J.M.; Koh, W.P.; Pan, A. Serum lipids in association with type 2 diabetes risk and prevalence in a chinese population. J. Clin. Endocrinol. Metab. 2018, 103, 671–680. [Google Scholar] [CrossRef]
- Imamura, F.; Fretts, A.; Marklund, M.; Ardisson Korat, A.V.; Yang, W.S.; Lankinen, M.; Qureshi, W.; Helmer, C.; Chen, T.A.; Wong, K.; et al. Fatty acid biomarkers of dairy fat consumption and incidence of type 2 diabetes: A pooled analysis of prospective cohort studies. PLoS Med. 2018, 15, e1002670. [Google Scholar] [CrossRef]
- Stroup, D.F.; Berlin, J.A.; Morton, S.C.; Olkin, I.; Williamson, G.D.; Rennie, D.; Moher, D.; Becker, B.J.; Sipe, T.A.; Thacker, S.B. Meta-analysis of observational studies in epidemiology: A proposal for reporting. Meta-analysis of observational studies in epidemiology (moose) group. JAMA 2000, 283, 2008–2012. [Google Scholar] [CrossRef]
- The Newcastle-Ottawa Scale (NOS) for Assessing the Quality of Non-Randomised Studies in Meta-Analyses. Available online: http://www.ohri.ca/programs/clinical_epidemiology/oxford.asp (accessed on 10 July 2018).
- Stang, A. Critical evaluation of the newcastle-ottawa scale for the assessment of the quality of nonrandomized studies in meta-analyses. Eur. J. Epidemiol. 2010, 25, 603–605. [Google Scholar] [CrossRef]
- Higgins, J.P.; Thompson, S.G.; Deeks, J.J.; Altman, D.G. Measuring inconsistency in meta-analyses. BMJ 2003, 327, 557–560. [Google Scholar] [CrossRef]
- DerSimonian, R.; Laird, N. Meta-analysis in clinical trials. Control Clin. Trials 1986, 7, 177–188. [Google Scholar] [CrossRef]
- Begg, C.B.; Mazumdar, M. Operating characteristics of a rank correlation test for publication bias. Biometrics 1994, 50, 1088–1101. [Google Scholar] [CrossRef]
- Egger, M.; Davey Smith, G.; Schneider, M.; Minder, C. Bias in meta-analysis detected by a simple, graphical test. BMJ 1997, 315, 629–634. [Google Scholar] [CrossRef]
- American Diabetes, A. Diagnosis and classification of diabetes mellitus. Diabetes Care 2014, 37 (Suppl. 1), S81–90. [Google Scholar] [CrossRef]
- Yang, W.S.; Chen, P.C.; Hsu, H.C.; Su, T.C.; Lin, H.J.; Chen, M.F.; Lee, Y.T.; Chien, K.L. Differential effects of saturated fatty acids on the risk of metabolic syndrome: A matched case-control and meta-analysis study. Metabolism 2018, 83, 42–49. [Google Scholar] [CrossRef] [PubMed]
- Calder, P.C. Functional roles of fatty acids and their effects on human health. JPEN J. Parenter. Enteral. Nutr. 2015, 39, 18S–32S. [Google Scholar] [CrossRef] [PubMed]
- Santaren, I.D.; Watkins, S.M.; Liese, A.D.; Wagenknecht, L.E.; Rewers, M.J.; Haffner, S.M.; Lorenzo, C.; Festa, A.; Bazinet, R.P.; Hanley, A.J. Individual serum saturated fatty acids and markers of chronic subclinical inflammation: The insulin resistance atherosclerosis study. J. Lipid Res. 2017, 58, 2171–2179. [Google Scholar] [CrossRef]
- Zheng, J.S.; Sharp, S.J.; Imamura, F.; Koulman, A.; Schulze, M.B.; Ye, Z.; Griffin, J.; Guevara, M.; Huerta, J.M.; Kroger, J.; et al. Association between plasma phospholipid saturated fatty acids and metabolic markers of lipid, hepatic, inflammation and glycaemic pathways in eight european countries: A cross-sectional analysis in the epic-interact study. BMC Med. 2017, 15, 203. [Google Scholar] [CrossRef]
- Brevik, A.; Veierod, M.B.; Drevon, C.A.; Andersen, L.F. Evaluation of the odd fatty acids 15:0 and 17:0 in serum and adipose tissue as markers of intake of milk and dairy fat. Eur. J. Clin. Nutr. 2005, 59, 1417–1422. [Google Scholar] [CrossRef] [PubMed]
- Jenkins, B.J.; Seyssel, K.; Chiu, S.; Pan, P.H.; Lin, S.Y.; Stanley, E.; Ament, Z.; West, J.A.; Summerhill, K.; Griffin, J.L.; et al. Odd chain fatty acids; new insights of the relationship between the gut microbiota, dietary intake, biosynthesis and glucose intolerance. Sci. Rep. 2017, 7, 44845. [Google Scholar] [CrossRef]
- Jenkins, B.; Aoun, M.; Feillet-Coudray, C.; Coudray, C.; Ronis, M.; Koulman, A. The dietary total-fat content affects the in vivo circulating c15:0 and c17:0 fatty acid levels independently. Nutrients 2018, 10, 1646. [Google Scholar] [CrossRef]
- Yakoob, M.Y.; Shi, P.; Hu, F.B.; Campos, H.; Rexrode, K.M.; Orav, E.J.; Willett, W.C.; Mozaffarian, D. Circulating biomarkers of dairy fat and risk of incident stroke in u.S. Men and women in 2 large prospective cohorts. Am. J. Clin. Nutr. 2014, 100, 1437–1447. [Google Scholar] [CrossRef]
- Khaw, K.T.; Friesen, M.D.; Riboli, E.; Luben, R.; Wareham, N. Plasma phospholipid fatty acid concentration and incident coronary heart disease in men and women: The epic-norfolk prospective study. PLoS Med. 2012, 9, e1001255. [Google Scholar] [CrossRef] [PubMed]
- Hellerstein, M.K.; Schwarz, J.M.; Neese, R.A. Regulation of hepatic de novo lipogenesis in humans. Annu. Rev. Nutr. 1996, 16, 523–557. [Google Scholar] [CrossRef] [PubMed]
- Hudgins, L.C.; Hellerstein, M.; Seidman, C.; Neese, R.; Diakun, J.; Hirsch, J. Human fatty acid synthesis is stimulated by a eucaloric low fat, high carbohydrate diet. J. Clin. Invest. 1996, 97, 2081–2091. [Google Scholar] [CrossRef] [PubMed]
- Chong, M.F.; Fielding, B.A.; Frayn, K.N. Metabolic interaction of dietary sugars and plasma lipids with a focus on mechanisms and de novo lipogenesis. Proc. Nutr. Soc. 2007, 66, 52–59. [Google Scholar] [CrossRef] [PubMed]
- Wu, J.H.; Lemaitre, R.N.; Imamura, F.; King, I.B.; Song, X.; Spiegelman, D.; Siscovick, D.S.; Mozaffarian, D. Fatty acids in the de novo lipogenesis pathway and risk of coronary heart disease: The cardiovascular health study. Am. J. Clin. Nutr. 2011, 94, 431–438. [Google Scholar] [CrossRef] [PubMed]
- Rhee, E.P.; Cheng, S.; Larson, M.G.; Walford, G.A.; Lewis, G.D.; McCabe, E.; Yang, E.; Farrell, L.; Fox, C.S.; O’Donnell, C.J.; et al. Lipid profiling identifies a triacylglycerol signature of insulin resistance and improves diabetes prediction in humans. J. Clin. Invest. 2011, 121, 1402–1411. [Google Scholar] [CrossRef]
- Poitout, V.; Robertson, R.P. Glucolipotoxicity: Fuel excess and beta-cell dysfunction. Endocr. Rev. 2008, 29, 351–366. [Google Scholar] [CrossRef]
- King, I.B.; Lemaitre, R.N.; Kestin, M. Effect of a low-fat diet on fatty acid composition in red cells, plasma phospholipids, and cholesterol esters: Investigation of a biomarker of total fat intake. Am. J. Clin. Nutr. 2006, 83, 227–236. [Google Scholar] [CrossRef] [PubMed]
- Borkman, M.; Storlien, L.H.; Pan, D.A.; Jenkins, A.B.; Chisholm, D.J.; Campbell, L.V. The relation between insulin sensitivity and the fatty-acid composition of skeletal-muscle phospholipids. N. Engl. J. Med. 1993, 328, 238–244. [Google Scholar] [CrossRef]
- Kihara, A. Very long-chain fatty acids: Elongation, physiology and related disorders. J. Biochem. 2012, 152, 387–395. [Google Scholar] [CrossRef] [PubMed]
- Jiang, R.; Manson, J.E.; Stampfer, M.J.; Liu, S.; Willett, W.C.; Hu, F.B. Nut and peanut butter consumption and risk of type 2 diabetes in women. JAMA 2002, 288, 2554–2560. [Google Scholar] [CrossRef] [PubMed]
- Quehenberger, O.; Armando, A.M.; Brown, A.H.; Milne, S.B.; Myers, D.S.; Merrill, A.H.; Bandyopadhyay, S.; Jones, K.N.; Kelly, S.; Shaner, R.L.; et al. Lipidomics reveals a remarkable diversity of lipids in human plasma. J. Lipid Res. 2010, 51, 3299–3305. [Google Scholar] [CrossRef] [PubMed]
- Kusminski, C.M.; Shetty, S.; Orci, L.; Unger, R.H.; Scherer, P.E. Diabetes and apoptosis: Lipotoxicity. Apoptosis 2009, 14, 1484–1495. [Google Scholar] [CrossRef] [PubMed]
- Chavez, J.A.; Summers, S.A. A ceramide-centric view of insulin resistance. Cell Metab. 2012, 15, 585–594. [Google Scholar] [CrossRef]
- Kroger, J.; Jacobs, S.; Jansen, E.H.; Fritsche, A.; Boeing, H.; Schulze, M.B. Erythrocyte membrane fatty acid fluidity and risk of type 2 diabetes in the epic-potsdam study. Diabetologia 2015, 58, 282–289. [Google Scholar] [CrossRef]
- Imamura, F.; Sharp, S.J.; Koulman, A.; Schulze, M.B.; Kroger, J.; Griffin, J.L.; Huerta, J.M.; Guevara, M.; Sluijs, I.; Agudo, A.; et al. A combination of plasma phospholipid fatty acids and its association with incidence of type 2 diabetes: The epic-interact case-cohort study. PLoS Med. 2017, 14, e1002409. [Google Scholar] [CrossRef]


| Author (Year) | Study *, Location | Follow-up (Year) | Total N (n Cases) | Age (year), Male (%) | Ascertainment of Diabetes | Individual SFAs | Lipid Fraction | Exposure Categories | Adjustment | NOSC Score |
|---|---|---|---|---|---|---|---|---|---|---|
| Hodge (2007) [19] | MCCS, Australia | 4 | 3737 (346) | 36–72, 41 | Self-reported | C15:0, C16:0, C18:0 | PL | Quintile | Age, sex, country of birth, family history of diabetes, physical activity, alcohol intake, BMI and WHR. | 7 |
| Krachler (2008) [20] | VIP, Sweden | 5.4 | 450 (159) | 40–60, 49 | HbA1c, OGTT | C14:0, C15:0, C16:0, C17:0, C18:0 | EM | Continuous | Alcohol intake, BMI, HbA1c. | 7 |
| Mozaffarian (2010) [21] | CHS, America | 10 | 3736 (304) | ≥65, 42 | OGTT, medication | C15:0, C17:0, | PL | Continuous | Age, gender, race, education, enrollment site, smoking, BMI, waist circumference, coronary heart disease, physical activity, alcohol use, and consumption of carbohydrate, protein, red meat, whole-fat dairy foods, low-fat dairy foods, and total energy. | 9 |
| Patel (2010) [22] | EPIC-norfolk, Europe | 10 | 383 (199) | 40–79, 47 | Self-reported, medication | C14:0, C15:0, C16:0, C17:0, C18:0 | PL/EM | Tertile | Age, sex, family history of diabetes, BMI, smoking status, physical activity, and alcohol intake. | 9 |
| Kröger (2011) [23] | EPIC-Potsdam, Europe | 7 | 2724 (412) | 35–65, 43 | Self-reported, medication | C14:0, C15:0, C16:0, C17:0, C18:0, C20:0, C21:0, C22:0, C23:0, C24:0 | EM | Quintile | Age, sex, BMI, waist circumference, cycling, sports activity, education, smoking status, alcohol intake, occupational activity, coffee intake and fiber intake. | 9 |
| Mozaffarian (2013) [24] | MESA, America | 5 | 2281 (205) | 45–84, 47 | Fasting glucose, medication | C14:0, C15:0 | PL | Quintile | Age, sex, race-ethnicity, education, field center, smoking status, alcohol use, physical activity, BMI, and waist circumference, dietary consumption of whole-fat dairy foods, low-fat dairy foods, red meat, and total energy. | 8 |
| Zong (2013) [25] | NHAPC, China | 6 | not available | 50–70, 45 | Fasting glucose, medication | C16:0 | EM | Quartile | Age, sex, region, residence, physical activity, educational attainment, current smoking, BMI, current drinking, family history of diabetes, total energy intake, percentage of energy intake from carbohydrate, and energy-adjusted dietary GI. | 8 |
| Santaren (2014) [28] | IRAS, America | 5 | 659 (103) | 40–60, 45 | OGTT | C15:0 | SL | Continuous | Age, sex, ethnicity, center, physical activity, smoking status, alcohol intake, education, and total energy, fruit and vegetable, red meat, soft drink and fiber intakes. | 8 |
| Lemaitre (2015) [30] | CHS, America | 10 | 3179 (284) | ≥65, 39 | Fasting glucose, non-fasting glucose and medication | C20:0, C22:0, C24:0 | PL | Quartile | Age sex, race, clinic, education, smoking, alcohol use, BMI, waist circumference, physical activity, treated hypertension, prevalent ischemic heart disease, and self-reported health status at baseline. | 9 |
| Ma (2015) [31] | CHS, America | 10 | 3004 (297) | ≥65, 40 | Fasting glucose, non-fasting or 2h-glucose and medication | C14:0, C16:0, C18:0 | PL | Quintile | Age, sex, race, education, clinic, smoking status, alcohol consumption, leisure time physical activity, prevalence of ischemic heart disease, hypertension at baseline, BMI, protein, waist circumference, consumption of carbohydrate, and total energy. | 9 |
| Alhazmi (2014) [26] | HCS, Australia | 5 | 187 (37) | 55–85, 51 | Self-reported | C16:0, C18:0, C24:0 | WB | Continuous | Age and gender, BMI; physical activity; alcohol intake; smoking; supplement use, carbohydrate, fiber, and protein. | 6 |
| Forouhi (2014) [27] | EPIC-InterAct, Europe | 11.7 | 27,296 (12,132) | 53.7(mean), 38 | Self-reported, care registers, hospital admissions, mortality data, medication | C14:0, C15:0, C16:0, C17:0, C18:0, C20:0, C22:0, C24:0 | PL | Continuous | Age, sex, center, physical activity, smoking status, and education level, total energy intake, alcohol intake, and BMI. | 9 |
| Lankinen (2015) [29] | METSIM, Finland | 5.9 | 1302 (71) | 45–68, 100 | OGTT, HbAlc | C14:0, C15:0, C16:0, C17:0, C18:0, C20:0, C22:0, C24:0 | PL | Continuous | Age, BMI, smoking, physical activity and fasting glucose at baseline. | 5 |
| Harris (2016) [32] | WHIMS, America | 11 | 6379 (703) | 65–80, 0 | Self-reported | C14:0, C16:0, C18:0, C20:0, C22:0, C24:0 | EM | Continuous | Age, race, waist circumference, highest education, current smoking status, physical activity, weekly alcohol intake, glycemic load, and family history of diabetes. | 7 |
| Takkunen (2016) [33] | FDPS, Finland | 11 | 383 (155) | 40–65, 33 | OGTT | C14:0, C15:0, C16:0, C18:0 | SL | Continuous | Age, sex, study group, smoking, alcohol intake, waist circumference and physical activity at leisure time, study centers, fiber intake, carbohydrate intake, energy intake and serum triglyceride concentration, concentrations of plasma fasting and 2-h glucose. | 8 |
| Yakoob (2016) [34] | NHS and HPFUS, America | 15.2 | 3333 (277) | 30–75, 44 | Self-reported | C14:0, C15:0, C17:0 | PL | Quartile | Age, race, smoking status, physical activity, alcohol, family history of diabetes mellitus, parental history of MI, hypertension, hypercholesterolemia, menopausal status, postmenopausal hormone use, and consumption of fish, processed meats, unprocessed meats, fruits, vegetables, whole grains, coffee, sugar-sweetened beverages, glycemic load, dietary calcium, total energy, polyunsaturated fat, and plasma trans-18:1, trans-18:2, 16:0, and 18:0. | 7 |
| Akter (2017) [35] | Hitachi Health Study, Japan | 5 | 1014 (336) | 34–69, 91 | HbA1c, fasting or non-fasting glucose, medication | C14:0, C15:0, C16:0, C17:0, C18:0, C20:0 | SL | Quartile | Age, sex, and month of examination, leisure-time physical activity, occupational physical activity, smoking status, alcohol consumption, shift work, sleep duration, family history of diabetes, and hypertension, BMI. | 7 |
| Lin (2018) [36] | GNHS, China | 5.6 | 2683 (216) | 40–75, 33 | Fasting glucose, HbAlc, medications | C14:0, C16:0, C18:0, C20:0, C22:0, C24:0 | EM | Quintile/Continuous | Sex, BMI, WHR, smoking status, alcohol drinking, tea drinking, education level, household income, physical activity, family history of diabetes, total energy intake, low-density lipoprotein cholesterol, high-density lipoprotein cholesterol, triglycerides and fasting glucose. | 8 |
| Lu (2018) [37] | SCHS, Singapore | 6 | 320 (160) | 60–70, 49 | HbAlc | C14:0, C16:0, C18:0 | SL | Tertile/Continuous | BMI, history of hypertension, smoking, physical activity, fasting status, HDL-cholesterol, triglycerides, random glucose and HbA1c levels. | 8 |
| Author (Year) | Myristic Acid (C14:0) | Pentadecanoic Acid (C15:0) | Palmitic Acid (C16:0) | Heptadecanoic Acid (C17:0) | Stearic Acid (C18:0) | Arachidic Acid (C20:0) | Heneicosanoic Acid (C21:0) | Behenic Acid (C22:0) | Tricosanoic Acid (C23:0) | Lignoceric Acid (C24:0) |
|---|---|---|---|---|---|---|---|---|---|---|
| Per each SD increment | ||||||||||
| Krachler (2008) [20] | ○ | ↓ | ○ | ↓ | ○ | |||||
| Mozaffarian (2010) [21] | ○ | ○ | ||||||||
| Alhazmi (2014) [26] | ○ | ○ | ↓ | |||||||
| Forouhi (2014) [27] | ↑ | ↓ | ↑ | ↓ | ↑ | ↓ | ↓ | ↓ | ↓ | |
| Santaren (2014) [28] | ↓ | |||||||||
| Lankinen (2015) [29] | ○ | ○ | ○ | ○ | ↑ | ○ | ○ | ○ | ||
| Harris (2016) [32] | ↑ | ↑ | ○ | ○ | ○ | ○ | ||||
| Takkunen (2016) [33] | ○ | ○ | ○ | ○ | ||||||
| Lin (2018) [36] | ↑ | ○ | ○ | ○ | ↑ | ○ | ||||
| Lu (2018) [37] | ↑ | ↑ | ↑ | |||||||
| Highest vs. lowest | ||||||||||
| Hodge (2007) [19] | ↓ | ○ | ↑ | |||||||
| Patel (2010) [22] | ○ | ○ | ↑ | ↓ | ↓/○ * | |||||
| Kröger (2011) [23] | ○ | ○ | ○ | ○ | ○ | ↓ | ○ | ○ | ○ | ↑ |
| Mozaffarian (2013) [24] | ○ | ○ | ||||||||
| Zong (2013) [25] | ↑ | |||||||||
| Lemaitre (2015) [30] | ↓ | ↓ | ↓ | |||||||
| Ma (2015) [31] | ○ | ↑ | ↑ | |||||||
| Yakoob (2016) [34] | ○ | ↓ | ↓ | |||||||
| Akter (2017) [35] | ○ | ○ | ○ | ○ | ○ | ○ | ||||
| Lin (2018) [36] | ○ | ↓ | ↑ | ↑ | ○ | ○ | ||||
| Lu (2018) [37] | ↑ | ↑ | ↑ |
| Saturated Fatty Acids | No. of Studies | Total N (n Cases) | Follow-up Years (Mean) * | Summary Estimate (95% CI) | P | Heterogeneity Test | Effect Model | PBegg | PEgger |
|---|---|---|---|---|---|---|---|---|---|
| Odd-chain SFAs | |||||||||
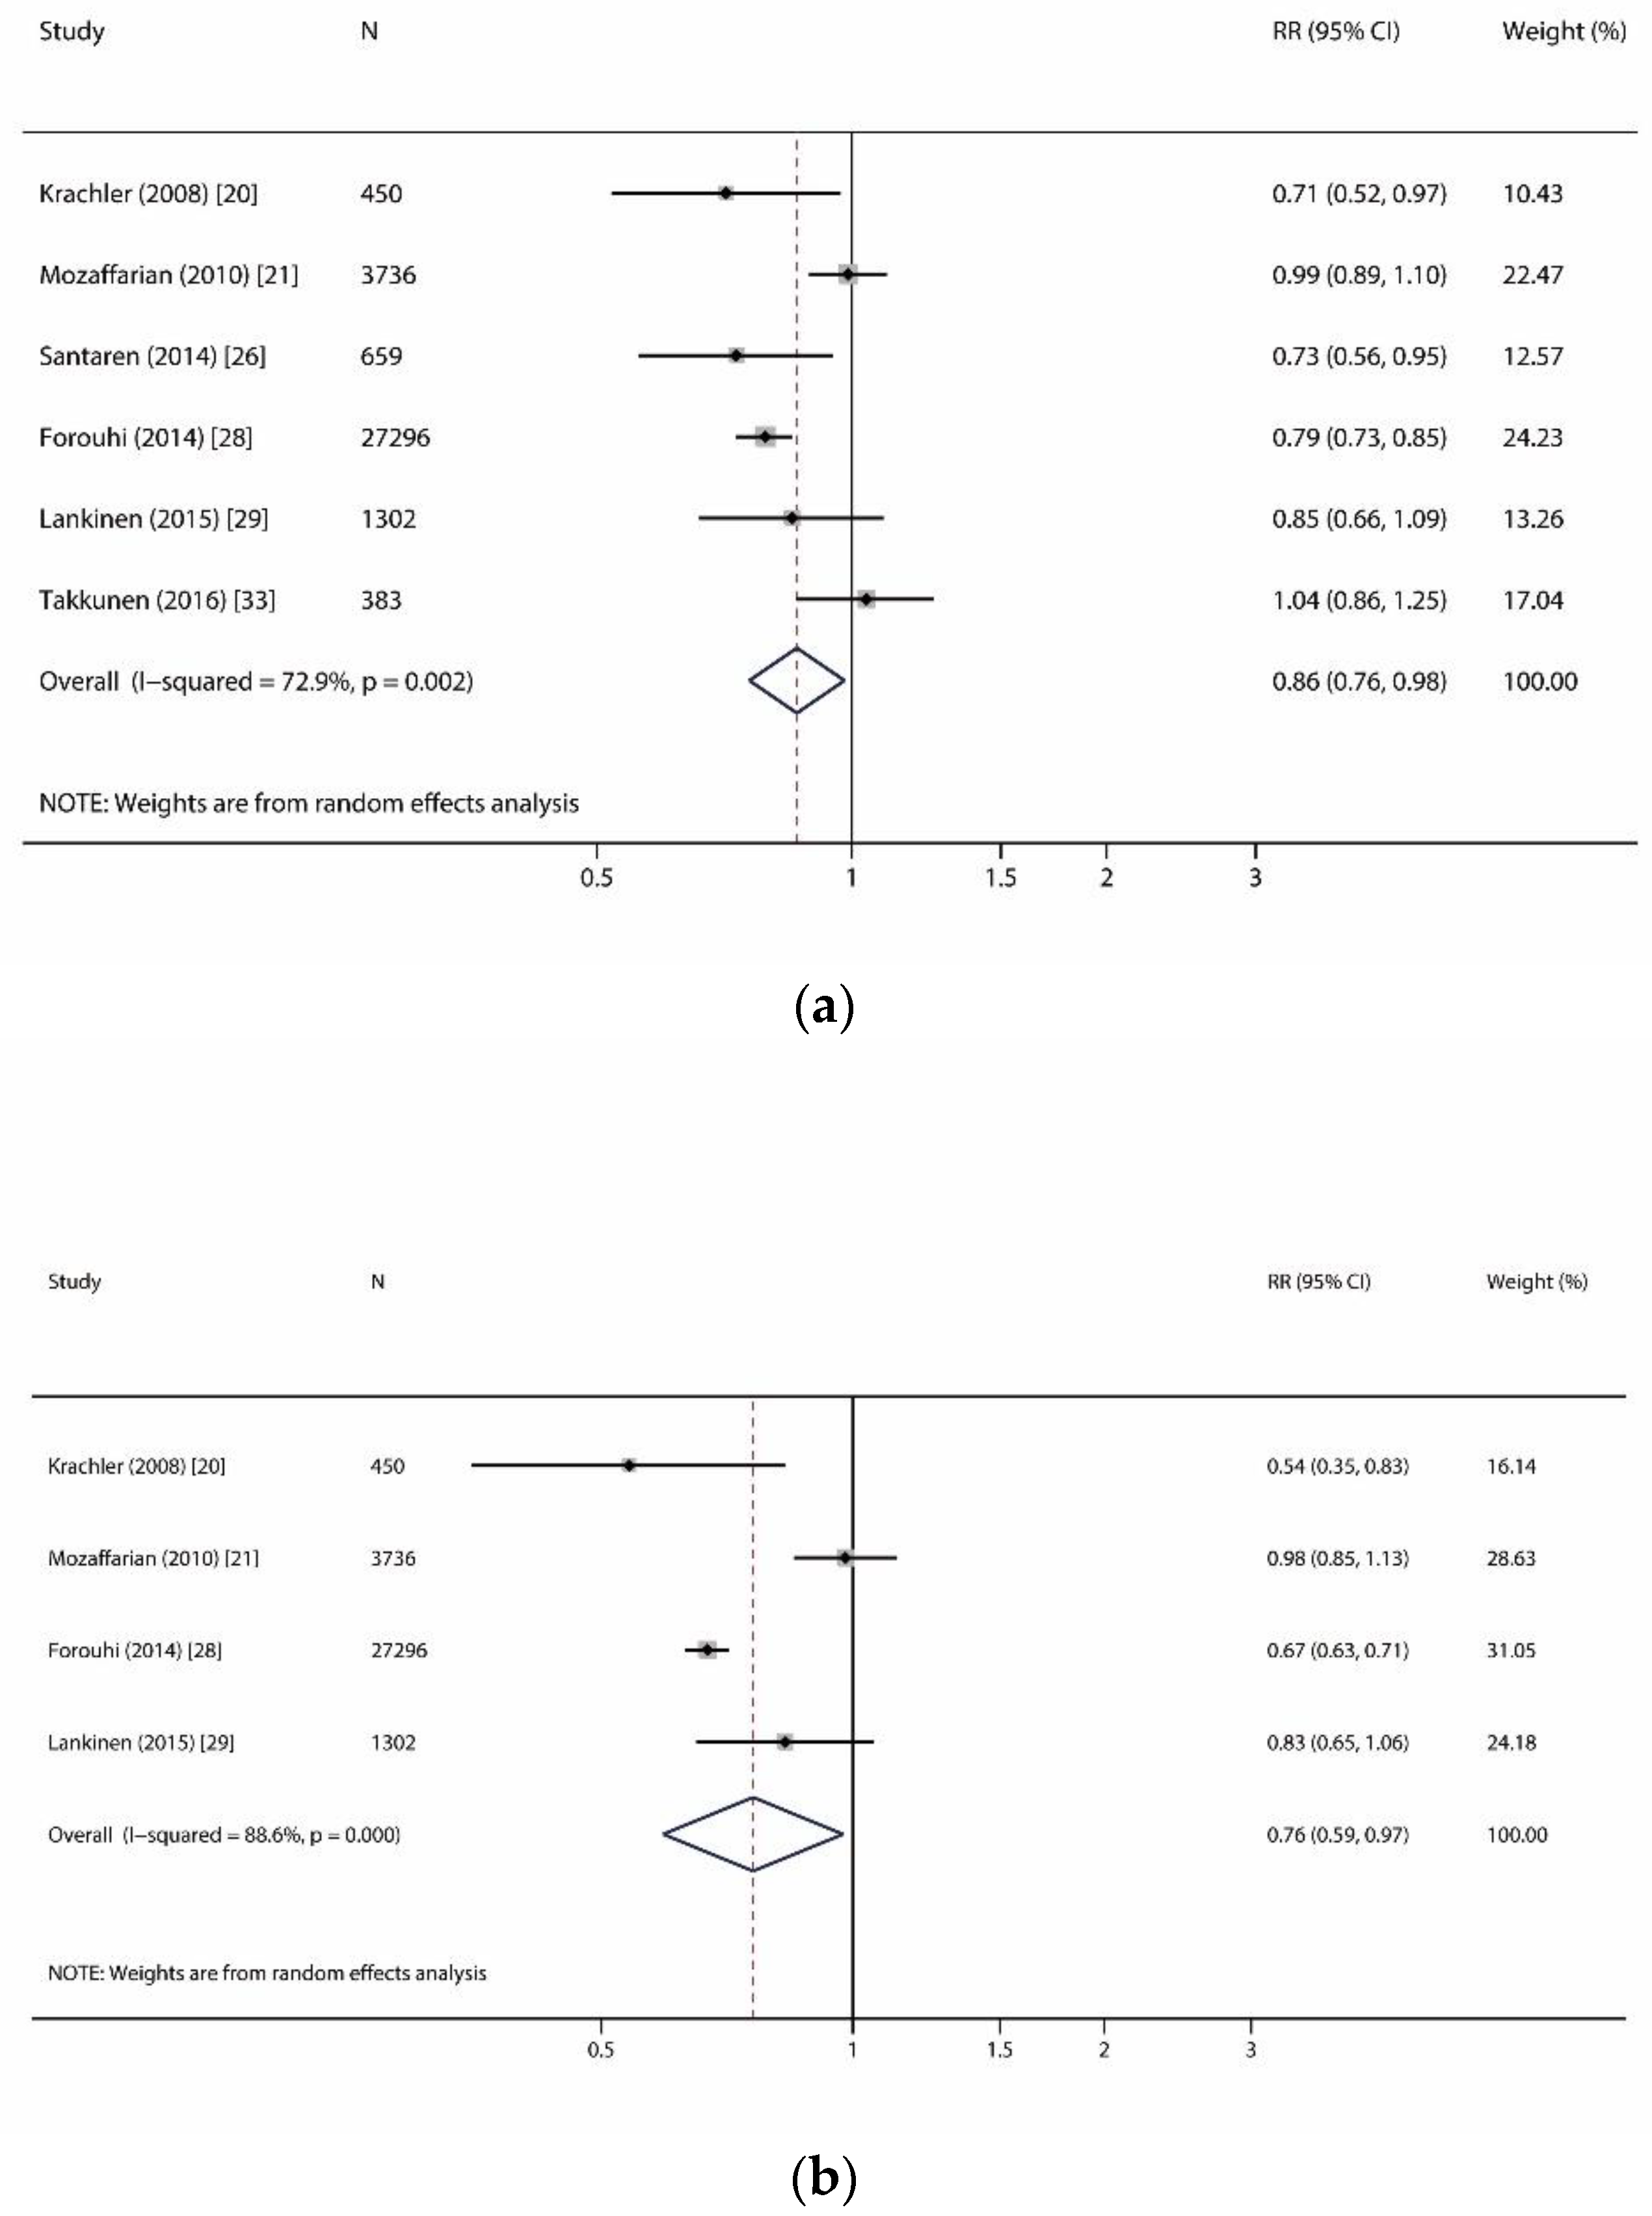
| Pentadecanoic acid (C15:0) | 6 | 33,826 (12,924) | 11.1 | 0.86 (0.76, 0.98) | 0.023 | p = 0.002, I2 = 72.9% | R | 0.707 | 0.950 |
| Heptadecanoic acid (C17:0) | 4 | 32,784 (12,666) | 11.2 | 0.76 (0.59, 0.97) | 0.030 | p < 0.001, I2 = 88.6% | R | 1.000 | 0.606 |
| Even-chain SFAs | |||||||||
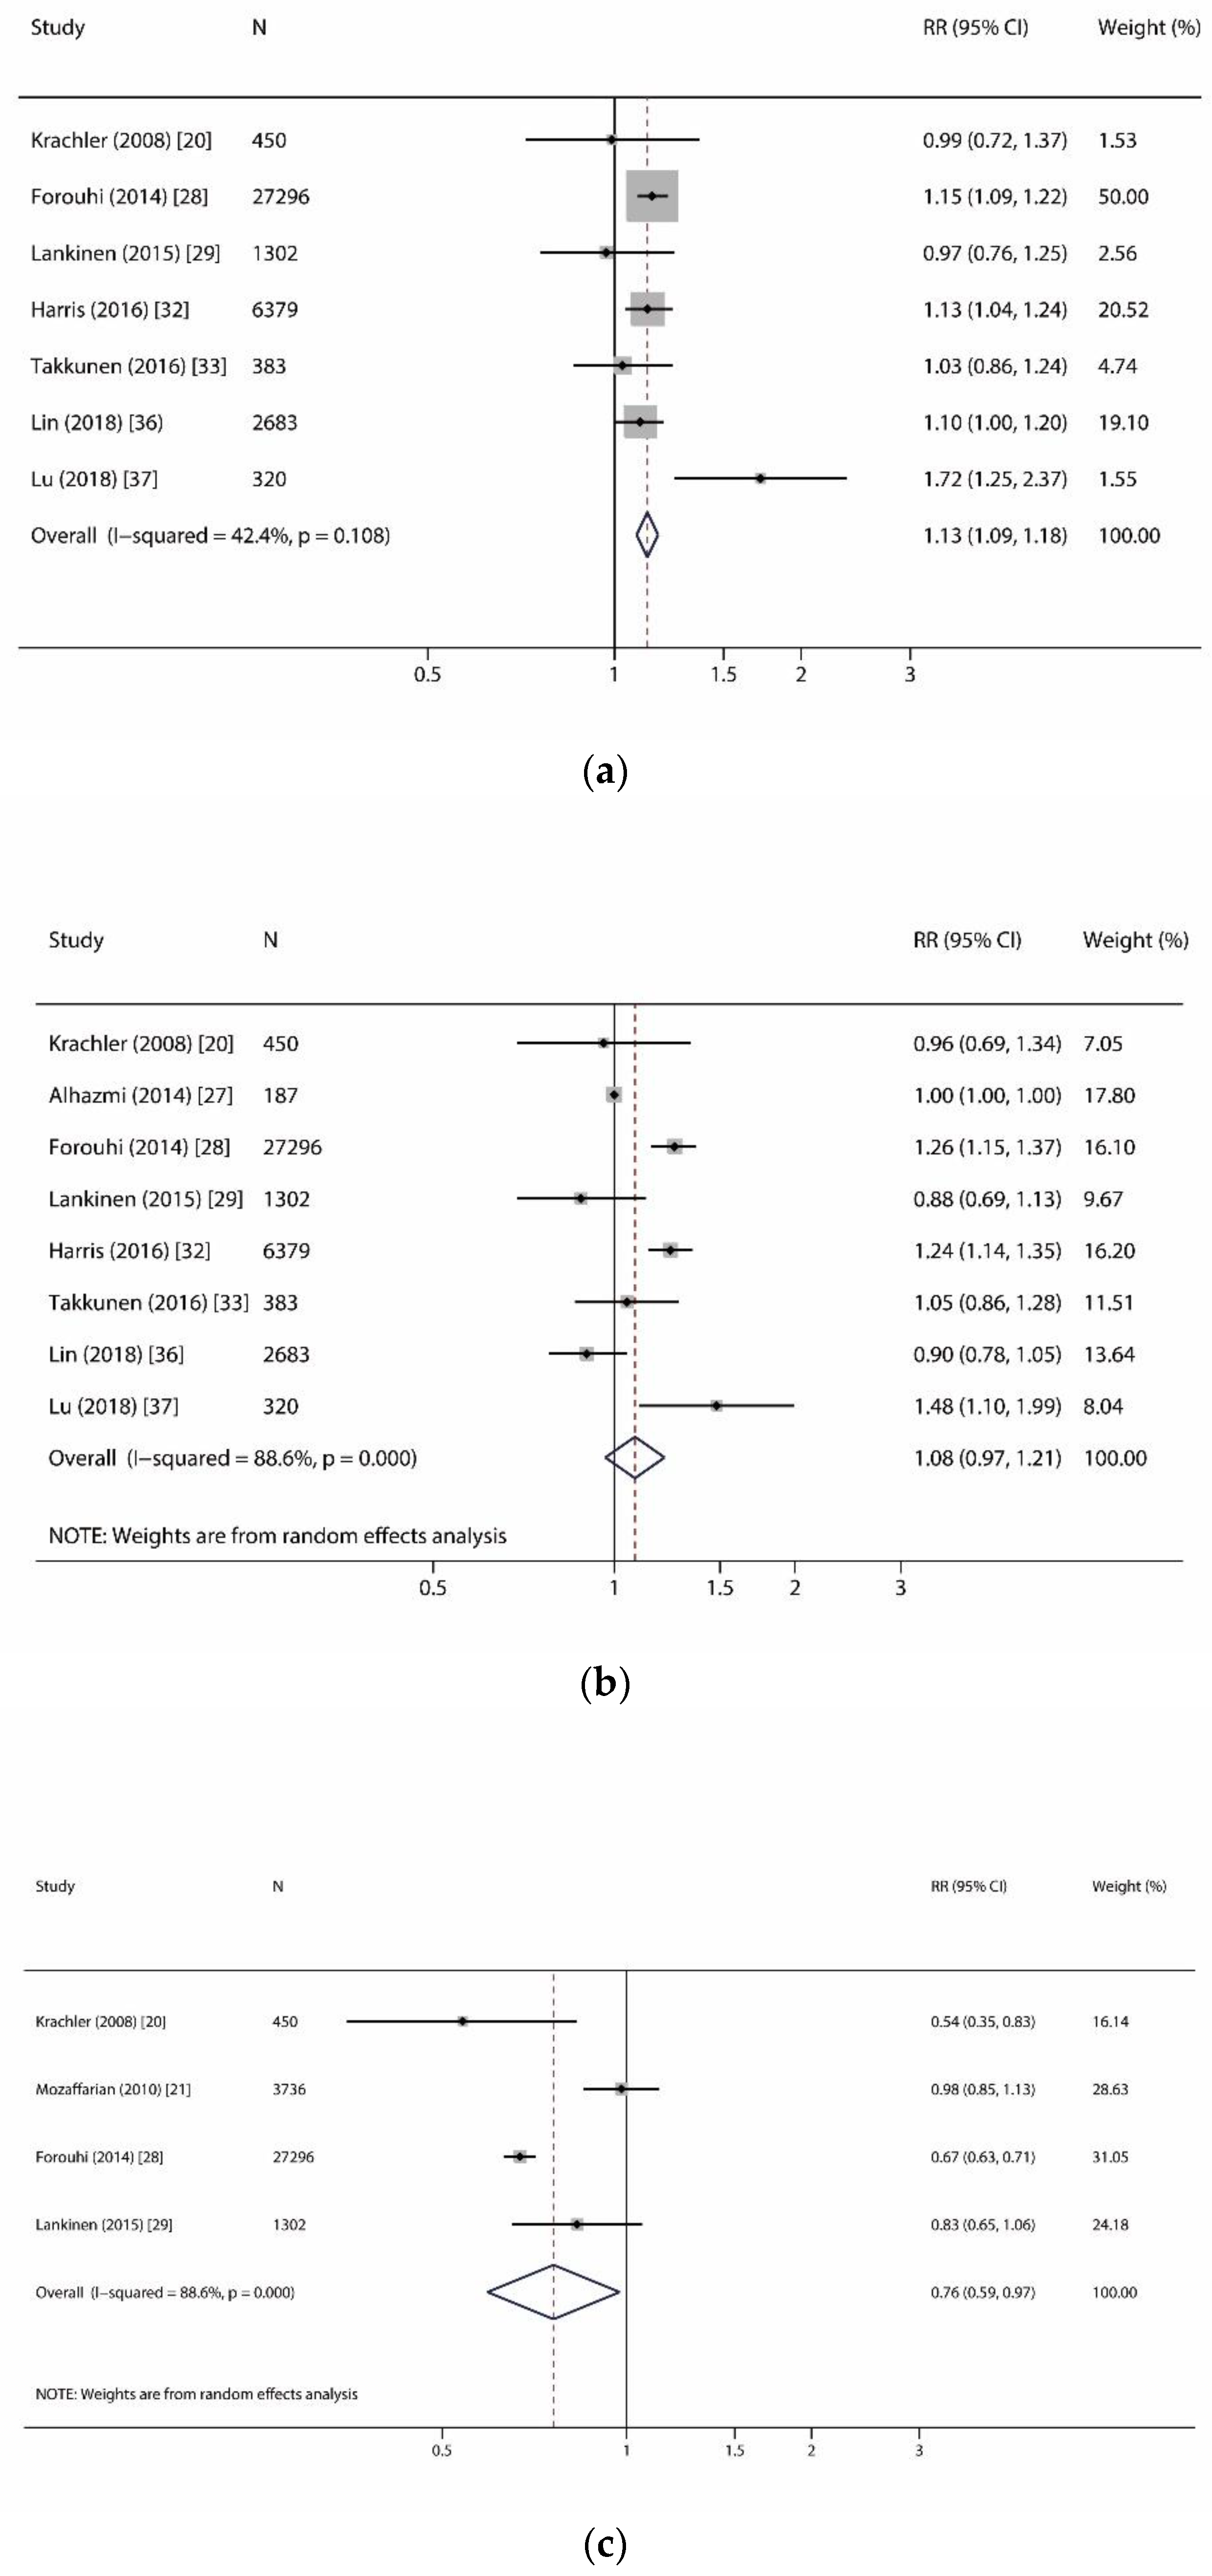
| Myristic acid (C14:0) | 7 | 38,813 (13,596) | 10.8 | 1.13 (1.09, 1.18) | <0.001 | p = 0.108, I2 = 42.4% | F | 0.368 | 0.863 |
| Palmitic acid (C16:0) | 8 | 39,000 (13,633) | 10.8 | 1.08 (0.97, 1.21) | 0.169 | p < 0.001, I2 = 88.6% | R | 0.902 | 0.199 |
| Stearic acid (C18:0) | 8 | 39,000 (13,633) | 10.8 | 1.05 (0.99, 1.12) | 0.119 | p = 0.007, I2 = 63.8% | R | 0.174 | 0.068 |
| Very-long-chain SFAs | |||||||||
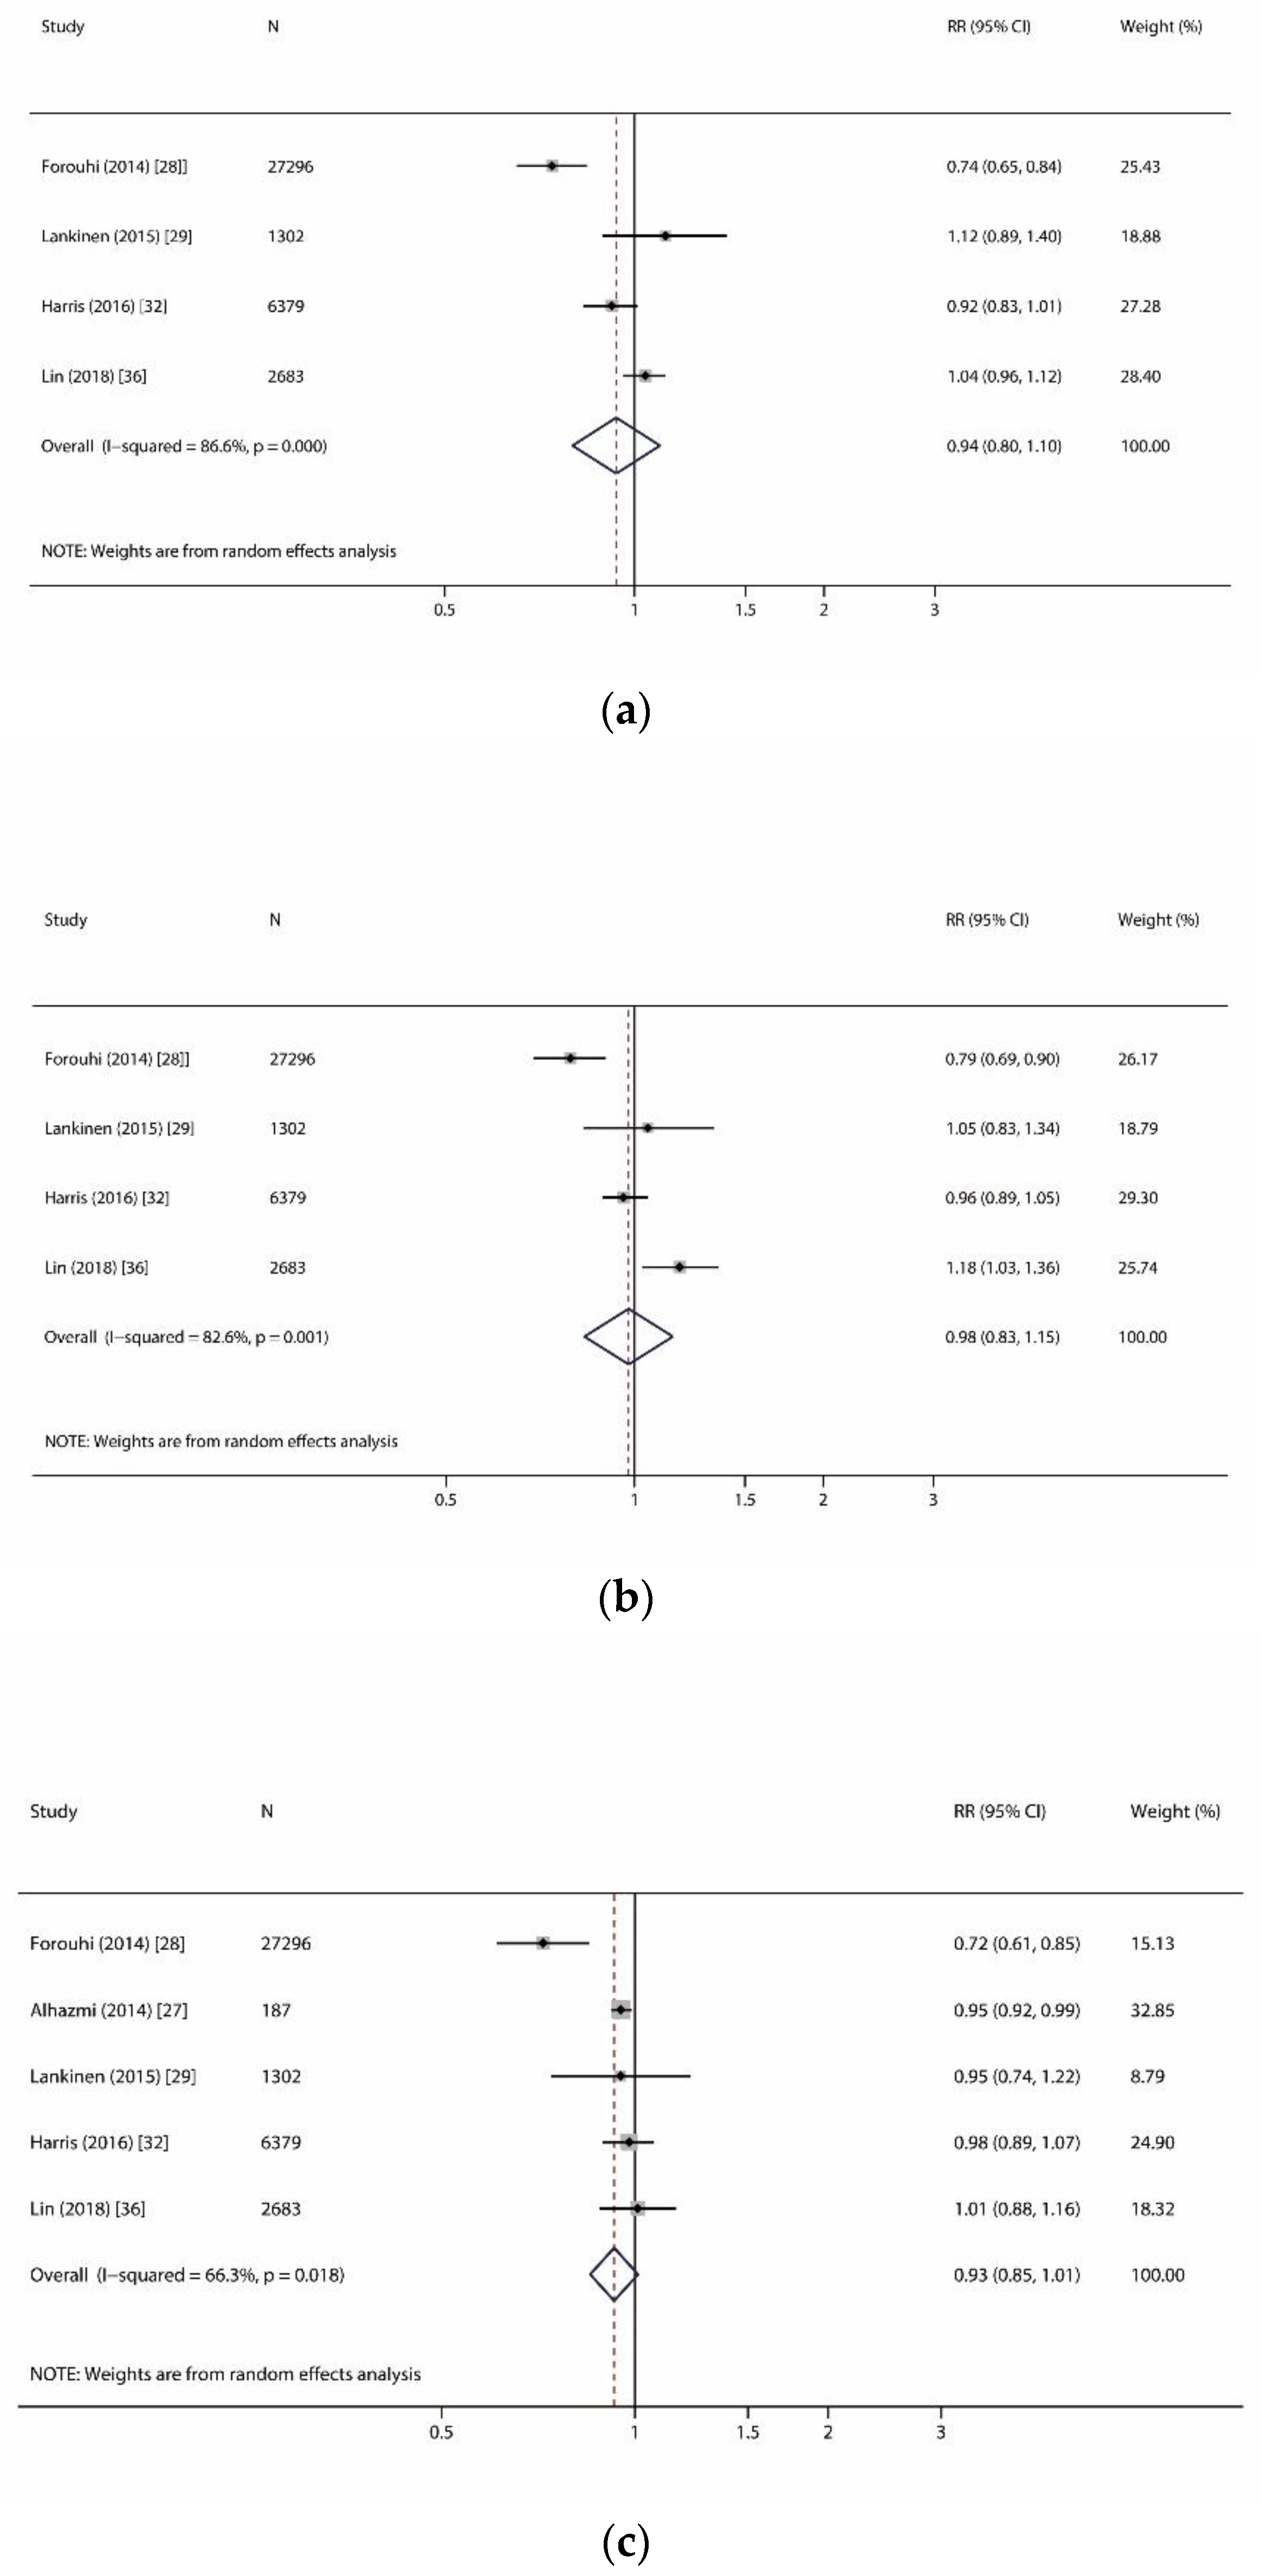
| Arachidic acid (C20:0) | 4 | 37,660 (13,122) | 10.9 | 0.94 (0.80, 1.10) | 0.413 | p < 0.001, I2 = 86.6% | R | 0.734 | 0.773 |
| Behenic acid (C22:0) | 4 | 37,660 (13,122) | 10.9 | 0.98 (0.83, 1.15) | 0.792 | p = 0.001, I2 = 82.6% | R | 0.734 | 0.825 |
| Lignoceric acid (C24:0) | 5 | 37,847 (13,159) | 10.9 | 0.93 (0.85, 1.01) | 0.089 | p = 0.018, I2 = 66.3% | R | 0.806 | 0.627 |
© 2019 by the authors. Licensee MDPI, Basel, Switzerland. This article is an open access article distributed under the terms and conditions of the Creative Commons Attribution (CC BY) license (http://creativecommons.org/licenses/by/4.0/).
Share and Cite
Huang, L.; Lin, J.-s.; Aris, I.M.; Yang, G.; Chen, W.-Q.; Li, L.-J. Circulating Saturated Fatty Acids and Incident Type 2 Diabetes: A Systematic Review and Meta-Analysis. Nutrients 2019, 11, 998. https://doi.org/10.3390/nu11050998
Huang L, Lin J-s, Aris IM, Yang G, Chen W-Q, Li L-J. Circulating Saturated Fatty Acids and Incident Type 2 Diabetes: A Systematic Review and Meta-Analysis. Nutrients. 2019; 11(5):998. https://doi.org/10.3390/nu11050998
Chicago/Turabian StyleHuang, Lihua, Jie-sheng Lin, Izzuddin M Aris, Guiyou Yang, Wei-Qing Chen, and Ling-Jun Li. 2019. "Circulating Saturated Fatty Acids and Incident Type 2 Diabetes: A Systematic Review and Meta-Analysis" Nutrients 11, no. 5: 998. https://doi.org/10.3390/nu11050998
APA StyleHuang, L., Lin, J.-s., Aris, I. M., Yang, G., Chen, W.-Q., & Li, L.-J. (2019). Circulating Saturated Fatty Acids and Incident Type 2 Diabetes: A Systematic Review and Meta-Analysis. Nutrients, 11(5), 998. https://doi.org/10.3390/nu11050998