Article

3-(4-Hydroxy-3-methoxyphenyl)propionic Acid Produced from 4-Hydroxy-3-methoxycinnamic Acid by Gut Microbiota Improves Host Metabolic Condition in Diet-Induced Obese Mice

1
Department of Applied Biological Science, Graduate School of Agriculture, Tokyo University of Agriculture and Technology, Fuchu-shi, Tokyo 183-8509, Japan
2
Research Center, Maruzen Pharmaceuticals Co., Ltd., Fukuyama, Hiroshima 729-3102, Japan
*
Authors to whom correspondence should be addressed.
Nutrients 2019, 11(5), 1036; https://doi.org/10.3390/nu11051036
Submission received: 28 March 2019 / Revised: 27 April 2019 / Accepted: 7 May 2019 / Published: 9 May 2019

Abstract

:
4-Hydroxy-3-methoxycinnamic acid (HMCA), a hydroxycinnamic acid derivative, is abundant in fruits and vegetables, including oranges, carrots, rice bran, and coffee beans. Several beneficial effects of HMCA have been reported, including improvement of metabolic abnormalities in animal models and human studies. However, its mitigating effects on high-fat diet (HFD)-induced obesity, and the mechanism underlying these effects, remain to be elucidated. In this study, we demonstrated that dietary HMCA was efficacious against HFD-induced weight gain and hepatic steatosis, and that it improved insulin sensitivity. These metabolic benefits of HMCA were ascribable to 3-(4-hydroxy-3-methoxyphenyl)propionic acid (HMPA) produced by gut microbiota. Moreover, conversion of HMCA into HMPA was attributable to a wide variety of microbes belonging to the phylum Bacteroidetes. We further showed that HMPA modulated gut microbes associated with host metabolic homeostasis by increasing the abundance of organisms belonging to the phylum Bacteroidetes and reducing the abundance of the phylum Firmicutes. Collectively, these results suggest that HMPA derived from HMCA is metabolically beneficial, and regulates hepatic lipid metabolism, insulin sensitivity, and the gut microbial community. Our results provide insights for the development of functional foods and preventive medicines, based on the microbiota of the intestinal environment, for the prevention of metabolic disorders.

1. Introduction

Dietary phenolic compounds are secondary metabolites in plants, and they are valued for their health benefits. Among foods containing phenolic phytochemicals, coffee is one of the most widely consumed beverages, and it is an extremely rich source of chlorogenic acid (CGA) and caffeic acid (CA) [1]. Indeed, several studies have indicated that habitual coffee consumption potentially has several beneficial health effects, including the prevention of heart disease and stroke, cancer risk reduction, and improvement of metabolic disease [2].
4-Hydroxy-3-methoxycinnamic acid (HMCA), which is biosynthesized from CGA and CA by O-methyltransferase (3-O-methyltransferase), is an abundant hydroxycinnamic acid-derived metabolite in plants [3,4]. HMCA is reported to have antioxidant and anti-inflammatory effects, as well as anticancer properties. It is also thought to improve cognition and neurodegeneration, and to play a role in the regulation of bone remodeling [5,6,7,8,9]. Additionally, recent investigations demonstrated that HMCA exerts beneficial metabolic effects, including abrogation of glucose dysregulation, dyslipidemia, and inflammation in both animal models and humans [10,11]. However, little is known about the molecular mechanisms that regulate metabolic syndrome and associated diseases as a result of dietary HMCA intake.
The gut microbiota affects host metabolic homeostasis through the fermentation of a wide range of indigestible compounds of plant origin [12,13]. A recent clinical study demonstrated that CGA derivatives, along with CA and HMCA, are absorbed in the small intestine, whereas other metabolites, such as dihydrocaffeic acid and 3-(4-hydroxy-3-methoxyphenyl)propionic acid (HMPA), are produced in the large intestine [14]. Thus, these reports suggest that the gut microbiota is mainly responsible for the formation and conversion of CGA-derived metabolites in the intestine, and that these metabolites may play a role in host homeostasis. Furthermore, several studies have demonstrated that HMPA is associated with intestinal anti-inflammation, and that it has antioxidant and neuroprotective activities [15,16]. However, few studies have investigated the effects of HMPA on metabolic control.
In this study, we investigated the beneficial metabolic effects of HMCA in a mouse model of high-fat diet (HFD)-induced obesity, as well as the molecular mechanism underlying these effects. Furthermore, we examined whether gut bacteria produced HMPA following intake of HMCA in the intestine, and whether dietary HMPA intake exerts beneficial metabolic effects similar to those resulting from HMCA consumption. Finally, we evaluated the effects of HMCA and HMPA on the gut microbial community.

2. Materials and Methods

2.1. Mice, Diet, and Experimental Design

Male C57BL/6J mice were purchased from Japan SLC (Shizuoka, Japan) and maintained under a strict 12 h light/dark cycle and were housed in a conventional animal room at 23.0 °C. Mice were acclimated to the laboratory conditions on the CLEA Rodent Diet (CE-2, CLEA Japan, Inc., Tokyo, Japan) for 1 week prior to the treatment. The 4-week-old C57BL/6J mice were placed on a D12492 diet (HFD; 60% kcal fat, Research diets, New Brunswick, NJ, USA) or HFD containing 1% HMCA for 12 weeks (n = 7–9). The compositions of the diets are given in Table 1. In another experiment, the 4-week-old mice were divided into two groups of similar average body weight (groups fed HFD supplemented with 1% cellulose or 1% HMPA) for 12 weeks in a factorial design (n = 7–9). The compositions of the diets are given in Table 2. These diets were adjusted so that the final percentages of protein, fat, and carbohydrates were almost equal. The control group diet was supplemented with 1% cellulose in the HFD. HMCA and HMPA were supplied by Maruzen Pharmaceuticals Co., Ltd. (Hiroshima, Japan) During the treatment, body weights were measured once a week. Food intake was measured every 2 or 3 days for 12 weeks, and the average of the daily food intake (g/day/mouse) was calculated (Tables S1 and S2). For the antibiotic treatment, 4-week-old mice were treated with ampicillin (Nacalai Tesque, Kyoto, Japan; 0.4 mg/mL), neomycin (Nacalai Tesque; 0.4 mg/mL), metronidazole (Wako, Tokyo, Japan; 0.4 mg/mL), gentamicin (Sigma-Aldrich, St. Louis, MO, USA; 0.4 mg/mL), and vancomycin (Sigma-Aldrich; 0.2 mg/mL) in drinking water for 2 weeks. Mice treated with/without antibiotics were fed HFD containing HMCA for one week. After feeding, the cecal contents of HMCA and HMPA were determined. All mice were then sacrificed under deep isoflurane-induced anesthesia. Liver, cecum, epididymal, perirenal, and subcutaneous adipose tissues, and brown adipose tissue (BAT) were harvested and weighted. Blood was collected from the inferior vena cava using heparinized tubes and plasma was separated by immediate centrifugation (7000× g, 5 min, 4 °C). All tissues and plasma were stored at −80 °C until further processing. All experimental procedures involving mice were planned in accordance with the guidelines of the Committee on the Ethics of Animal Experiments of the Tokyo University of Agriculture and Technology (permit number: 28–87). All efforts were made to minimize suffering.

2.2. Plasma Biochemical Analyses

Blood glucose was assessed using a portable glucometer with compatible glucose test strips (OneTouch®Ultra®, LifeScan, Milpitas, CA, USA). Plasma cholesterol (LabAssay™ Cholesterol, Wako, Tokyo, Japan), non-esterified fatty acids (NEFAs) (LabAssay™ NEFA, Wako, Tokyo, Japan), triglyceride (TG) (LabAssay™ Triglyceride, Wako, Tokyo, Japan), and insulin (Insulin ELISA KIT (RTU), Shibayagi, Gunma, Japan) were measured using commercial assay kits following manufacturer’s instructions.

2.3. Quantification of Hepatic Triglyceride Content

Livers were weighed, and stored at −80 °C. Hepatic triacylglycerol contents were measured following a modified protocol as previously described [17].

2.4. Hepatic Histology

Liver were embedded in OCT compound (Sakura Finetek Japan, Tokyo, Japan) and sectioned at 8 μm. These cryosections were stained with hematoxylin and eosin (H&E).

2.5. Quantification of Phytochemicals by HPLC

Mouse plasma and tissue samples were dissolved or homogenized in extraction solvent (acetonitrile). HMCA and HMPA in cecal and plasma were analyzed using an Agilent 1200 HPLC with a DAD detector (at 320 nm for HMCA and 280 nm for HMPA) (Agilent Technologies, Santa Clara, CA, USA). Separations were performed at 40 °C using a Wakosil-II 5C18 H (4.6 mm × 150 mm) (Wako, Tokyo, Japan). Injections were carried out with an autosampler maintained at 4 °C. The mobile phase was pumped at a flow rate of 1 mL/min.

2.6. Analysis of Gut Microbiota by 16S rRNA Gene Sequencing

Cecal DNA was extracted using FastDNA® SPIN Kit for Feces (MP Biomedicals, Santa Ana, CA, USA). The V4 region of the 16S rRNA gene was amplified using dual-indexed primers. The amplicons were sequenced using an Illumina MiSeq with a MiSeq Reagent kit V3 (Illumina, San Diego, CA, USA). Paired-end sequencing was carried out using Illumina MiSeq platform. Processing and quality filtering of reads were performed with Quantitative Insights into Microbial Ecology (QIIME) (v1.9.1) and the chimera-free sequences were aligned with the SILVA database (http://www.arb-silva.de) at 97% identity. The raw data have been deposited into the DNA Data Bank of Japan (DDBJ) database under accession no. DRA008102 and DRA008103.

2.7. Real Time-PCR (RT-PCR)

RT-PCR protocol was conducted following a modified protocol as previously described [17]. Reverse transcription were performed using Moloney murine leukemia virus reverse transcriptase (Invitrogen, Carlsbad, CA, USA). Real-time PCR was completed with using SYBR Premix Ex Taq II (TaKaRa, Shiga, JAPAN) and the StepOneTM real time PCR system (Applied Biosystems, Foster City, CA, USA). The ΔΔct method for PCR and 18S typically was used as the housekeeping mRNA. Primer sequences are shown in Table 3.

2.8. Statistical Analysis

Statistical comparisons between diet groups were performed with using a two-tailed paired Student’s t-test and one-way ANOVA followed by Dunnett’s multiple comparison test. The false discovery rate (FDR) q-value in the 16S rDNA sequencing was analyzed. The FDR (q-value) was estimated with the Benjaminie–Hochberg procedure. 16S rDNA sequencing data were analyzed by Student’s t-test with the FDR correction. p-values < 0.05 and q-value < 0.1 were considered significant. Data analysis was performed using GraphPad Prism 7.0 (Graphpad Software, San Diego, CA, USA), and data are presented as means ± SEM.

3. Results

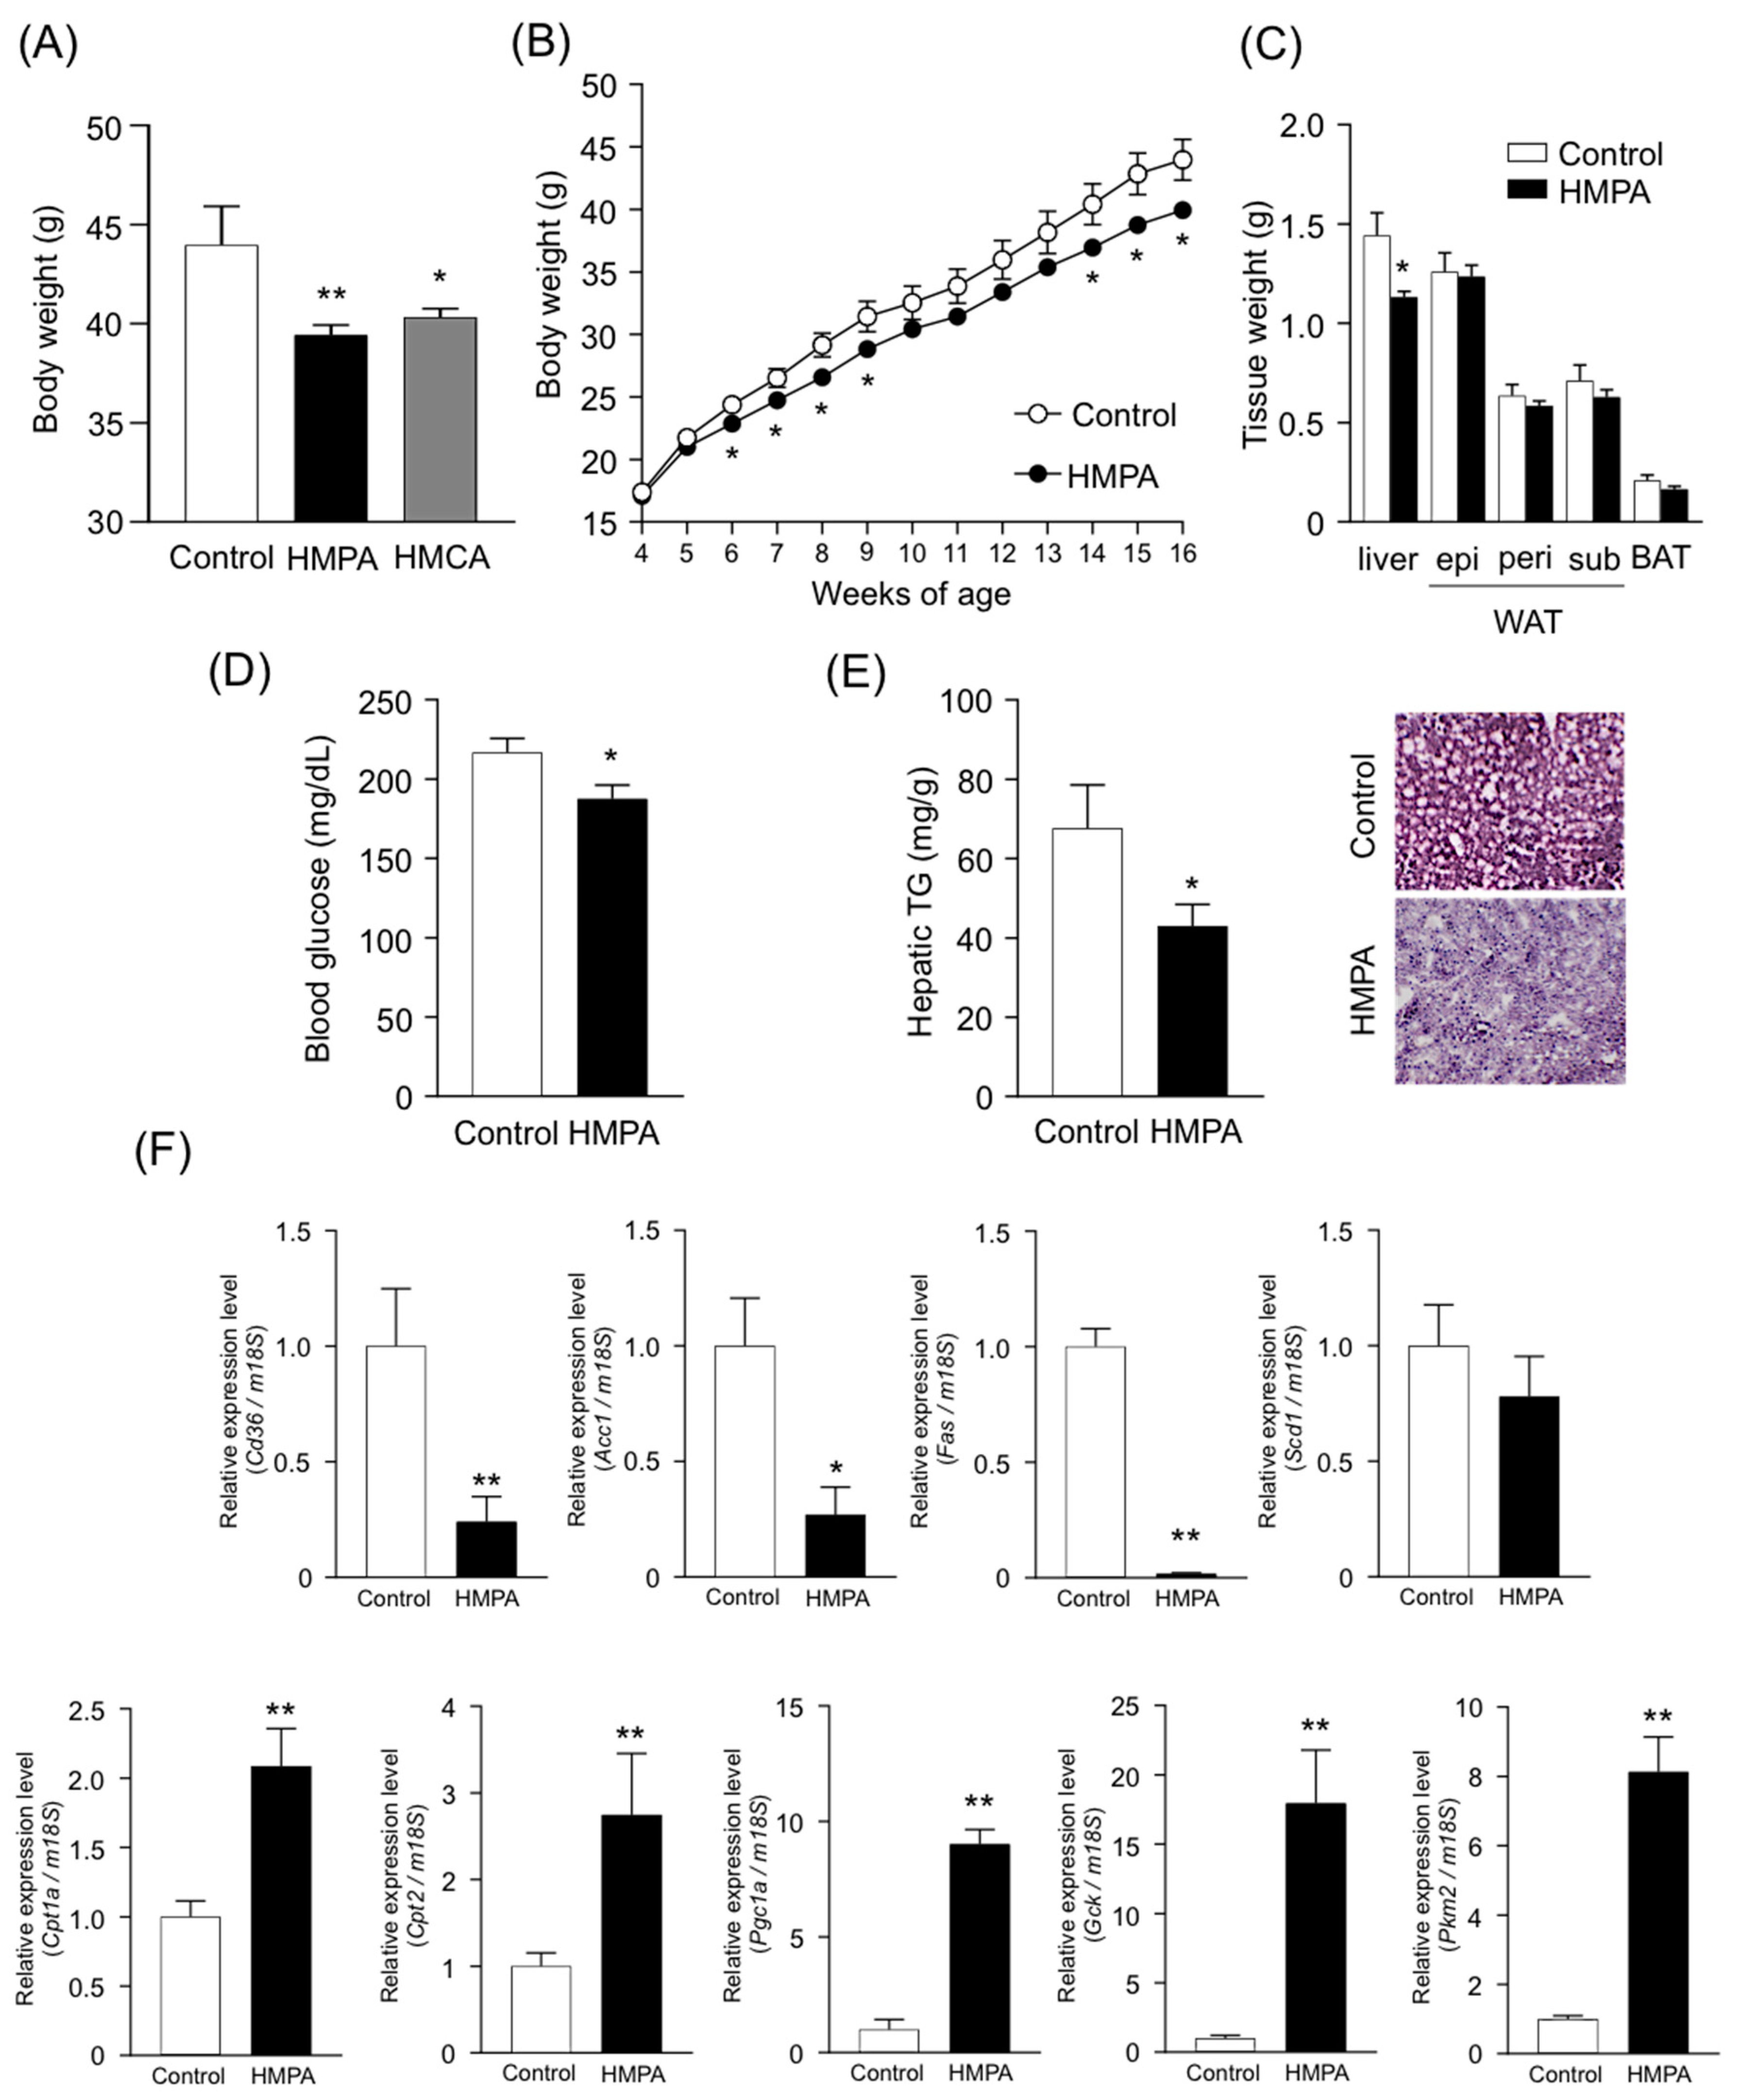
3.1. HMCA Intake Suppresses HFD-Induced Obesity

We first investigated changes in metabolic parameters following HMCA feeding in a mouse model of HFD-induced obesity. In this experiment, 4-week-old mice were fed an HFD containing 1% HMCA for 12 weeks (Table 1), and tissue characteristics and biochemical parameters were assessed at the end of the treatment. Gains in body weight were significantly lower in HMCA-supplemented HFD-fed mice during growth (Figure 1A). The mass of white adipose tissue (WAT) was also significantly lower in HMCA-supplemented HFD-fed mice than in those fed an HFD, whereas no significant difference was observed in the weight of BAT (Figure 1B). Moreover, a significant decrease in the weight of livers from HMCA-supplemented HFD-fed mice was observed, and corresponded to a decrease in hepatic TG in comparison to HFD-fed mice (Figure 1B,C). Plasma levels of glucose, insulin, and total cholesterol were significantly lower in HMCA-supplemented HFD-fed mice (Figure 1D, Figure S1A,B), whereas their TG and NEFAs plasma levels were comparable (Figure S1B). HMCA intake suppressed both elevation of plasma glucose levels and increases in hepatic TG accumulation, thereby preventing HFD-induced obesity.

3.2. Gut Microbiota Convert HMCA into HMPA in the Intestine

We identified and quantified HMCA and HMPA contents in cecal samples collected following 1 week of HFD containing with 1% HMCA in the mice. Interestingly, HMPA but not HMCA was detected in the cecum of HMCA-supplemented HFD-fed mice (Figure 2A; left), whereas only HMCA was detected when mice received antibiotic treatment (Figure 2A; right). Then, HMPA was detected in the urine of mice fed HFD supplemented with HMCA or HMPA (Figure S2A). In addition, the plasma pharmacokinetic profiles following intraperitoneal injection showed that there was no possibility of interconversion between HMCA and HMPA by the host metabolism (Figure S2B,C). These data support the idea that HMCA taken orally could be converted into HMPA in the intestine by gut microbiota and that HMPA was absorbed in the body. We evaluated the composition of gut microbiota in HFD-fed and HMCA-supplemented HFD-fed mice. Principal coordinate analysis (PCoA) based on unweighted Unifrac distances indicated significant clustering by diet type, with complete separation of the cecal microbiota of HMCA-supplemented HFD-fed mice from that of HFD controls along the PCoA1 axis (Figure 2B). Taxonomic analysis of the cecal microbiota showed an increased abundance of Bacteroidetes and Actinobacteria, with a reduction in the population of Firmicutes in the HFD-HMCA microbiota (Figure 2C). Furthermore, the hierarchical clustering of individual families also confirmed that HMCA intervention resulted in an increase in the population of the Bacteroidales S24-7 group and Porphyromonadaceae, which belong to the phylum Bacteroidetes (Figure 2D).

3.3. HMPA is Molecular Entity Underlying Metabolic Improvement Following HMCA Intake

As shown in Figure 2, HMPA is produced by gut microbiota in the intestine following HMCA intake. We therefore examined whether dietary HMPA intake directly affects metabolic parameters in a mouse model of HFD-induced obesity (Table 2). After feeding for 12 weeks, the body weights of HMPA-supplemented HFD-fed mice were comparable to those of HMCA-supplemented HFD-fed mice, and significantly lower than those of mice fed a control diet (Figure 3A). Additionally, gains in body weights were significantly lower in HMPA-supplemented HFD-fed mice during growth (Figure 3B). Liver weights were also significantly lower in HMPA-supplemented HFD-fed mice compared to the controls (Figure 3C). Moreover, significant decreases in plasma glucose levels were observed in HMPA-supplemented HFD-fed mice and were accompanied by decreased plasma insulin levels (Figure 3D, Figure S3A). In contrast, plasma levels of total cholesterol, TG, and NEFAs were similar between controls and HMPA-supplemented HFD-fed mice (Figure S3B). HMPA intake led to a significant reduction in hepatic TG accumulation, and the H&E-stained hepatic sections obtained from HMPA-supplemented HFD-fed mice showed reduced cytoplasmic vacuolation. This indicated an alleviation in steatosis in comparison with the controls (Figure 3E). HMPA intake therefore exerts beneficial metabolic effects to a similar extent as dietary HMCA intake. We also investigated the expression profiles of hepatic genes related to energy metabolism. The expression of genes related to energy expenditure, glycolysis, and β-oxidation increased, while that of genes related to fatty acid synthesis and trafficking were decreased in HMPA-supplemented HFD-fed mice compared to controls (Figure 3F).

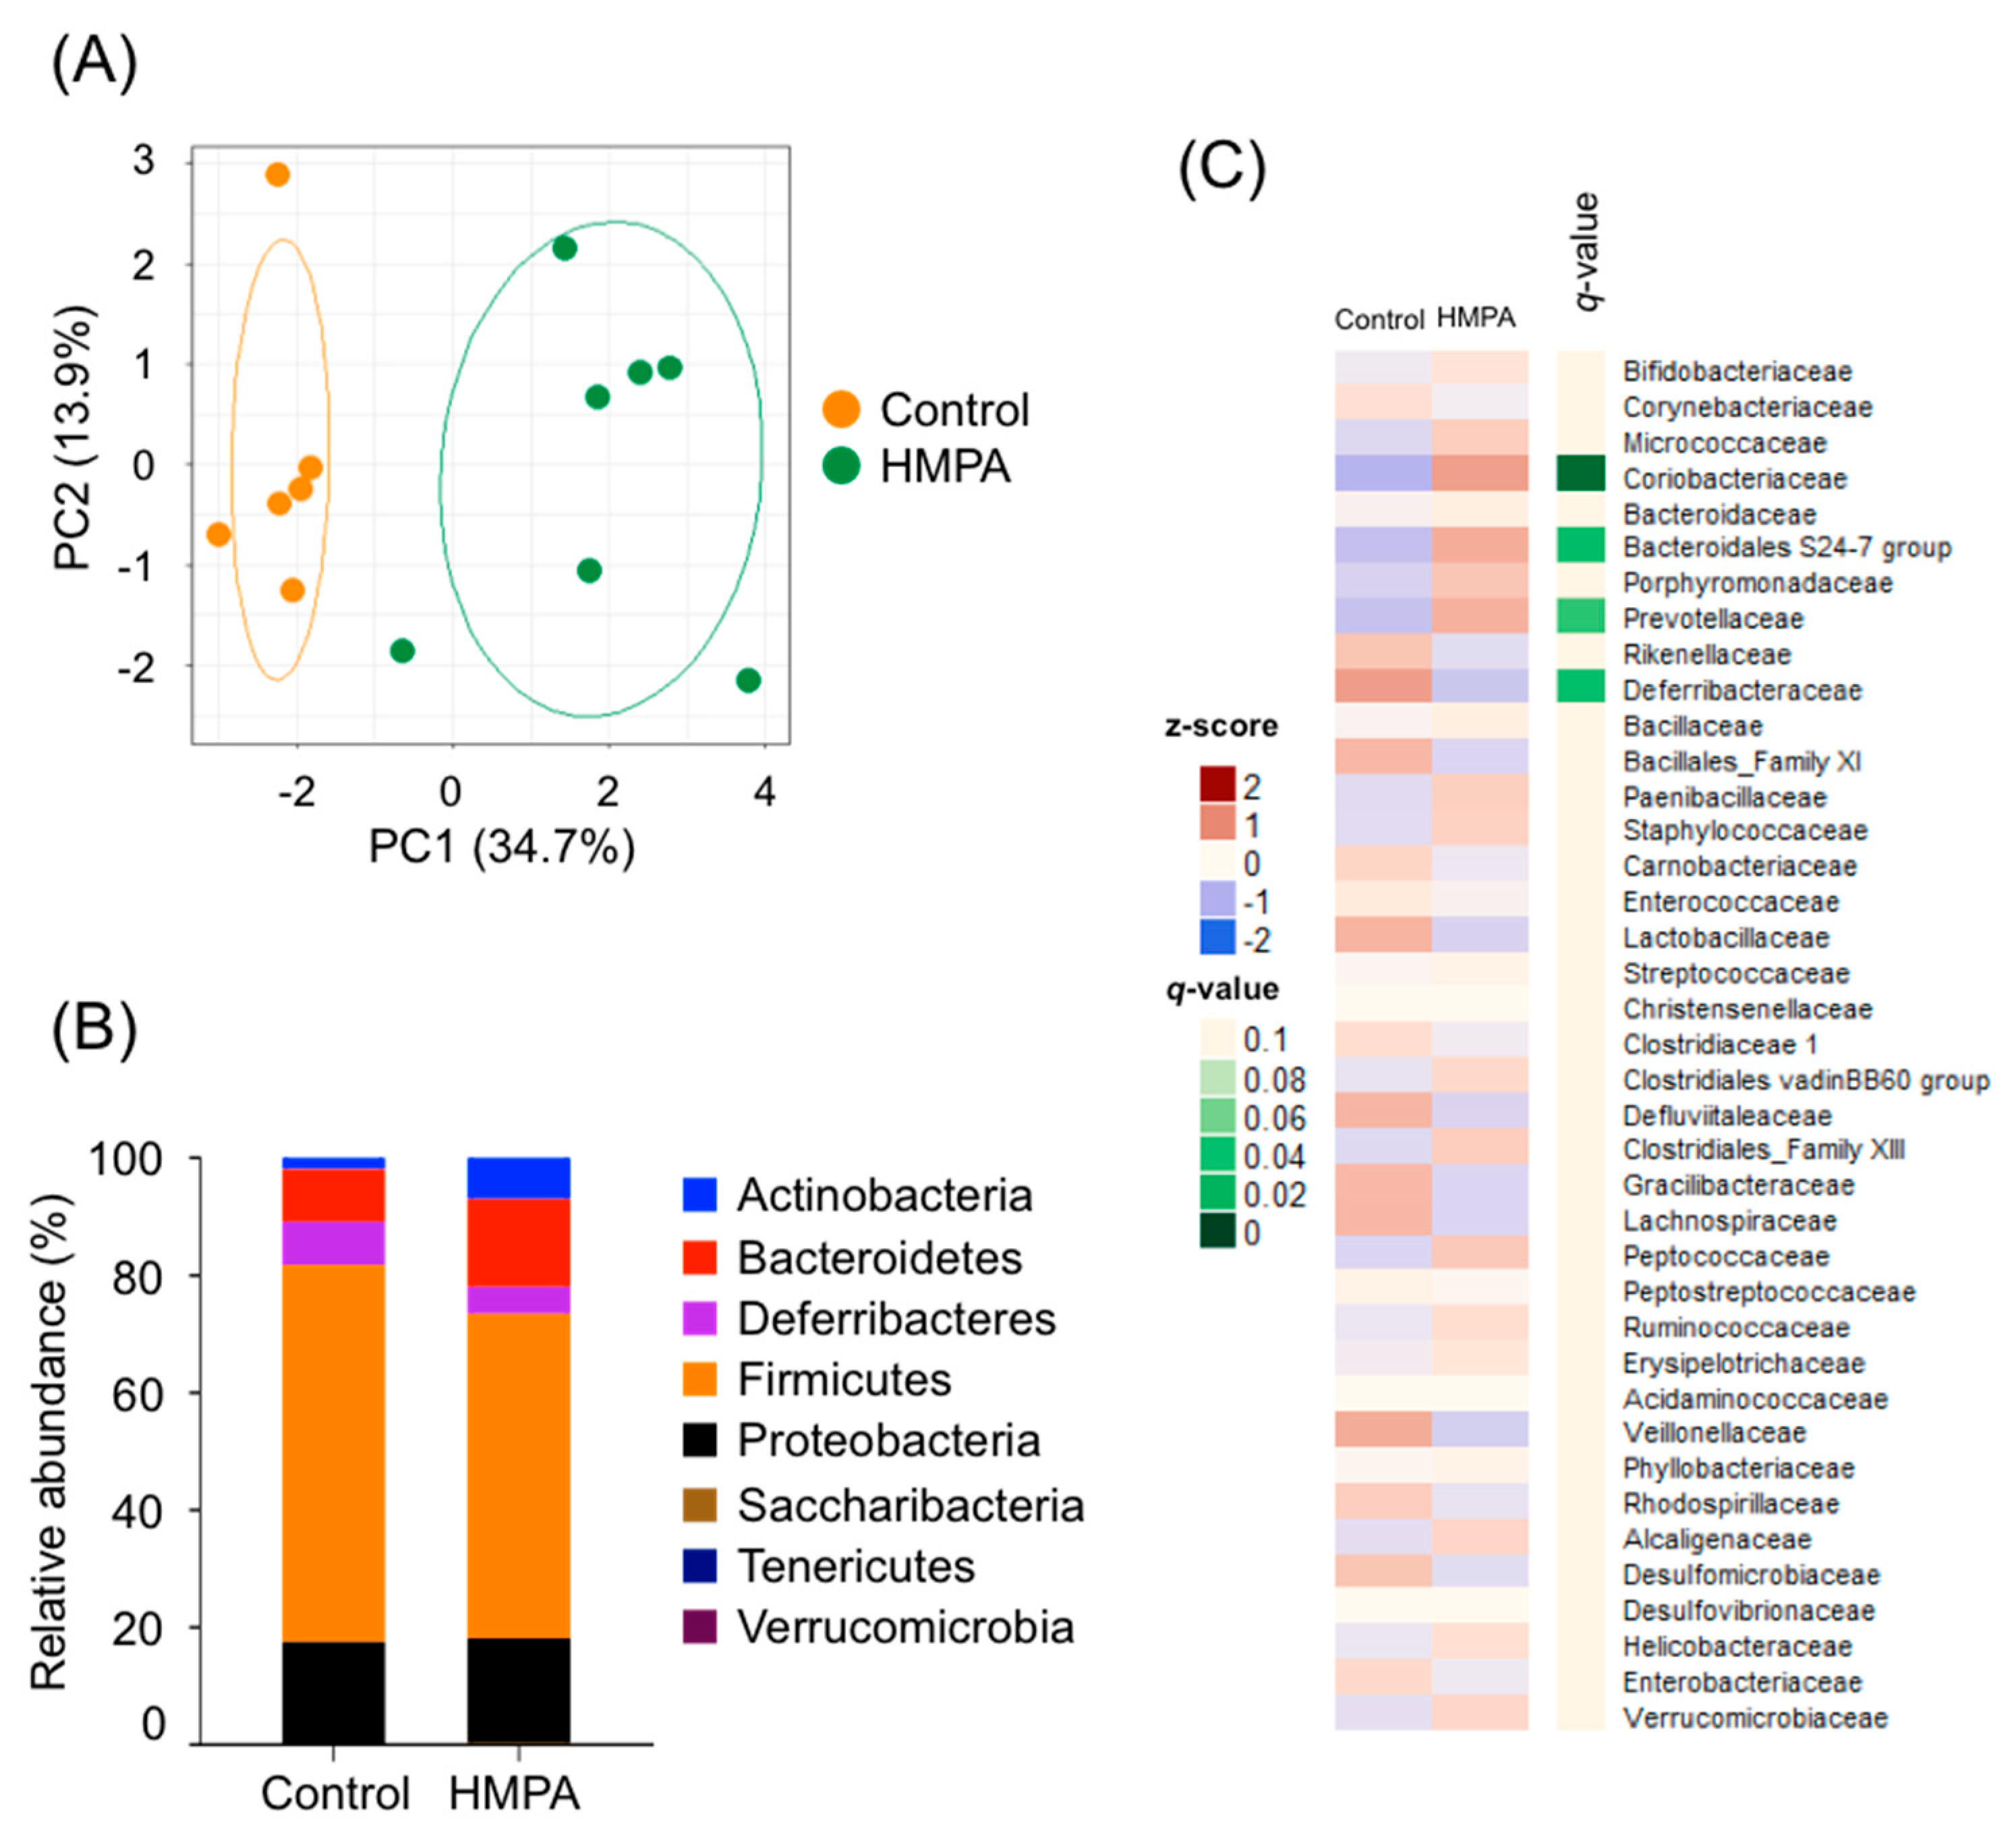
3.4. HMPA Intake Modifies the Changes of HFD-Associated Gut Microbial Composition

We further investigated changes in the composition of gut microbiota following HMPA consumption. PCoA based on unweighted Unifrac distances indicated significant clustering by diet type, with complete separation of the cecal microbiota of HMPA-supplemented HFD-fed mice from that of the HFD-fed controls (Figure 4A). Taxonomic analysis of the cecal microbiota showed an increased abundance of Bacteroidetes, along with a reduction in the population of Firmicutes with HMPA supplementation (Figure 4B). Notably, HMPA intervention induced a drastic increase in the population of Actinobacteria, while the population of Deferribacteres in the cecal microbiota of HMPA-supplemented HFD-fed mice were decreased (Figure 4B). These results were similar to those observed with HMCA supplementation. Hierarchical clustering of individual families also confirmed the effect of HMPA intake on gut microbiota (Figure 4C). The HMPA intervention significantly increased the Bacteroidales S24-7 group and Coriobacteriaceae, which are families within the Bacteroidetes and Actinobacteria, respectively (Figure 4C). These families were also significantly increased in HMCA-supplemented HFD-fed mice (Figure 2D). Meanwhile, significant increases in Prevotellaceae and decreases in Deferribacteraceae were observed in HMPA-supplemented HFD-fed mice, but not in HMCA-supplemented HFD-fed mice (Figure 2D and Figure 4C). These findings demonstrated that HMPA intake changed the composition of mouse gut microbiota.

4. Discussion

There is growing evidence that the intestinal tract plays an important role in the catabolism and bioavailability of dietary phenolic compounds, and that their metabolites can have an impact on both host metabolic homeostasis and the diversity of the gut microbiome. Our work in mice, using an HFD containing HMCA, confirmed earlier results that support the metabolic benefits of HMCA, including abrogation of hepatic lipid accumulation and improvement of HFD-induced insulin resistance [10,11,18]. However, the molecular mechanisms underlying this effect remained unclear in previous studies. Herein, we showed that microbiota-derived HMPA significantly contributed to beneficial metabolic effects in obese HFD-induced mice. HMPA directly improved hepatic lipid metabolism and insulin sensitivity. Indeed, several studies have shown that HMPA is efficiently transported together with HMCA in the intestine [19,20]; hence, HMPA would substantially contribute to improved human health. However, HMCA absorbed from the intestine is converted into various derivatives other than HMPA in the liver [20]. Therefore, further experiments would be required to determine the nature of the indirect biological effects of other HMCA-derived metabolites.
A previous report highlighted the potential of dietary phytochemicals to modulate the gut microbiota in a beneficial way [21]. Our results demonstrated that the families Bacteroidales S24-7 and Coriobacteriaceae were significantly increased in both HMPA-fed and HMCA-fed mice. Furthermore, a recent study revealed that Actinobacteria of the family Coriobacteriaceae might also be involved in the stimulation of hepatic detoxification activity, with the strongest effect being on hepatic lipid metabolism [22]. This evidence suggests that these Coriobacteriaceae are associated with improved hepatic metabolism following HMCA and/or HMPA consumption.
Recent investigations have demonstrated that lactic acid bacteria are highly resistant to antimicrobial phenolic acids, and that this resistance is partially dependent on their capacity to convert phenolic acids to metabolites with lower metabolic activities [23]. Indeed, several plant-associated bacteria, such as Lactobacillus curvatus (L. curvatus), L. plantarum, L. rossiae, Weissella cibaria (W. cibaria), and W. confusa, reduce HMCA as external acceptors of electrons, and consequently produce HMPA [24,25]. Additionally, Santamaría et al. revealed that L. plantarum possesses hydroxycinnamate reductase, which is a heterodimeric NADH-dependent coumarate reductase that catalyzes the conversion of HMCA to HMPA [26]. However, we found that HMCA led to a decrease in the abundance of certain lactic acid bacteria (e.g., species from the Lactobacillaceae and Lachnospiraceae), whereas a wide variety of microbes belonging to the phylum Bacteroidetes was increased. Interestingly, we observed that the population of organisms belonging to Bacteroidaceae and Porphyromonadaceae were increased with HMCA supplementation, but not with HMPA supplementation, suggesting that conversion of HMCA into HMPA in the intestine is carried out by members of the Bacteroidetes.
In this study, we demonstrated that dietary HMCA was efficacious against diet-induced weight gain and hepatic steatosis, modulating the community structure of gut microbes. We further showed that dietary HMCA exerts beneficial metabolic effects via the modulation of hepatic lipid metabolism. These effects occur as a result of HMPA production by the gut microbiota, and through increases in beneficial gut microbes, suggesting that HMPA is a molecular entity underlying metabolic improvement observed with HMCA consumption. Functional alterations to the gut microbiome in response to HMPA consumption warrant detailed follow-up investigations, and further characterization at the species level of the specific gut microbes involved in the reduction of HMCA. Our results may contribute to the development of functional foods for the prevention of metabolic disorders, including obesity and type 2 diabetes. The study also provides information that could facilitate the development of preventive medicines based on the microbiota of the intestinal environment.

5. Conclusions

This study describes the mitigating effects of 4-hydroxy-3-methoxycinnamic acid (HMCA) on high fat diet-induced obesity using a mouse model and shows that these effects are due to 3-(4-hydroxy-3-methoxyphenyl)propionic acid (HMPA) produced from HMCA by the gut microflora. It also demonstrates gut microbiota-modulating effects of HMPA. We believe that our study makes a significant contribution to the literature because it demonstrates that the beneficial effects of dietary HMCA are due to the modulation of hepatic lipid metabolism.

Supplementary Materials

The following are available online at https://www.mdpi.com/2072-6643/11/5/1036/s1, Figure S1: Metabolic parameters in HFD-fed and HMCA-supplemented HFD-fed mice, Figure S2: Plasma pharmacokinetic profiles of HMCA and HMPA after intraperitoneal injection in conventional mice, Figure S3: Metabolic parameters in HFD control and HMPA-supplemented HFD-fed mice. Table S1: Daily calorie intake in HMCA consumption, Table S2: Daily calorie intake in HMPA consumption.

Author Contributions

R.O.-K. performed the experiments, interpreted the data, and wrote the paper; S.T., K.W., Y.M., and T.K. performed the experiments; J.M. interpreted data; Y.N., H.K. (Hideaki Kawakami), and H.K. (Hiroshige Kuwahara) performed experiments and interpreted the data; I.K. supervised the project, interpreted data, and wrote the paper. All authors read and approved the final manuscript.

Funding

This research received no external funding.

Acknowledgments

We thank Maruzen Pharmaceuticals Co., Ltd. for supplying 4-hydroxy-3-methoxycinnamic acid and 3-(4-hydroxy-3-methoxyphenyl)propionic acid.

Conflicts of Interest

All except three authors (Y.N., H.K. (Hideaki Kawakami), and H.K. (Hiroshige Kuwahara)) have no conflict of interest. Y.N., H.K. (Hideaki Kawakami), and H.K. (Hiroshige Kuwahara) are employees of Maruzen Pharmaceuticals Co., Ltd., which is a manufacturer of food and food supplements including 4-hydroxy-3-methoxycinnamic acid.

References

  1. Redeuil, K.; Smarrito-Menozzi, C.; Guy, P.; Rezzi, S.; Dionisi, F.; Williamson, G.; Nagy, K.; Renouf, M. Identification of novel circulating coffee metabolites in human plasma by liquid chromatography–mass spectrometry. J. Chromatogr. A 2011, 1218, 4678–4688. [Google Scholar] [CrossRef] [PubMed]
  2. Nieber, K. The impact of coffee on health. Planta Med. 2017, 83, 1256–1263. [Google Scholar] [CrossRef] [PubMed]
  3. Smith, M.M.; Hartley, R.D. Occurrence and nature of ferulic acid substitution of cell wall polysaccharides in gramineous plants. Carbohydr. Res. 1983, 118, 65–80. [Google Scholar] [CrossRef]
  4. Zubieta, C.; Kota, P.; Ferrer, J.L.; Dixon, R.A.; Noel, J.P. Structural basis for the modulation of lignin monomer methylation by caffeic acid/5-hydroxyferulic acid 3/5-Omethyltransferase. Plant Cell 2002, 14, 1265–1277. [Google Scholar] [CrossRef] [PubMed]
  5. Gómez-Ruiz, J.A.; Leake, D.S.; Ames, J.M. In vitro antioxidant activity of coffee compounds and their metabolites. J. Agric. Food Chem. 2007, 55, 6962–6969. [Google Scholar] [CrossRef] [PubMed]
  6. Chowdhury, S.; Ghosh, S.; Das, A.K.; Sil, P.C. Ferulic acid protects hyperglycemia-induced kidney damage by regulating oxidative insult, inflammation and autophagy. Front. Pharmacol. 2019, 10, 27. [Google Scholar] [CrossRef] [PubMed]
  7. Choi, Y.E.; Park, E. Ferulic acid in combination with PARP inhibitor sensitizes breast cancer cells as chemotherapeutic strategy. Biochem. Biophys. Res. Commun. 2015, 458, 520–524. [Google Scholar] [CrossRef]
  8. Mori, T.; Koyama, N.; Tan, J.; Segawa, T.; Maeda, M.; Town, T. Combination therapy with octyl gallate and ferulic acid improves cognition and neurodegeneration in a transgenic mouse model of Alzheimer’s disease. J. Biol. Chem. 2017, 292, 11310–11325. [Google Scholar] [CrossRef]
  9. Sassa, S.; Kikuchi, T.; Shinoda, H.; Suzuki, S.; Kudo, H.; Sakamoto, S. Preventive effect of ferulic acid on bone loss in ovariectomized rats. In Vivo 2003, 17, 277–280. [Google Scholar] [PubMed]
  10. Salazar-López, N.J.; Astiazarán-García, H.; González-Aguilar, G.A.; Loarca-Piña, G.; Ezquerra-Brauer, J.M.; Domínguez Avila, J.A.; Robles-Sánchez, M. Ferulic acid on glucose dysregulation, dyslipidemia, and inflammation in diet-induced obese rats: An integrated study. Nutrients 2017, 9, 675. [Google Scholar] [CrossRef]
  11. Bumrungpert, A.; Lilitchan, S.; Tuntipopipat, S.; Tirawanchai, N.; Komindr, S. Ferulic acid supplementation improves lipid profiles, oxidative stress, and inflammatory status in hyperlipidemic subjects: A randomized, double-blind, placebo-controlled clinical trial. Nutrients 2018, 10, 713. [Google Scholar] [CrossRef] [PubMed]
  12. Miyamoto, J.; Watanabe, K.; Taira, S.; Kasubuchi, M.; Li, X.; Irie, J.; Itoh, H.; Kimura, I. Barley β-glucan improves metabolic condition via short-chain fatty acids produced by gut microbial fermentation in high fat diet fed mice. PLoS ONE 2018, 13, e0196579. [Google Scholar] [CrossRef]
  13. Nakatani, A.; Li, X.; Miyamoto, J.; Igarashi, M.; Watanabe, H.; Sutou, A.; Watanabe, K.; Motoyama, T.; Tachibana, N.; Kohno, M.; et al. Dietary mung bean protein reduces high-fat diet-induced weight gain by modulating host bile acid metabolism in a gut microbiota-dependent manner. Biochem. Biophys. Res. Commun. 2018, 501, 955–961. [Google Scholar] [CrossRef] [PubMed]
  14. Renouf, M.; Guy, P.; Marmet, C.; Longet, K.; Fraering, A.L.; Moulin, J.; Barron, D.; Dionisi, F.; Cavin, C.; Steiling, H.; et al. Plasma appearance and correlation between coffee and green tea metabolites in human subjects. Br. J. Nutr. 2010, 104, 1635–1640. [Google Scholar] [CrossRef] [PubMed] [Green Version]
  15. Larrosa, M.; Luceri, C.; Vivoli, E.; Pagliuca, C.; Lodovici, M.; Moneti, G.; Dolara, P. Polyphenol metabolites from colonic microbiota exert anti-inflammatory activity on different inflammation models. Mol. Nutr. Food Res. 2009, 53, 1044–1054. [Google Scholar] [CrossRef]
  16. Verzelloni, E.; Pellacani, C.; Tagliazucchi, D.; Tagliaferri, S.; Calani, L.; Costa, L.G.; Brighenti, F.; Borges, G.; Crozier, A.; Conte, A.; et al. Antiglycative and neuroprotective activity of colon-derived polyphenol catabolites. Mol. Nutr. Food Res. 2011, 55, S35–S43. [Google Scholar] [CrossRef] [PubMed]
  17. Kimura, I.; Ozawa, K.; Inoue, D.; Imamura, T.; Kimura, K.; Maeda, T.; Terasawa, K.; Kashihara, D.; Hirano, K.; Tani, T.; et al. The gut microbiota suppresses insulin-mediated fat accumulation via the short-chain fatty acid receptor GPR43. Nat. Commun. 2013, 4, 1829. [Google Scholar] [CrossRef] [Green Version]
  18. Gogoi, B.; Chatterjee, P.; Mukherjee, S.; Buragohain, A.K.; Bhattacharya, S.; Dasgupta, S. A polyphenol rescues lipid induced insulin resistance in skeletal muscle cells and adipocytes. Biochem. Biophys. Res. Commun. 2014, 452, 382–388. [Google Scholar] [CrossRef]
  19. Poquet, L.; Clifford, M.N.; Williamson, G. Transport and metabolism of ferulic acid through the colonic epithelium. Drug Metab. Dispos. 2008, 36, 190–197. [Google Scholar] [CrossRef]
  20. Gonzalez de Mejia, E.; Ramirez-Mares, M.V. Impact of caffeine and coffee on our health. Trends Endocrinol. Metab. 2014, 25, 489–492. [Google Scholar] [CrossRef] [PubMed]
  21. Flint, H.J.; Scott, K.P.; Louis, P.; Duncan, S.H. The role of the gut microbiota in nutrition and health. Nat. Rev. Gastroenterol. Hepatol. 2012, 9, 577–589. [Google Scholar] [CrossRef] [PubMed]
  22. Claus, S.P.; Ellero, S.L.; Berger, B.; Krause, L.; Bruttin, A.; Molina, J.; Paris, A.; Want, E.J.; de Waziers, I.; Cloarec, O.; et al. Colonization-induced host-gut microbial metabolic interaction. mBio 2011, 2, e00271-10. [Google Scholar] [CrossRef] [PubMed]
  23. Sànchez-Maldonado, A.F.; Schieber, A.; Gänzle, M.G. Structure-function relationshipsof the antibacterial activity of phenolic acids and their metabolism by lactic acid bacteria. J. Appl. Microbiol. 2011, 111, 1176–1184. [Google Scholar] [CrossRef]
  24. Filannino, P.; Gobbetti, M.; De Angelis, M.; Di Cagno, R. Hydroxycinnamic acids used as external acceptors of electrons: an energetic advantage for strictly heterofermentative lactic acid bacteria. Appl. Environ. Microbiol. 2014, 80, 7574–7582. [Google Scholar] [CrossRef] [PubMed]
  25. Knockaert, D.; Raes, K.; Wille, C.; Struijs, K.; Van Camp, J. Metabolism of ferulic acid during growth of Lactobacillus plantarum and Lactobacillus collinoides. J. Sci. Food Agric. 2012, 92, 2291–2296. [Google Scholar] [CrossRef]
  26. Santamaría, L.; Reverón, I.; López de Felipe, F.; de Las Rivas, B.; Muñoz, R. Unravelling the reduction pathway as an alternative metabolic route to hydroxycinnamate decarboxylation in Lactobacillus plantarum. Appl. Environ. Microbiol. 2018, 84, e01123-18. [Google Scholar] [CrossRef]
Figure 1. Metabolic parameters and histological changes in high-fat diet (HFD)- and 4-hydroxy-3-methoxycinnamic acid (HMCA)-supplemented HFD-fed mice. Mice were characterized for body weight gain (A), the mass of WAT, BAT, and liver (B), hepatic TG and histology of hepatocytes by hematoxylin and eosin (H&E) staining (C), and blood glucose (D) (n = 7–8). All data are presented as the means ± SEM. Differences were assessed by Student’s t-test. Significance is established at adjusted ** p < 0.01 and * p < 0.05. WAT: white adipose tissue; BAT: brown adipose tissue; TG: triglyceride.
Nutrients 11 01036 g001
Figure 2. Conversion of HMCA into HMPA by gut microbiota. (A) Mice treated with/without antibiotics were fed HFD containing HMCA for one week. After feeding, the cecal contents of HMCA and HMPA were determined (n = 6–8, left; conventional condition, right; antibiotic treatment). (BD) Changes in the gut microbiome in the HMCA-supplemented HFD-fed mice for 12 weeks. (B) Principal coordinate analysis (PCoA) of the cecal microbiota in HMCA-supplemented HFD-fed vs. the HFD-fed mice based on unweighted Unifrac distances between diet treatments (n = 6). (C) Relative abundance of the phylum level (n = 6). (D) Heatmap of relative abundance of major taxonomic groups at family level (mean relative abundance >0.1%) in HMCA-supplemented HFD-fed mice vs. the HFD-fed control mice (n = 6). FDR, q < 0.1. All data are presented as the means ± SEM. Differences were assessed by Student’s t-test. Significance is established at adjusted ** p < 0.01. HFD: high-fat diet; HMCA: 4-hydroxy-3-methoxycinnamic acid; HMPA: 3-(4-hydroxy-3-methoxyphenyl)propionic acid.
Nutrients 11 01036 g002
Figure 3. Metabolic parameters and histological changes in HMPA-supplemented HFD-fed mice. (A) Body weights after feeding control diet, HFD containing HMCA, and HFD containing HMPA for 12 weeks. (BE) Metabolic parameters and histological changes in HFD controls and HMPA-supplemented HFD-fed mice. Mice were characterized for body weight gain (B), the mass of WAT, BAT, and liver (C), blood glucose (D), and hepatic TG and histology of hepatocytes by H&E staining (E) (n = 7–9). (F) Relative mRNA expressions involved in energy expenditure (Pgc1a), β-oxidation (Cpt1a and Cpt2), fatty acid synthesis (Fas, Acc1, and Scd1), fatty acid trafficking (Cd36), and glycolysis (Gck and Pkm2) in the liver of HFD controls and HMPA-supplemented HFD-fed mice (n = 7). Results are expressed as fold mRNA change vs. HFD control; values were set to 1. To compare mRNA expression levels among samples, copy numbers of all transcripts were normalized to 18S mRNA expression levels, an internal control. All data are presented as the means ± SEM. Differences were assessed using one-way ANOVA followed by Dunnett’s multiple comparison test (A) and by Student’s t-test (BF). Significance is established at adjusted ** p < 0.01, and * p < 0.05. Control, HFD containing with 1% cellulose fed mice. HFD: high-fat diet; HMCA: 4-hydroxy-3-methoxycinnamic acid; HMPA: 3-(4-hydroxy-3-methoxyphenyl)propionic acid.
Nutrients 11 01036 g003
Figure 4. Compositions of gut microbiota in the HMPA-supplemented HFD-fed mice compared to the HFD controls. (A) PCoA of the cecal microbiota in HMPA-supplemented HFD-fed mice vs. the HFD controls based on unweighted Unifrac distances between diet groups (n = 6–7). (B) Relative abundance of the phylum level (n = 6–7). (C) Heatmap of relative abundance of major taxonomic groups at family level (mean relative abundance >0.1%) in HMPA-supplemented HFD-fed mice vs. the HFD controls (n = 6–7). FDR, q < 0.1. All data are presented as the means ± SEM. Differences were assessed by Student’s t-test. Significance is established at adjusted p < 0.05. Control, HFD containing with 1% cellulose fed mice. HFD: high-fat diet; HMPA: 3-(4-hydroxy-3-methoxyphenyl)propionic acid.
Nutrients 11 01036 g004
Table 1. Diet compositions.
FormulaHFD 1HMCA 2
Productkcal %kcal %
Protein2020
Carbohydrate2020
Fat6060
Ingredientgmgm
Casein, 30 mesh200198
L-cystine32.97
Corn starch00
Maltodextrin 10125123.75
Sucrose68.868.112
Cellulose, BW2005049.5
HMCA07.7385
Cellulose00
Soybean oil2524.75
Lard245242.55
Mineral mix S10026109.9
Dicalcium phosphate1312.87
Calcium carbonate5.55.445
Potassium citrate, 1 H2O16.516.335
Vitamin mix V10001109.9
Choline bitartrate21.98
FD&C blue dye #10.050.0495
1 HFD: high-fat diet; 2 HMCA: HFD + 1% 4-hydroxy-3-methoxycinnamic acid. FD&C blue dye #1: synthetic organic compound primarily used as a blue colorant for dietary supplements.
Table 2. Diet compositions.
FormulaControl 1HMPA 2
Productkcal %kcal %
Protein2020
Carbohydrate2020
Fat6060
Ingredientgmgm
Casein, 30 mesh198198
L-cystine2.972.97
Corn starch00
Maltodextrin 10123.75123.75
Sucrose68.11268.112
Cellulose, BW20049.549.5
HMPA07.7385
Cellulose7.73850
Soybean oil24.7524.75
Lard242.55242.55
Mineral mix S100269.99.9
Dicalcium phosphate12.8712.87
Calcium carbonate5.4455.445
Potassium citrate, 1 H2O16.33516.335
Vitamin mix V100019.99.9
Choline bitartrate1.981.98
FD&C blue dye #10.04950.0495
1 Control: HFD + 1% cellulose; 2 HMPA: HFD + 1% 3-(4-hydroxy-3-methoxyphenyl)propionic acid. FD&C blue dye #1: synthetic organic compound primarily used as a blue colorant for dietary supplements.
Table 3. Primer sequences used in this study.
GenePrimerSequence
18SForward5′-CTCAACACGGGAAACCTCAC-3′
Reverse5′-AGACAAATCGCTCCACCAAC-3′
Pgc1aForward5′-GAGAATGAGGCAAACTTGCTAGCG-3′
Reverse5′-TGCATGGTTCTGAGTGCTAAGACC-3′
Acc1Forward5′-AAGGCTATGTGAAGGATG-3′
Reverse5′-CTGTCTGAAGAGGTTAGG-3′
Cpt1aForward5′-GCATAAACGCAGAGCATTCC-3′
Reverse5′-GATGTTGGGGTTCTTGTCTCC-3′
Cpt2Forward5′-CTCATCCGCTTTGTTCCTTC-3′
Reverse5′-AGTTCATCACGACTGGGTTTG-3′
Cd36Forward5′-TGGCAAAGAACAGCAGCAAA-3′
Reverse5′-GACAGTGAAGGCTCAAAGATGG-3′
Pkm2Forward5′-TCTTCTGGACCCATCGGCCCCAGGA-3′
Reverse5′-AAAGGGATAGGGGAGGGGAAG-3′
FasForward5′-GCTGCGGAAACTTCAGGAAAT-3′
Reverse5′-AGAGACGTGTCACTCCTGGACTT-3′
Scd1Forward5′-GTCAGGAGGGCAGGTTTC-3′
Reverse5′-GAGCGTGGACTTCGGTTC-3′
GckForward5′-TACCCCTGGGCTTCACCTT-3′
Reverse5′-CACCTGCGACACAAACGG-3′

