Pomegranate Extract Improves Maximal Performance of Trained Cyclists after an Exhausting Endurance Trial: A Randomised Controlled Trial

 , , , , and
Abstract
1. Introduction
2. Materials and Methods
2.1. Subjects
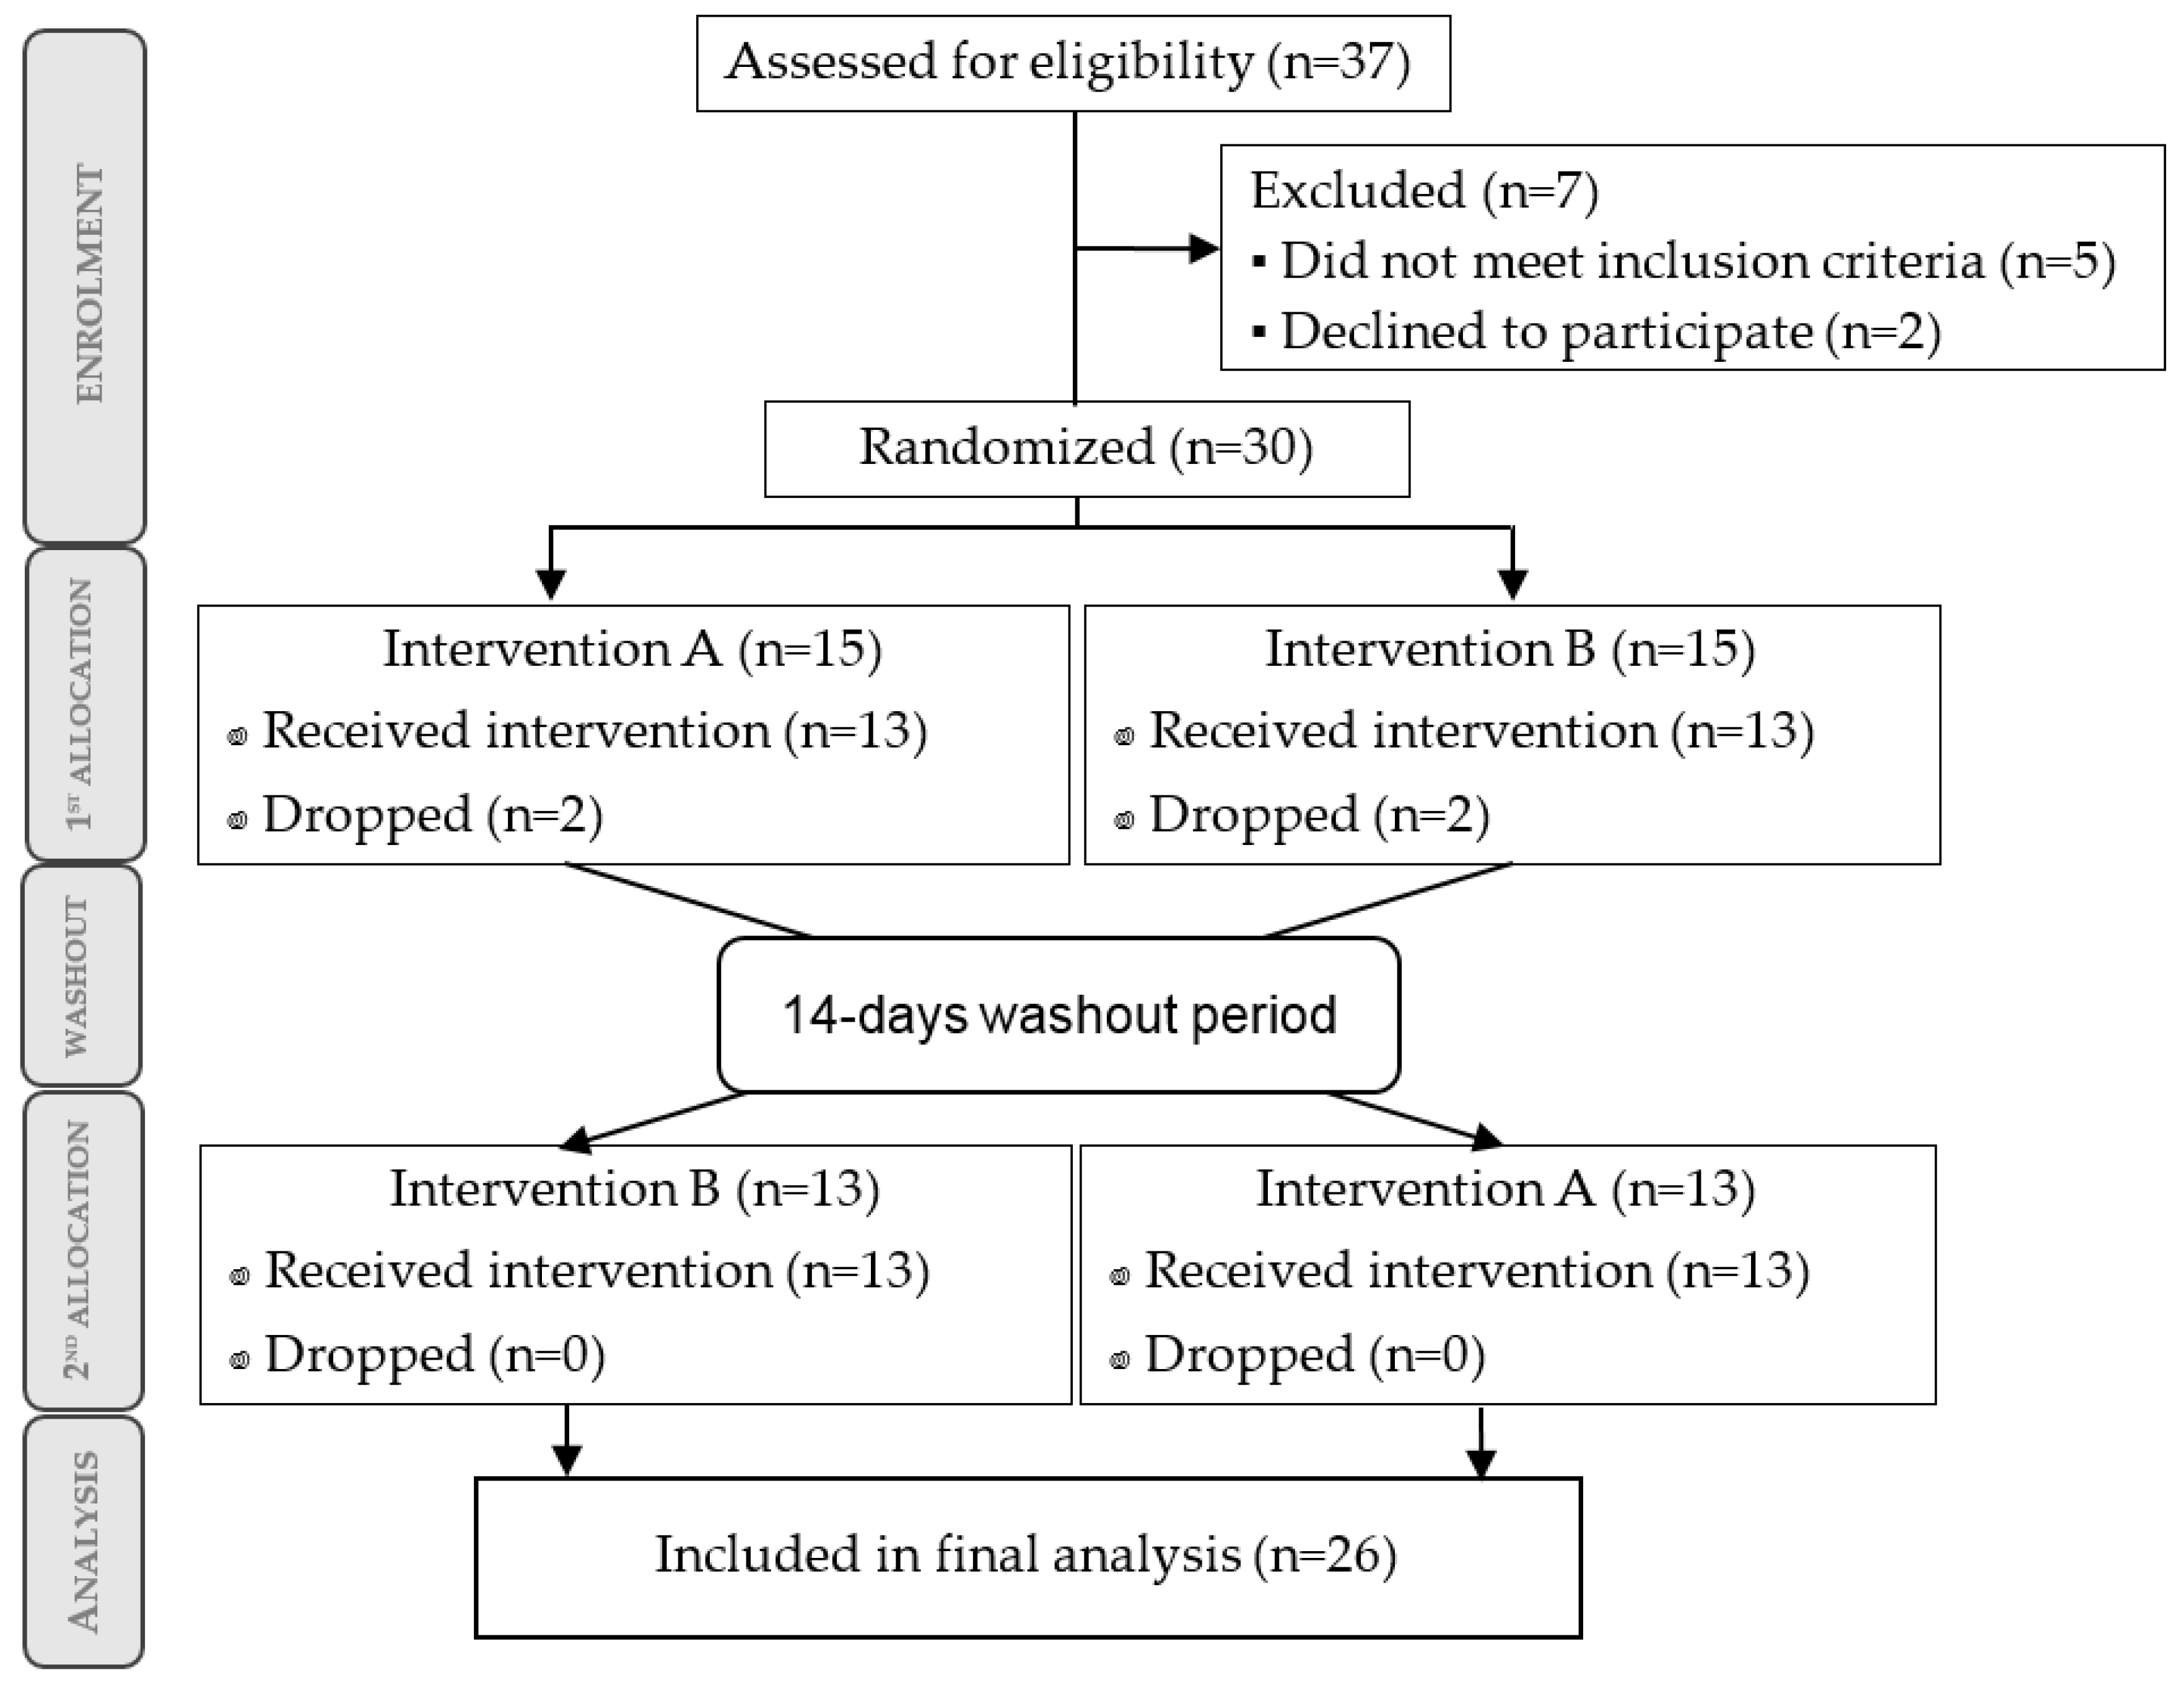
2.2. Trial Design
2.3. Supplementation Protocol
2.3.1. Compliance and Follow-Up
2.3.2. Dietary Assessment and Control
2.4. Exercise Tests
2.4.1. Initial Physical Assessment: Aerobic and Health Assessment
2.4.2. Exercise Tests: Endurance Test and Strength Protocol
- Endurance test
- a.
- Square-wave endurance exercise test (SWEET), followed immediately by
- b.
- Incremental exercise test to exhaustion (IETE), followed by 5 min of rest.
- Strength protocol
- c.
- Eccentric exercise drill.
Endurance Tests (SWEET and IETE)
- a.
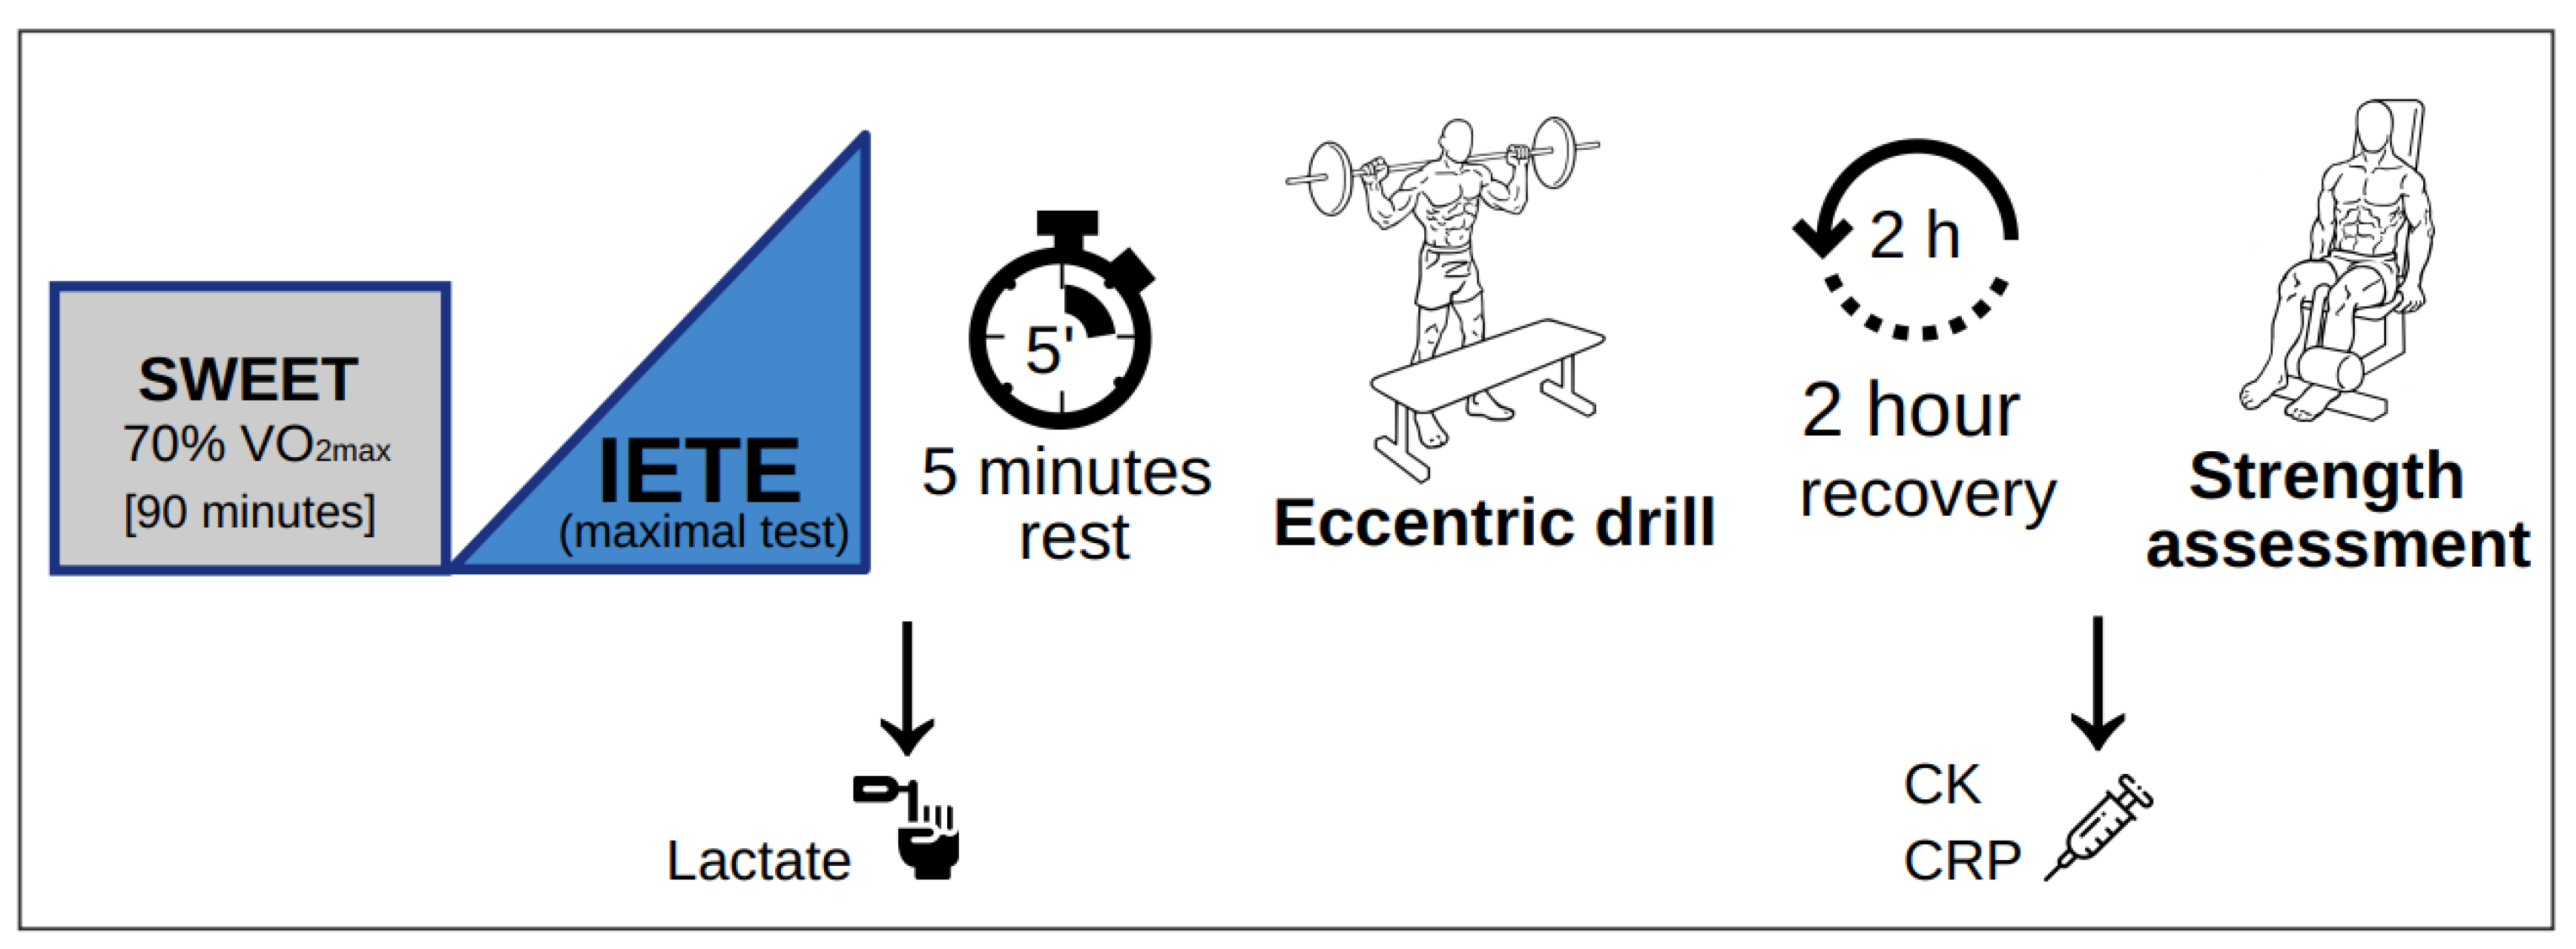
- Square-wave endurance exercise test (SWEET): A constant intensity cycling test was performed on the same electronically braked ergometer in same conditions. Subjects were instructed to complete a self-paced 10-min warm-up, without reaching initial load, followed by 90 min of SWEET with an individual load in watts, corresponding to 70% of VO2max as calculated after a preliminary test. HR was continuously monitored using a pulsometer (Polar RS800CX, Polar Electro Oy, Finland) to double-check that athletes remained under VT2 at the given intensity, by screening the heart rate variability which showed significant correlation with VT2 in previous work [36]. To ensure proper performance, cyclists followed a hydration protocol, which was measured during the trial [37]. Subjects were asked to estimate their rate of perceived exertion (RPE) using the Borg scale [38] (scale from 1 to 20) after warm-up (10 min after commencement) and after 30, 50, 70 and 90 min (end of the test).
- b.
- Incremental exercise test to exhaustion (IETE): Once the SWEET was completed, the maximal incremental cycling test was performed without interruption. Following 3 min of recovery at a self-selected intensity (never above the initial load), subjects performed a progressive incremental cycling test (initial load: 60% of VO2max) with the same equipment and conditions as the preliminary test. The difference now was that every step consisted of 3 min instead of one (i.e.,: 35-W increase every 3 min). Lactate samples were collected 1 min 40 s after completing the test by lancing the left ring-finger pad and were immediately analysed by a blood gas analyser (ABL90FLEX, Radiometer Medical APS, Copenhagen, Denmark). Subjects were then asked again to estimate their RPE.
Strength Protocol (Eccentric Drill)
- c.
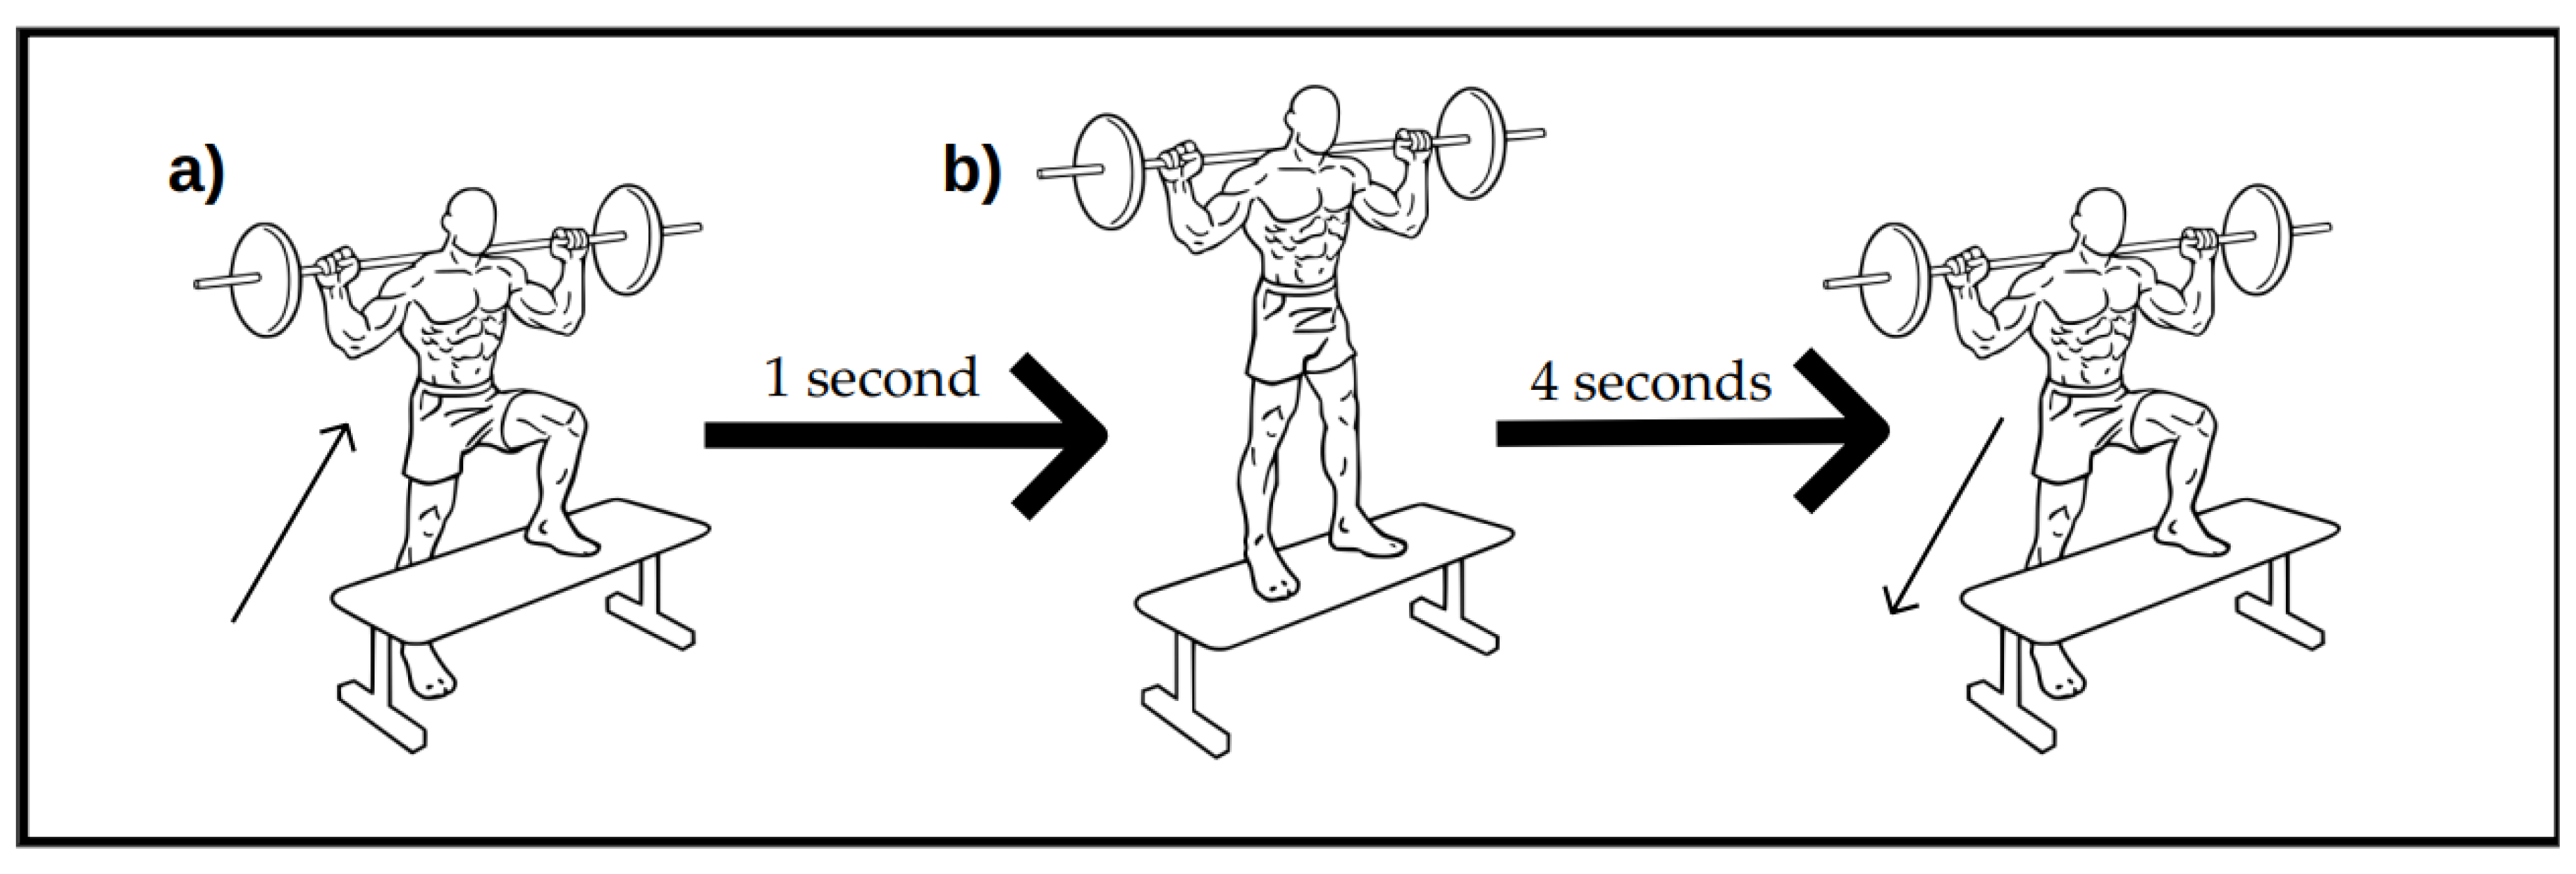
- Subjects were given 5 min of transition time before performing the eccentric exercise test in another room with same conditions. The whole drill consisted of 15 repetitions, for a total of 6 sets per leg (15 × 6 = 90 repetitions per leg) performed at a specific cadence (1:4). The exercise sequence is depicted in Scheme 1.
2.5. Variables and Measurements
2.6. Statistical Analysis
3. Results
3.1. Participant Flow Diagram and Baseline Characteristics
3.2. Conditions during Exercise Tests
3.3. RPE during and after the Square-Wave Test (SWEET)
3.4. Incremental Exercise Test to Exhaustion (IETE)
3.5. Strength Protocol: Eccentric Exercise and Isokinetic Force
3.6. Post-Exercise Muscular Damage and Inflammation
4. Discussion
4.1. Primary Findings
4.2. Acute Effect versus Chronic Benefits
4.3. Pomegranate and Hypothetic Acute Effect through the Nitric oxide Pathway
4.4. Role of Pomegranate, Polyphenols and Punicalagins in Exercise Performance
4.5. Strength Assessment and Force Restoration
4.6. Post-Exercise Recovery
Author Contributions
Funding
Acknowledgments
Conflicts of Interest
References
- Harborne, J.B. The Flavonoids: Advances in Research since 1980; Springer: Berlin/Heidelberg, Germany, 2013; ISBN 978-1-4899-2913-6. [Google Scholar]
- Mattila, P.; Hellström, J.; Törrönen, R. Phenolic Acids in Berries, Fruits and Beverages. J. Agric. Food Chem. 2006, 54, 7193–7199. [Google Scholar] [CrossRef] [PubMed]
- Crozier, A.; Jaganath, I.B.; Clifford, M.N. Dietary phenolics: chemistry, bioavailability and effects on health. Nat. Prod. Rep. 2009, 26, 1001–1043. [Google Scholar] [CrossRef] [PubMed]
- Grassi, D.; Desideri, G.; Ferri, C. Blood pressure and cardiovascular risk: What about cocoa and chocolate? Arch. Biochem. Biophys. 2010, 501, 112–115. [Google Scholar] [CrossRef]
- Grassi, D.; Desideri, G.; Di Giosia, P.; De Feo, M.; Fellini, E.; Cheli, P.; Ferri, L.; Ferri, C. Tea, flavonoids and cardiovascular health: endothelial protection. Am. J. Clin. Nutr. 2013, 98, 1660S–1666S. [Google Scholar] [CrossRef]
- Grassi, D.; Desideri, G.; Ferri, C.; Grassi, D.; Desideri, G.; Ferri, C. Flavonoids: Antioxidants Against Atherosclerosis. Nutrients 2010, 2, 889–902. [Google Scholar] [CrossRef] [PubMed]
- Wang, D.; Özen, C.; Abu-Reidah, I.M.; Chigurupati, S.; Patra, J.K.; Horbanczuk, J.O.; Jóźwik, A.; Tzvetkov, N.T.; Uhrin, P.; Atanasov, A.G. Vasculoprotective Effects of Pomegranate (Punica granatum L.). Front. Pharmacol. 2018, 9. [Google Scholar] [CrossRef] [PubMed]
- Alcaraz-Mármol, F.; Nuncio-Jáuregui, N.; García-Sánchez, F.; Martínez-Nicolás, J.J.; Hernández, F. Characterization of twenty pomegranate (Punica granatum L.) cultivars grown in Spain: Aptitudes for fresh consumption and processing. Sci. Hortic. (Amsterdam) 2017, 219, 152–160. [Google Scholar] [CrossRef]
- Alcaraz-Mármol, F.; Calín-Sánchez, Á.; Nuncio-Jáuregui, N.; Carbonell-Barrachina, Á.A.; Hernández, F.; Martínez, J.J. Classification of Pomegranate Cultivars According to Their Seed Hardness and Wood Perception. J. Texture Stud. 2015, 46, 467–474. [Google Scholar] [CrossRef]
- Alcaraz-Mármol, F.; Nuncio-Jáuregui, N.; Calín-Sánchez, Á.; Carbonell-Barrachina, Á.A.; Martínez, J.J.; Hernández, F. Determination of fatty acid composition in arils of 20 pomegranates cultivars grown in Spain. Sci. Hortic. (Amsterdam) 2015, 197, 712–718. [Google Scholar] [CrossRef]
- Gil, M.I.; Tomás-Barberán, F.A.; Hess-Pierce, B.; Holcroft, D.M.; Kader, A.A. Antioxidant Activity of Pomegranate Juice and Its Relationship with Phenolic Composition and Processing. J. Agric. Food Chem. 2000, 48, 4581–4589. [Google Scholar] [CrossRef]
- Seeram, N.; Lee, R.; Hardy, M.; Heber, D. Rapid large scale purification of ellagitannins from pomegranate husk, a by-product of the commercial juice industry. Sep. Purif. Technol. 2005, 41, 49–55. [Google Scholar] [CrossRef]
- Adams, L.S.; Seeram, N.P.; Aggarwal, B.B.; Takada, Y.; Sand, D.; Heber, D. Pomegranate Juice, Total Pomegranate Ellagitannins and Punicalagin Suppress Inflammatory Cell Signaling in Colon Cancer Cells. J. Agric. Food Chem. 2006, 54, 980–985. [Google Scholar] [CrossRef]
- Sahebkar, A.; Ferri, C.; Giorgini, P.; Bo, S.; Nachtigal, P.; Grassi, D. Effects of pomegranate juice on blood pressure: A systematic review and meta-analysis of randomized controlled trials. Pharmacol. Res. 2017, 115, 149–161. [Google Scholar] [CrossRef] [PubMed]
- Aviram, M.; Dornfeld, L. Pomegranate juice consumption inhibits serum angiotensin converting enzyme activity and reduces systolic blood pressure. Atherosclerosis 2001, 158, 195–198. [Google Scholar] [CrossRef]
- Tsang, C.; Smail, N.F.; Almoosawi, S.; Davidson, I.; Al-Dujaili, E.A.S. Intake of polyphenol-rich pomegranate pure juice influences urinary glucocorticoids, blood pressure and homeostasis model assessment of insulin resistance in human volunteers. J. Nutr. Sci. 2012, 1. [Google Scholar] [CrossRef] [PubMed]
- Aviram, M.; Dornfeld, L.; Rosenblat, M.; Volkova, N.; Kaplan, M.; Coleman, R.; Hayek, T.; Presser, D.; Fuhrman, B. Pomegranate juice consumption reduces oxidative stress, atherogenic modifications to LDL and platelet aggregation: studies in humans and in atherosclerotic apolipoprotein E–deficient mice. Am. J. Clin. Nutr. 2000, 71, 1062–1076. [Google Scholar] [CrossRef] [PubMed]
- Chistiakov, D.A.; Melnichenko, A.A.; Orekhov, A.N.; Bobryshev, Y.V. Paraoxonase and atherosclerosis-related cardiovascular diseases. Biochimie 2017, 132, 19–27. [Google Scholar] [CrossRef]
- Les, F.; Carpéné, C.; Arbonés-Mainar, J.M.; Decaunes, P.; Valero, M.S.; López, V. Pomegranate juice and its main polyphenols exhibit direct effects on amine oxidases from human adipose tissue and inhibit lipid metabolism in adipocytes. J. Funct. Foods 2017, 33, 323–331. [Google Scholar] [CrossRef]
- Dujaili, A.I.; Good, G.; Tsang, C. Consumption of Pomegranate Juice Attenuates Exercise-Induced Oxidative Stress, Blood Pressure and Urinary Cortisol/Cortisone Ratio in Human Adults. EC Nutr. 2016, 4, 982–995. [Google Scholar]
- Al Hariri, M.; Zibara, K.; Farhat, W.; Hashem, Y.; Soudani, N.; Al Ibrahim, F.; Hamade, E.; Zeidan, A.; Husari, A.; Kobeissy, F. Cigarette Smoking-Induced Cardiac Hypertrophy, Vascular Inflammation and Injury Are Attenuated by Antioxidant Supplementation in an Animal Model. Front. Pharmacol. 2016, 7. [Google Scholar] [CrossRef]
- Somerville, V.; Bringans, C.; Braakhuis, A. Polyphenols and Performance: A Systematic Review and Meta-Analysis. Sports Med. 2017, 47, 1589–1599. [Google Scholar] [CrossRef] [PubMed]
- Braakhuis, A.J.; Hopkins, W.G. Impact of Dietary Antioxidants on Sport Performance: A Review. Sports Med. 2015, 45, 939–955. [Google Scholar] [CrossRef]
- Myburgh, K.H. Polyphenol Supplementation: Benefits for Exercise Performance or Oxidative Stress? Sports Med. 2014, 44, 57–70. [Google Scholar] [CrossRef]
- Pelletier, D.M.; Lacerte, G.; Goulet, E.D.B. Effects of Quercetin Supplementation on Endurance Performance and Maximal Oxygen Consumption: A Meta-Analysis. Int. J. Sport Nutr. Exerc. Metab. 2013, 23, 73–82. [Google Scholar] [CrossRef] [PubMed]
- Kressler, J.; Millard-Stafford, M.; Warren, G.L. Quercetin and endurance exercise capacity: A systematic review and meta-analysis. Med. Sci. Sports Exerc. 2011, 43, 2396–2404. [Google Scholar] [CrossRef] [PubMed]
- McLeay, Y.; Barnes, M.J.; Mundel, T.; Hurst, S.M.; Hurst, R.D.; Stannard, S.R. Effect of New Zealand blueberry consumption on recovery from eccentric exercise-induced muscle damage. J. Int. Soc. Sports Nutr. 2012, 9, 19. [Google Scholar] [CrossRef] [PubMed]
- Stevenson, D.E. Polyphenols as Adaptogens—The Real Mechanism of the Antioxidant Effect? In Bioactive Compounds in Phytomedicine; Rasooli, I., Ed.; InTech: London, UK, 2012; ISBN 978-953-307-805-2. [Google Scholar]
- Lappalainen, Z. Sirtuins: A Family of Proteins with Implications for Human Performance and Exercise Physiology. Res. Sports Med. 2010, 19, 53–65. [Google Scholar] [CrossRef]
- Chung, S.; Yao, H.; Caito, S.; Hwang, J.; Arunachalam, G.; Rahman, I. Regulation of SIRT1 in cellular functions: Role of polyphenols. Arch. Biochem. Biophys. 2010, 501, 79–90. [Google Scholar] [CrossRef] [PubMed]
- Herspring, K.F.; Ferreira, L.F.; Copp, S.W.; Snyder, B.S.; Poole, D.C.; Musch, T.I. Effects of antioxidants on contracting spinotrapezius muscle microvascular oxygenation and blood flow in aged rats. J. Appl. Physiol. (1985) 2008, 105, 1889–1896. [Google Scholar] [CrossRef]
- Reid, M.B. Invited Review: Redox modulation of skeletal muscle contraction: what we know and what we don’t. J. Appl. Physiol. (1985) 2001, 90, 724–731. [Google Scholar] [CrossRef]
- Casajús, J.A.; Piedrafita, E.; Aragonés, M.T. Criterios de maximalidad en pruebas de esfuerzo. Revista Internacional de Medicina y Ciencias de la Actividad Física y del Deporte/Int. J. Med. Sci. Phys. Act. Sport 2009, 9. [Google Scholar]
- Skinner, J.S.; Mclellan, T.H. The Transition from Aerobic to Anaerobic Metabolism. Res. Q Exerc. Sport 1980, 51, 234–248. [Google Scholar] [CrossRef]
- Beaver, W.L.; Wasserman, K.; Whipp, B.J. A new method for detecting anaerobic threshold by gas exchange. J. Appl. Physiol. (1985) 1986, 60, 2020–2027. [Google Scholar] [CrossRef] [PubMed]
- Ramos-Campo, D.J.; Rubio-Arias, J.A.; Ávila-Gandía, V.; Marín-Pagán, C.; Luque, A.; Alcaraz, P.E. Heart rate variability to assess ventilatory thresholds in professional basketball players. J. Sport Health Sci. 2017, 6, 468–473. [Google Scholar] [CrossRef] [PubMed]
- Palacios, N.; Franco, L.; Manonelles, P.; Manuz, B.; Villegas, J. Consenso sobre bebidas para el deportista. Composición y pautas de reposición de líquidos. Arch. Med. Deporte 2008, 126, 245–258. [Google Scholar]
- Borg, G.A. Psychophysical bases of perceived exertion. Med. Sci. Sports Exerc. 1982, 14, 377–381. [Google Scholar] [CrossRef] [PubMed]
- Gregory, H.G.; Travis, T.N. Chapter 15: Exercise Technique for Free Weight and Machine Training. In Essentials of Strength Training and Conditioning, 4th ed.; Human Kinetics: Champaign, IL, USA, 2015; pp. 387–388. ISBN 978–1-4925–0162–6. [Google Scholar]
- Ammar, A.; Bailey, S.J.; Chtourou, H.; Trabelsi, K.; Turki, M.; Hökelmann, A.; Souissi, N. Effects of pomegranate supplementation on exercise performance and post-exercise recovery in healthy adults: A systematic review. Br. J. Nutr. 2018, 1–16. [Google Scholar] [CrossRef]
- Seeram, N.P.; Henning, S.M.; Zhang, Y.; Suchard, M.; Li, Z.; Heber, D. Pomegranate Juice Ellagitannin Metabolites Are Present in Human Plasma and Some Persist in Urine for Up to 48 Hours. J. Nutr. 2006, 136, 2481–2485. [Google Scholar] [CrossRef]
- Seeram, N.P.; Lee, R.; Heber, D. Bioavailability of ellagic acid in human plasma after consumption of ellagitannins from pomegranate (Punica granatum L.) juice. Clinica. Chimica. Acta 2004, 348, 63–68. [Google Scholar] [CrossRef]
- Espín, J.C.; González-Barrio, R.; Cerdá, B.; López-Bote, C.; Rey, A.I.; Tomás-Barberán, F.A. Iberian pig as a model to clarify obscure points in the bioavailability and metabolism of ellagitannins in humans. J. Agric. Food Chem. 2007, 55, 10476–10485. [Google Scholar] [CrossRef]
- Trexler, E.T.; Smith-Ryan, A.E.; Melvin, M.N.; Roelofs, E.J.; Wingfield, H.L. Effects of pomegranate extract on blood flow and running time to exhaustion. Appl. Physiol. Nutr. Metab. 2014, 39, 1038–1042. [Google Scholar] [CrossRef] [PubMed]
- Crum, E.M.; Che Muhamed, A.M.; Barnes, M.; Stannard, S.R. The effect of acute pomegranate extract supplementation on oxygen uptake in highly-trained cyclists during high-intensity exercise in a high altitude environment. J. Int. Soc. Sports Nutr. 2017, 14, 14. [Google Scholar] [CrossRef] [PubMed]
- Bailey, S.J.; Vanhatalo, A.; Winyard, P.G.; Jones, A.M. The nitrate-nitrite-nitric oxide pathway: Its role in human exercise physiology. Eur. J. Sport Sci. 2012, 12, 309–320. [Google Scholar] [CrossRef]
- Hellsten, Y.; Nyberg, M.; Jensen, L.G.; Mortensen, S.P. Vasodilator interactions in skeletal muscle blood flow regulation. J. Physiol. 2012, 590, 6297–6305. [Google Scholar] [CrossRef] [PubMed]
- Vilahur, G.; Padró, T.; Casaní, L.; Mendieta, G.; López, J.A.; Streitenberger, S.; Badimon, L. Polyphenol-enriched Diet Prevents Coronary Endothelial Dysfunction by Activating the Akt/eNOS Pathway. Revista Española de Cardiología (English Edition) 2015, 68, 216–225. [Google Scholar] [CrossRef]
- Ferguson, S.K.; Hirai, D.M.; Copp, S.W.; Holdsworth, C.T.; Allen, J.D.; Jones, A.M.; Musch, T.I.; Poole, D.C. Impact of dietary nitrate supplementation via beetroot juice on exercising muscle vascular control in rats. J. Physiol. 2013, 591, 547–557. [Google Scholar] [CrossRef] [PubMed]
- Crum, E.M.; Barnes, M.J.; Stannard, S.R. Multiday Pomegranate Extract Supplementation Decreases Oxygen Uptake During Submaximal Cycling Exercise, but Cosupplementation With N-acetylcysteine Negates the Effect. Int. J. Sport Nutr. Exerc. Metab. 2018, 1–7. [Google Scholar] [CrossRef] [PubMed]
- Barona, J.; Aristizabal, J.C.; Blesso, C.N.; Volek, J.S.; Fernandez, M.L. Grape polyphenols reduce blood pressure and increase flow-mediated vasodilation in men with metabolic syndrome. J. Nutr. 2012, 142, 1626–1632. [Google Scholar] [CrossRef] [PubMed]
- Ignarro, L.J.; Byrns, R.E.; Sumi, D.; de Nigris, F.; Napoli, C. Pomegranate juice protects nitric oxide against oxidative destruction and enhances the biological actions of nitric oxide. Nitric Oxide 2006, 15, 93–102. [Google Scholar] [CrossRef]
- Lopez, J.A.; Streitengerger, S.; Penalver, M.; Martinez, P. Process and apparatus for preparing pomegranate extracts. European Patent EP1967079A2, 10 Setember 2008. [Google Scholar]
- Bajes, H.R.; Al-Dujaili, E.A. Polyphenolic-rich Fruits and Supplements Enhance Exercise Performance; General Review. J. Pharm. Sci. 2017, 10. [Google Scholar]
- McAnulty, S.R.; McAnulty, L.S.; Nieman, D.C.; Quindry, J.C.; Hosick, P.A.; Hudson, M.H.; Still, L.; Henson, D.A.; Milne, G.L.; Morrow, J.D.; et al. Chronic quercetin ingestion and exercise-induced oxidative damage and inflammation. Appl. Physiol. Nutr. Metab. 2008, 33, 254–262. [Google Scholar] [CrossRef] [PubMed]
- Quindry, J.C.; McAnulty, S.R.; Hudson, M.B.; Hosick, P.; Dumke, C.; McAnulty, L.S.; Henson, D.; Morrow, J.D.; Nieman, D. Oral Quercetin Supplementation and Blood Oxidative Capacity in Response to Ultramarathon Competition. Int. J. Sport Nutr. Exerc. Metab. 2008, 18, 601–616. [Google Scholar] [CrossRef] [PubMed]
- Roelofs, E.J.; Smith-Ryan, A.E.; Trexler, E.T.; Hirsch, K.R.; Mock, M.G. Effects of pomegranate extract on blood flow and vessel diameter after high-intensity exercise in young, healthy adults. Eur. J. Sport Sci. 2017, 17, 317–325. [Google Scholar] [CrossRef] [PubMed]
- González-Sarrías, A.; García-Villalba, R.; Núñez-Sánchez, M.Á.; Tomé-Carneiro, J.; Zafrilla, P.; Mulero, J.; Tomás-Barberán, F.A.; Espín, J.C. Identifying the limits for ellagic acid bioavailability: A crossover pharmacokinetic study in healthy volunteers after consumption of pomegranate extracts. J. Funct. Foods 2015, 19, 225–235. [Google Scholar]
- González-Sarrías, A.; García-Villalba, R.; Romo-Vaquero, M.; Alasalvar, C.; Örem, A.; Zafrilla, P.; Tomás-Barberán, F.A.; Selma, M.V.; Espín, J.C. Clustering according to urolithin metabotype explains the interindividual variability in the improvement of cardiovascular risk biomarkers in overweight-obese individuals consuming pomegranate: A randomized clinical trial. Mol. Nutr. Food Res. 2017, 61. [Google Scholar] [CrossRef] [PubMed]
- Trombold, J.R.; Barnes, J.N.; Critchley, L.; Coyle, E.F. Ellagitannin Consumption Improves Strength Recovery 2–3 d after Eccentric Exercise. Med. Sci. Sports Exerc. 2010, 42, 493–498. [Google Scholar] [CrossRef] [PubMed]
- Trombold, J.R.; Reinfeld, A.S.; Casler, J.R.; Coyle, E.F. The effect of pomegranate juice supplementation on strength and soreness after eccentric exercise. J. Strength Cond. Res. 2011, 25, 1782–1788. [Google Scholar] [CrossRef] [PubMed]
- Machin, D.R.; Christmas, K.M.; Chou, T.-H.; Hill, S.C.; Van Pelt, D.W.; Trombold, J.R.; Coyle, E.F. Effects of differing dosages of pomegranate juice supplementation after eccentric exercise. Physiol. J. 2014, 2014. [Google Scholar] [CrossRef]
- Martínez-Sánchez, A.; Alacid, F.; Rubio-Arias, J.A.; Fernández-Lobato, B.; Ramos-Campo, D.J.; Aguayo, E. Consumption of Watermelon Juice Enriched in L-citrulline and Pomegranate Ellagitannins Enhanced Metabolism during Physical Exercise. J. Agric. Food Chem. 2017, 65, 4395–4404. [Google Scholar] [CrossRef]
- Morillas-Ruiz, J.; Zafrilla, P.; Almar, M.; Cuevas, M.J.; López, F.J.; Abellán, P.; Villegas, J.A.; González-Gallego, J. The effects of an antioxidant-supplemented beverage on exercise-induced oxidative stress: results from a placebo-controlled double-blind study in cyclists. Eur. J. Appl. Physiol. 2005, 95, 543–549. [Google Scholar] [CrossRef] [PubMed]
- Ammar, A.; Turki, M.; Chtourou, H.; Hammouda, O.; Trabelsi, K.; Kallel, C.; Abdelkarim, O.; Hoekelmann, A.; Bouaziz, M.; Ayadi, F.; et al. Pomegranate Supplementation Accelerates Recovery of Muscle Damage and Soreness and Inflammatory Markers after a Weightlifting Training Session. PLoS ONE 2016, 11. [Google Scholar] [CrossRef]
- Knab, A.M.; Nieman, D.C.; Gillitt, N.D.; Shanely, R.A.; Cialdella-Kam, L.; Henson, D.; Sha, W.; Meaney, M.P. Effects of a freeze-dried juice blend powder on exercise-induced inflammation, oxidative stress and immune function in cyclists. Appl. Physiol. Nutr. Metab. 2013, 39, 381–385. [Google Scholar] [CrossRef] [PubMed]


| (n = 26) | Mean | SD |
|---|---|---|
| Weight (Kg) | 74.8 | 11.3 |
| Height (m) | 1.75 | 0.05 |
| Body mass index (Kg/m2) | 24.5 | 3.0 |
| Age (years) | 34.9 | 10.0 |
| Systolic blood pressure (mm Hg) | 129.8 | 11.9 |
| Diastolic blood pressure (mm Hg) | 77.5 | 9.0 |
| VO2 max (mL/min/Kg) | 54.4 | 9.0 |
| VO2 in VT2 1 (mL/min/Kg) | 41.6 | 8.5 |
| Group | RPE during SWEET (90 min) | Time p-Value | Group × Time p-Value | ||||
|---|---|---|---|---|---|---|---|
| after Warm-Up | End of Test | ||||||
| Min 10 | Min 30 | Min 50 | Min 70 | Min 90 | |||
| PLA | 10.8 ± 2.6 | 11.9 ± 2.4 | 12.2 ± 2.3 | 12.7 ± 2.4 | 13.2 ± 2.3 | < 0.001 | 0.74 |
| PE | 11.0 ± 2.2 | 12.1 ± 2.4 | 12.8 ± 2.0 | 13.2 ± 2.0 | 13.7 ± 2.3 | < 0.001 | |
| PLA | PE | Difference (95% CI) | Time p-Value | |
|---|---|---|---|---|
| TTE (sec) | 663.05 ± 222.70 | 757.35 ± 174.91 | 17.66–170.94 | <0.02 |
| Time to VT2 (sec) | 533.33 ± 180.15 | 588.10 ± 154.75 | 26.98–82.55 | <0.001 |
| VO2max (ml/min/Kg) | 3957.75 ± 612.71 | 3871.35 ± 606.34 | −257.27–84.47 | 0.30 |
| VO2 at VT2 (ml/min/Kg) | 3471.05 ± 473.87 | 3453.60 ± 500.27 | −123.29–87.99 | 0.73 |
| Lactate (mmol/L) | 8.93 ± 2.43 | 9.23 ± 2.69 | −0.73–1.32 | 0.55 |
| Group | Post-Test | Time p-Value | Group × Time p-Value | |||||
|---|---|---|---|---|---|---|---|---|
| 2 h | 24 h | 48 h | 72 h | |||||
| Extension (60°· s−1) | Peak Torque (N × m/Kg) | PLA | 250.8 ± 31.4 | 274.3 ± 37.2 | 276.6 ± 34.4 | 274.6 ± 38.6 | <0.05 | 0.38 |
| PE | 248.3 ± 43.2 | 267.1 ± 43.2 | 263.6 ± 63.0 | 279.4 ± 40.6 | <0.01 | |||
| Relative work (J/Kg) | PLA | 188.5 ± 32.0 | 203.9 ± 31.6 | 200.0 ± 30.3 | 204.3 ± 32.4 | <0.001 | 0.31 | |
| PE | 185.6 ± 32.0 | 200.7 ± 33.6 | 199.0 ± 52.1 | 215.8 ± 35.5 | <0.001 | |||
| Work fatigue (%) | PLA | 14.3 ± 11.9 | 16.4 ± 10.5 | 16.6 ± 9.1 | 15.8 ± 8.1 | 0.81 | 0.38 | |
| PE | 9.8 ± 10.4 | 15.6 ± 11.0 | 14.6 ± 13.7 | 14.9 ± 13.0 | <0.5 | |||
| Average power (W) | PLA | 120.7 ± 21.3 | 141.4 ± 22.8 | 144.8 ± 23.5 | 147.0 ± 26.9 | <0.001 | 0.78 | |
| PE | 118.4 ± 32.8 | 134.2 ± 30.0 | 138.4 ± 39.5 | 146.6 ± 27.4 | <0.001 | |||
| Flexion (60°· s−1) | Peak Torque (N × m/Kg) | PLA | 132.7 ± 23.7 | 144.3 ± 28.3 | 147.7 ± 28.3 | 145.3 ± 28.1 | <0.001 | 0.14 |
| PE | 132.9 ± 33.1 | 134.3 ± 25.7 | 139.1 ± 38.1 | 148.9 ± 29.6 | <0.01 | |||
| Relative work (J/Kg) | PLA | 101.6 ± 20.0 | 105.9 ± 27.1 | 104.1 ± 26.2 | 106.8 ± 22.7 | 0.34 | 0.28 | |
| PE | 99.4 ± 21.8 | 101.3 ± 20.1 | 103.1 ± 30.9 | 113.3 ± 22.2 | <0.01 | |||
| Work fatigue (%) | PLA | 19.1 ± 11.5 | 22.0 ± 8.0 | 25.9 ± 8.8 | 23.1 ± 5.4 | 0.09 | 0.98 | |
| PE | 15.5 ± 18.2 | 16.3 ± 11.0 | 20.4 ± 9.4 | 18.9 ± 17.0 | 0.56 | |||
| Average power (W) | PLA | 66.9 ± 15.4 | 76.3 ± 16.9 | 77.2 ± 15.2 | 77.7 ± 17.4 | <0.03 | 0.24 | |
| PE | 62.6 ± 18.5 | 68.3 ± 14.1 | 74.5 ± 22.0 | 79.7 ± 15.4 | <0.001 | |||
| Basal | Post-Test | Time p-Value | Group × Time p-Value | |||||
|---|---|---|---|---|---|---|---|---|
| 0 h | 2 h | 24 h | 48 h | 72 h | ||||
| CK | PLA | 119.00 ± 30.87 | 196.69 ± 126.51 | 313.94 ± 392.51 | 234.13 ± 215.20 | 184.88 ± 122.34 | <0.05 | 0.71 |
| PE | 114.63 ± 48.51 | 176.94 ± 101.18 | 254.06 ± 240.51 | 208.00 ± 153.81 | 169.81 ± 113.78 | <0.02 | ||
| CRP | PLA | 0.58 ± 0.34 | 0.57 ± 0.35 | 2.23 ± 2.12 | 1.59 ± 2.34 | 1.06 ± 1.40 | <0.001 | 0.46 |
| PE | 0.59 ± 0.27 | 0.60 ± 0.29 | 1.74 ± 1.08 | 1.06 ± 0.85 | 0.80 ± 0.56 | <0.001 | ||
© 2019 by the authors. Licensee MDPI, Basel, Switzerland. This article is an open access article distributed under the terms and conditions of the Creative Commons Attribution (CC BY) license (http://creativecommons.org/licenses/by/4.0/).
Share and Cite
Torregrosa-García, A.; Ávila-Gandía, V.; Luque-Rubia, A.J.; Abellán-Ruiz, M.S.; Querol-Calderón, M.; López-Román, F.J. Pomegranate Extract Improves Maximal Performance of Trained Cyclists after an Exhausting Endurance Trial: A Randomised Controlled Trial. Nutrients 2019, 11, 721. https://doi.org/10.3390/nu11040721
Torregrosa-García A, Ávila-Gandía V, Luque-Rubia AJ, Abellán-Ruiz MS, Querol-Calderón M, López-Román FJ. Pomegranate Extract Improves Maximal Performance of Trained Cyclists after an Exhausting Endurance Trial: A Randomised Controlled Trial. Nutrients. 2019; 11(4):721. https://doi.org/10.3390/nu11040721
Chicago/Turabian StyleTorregrosa-García, Antonio, Vicente Ávila-Gandía, Antonio J. Luque-Rubia, María Salud Abellán-Ruiz, María Querol-Calderón, and F. Javier López-Román. 2019. "Pomegranate Extract Improves Maximal Performance of Trained Cyclists after an Exhausting Endurance Trial: A Randomised Controlled Trial" Nutrients 11, no. 4: 721. https://doi.org/10.3390/nu11040721
APA StyleTorregrosa-García, A., Ávila-Gandía, V., Luque-Rubia, A. J., Abellán-Ruiz, M. S., Querol-Calderón, M., & López-Román, F. J. (2019). Pomegranate Extract Improves Maximal Performance of Trained Cyclists after an Exhausting Endurance Trial: A Randomised Controlled Trial. Nutrients, 11(4), 721. https://doi.org/10.3390/nu11040721