How Much Can Product Reformulation Improve Diet Quality in Households with Children and Adolescents?
Abstract
1. Introduction
2. Materials and Methods
2.1. Study Design
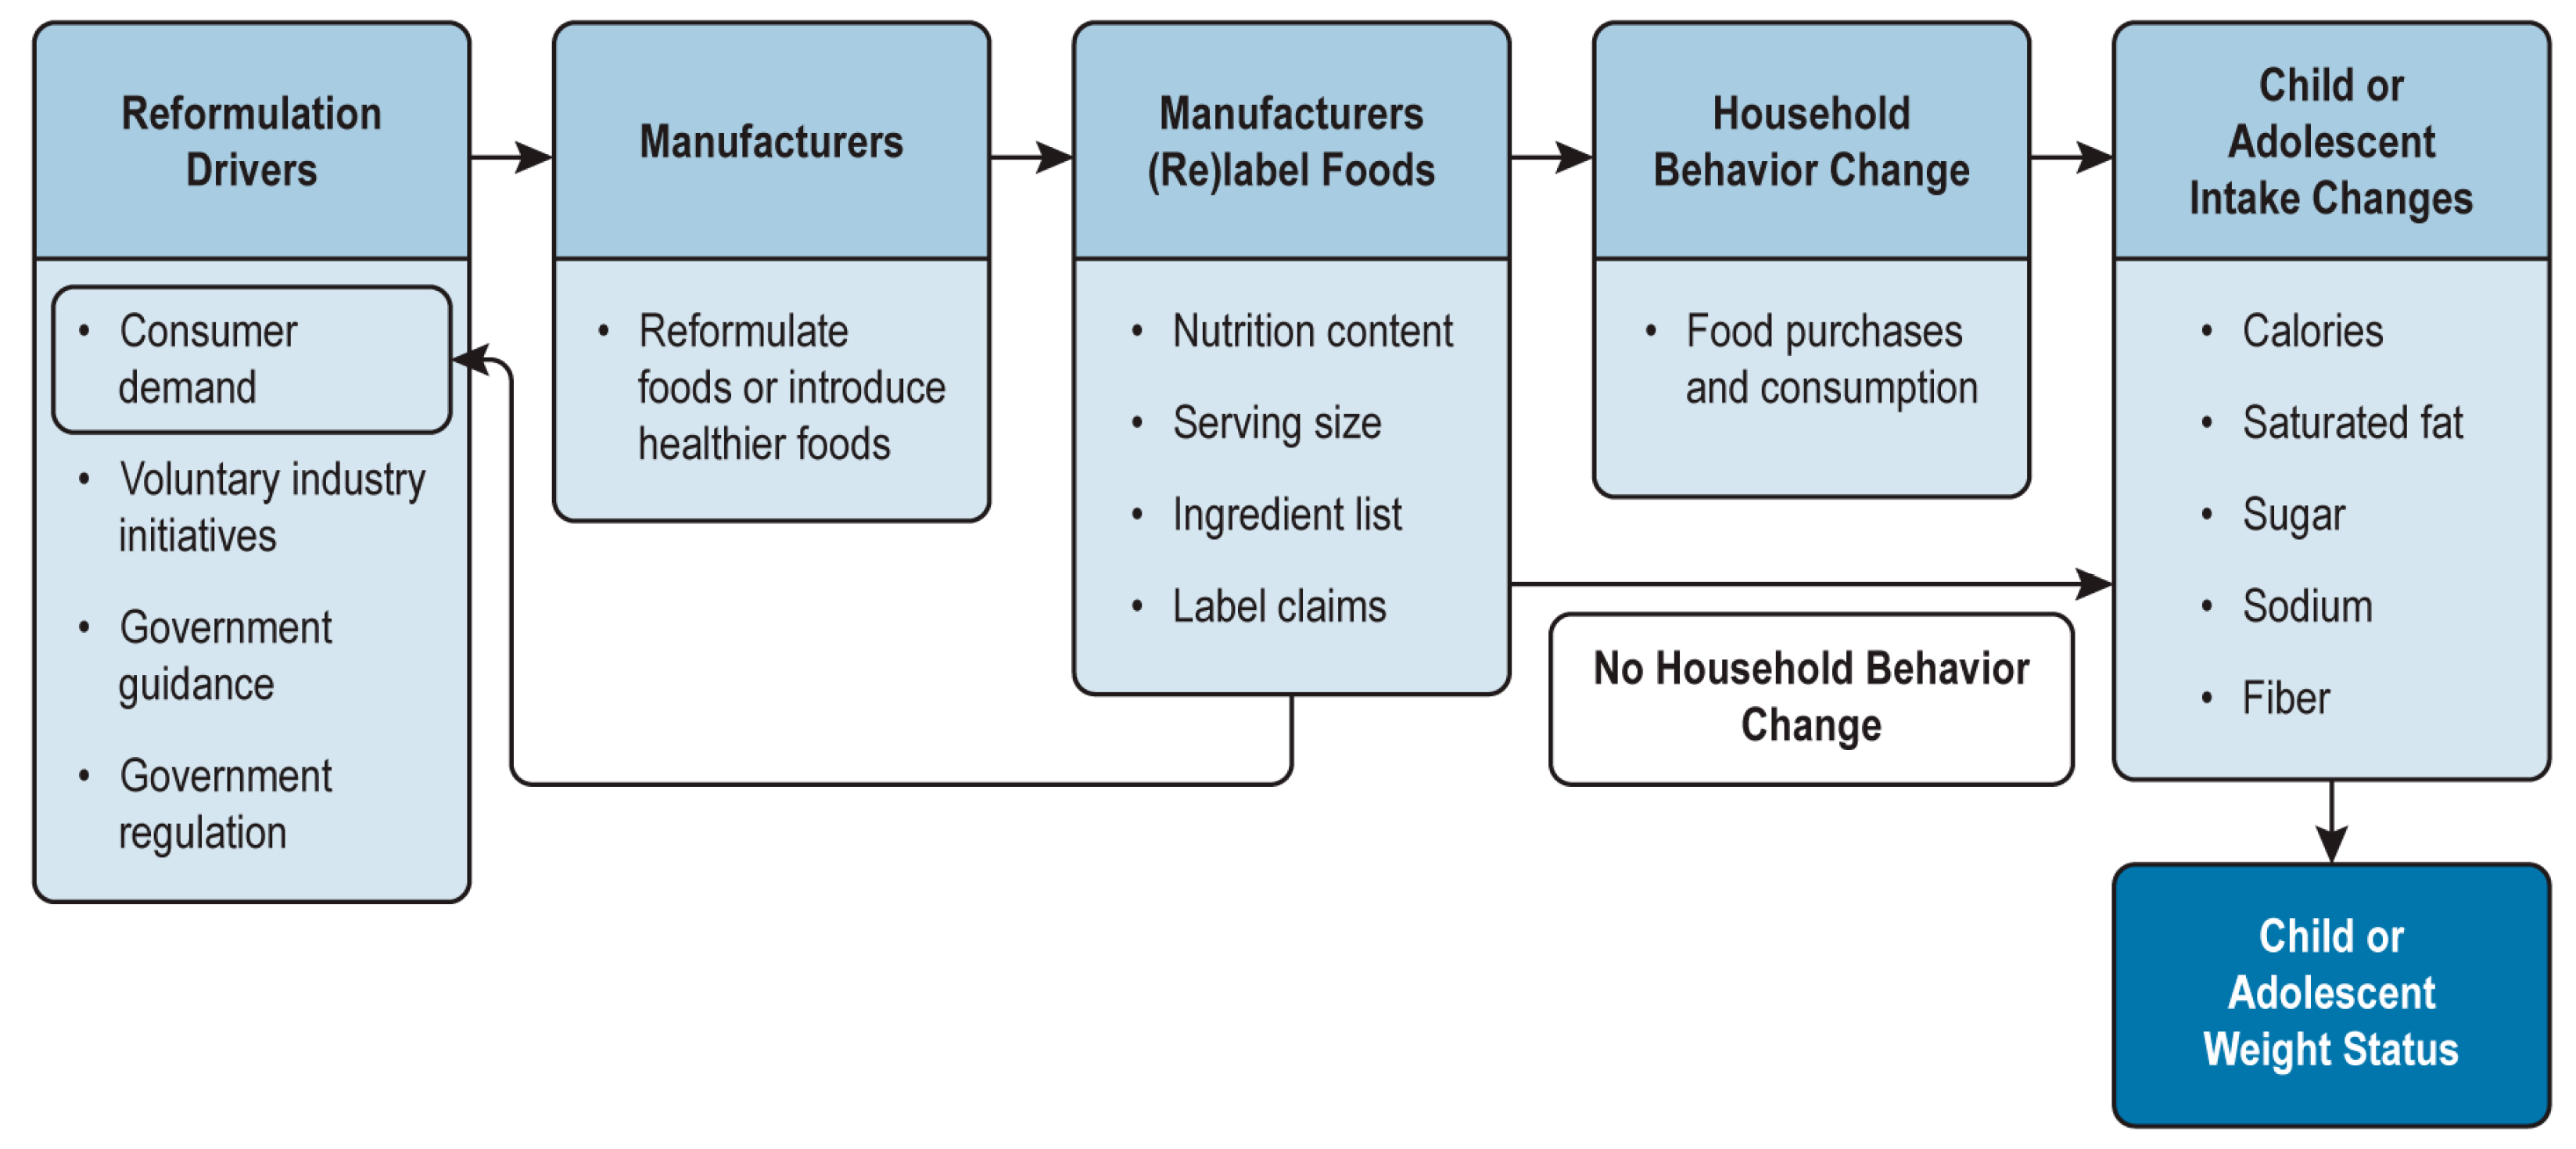
2.1.1. Conceptual Model
2.1.2. Data Sources and Preparation
2.1.3. Statistical Analysis
- Household income: low (less than 185% of poverty line) versus high (equal to or greater than 185% of the poverty line);
- Race and ethnicity: non-Hispanic white, non-Hispanic black, Hispanic, Asian, and other;
- Locality: urban, part urban/rural, and rural.
3. Results
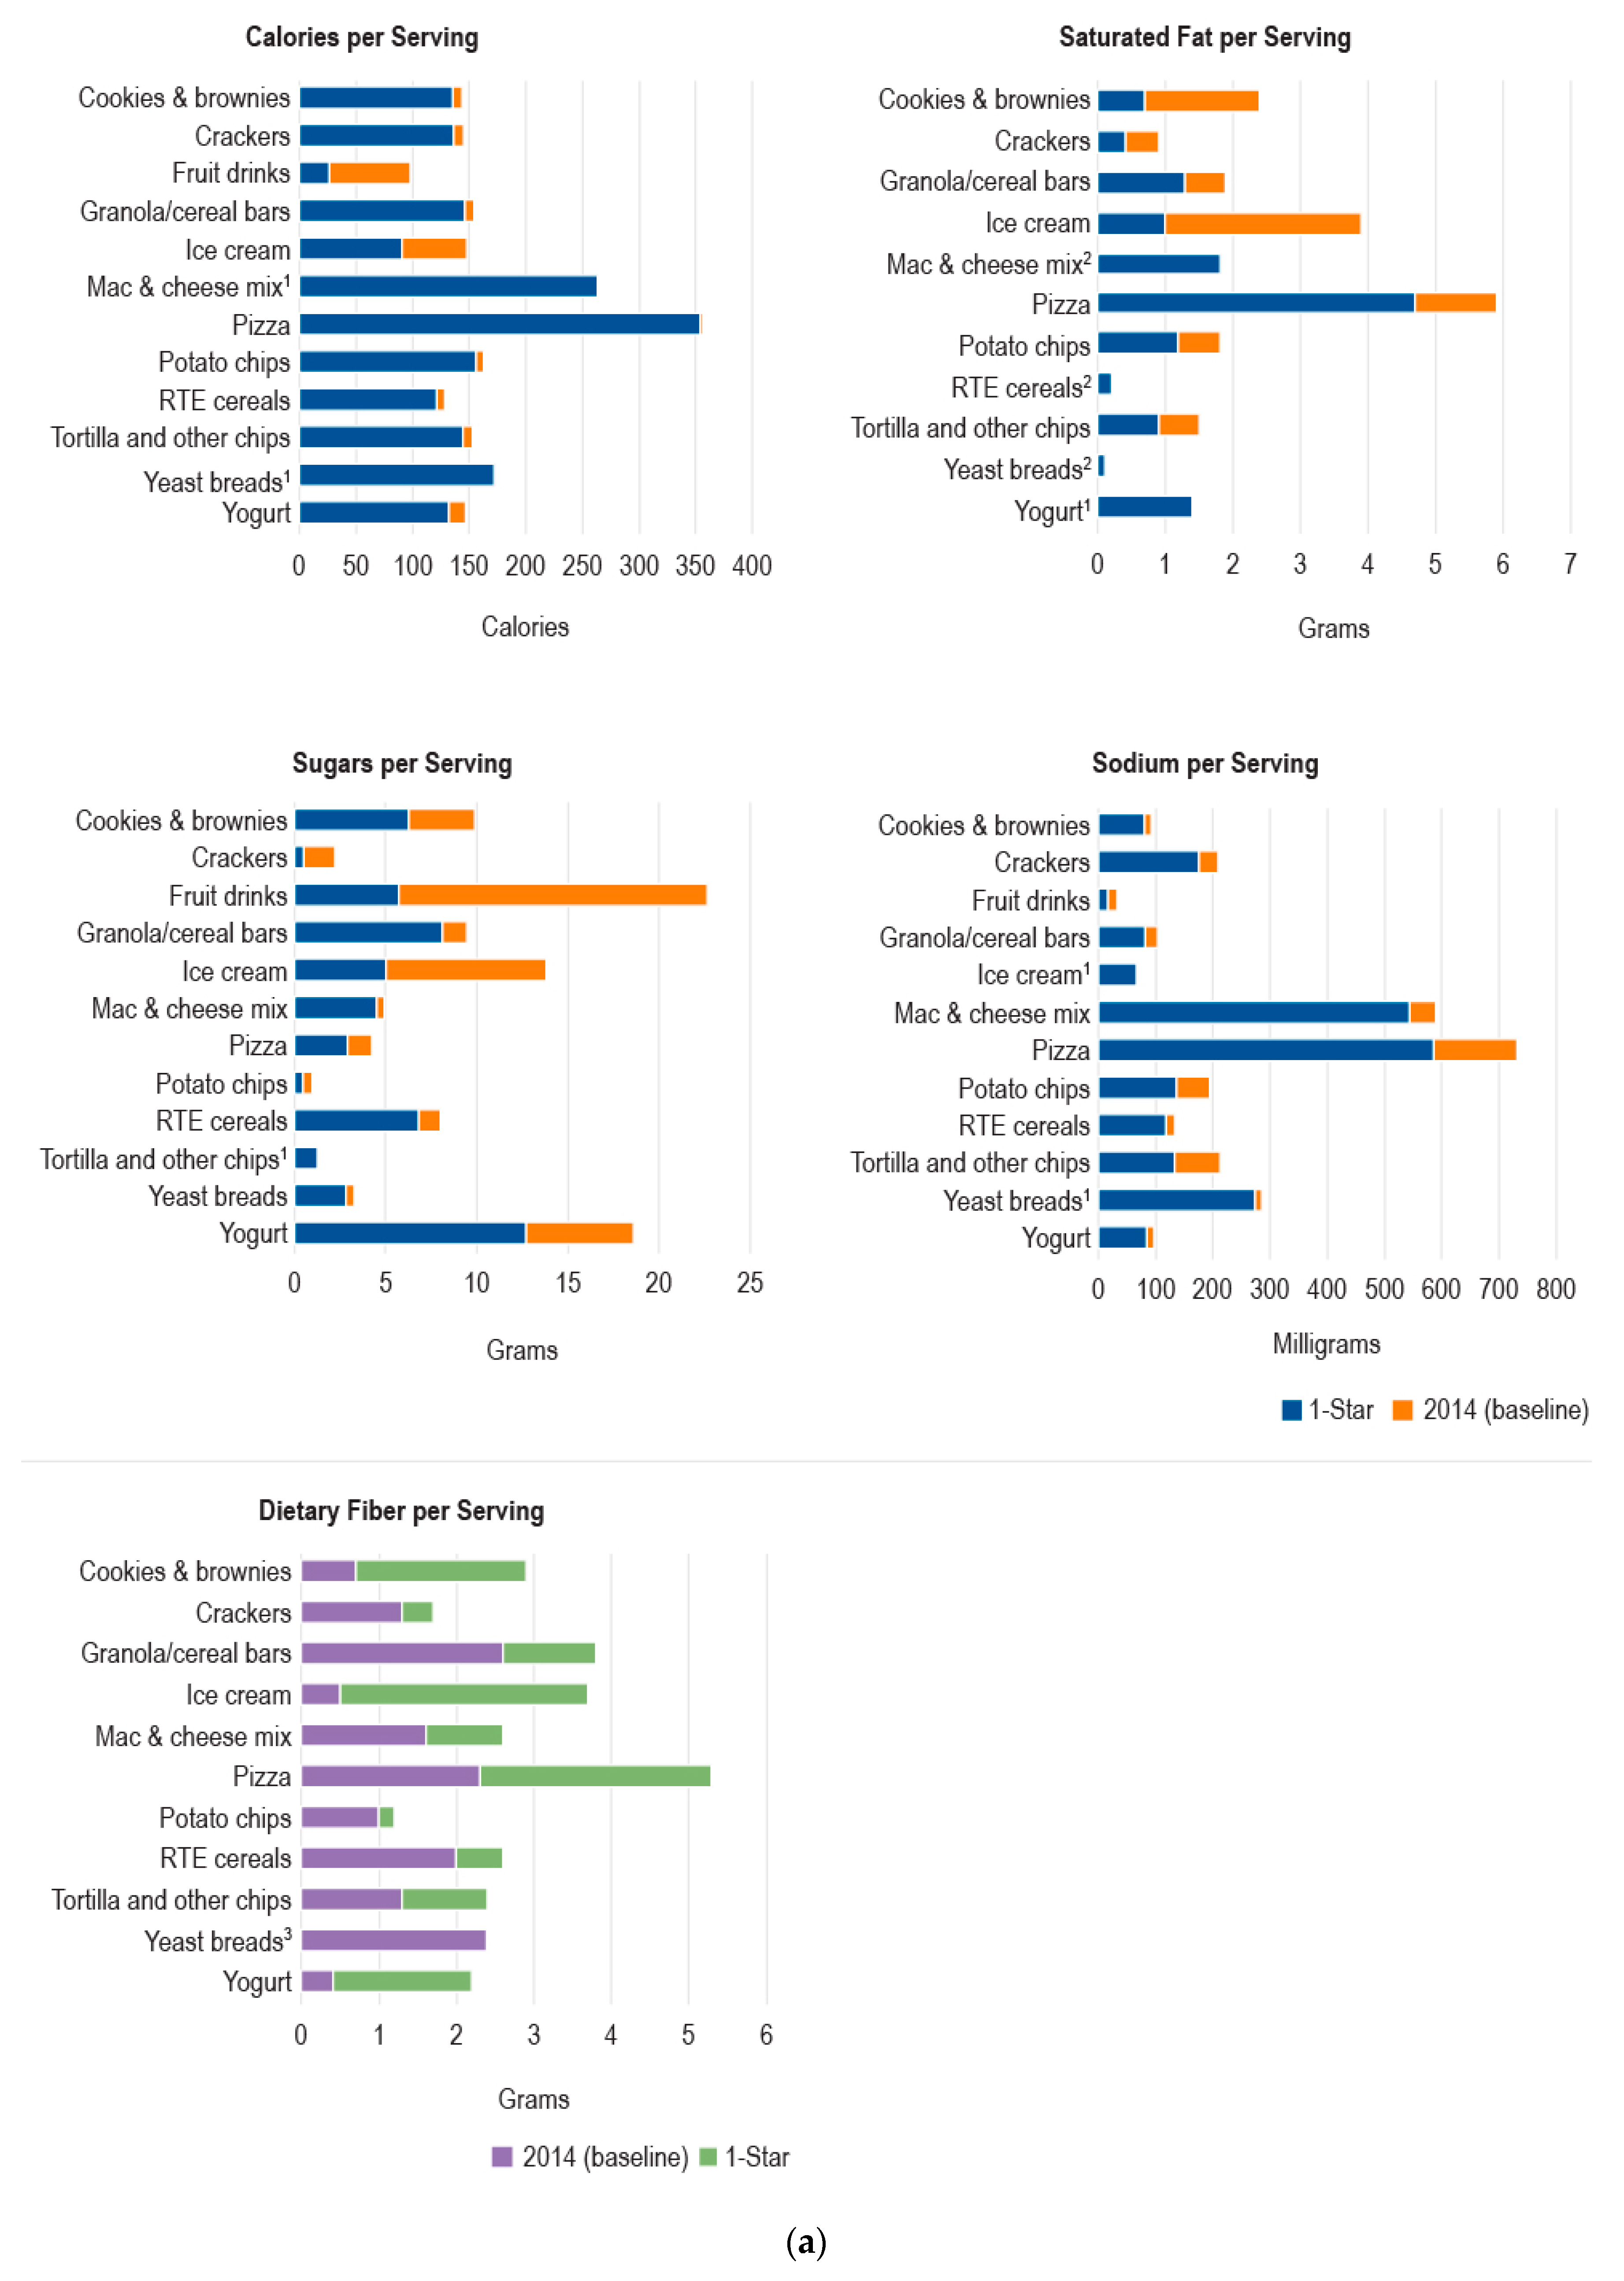
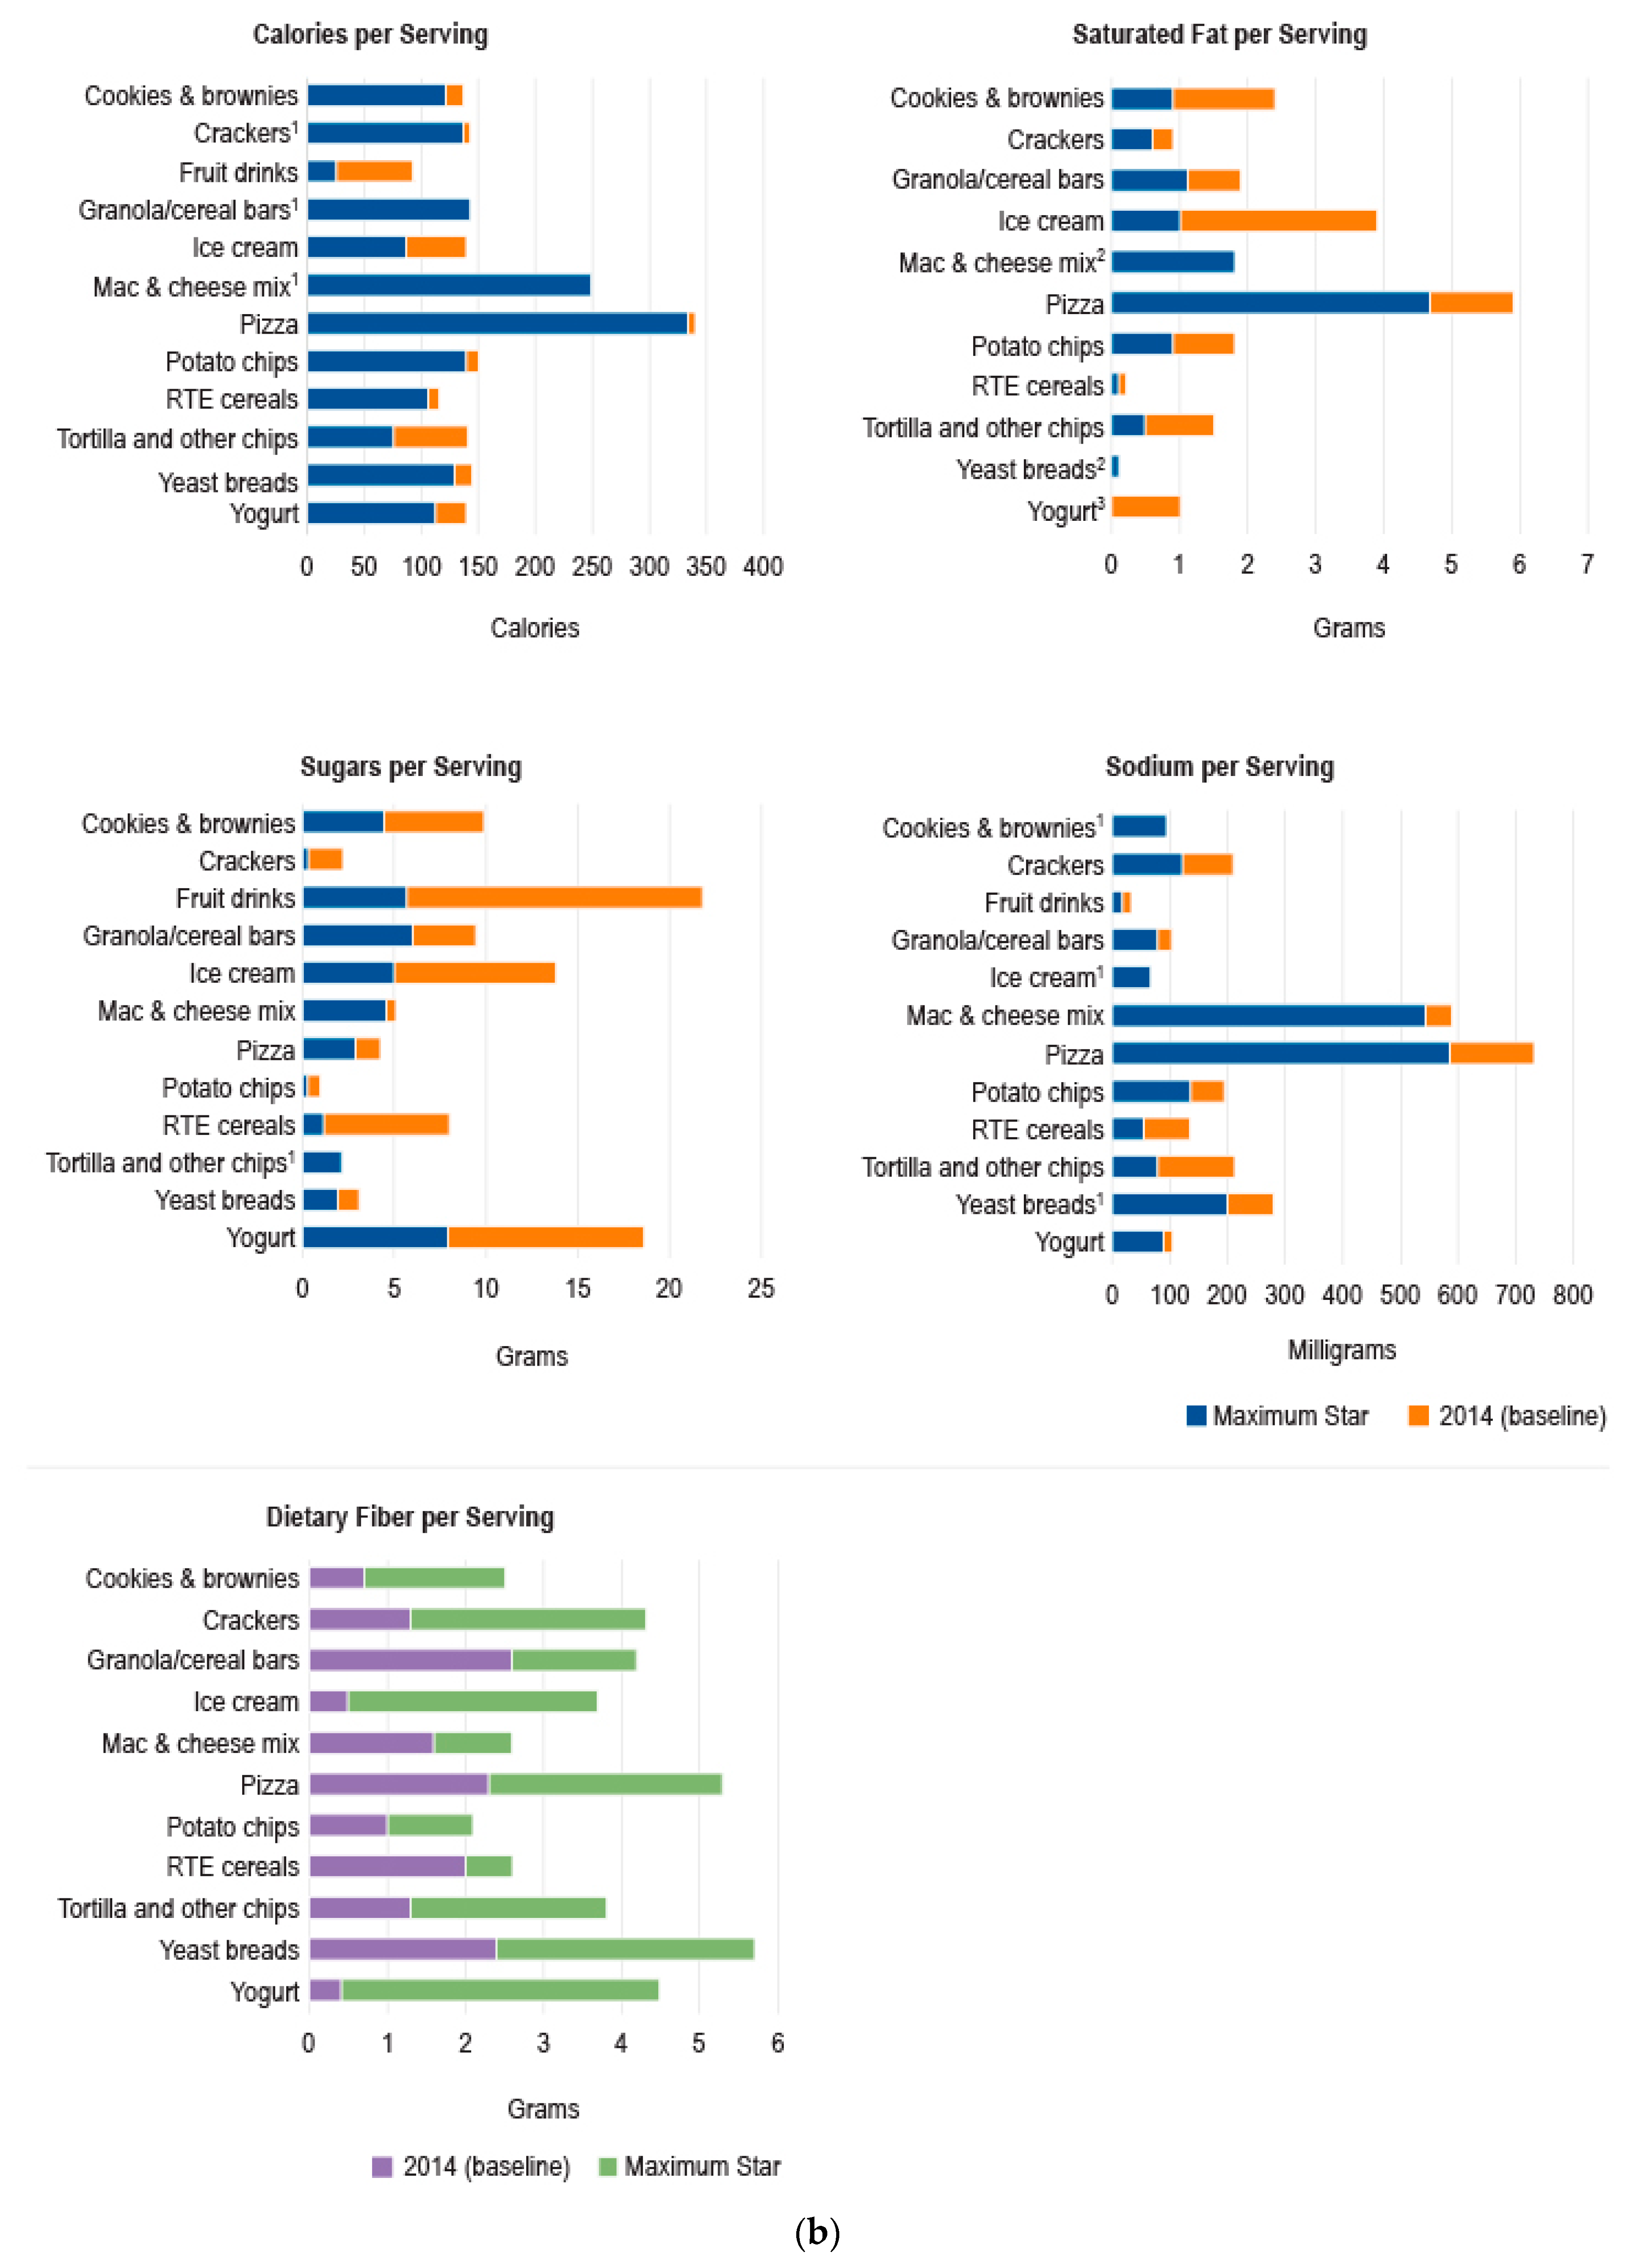
3.1. Changes in Nutrient Levels for Selected Products over Time
3.2. Results of Simulations of Effects of Reformulation
3.3. Results of Average Price Calculations for Healthier versus Less Healthy Products
4. Discussion
5. Conclusions
Supplementary Materials
Author Contributions
Funding
Acknowledgments
Conflicts of Interest
References
- Hales, C.M.; Carroll, M.D.; Fryar, C.D.; Ogden, C.L. Prevalence of Obesity among Adults and Youth: United States, 2015–2016; NCHS Data Brief No. 288; U.S. Department of Health and Human Services, Centers for Disease Control and Prevention: Hyattsville, MD, USA, 2017.
- Dobbs, R.; Sawers, C.; Thompson, F.; Manyika, J.; Woetzel, J.; Child, P.; McKenna, S.; Spatharou, A. Overcoming Obesity: An Initial Economic Analysis; McKinsey Global Institute: New York, NY, USA, 2014. [Google Scholar]
- Hawkes, C.; Smith, T.G.; Jewell, J.; Wardle, J.; Hammond, R.A.; Friel, S.; Thow, A.M.; Kain, J. Smart food policies for obesity prevention. Lancet 2015, 385, 2410–2421. [Google Scholar] [CrossRef]
- Lewin, A.; Lindstrom, L.; Nestle, M. Food industry promises to address childhood obesity: Preliminary evaluation. J. Public Health Policy 2006, 27, 327–348. [Google Scholar] [CrossRef] [PubMed]
- Golan, E.; Mancino, L.; Unnevehr, L. Food Policy: Check the List of Ingredients. Amber Waves. 2009. Available online: https://www.ers.usda.gov/amber-waves/2009/june/food-policy-check-the-list-of-ingredients/ (accessed on 4 February 2019).
- HM Government. Childhood Obesity: A Plan for Action. 2016. Available online: https://www.gov.uk/government/publications/childhood-obesity-a-plan-for-action (accessed on 4 February 2019).
- Crème Global. The FDII/Crème Global Reformulation Project: Estimating the Impact of Reformulation by 14 FDII Members on the Irish Population; Food and Drink Industry Ireland: Dublin, Ireland, 2016. [Google Scholar]
- Muth, M.K.; Bradley, S.R.; Brophy, J.E.; Capogrossi, K.L.; Coglaiti, M.C.; Karns, S.A.; Viator, C.L. 2014 FDA Reformulation Cost Model; U.S. Food and Drug Administration: College Park, MD, USA, 2015.
- Ng, S.W.; Slining, M.M.; Popkin, B.M. The Healthy Weight Commitment Foundation pledge: Calories sold from U.S. consumer packaged goods, 2000–2012. Am. J. Prev. Med. 2014, 47, 520–530. [Google Scholar] [CrossRef] [PubMed]
- Ng, S.W.; Slining, M.M.; Popkin, B.M. The Healthy Weight Commitment Foundation pledge: Calories sold from U.S. consumer packaged goods, 2007–2012. Am. J. Prev. Med. 2014, 47, 508–519. [Google Scholar] [CrossRef] [PubMed]
- Cardello, H.; Wolfson, J. Lower Calorie Foods and Beverages Drive Healthy Weight Commitment Foundation Companies’ Sales Growth: Interim Report; Hudson Institute: Washington, DC, USA, 2013. [Google Scholar]
- Ng, S.W.; Popkin, B.M. Monitoring foods and nutrients sold and consumed in the United States: Dynamics and challenges. J. Acad. Nutr. Diet. 2012, 112, 41–45e44. [Google Scholar] [CrossRef]
- Slining, M.M.; Ng, S.W.; Popkin, B.M. Food companies’ calorie-reduction pledges to improve U.S. diet. Am. J. Prev. Med. 2013, 44, 174–184. [Google Scholar] [CrossRef]
- Cohen, D.A.; Bogart, L.; Castro, G.; Rossi, A.D.; Williamson, S.; Han, B. Beverage marketing in retail outlets and The Balance Calories Initiative. Prev. Med. 2018, 115, 1–7. [Google Scholar] [CrossRef]
- Brinsden, H.C.; He, F.J.; Jenner, K.H.; Macgregor, G.A. Surveys of the salt content in UK bread: Progress made and further reductions possible. BMJ Open 2013, 3, e002936. [Google Scholar] [CrossRef]
- Curtis, C.J.; Clapp, J.; Niederman, S.A.; Ng, S.W.; Angell, S.Y. United States Food Industry Progress During the National Salt Reduction Initiative: 2009–2014. Am. J. Public Health 2016, 106, 1815–1819. [Google Scholar] [CrossRef]
- Eyles, H.; Webster, J.; Jebb, S.; Capelin, C.; Neal, B.; Ni Mhurchu, C. Impact of the UK voluntary sodium reduction targets on the sodium content of processed foods from 2006 to 2011: Analysis of household consumer panel data. Prev. Med. 2013, 57, 555–560. [Google Scholar] [CrossRef]
- Monro, D.; Mhurchu, C.N.; Jiang, Y.; Gorton, D.; Eyles, H. Changes in the sodium content of New Zealand processed foods: 2003–2013. Nutrients 2015, 7, 4054–4067. [Google Scholar] [CrossRef]
- Trevena, H.; Neal, B.; Dunford, E.; Wu, J.H. An evaluation of the effects of the Australian Food and Health Dialogue targets on the sodium content of bread, breakfast cereals and processed meats. Nutrients 2014, 6, 3802–3817. [Google Scholar] [CrossRef]
- Access to Nutrition Foundation (ATNF). Access to Nutrition Index. U.S. Spotlight Index 2018. Available online: https://www.accesstonutrition.org/sites/us18.atnindex.org/files/atnf_us_spotlight_index.2018.pdf (accessed on 31 January 2019).
- Enright, M.; Eskensazi, L. The Children’s Food & Beverage Advertising Initiative Category-Specific Uniform Nutrition Criteria, 2nd ed.; 2018 White Paper; Council of Better Business Bureaus, Inc.: Arlington, VA, USA, 2018. [Google Scholar]
- Food and Drug Administration. Changes to the Nutrition Facts Label. 2016. Available online: https://www.fda.gov/Food/GuidanceRegulation/GuidanceDocumentsRegulatoryInformation/LabelingNutrition/ucm385663.htm (accessed on 4 February 2019).
- Hooker, N.; Downs, S. Trans-border reformulation: U.S. and Canada experiences with trans fat. Int. Food Agribus Man 2014, 17, 131–146. [Google Scholar]
- Mozaffarian, D.; Jacobson, M.F.; Greenstein, J.S. Food reformulations to reduce trans fatty acids. N. Engl. J. Med. 2010, 362, 2037–2039. [Google Scholar] [CrossRef]
- Otite, F.O.; Jacobson, M.F.; Dahmubed, A.; Mozaffarian, D. Trends in trans fatty acids reformulations of US supermarket and brand-name foods from 2007 through 2011. Prev. Chronic Dis. 2013, 10, E85. [Google Scholar] [CrossRef]
- Ricciuto, L.; Lin, K.; Tarasuk, V. A comparison of the fat composition and prices of margarines between 2002 and 2006, when new Canadian labelling regulations came into effect. Public Health Nutr. 2009, 12, 1270–1275. [Google Scholar] [CrossRef]
- Santos, L.; Cruz, R.; Casal, S. Trans fatty acids in commercial cookies and biscuits: An update of Portuguese market. Food Control 2015, 47, 141–146. [Google Scholar] [CrossRef]
- Van Camp, D.; Hooker, N.H.; Lin, C.T. Changes in fat contents of US snack foods in response to mandatory trans fat labelling. Public Health Nutr. 2012, 15, 1130–1137. [Google Scholar] [CrossRef]
- Mancino, L.; Kuchler, F.; Leibtag, E. Getting consumers to eat more whole-grains: the role of policy, information, and food manufacturers. Food Policy 2008, 33, 489–496. [Google Scholar] [CrossRef]
- Campos, S.; Doxey, J.; Hammond, D. Nutrition labels on pre-packaged foods: A systematic review. Public Health Nutr. 2011, 14, 1496–1506. [Google Scholar] [CrossRef]
- Todd, J.E.; Variyam, J.N. The Decline in Consumer Use of Food Nutrition Labels, 1995–2006; Economic Research Report No. 63; Economic Research Service, U.S. Dept. of Agriculture: Washington, DC, USA, August 2008.
- Muth, M.K.; Sweitzer, M.; Brown, D.; Capogrossi, K.; Karns, S.; Levin, D.; Okrent, A.; Siegel, P.; Zhen, C. Understanding IRI Household-Based and Store-Based Scanner Data. 2016. Available online: https://www.ers.usda.gov/publications/pub-details/?pubid=47636 (accessed on 4 February 2019).
- IRI. Private Label: The Journey to Growth along Roads Less Traveled. 2016. Available online: https://www.foodinstitute.com/images/media/iri/TTnov2016.pdf (accessed on 4 February 2019).
- Guiding Stars. Guiding Stars Takes the Guesswork out of Nutritious Shopping. Available online: https://guidingstars.com/what-is-guiding-stars/ (accessed on 8 February 2019).
- Rahkovsky, I.; Lin, B.H.; Lin, C.T.J.; Lee, J.Y. Effects of the Guiding Stars Program on purchases of ready-to-eat cereals with different nutritional attributes. Food Policy 2013, 43, 100–107. [Google Scholar] [CrossRef]
- Kolish, E.D. The Children’s Food & Beverage Advertising Initiative: White Paper on CFBAI’s Uniform Nutrition Criteria; Council of Better Business Bureaus, Inc.: Arlington, VA, USA, 2011. [Google Scholar]
- U.S. Department of Agriculture, Agricultural Research Service. WWEIA Data Tables. 2018. Available online: https://www.ars.usda.gov/northeast-area/beltsville-md-bhnrc/beltsville-human-nutrition-research-center/food-surveys-research-group/docs/wweia-data-tables/ (accessed on 4 February 2019).
- Ahuja, J.K.C.; Pehrsson, P.R.; Cogswell, M. A comparison of concentrations of sodium and related nutrients (potassium, total dietary fiber, total and saturated fat, and total sugar) in private-label and national brands of popular, sodium-contributing, commercially packaged foods in the United States. J. Acad. Nutr. Diet. 2017, 117, 770–777. [Google Scholar] [CrossRef]
- Martinez, S.; Levin, D. An Assessment of Product Turnover in the U.S. Food Industry and Effects on Nutrient Content. 2017. Available online: https://www.ers.usda.gov/webdocs/publications/85761/eib-183.pdf?v=43055 (accessed on 4 February 2019).
- Hashem, K.M.; He, F.J.; MacGregor, G.A. Effects of product reformulation on sugar intake and health-a systematic review and meta-analysis. Nutr. Rev. 2019, 77, 181–196. [Google Scholar] [CrossRef]
- Henney, J.E.; Anderson, C.M.; Angell, S.Y.; Beauchamp, G.K.; Briefel, R.R.; Cohen, M.N.; Mireles Dewitt, C.A.; Drescher, G.; Muth, M.K. Strategies to Reduce Sodium Intake in the United States; Henney, J.E., Taylor, C.L., Boon, C.S., Eds.; The National Academies Press: Washington, DC, USA, 2010. [Google Scholar]
- Food and Drug Administration. Draft Guidance for Industry: Voluntary Sodium Reduction Goals: Target Mean and Upper Bound Concentrations for Sodium in Commercially Processed, Packaged, and Prepared Foods. 2016. Available online: https://www.fda.gov/Food/GuidanceRegulation/GuidanceDocumentsRegulatoryInformation/ucm494732.htm (accessed on 4 February 2019).
- Drewnowski, A. The cost of US foods as related to their nutritive value. Am. J. Clin. Nutr. 2010, 92, 1181–1188. [Google Scholar] [CrossRef]
- Carlson, A.; Frazão, E. Are Healthy Foods Really More Expensive? It Depends on How You Measure the Price; EIB-96; U.S. Department of Agriculture, Economic Research Service: Washington, DC, USA, May 2012.
- Electronic Code of Federal Regulations. Nutrition Labeling of Food. e-CFR §101.9. 2018. Available online: https://www.ecfr.gov/cgi-bin/text-idx?SID=261e338798e509f973247be7be49c3a7&mc=true&node=se21.2.101_19&rgn=div8 (accessed on 4 February 2019).


| Product 1 | Nutrient | Brand Type | No. of Barcodes (2012) | Average Per Standardized Serving Values | |||
|---|---|---|---|---|---|---|---|
| 2012 | 2014 | Difference | p-Value | ||||
| Cereal bars | Saturated fat (grams) | Branded | 2086 | 2.14 | 1.95 | −0.19 | <0.01 |
| Private label | 539 | 1.63 | 1.28 | −0.35 | <0.01 | ||
| Cookies and brownies | Saturated fat (grams) | Branded | 3530 | 2.55 | 2.38 | −0.17 | <0.01 |
| Private label | 1741 | 2.44 | 2.26 | −0.18 | <0.01 | ||
| Crackers | Saturated fat (grams) | Branded | 1934 | 1.10 | 0.95 | −0.15 | <0.01 |
| Private label | 866 | 0.94 | 0.76 | −0.18 | <0.01 | ||
| Lunch combinations 2 | Calories | Branded | 95 | 320.06 | 346.88 | 26.82 | 0.02 |
| Private label | 0 | -- | -- | -- | -- | ||
| Sugar (grams) | Branded | 95 | 17.35 | 19.17 | 1.82 | 0.05 | |
| Private label | 0 | -- | -- | -- | -- | ||
| Dietary fiber (grams) | Branded | 95 | 1.33 | 1.44 | 0.11 | 0.03 | |
| Private label | 0 | -- | -- | -- | -- | ||
| Macaroni and cheese mix | Saturated fat (grams) | Branded | 181 | 2.10 | 1.91 | −0.19 | <0.01 |
| Private label | 310 | 1.82 | 1.67 | −0.15 | <0.01 | ||
| Nut butters | Saturated fat (grams) | Branded | 344 | 2.62 | 2.42 | −0.2 | <0.01 |
| Private label | 394 | 3.17 | 2.92 | −0.25 | <0.01 | ||
| Potato chips | Saturated fat (grams) | Branded | 1,745 | 2.02 | 1.82 | −0.20 | <0.01 |
| Private label | 381 | 2.10 | 1.93 | −0.17 | <0.01 | ||
| RTE cereal | Saturated fat (grams) | Branded | 1403 | 0.33 | 0.24 | −0.09 | <0.01 |
| Private label | 1718 | 0.13 | 0.09 | −0.04 | <0.01 | ||
| Tortilla chips and other chips | Saturated fat (grams) | Branded | 1681 | 1.80 | 1.56 | −0.24 | <0.01 |
| Private label | 375 | 1.33 | 1.15 | −0.18 | <0.01 | ||
| Yeast breads | Saturated fat (grams) | Branded | 1939 | 0.18 | 0.14 | −0.04 | <0.01 |
| Private label | 1290 | 0.16 | 0.13 | −0.03 | <0.01 | ||
| Yogurt | Saturated fat (grams) | Branded | 1030 | 1.46 | 1.38 | −0.08 | <0.01 |
| Private label | 998 | 0.54 | 0.49 | −0.05 | <0.01 | ||
| Dietary fiber (grams) | Branded | 1030 | 0.30 | 0.32 | 0.02 | <0.01 | |
| Nutrient | Product 1 | Average Per Standardized Serving Values | |||
|---|---|---|---|---|---|
| Branded | Private Label | Difference (Private Label − Branded) | p-Value | ||
| Branded Better than Private Label | |||||
| Calories | Frankfurters | 156.42 | 168.09 | 11.67 | <0.01 |
| Fruit drinks | 92.89 | 101.68 | 8.79 | <0.01 | |
| Saturated fat (grams) | Frankfurters | 4.83 | 5.20 | 0.37 | 0.02 |
| Macaroni and cheese (RTE) | 7.06 | 9.50 | 2.44 | 0.04 | |
| Nut butters | 2.47 | 2.89 | 0.42 | <0.01 | |
| Sugar (grams) | Cereal bars | 9.17 | 10.52 | 1.35 | <0.01 |
| Crackers | 2.01 | 2.66 | 0.65 | <0.01 | |
| Frankfurters | 1.03 | 1.49 | 0.46 | <0.01 | |
| Fruit drinks | 21.82 | 25.07 | 3.25 | <0.01 | |
| Sodium (milligrams) | Cookies and brownies | 88.61 | 99.66 | 11.05 | <0.01 |
| Frankfurters | 532.70 | 570.98 | 38.28 | <0.01 | |
| Fruit drinks | 32.59 | 39.71 | 7.12 | <0.01 | |
| Macaroni and cheese mix | 572.18 | 604.93 | 32.75 | <0.01 | |
| Nut butters | 88.58 | 116.08 | 27.50 | <0.01 | |
| RTE cereal | 119.20 | 150.33 | 31.13 | <0.01 | |
| Yeast breads | 270.90 | 290.83 | 19.93 | <0.01 | |
| Yogurt | 89.25 | 96.1 | 6.85 | <0.01 | |
| Dietary fiber (grams) | Cereal bars | 2.64 | 2.36 | −0.28 | <0.01 |
| Cookies and brownies | 0.78 | 0.58 | −0.20 | <0.01 | |
| Crackers | 1.37 | 1.00 | −0.37 | <0.01 | |
| Ice cream | 0.63 | 0.32 | −0.31 | <0.01 | |
| Nut butters | 2.25 | 2.00 | −0.25 | <0.01 | |
| Pizza | 2.38 | 2.05 | −0.33 | <0.01 | |
| Potato chips | 1.04 | 0.98 | −0.06 | <0.01 | |
| RTE cereal | 2.17 | 1.89 | −0.28 | <0.01 | |
| Yeast breads | 2.64 | 2.01 | −0.63 | <0.01 | |
| Private Label Better than Branded | |||||
| Calories | Yogurt | 146.7 | 127.18 | −19.52 | <0.01 |
| Saturated fat (grams) | Cereal bars | 1.96 | 1.41 | −0.55 | <0.01 |
| Crackers | 0.99 | 0.78 | −0.21 | <0.01 | |
| Macaroni and cheese (mix) | 1.88 | 1.64 | −0.24 | 0.04 | |
| Pizza | 6.11 | 5.52 | −0.59 | <0.01 | |
| RTE cereal | 0.28 | 0.08 | −0.20 | <0.01 | |
| Tortilla and other chips | 1.52 | 1.13 | −0.39 | <0.01 | |
| Yogurt | 1.39 | 0.44 | −0.95 | <0.01 | |
| Sugar (grams) | Macaroni and cheese (mix) | 5.04 | 4.39 | −0.65 | <0.01 |
| Pizza | 4.46 | 3.69 | −0.77 | <0.01 | |
| Potato chips | 0.89 | 0.71 | −0.18 | <0.01 | |
| Yogurt | 19.05 | 17.82 | −1.23 | <0.01 | |
| Sodium (milligrams) | Cereal bars | 105.22 | 97.88 | −7.34 | <0.01 |
| Soft drinks | 29.62 | 21.09 | −8.53 | <0.01 | |
| Tortilla and other chips | 220.86 | 171.92 | −48.94 | <0.01 | |
| Calories | Saturated Fat (g) | Sugar (g) | Sodium (mg) | Dietary Fiber (g) | |
|---|---|---|---|---|---|
| NHANES total daily intake 1 | 2079 | 26.3 | 112 | 3409 | 16.3 |
| Baseline amount in purchases (2014) | 220.23 | 2.25 | 12.76 | 265.24 | 2.20 |
| Average amount in 1-star products | 202.35 | 1.09 | 7.47 | 227.89 | 4.00 |
| Change to average 1-star target | −17.88 | −1.16 | −5.29 | −37.35 | 1.80 |
| % change relative to baseline purchases | −8.1% | −51.6% | −41.5% | −14.1% | 81.8% |
| % change relative to NHANES daily intake | −0.9% | −4.4% | −4.7% | −1.1% | 11.0% |
| Average amount in maximum-star products | 137.41 | 0.62 | 3.26 | 143.01 | 4.41 |
| Change to average maximum-star target | −82.83 | −1.63 | −9.49 | −122.23 | 2.21 |
| % change relative to baseline purchases | −37.6% | −72.4% | −74.4% | −46.1% | 100.5% |
| % change relative to NHANES daily intake | −4.0% | −6.2% | −8.5% | −3.6% | 13.6% |
| Household Demographic | Calories | Saturated Fat (g) | Sugar (g) | Sodium (mg) | Dietary Fiber (g) |
|---|---|---|---|---|---|
| Change Using Average 1-Star Targets | |||||
| All | −17.9 | −1.2 | −5.3 | −37.4 | 1.8 |
| Income level: | |||||
| Low income | −18.3 | −1.2 | −5.4 | −36.7 | 1.8 |
| High income | −17.6 | −1.2 | −5.2 | −37.7 | 1.8 |
| Race and ethnicity: | |||||
| Non-Hispanic white | −18.1 | −1.3 | −5.4 | −41.0 | 2.0 |
| Non-Hispanic black | −21.4 | −1.0 | −6.1 | −32.2 | 1.5 |
| Hispanic | −16.4 | −0.9 | −4.9 | −31.1 | 1.5 |
| Asian and other | −14.6 | −1.0 | −4.3 | −28.3 | 1.5 |
| Urban vs. rural: | |||||
| Urban | −18.1 | −1.1 | −5.3 | −36.0 | 1.8 |
| Part urban/rural | −17.6 | −1.2 | −5.2 | −40.0 | 1.9 |
| Rural | −17.2 | −1.3 | −5.2 | −40.5 | 1.9 |
| Change Using Maximum-Star Targets | |||||
| All | −82.8 | −1.6 | −9.5 | −122.2 | 2.2 |
| Income level: | |||||
| Low income | −81.1 | −1.6 | −9.5 | −120.4 | 2.2 |
| High income | −83.9 | −1.7 | −9.5 | −123.4 | 2.2 |
| Race and ethnicity: | |||||
| Non-Hispanic white | −88.6 | −1.8 | −10.0 | −133.4 | 2.4 |
| Non-Hispanic black | −78.8 | −1.4 | −9.7 | −106.1 | 1.8 |
| Hispanic | −71.1 | −1.3 | −8.5 | −102.3 | 1.8 |
| Asian and other | −67.1 | −1.3 | −7.6 | −95.7 | 1.8 |
| Urban vs. rural: | |||||
| Urban | −81.5 | −1.6 | −9.5 | −119.0 | 2.2 |
| Part urban/rural | −85.2 | −1.7 | −9.5 | −128.4 | 2.3 |
| Rural | −87.8 | −1.8 | −9.5 | −131.5 | 2.3 |
| Meets CFBAI Criteria | Does Not Meet CFBAI Criteria | p-Value | ||||||
|---|---|---|---|---|---|---|---|---|
| N | % of Servings for Products with Nutritional Information | $/Serving | N | % of Servings for Products with Nutritional Information | $/Serving | Difference (Meets − Does Not Meet) | ||
| Cereal bars | 166 | 4.3 | $0.62 | 2292 | 95.7 | $0.96 | −$0.34 | <0.0001 |
| Private label | 35 | 10.6 | $0.44 | 311 | 89.4 | $0.37 | $0.07 | 0.0007 |
| Crackers | 202 | 8.6 | $0.43 | 2281 | 91.4 | $0.36 | $0.07 | 0.0002 |
| Tortilla and other chips | 125 | 1.5 | $0.47 | 1783 | 98.5 | $0.35 | $0.12 | <0.0001 |
| RTE cereal | 342 | 13.3 | $0.28 | 2401 | 86.7 | $0.29 | −$0.01 | 0.8199 |
| Private label | 122 | 14.2 | $0.18 | 1121 | 85.8 | $0.21 | −$0.03 | <0.0001 |
| Yeast bread | 558 | 15.7 | $0.28 | 2521 | 84.3 | $0.25 | $0.03 | 0.0594 |
| Yogurt | 1126 | 60.6 | $0.82 | 797 | 39.4 | $0.76 | $0.06 | <0.0001 |
© 2019 by the authors. Licensee MDPI, Basel, Switzerland. This article is an open access article distributed under the terms and conditions of the Creative Commons Attribution (CC BY) license (http://creativecommons.org/licenses/by/4.0/).
Share and Cite
Muth, M.K.; Karns, S.A.; Mancino, L.; Todd, J.E. How Much Can Product Reformulation Improve Diet Quality in Households with Children and Adolescents? Nutrients 2019, 11, 618. https://doi.org/10.3390/nu11030618
Muth MK, Karns SA, Mancino L, Todd JE. How Much Can Product Reformulation Improve Diet Quality in Households with Children and Adolescents? Nutrients. 2019; 11(3):618. https://doi.org/10.3390/nu11030618
Chicago/Turabian StyleMuth, Mary K., Shawn A. Karns, Lisa Mancino, and Jessica E. Todd. 2019. "How Much Can Product Reformulation Improve Diet Quality in Households with Children and Adolescents?" Nutrients 11, no. 3: 618. https://doi.org/10.3390/nu11030618
APA StyleMuth, M. K., Karns, S. A., Mancino, L., & Todd, J. E. (2019). How Much Can Product Reformulation Improve Diet Quality in Households with Children and Adolescents? Nutrients, 11(3), 618. https://doi.org/10.3390/nu11030618


