Dietary Carbohydrates and Insulin Resistance in Adolescents from Marginalized Areas of Chiapas, México

 , , ,
, , ,
Abstract
1. Introduction
2. Materials and Methods
2.1. Study Design
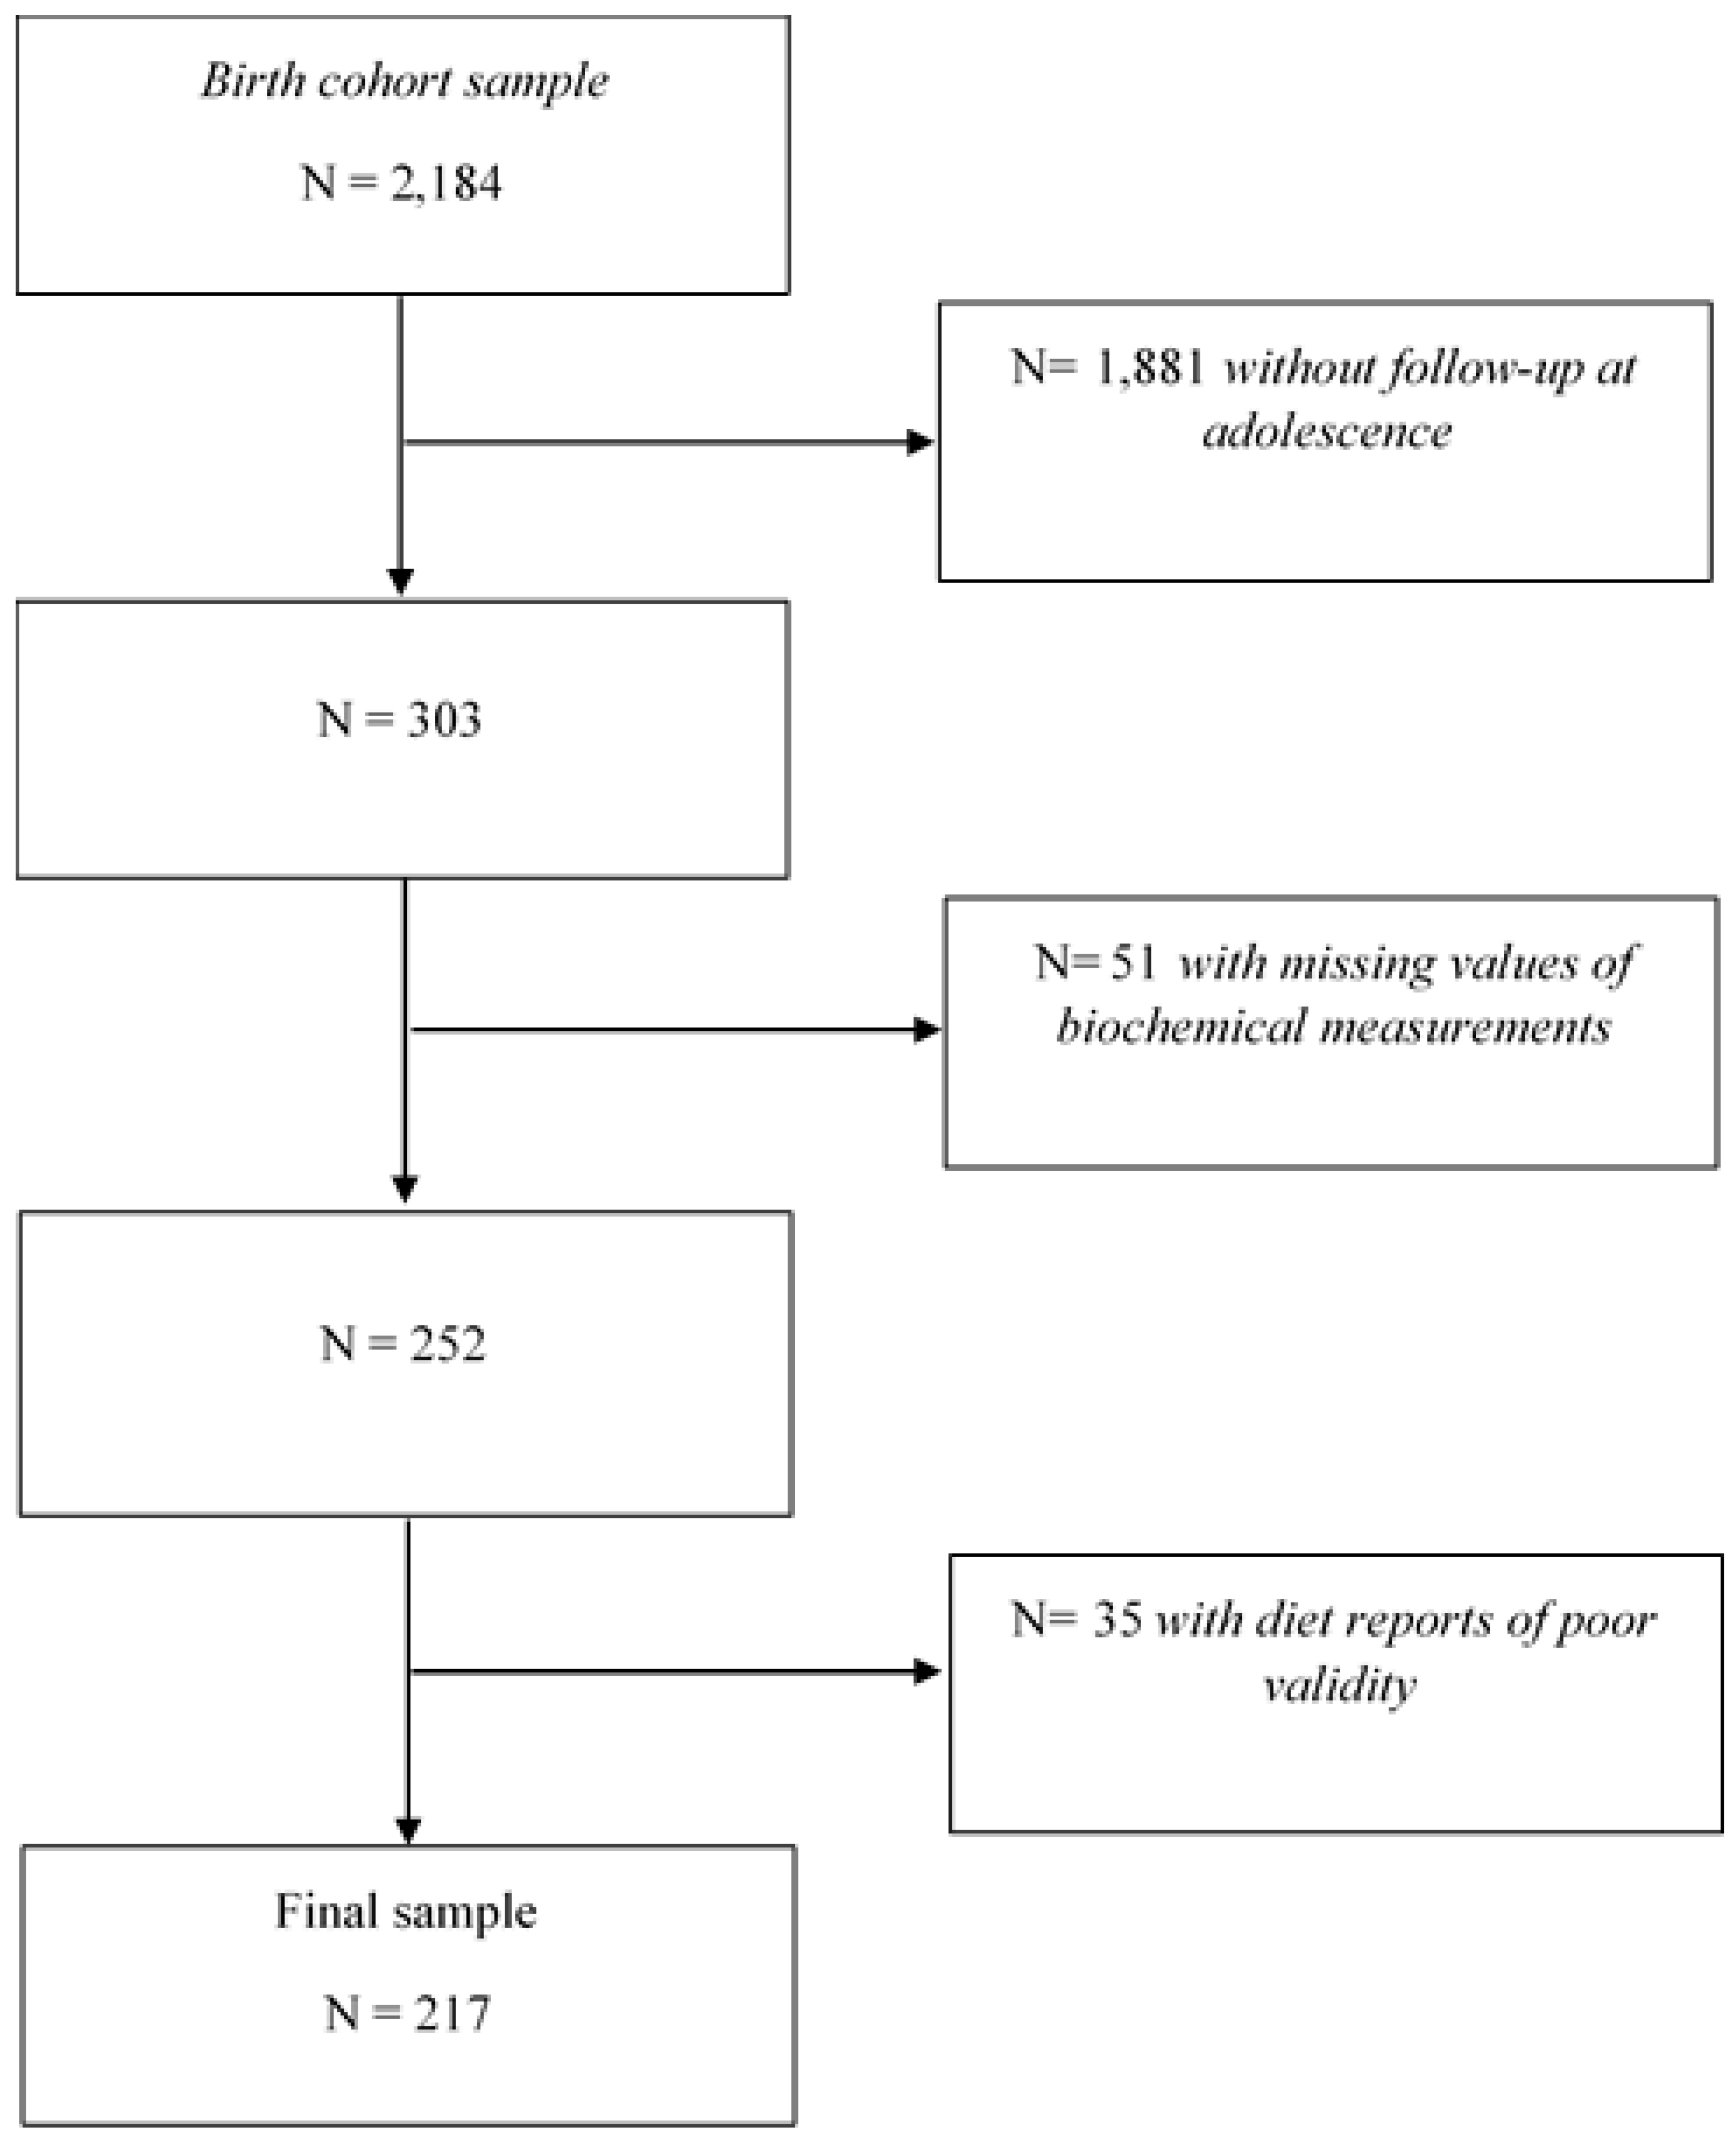
2.2. Study Population
2.3. Dietary Assessment
2.4. Dietary GI and GL Estimation
2.5. Sociodemographic Data
2.6. Biochemical Parameters
2.7. Anthropometric Measurements
2.8. Statistical Analysis
3. Results
4. Discussion
Supplementary Materials
Author Contributions
Funding
Acknowledgments
Conflicts of Interest
References
- Kahn, B.B.; Flier, J.S. Obesity and insulin resistance. J. Clin. Investig. 2000, 106, 473–481. [Google Scholar] [CrossRef] [PubMed]
- Ludwig, D.S.; Pereira, M.A.; Kroenke, C.H.; Hilner, J.E.; Van Horn, L.; Slattery, M.L.; Jacobs, D.R. Dietary fiber, weight gain, and cardiovascular disease risk factors in young adults. JAMA 1999, 282, 1539–1546. [Google Scholar] [CrossRef] [PubMed]
- Steffen, L.M.; Jacobs, D.R.; Murtaugh, M.A.; Moran, A.; Steinberger, J.; Hong, C.P.; Sinaiko, A.R. Whole grain intake is associated with lower body mass and greater insulin sensitivity among adolescents. Am. J. Epidemiol. 2003, 158, 243–250. [Google Scholar] [CrossRef] [PubMed]
- Kynde, I.; Johnsen, N.F.; Wedderkopp, N.; Bygbjerg, I.B.; Helge, J.W.; Heitmann, B.L. Intake of total dietary sugar and fibre is associated with insulin resistance among Danish 8–10 and 14–16-year-old girls but not boys. European Youth Heart Studies I and II. Public Health Nutr. 2010, 13, 1669–1674. [Google Scholar] [CrossRef]
- Stanhope, K.L. Sugar consumption, metabolic disease and obesity: The state of the controversy. Crit. Rev. Clin. Lab. Sci. 2016, 53, 52–67. [Google Scholar] [CrossRef]
- Aziz, A. The glycemic index: Methodological aspects related to the interpretation of health effects and to regulatory labeling. J. AOAC Int. 2009, 92, 879–887. [Google Scholar]
- Jenkins, D.J.; Wolever, T.M.; Taylor, R.H.; Barker, H.; Fielden, H.; Baldwin, J.M.; Bowling, A.C.; Newman, H.C.; Jenkins, A.L.; Goff, D.V. Glycemic index of foods: A physiological basis for carbohydrate exchange. Am. J. Clin. Nutr. 1981, 34, 362–366. [Google Scholar] [CrossRef]
- Salmerón, J.; Ascherio, A.; Rimm, E.B.; Colditz, G.A.; Spiegelman, D.; Jenkins, D.J.; Stampfer, M.J.; Wing, A.L.; Willett, W.C. Dietary fiber, glycemic load, and risk of NIDDM in men. Diabetes Care 1997, 20, 545–550. [Google Scholar] [CrossRef]
- Livesey, G.; Taylor, R.; Livesey, H.F.; Buyken, A.E.; Jenkins, D.J.A.; Augustin, L.S.A.; Sievenpiper, J.L.; Barclay, A.W.; Liu, S.; Wolever, T.M.S.; et al. Dietary Glycemic Index and Load and the Risk of Type 2 Diabetes: A Systematic Review and Updated Meta-Analyses of Prospective Cohort Studies. Nutrients 2019, 11, 1280. [Google Scholar] [CrossRef]
- Goletzke, J.; Herder, C.; Joslowski, G.; Bolzenius, K.; Remer, T.; Wudy, S.A.; Roden, M.; Rathmann, W.; Buyken, A.E. Habitually higher dietary glycemic index during puberty is prospectively related to increased risk markers of type 2 diabetes in younger adulthood. Diabetes Care 2013, 36, 1870–1876. [Google Scholar] [CrossRef]
- Schwingshackl, L.; Hobl, L.P.; Hoffmann, G. Effects of low glycaemic index/low glycaemic load vs. high glycaemic index/ high glycaemic load diets on overweight/obesity and associated risk factors in children and adolescents: A systematic review and meta-analysis. Nutr. J. 2015, 14, 87. [Google Scholar] [CrossRef] [PubMed]
- Jiménez-Cruz, A.; Velasco-Martínez, R.M.; Bacardí-Gascón, M.; Higuera-Domínguez, F.; Domínguez de la Piedra, E. HOMA-IR, síndrome metabólico y hábitos dietéticos en adolescentes de Chiapas, México. Rev. Biomed. 2009, 20, 82–88. [Google Scholar]
- Flores-Guillén, E.; Ochoa-Díaz-López, H.; Castro-Quezada, I.; Irecta-Nájera, C.A.; Cruz, M.; Meneses, M.E.; Gurri, F.D.; Solís-Hernández, R.; García-Miranda, R. Intrauterine growth restriction and overweight, obesity, and stunting in adolescents of indigenous communities of Chiapas, México. Eur. J. Clin. Nutr. 2019. [Google Scholar] [CrossRef] [PubMed]
- Ramirez-Ortiz, M.A.; Rodriguez-Almaraz, M.; Ochoa-Diazlopez, H.; Diaz-Prieto, P.; Rodriguez-Suárez, R.S. Randomised equivalency trial comparing 2.5% povidone-iodine eye drops and ophthalmic chloramphenicol for preventing neonatal conjunctivitis in a trachoma endemic area in southern México. Br. J. Ophthalmol. 2007, 91, 1430–1434. [Google Scholar] [CrossRef]
- Black, A.E. Critical evaluation of energy intake using the Goldberg cut-off for energy intake: Basal metabolic rate. A practical guide to its calculation, use and limitations. Nternational J. Obes. 2000, 24, 1119–1130. [Google Scholar] [CrossRef]
- Goldberg, G.R.; Black, A.E.; Jebb, S.A.; Cole, T.J.; Murgatroyd, P.R.; Coward, W.A.; Prentice, A.M. Critical evaluation of energy intake data using fundamental principles of energy physiology: 1. Derivation of cut-off limits to identify under-recording. Eur. J. Clin. Nutr. 1991, 45, 569–581. [Google Scholar]
- Institute of Medicine. Dietary Reference Intakes for Energy, Carbohydrate, Fiber, Fat, Fatty Acids, Cholesterol, Protein, and Amino Acids; The National Academies Press: Washington, DC, USA, 2005; p. 1358. [Google Scholar]
- Murakami, K.; Livingstone, M.B. Prevalence and characteristics of misreporting of energy intake in US children and adolescents: National Health and Nutrition Examination Survey (NHANES) 2003–2012. Br. J. Nutr. 2016, 115, 294–304. [Google Scholar] [CrossRef]
- Chávez Villasana, A.; Muñoz, M. Tablas de uso Práctico de los Alimentos de Mayor Consumo, 3rd ed.; McGraw Hill: Ciudad de México, México, 2014; p. 420. [Google Scholar]
- Red PI-DIETA. Base de Alimentos de México (BAM). Available online: http://kin.insp.mx/aplicaciones/Redpidieta (accessed on 3 March 2019).
- USDA. National Nutrient Database for Standard Reference, Release 28. Available online: https://ndb.nal.usda.gov/ (accessed on 10 May 2019).
- Louie, J.C.; Flood, V.; Turner, N.; Everingham, C.; Gwynn, J. Methodology for adding glycemic index values to 24-hour recalls. Nutrition 2011, 27, 59–64. [Google Scholar] [CrossRef]
- Pardo-Buitimea, N.Y.; Bacardí-Gascón, M.; Castañeda-González, L.; Jiménez-Cruz, A. Glycaemic index and glycaemic load of three traditional Mexican dishes. Int. J. Food Sci. Nutr. 2012, 63, 114–116. [Google Scholar] [CrossRef]
- Bacardi-Gascon, M.; Dueñas-Mena, D.; Jimenez-Cruz, A. Lowering effect on postprandial glycemic response of nopales added to Mexican breakfasts. Diabetes Care 2007, 30, 1264–1265. [Google Scholar] [CrossRef][Green Version]
- Atkinson, F.S.; Foster-Powell, K.; Brand-Miller, J.C. International tables of glycemic index and glycemic load values: 2008. Diabetes Care 2008, 31, 2281–2283. [Google Scholar] [CrossRef] [PubMed]
- Wolever, T.M.; Yang, M.; Zeng, X.Y.; Atkinson, F.; Brand-Miller, J.C. Food glycemic index, as given in glycemic index tables, is a significant determinant of glycemic responses elicited by composite breakfast meals. Am. J. Clin. Nutr. 2006, 83, 1306–1312. [Google Scholar] [CrossRef] [PubMed]
- Piña-Aguero, M.I.; Zaldivar-Delgado, A.; Salas-Fernández, A.; Martínez-Basila, A.; Bernabe-Garcia, M.; Maldonado-Hernández, J. Optimal Cut-off Points of Fasting and Post-Glucose Stimulus Surrogates of Insulin Resistance as Predictors of Metabolic Syndrome in Adolescents According to Several Definitions. J. Clin. Res. Pediatr. Endocrinol. 2018, 10, 139–146. [Google Scholar] [CrossRef] [PubMed]
- Matthews, D.R.; Hosker, J.P.; Rudenski, A.S.; Naylor, B.A.; Treacher, D.F.; Turner, R.C. Homeostasis model assessment: Insulin resistance and beta-cell function from fasting plasma glucose and insulin concentrations in man. Diabetologia 1985, 28, 412–419. [Google Scholar] [CrossRef]
- Keskin, M.; Kurtoglu, S.; Kendirci, M.; Atabek, M.E.; Yazici, C. Homeostasis model assessment is more reliable than the fasting glucose/insulin ratio and quantitative insulin sensitivity check index for assessing insulin resistance among obese children and adolescents. Pediatrics 2005, 115, e500–e503. [Google Scholar] [CrossRef]
- World Health Organization. WHO AnthroPlus Software for Assessing Growth of the World’s Children and Adolescents. Available online: http://www.who.int/growthref/tools/en/ (accessed on 20 May 2019).
- Williams, D.P.; Going, S.B.; Lohman, T.G.; Harsha, D.W.; Srinivasan, S.R.; Webber, L.S.; Berenson, G.S. Body fatness and risk for elevated blood pressure, total cholesterol, and serum lipoprotein ratios in children and adolescents. Am. J. Public Health 1992, 82, 358–363. [Google Scholar] [CrossRef]
- Zimmet, P.; Alberti, K.G.; Kaufman, F.; Tajima, N.; Silink, M.; Arslanian, S.; Wong, G.; Bennett, P.; Shaw, J.; Caprio, S.; et al. The metabolic syndrome in children and adolescents—an IDF consensus report. Pediatr. Diabetes 2007, 8, 299–306. [Google Scholar] [CrossRef]
- López-González, D.; Miranda-Lora, A.; Klünder-Klünder, M.; Queipo-García, G.; Bustos-Esquivel, M.; Paez-Villa, M.; Villanueva-Ortega, E.; Chávez-Requena, I.; Laresgoiti-Servitje, E.; Garibay-Nieto, N. Diagnostic performance of waist circumference measurements for predicting cardiometabolic risk in Mexican children. Endocr. Pract. 2016, 22, 1170–1176. [Google Scholar] [CrossRef]
- Marfell-Jones, M.J.; Stewart, A.D.; De Ridder, J.H. International Standards for Anthropometric Assessment, 3rd ed.; International Society for the Advancement of Kinanthropometry: Lower Hutt, New Zealand, 2012. [Google Scholar]
- Willett, W.C.; Howe, G.R.; Kushi, L.H. Adjustment for total energy intake in epidemiologic studies. Am. J. Clin. Nutr. 1997, 65, 1220S–1228S. [Google Scholar] [CrossRef]
- Aradillas-García, C.; Rodríguez-Morán, M.; Garay-Sevilla, M.E.; Malacara, J.M.; Rascon-Pacheco, R.A.; Guerrero-Romero, F. Distribution of the homeostasis model assessment of insulin resistance in Mexican children and adolescents. Eur. J. Endocrinol. 2012, 166, 301–306. [Google Scholar] [CrossRef]
- González-Zavala, M.A.; Velasco-Morales, A.; Terrazas-Flores, J.J.; de la Cruz-Galicia, M.G.; Cepeda-Nieto, A.C.; Hernández-del Río, A. Levels of insulin and HOMA-IR in adolescents in Saltillo, Coahuila, México. Med. Univ. 2015, 17, 80–87. [Google Scholar] [CrossRef]
- Velasco-Martinez, R.M.; Jimenez-Cruz, A.; Higuera Dominguez, F.; Dominguez de la Piedra, E.; Bacardi-Gascon, M. [Obesity and insulin resistance among adolescents from Chiapas]. Nutr. Hosp. 2009, 24, 187–192. [Google Scholar] [PubMed]
- Dong, Y.; Chen, L.; Gutin, B.; Zhu, H. Total, insoluble, and soluble dietary fiber intake and insulin resistance and blood pressure in adolescents. Eur. J. Clin. Nutr. 2019, 73, 1172–1178. [Google Scholar] [CrossRef] [PubMed]
- White, J.; Jago, R.; Thompson, J.L. Dietary risk factors for the development of insulin resistance in adolescent girls: A 3-year prospective study. Public Health Nutr. 2014, 17, 361–368. [Google Scholar] [CrossRef] [PubMed]
- Henderson, M.; Benedetti, A.; Gray-Donald, K. Dietary composition and its associations with insulin sensitivity and insulin secretion in youth. Br. J. Nutr. 2014, 111, 527–534. [Google Scholar] [CrossRef]
- Lin, Y.; Huybrechts, I.; Vereecken, C.; Mouratidou, T.; Valtueña, J.; Kersting, M.; González-Gross, M.; Bolca, S.; Wärnberg, J.; Cuenca-García, M.; et al. Dietary fiber intake and its association with indicators of adiposity and serum biomarkers in European adolescents: The HELENA study. Eur. J. Nutr. 2015, 54, 771–782. [Google Scholar] [CrossRef]
- López-Olmedo, N.; Carriquiry, A.L.; Rodríguez-Ramírez, S.; Ramírez-Silva, I.; Espinosa-Montero, J.; Hernández-Barrera, L.; Campirano, F.; Martínez-Tapia, B.; Rivera, J.A. Usual Intake of Added Sugars and Saturated Fats Is High while Dietary Fiber Is Low in the Mexican Population. J. Nutr. 2016, 146, 1856S–1865S. [Google Scholar] [CrossRef]
- Bozzetto, L.; Costabile, G.; Della Pepa, G.; Ciciola, P.; Vetrani, C.; Vitale, M.; Rivellese, A.A.; Annuzzi, G. Dietary Fibre as a Unifying Remedy for the Whole Spectrum of Obesity-Associated Cardiovascular Risk. Nutrients 2018, 10, 943. [Google Scholar] [CrossRef]
- Fukagawa, N.K.; Anderson, J.W.; Hageman, G.; Young, V.R.; Minaker, K.L. High-carbohydrate, high-fiber diets increase peripheral insulin sensitivity in healthy young and old adults. Am. J. Clin. Nutr. 1990, 52, 524–528. [Google Scholar] [CrossRef]
- Cani, P.D.; Lecourt, E.; Dewulf, E.M.; Sohet, F.M.; Pachikian, B.D.; Naslain, D.; De Backer, F.; Neyrinck, A.M.; Delzenne, N.M. Gut microbiota fermentation of prebiotics increases satietogenic and incretin gut peptide production with consequences for appetite sensation and glucose response after a meal. Am. J. Clin. Nutr. 2009, 90, 1236–1243. [Google Scholar] [CrossRef]
- Cani, P.D.; Amar, J.; Iglesias, M.A.; Poggi, M.; Knauf, C.; Bastelica, D.; Neyrinck, A.M.; Fava, F.; Tuohy, K.M.; Chabo, C.; et al. Metabolic endotoxemia initiates obesity and insulin resistance. Diabetes 2007, 56, 1761–1772. [Google Scholar] [CrossRef] [PubMed]
- Davis, J.N.; Alexander, K.E.; Ventura, E.E.; Kelly, L.A.; Lane, C.J.; Byrd-Williams, C.E.; Toledo-Corral, C.M.; Roberts, C.K.; Spruijt-Metz, D.; Weigensberg, M.J.; et al. Associations of dietary sugar and glycemic index with adiposity and insulin dynamics in overweight Latino youth. Am. J. Clin. Nutr. 2007, 86, 1331–1338. [Google Scholar] [CrossRef] [PubMed]
- Sunehag, A.L.; Toffolo, G.; Treuth, M.S.; Butte, N.F.; Cobelli, C.; Bier, D.M.; Haymond, M.W. Effects of dietary macronutrient content on glucose metabolism in children. J. Clin. Endocrinol. Metab. 2002, 87, 5168–5178. [Google Scholar] [CrossRef] [PubMed]
- Sunehag, A.L.; Toffolo, G.; Campioni, M.; Bier, D.M.; Haymond, M.W. Effects of dietary macronutrient intake on insulin sensitivity and secretion and glucose and lipid metabolism in healthy, obese adolescents. J. Clin. Endocrinol. Metab. 2005, 90, 4496–4502. [Google Scholar] [CrossRef] [PubMed]
- Heden, T.D.; Liu, Y.; Park, Y.M.; Nyhoff, L.M.; Winn, N.C.; Kanaley, J.A. Moderate amounts of fructose- or glucose-sweetened beverages do not differentially alter metabolic health in male and female adolescents. Am. J. Clin. Nutr. 2014, 100, 796–805. [Google Scholar] [CrossRef] [PubMed]
- Schwarz, J.M.; Noworolski, S.M.; Erkin-Cakmak, A.; Korn, N.J.; Wen, M.J.; Tai, V.W.; Jones, G.M.; Palii, S.P.; Velasco-Alin, M.; Pan, K.; et al. Effects of Dietary Fructose Restriction on Liver Fat, De Novo Lipogenesis, and Insulin Kinetics in Children with Obesity. Gastroenterology 2017, 153, 743–752. [Google Scholar] [CrossRef]
- Salvador Castell, G.; Serra-Majem, L.; Ribas-Barba, L. What and how much do we eat? 24-hour dietary recall method. Nutr. Hosp. 2015, 31, 46–48. [Google Scholar] [CrossRef]
- Castro-Quezada, I.; Ruano-Rodríguez, C.; Ribas-Barba, L.; Serra-Majem, L. Misreporting in nutritional surveys: Methodological implications. Nutr. Hosp. 2015, 31, 119–127. [Google Scholar] [CrossRef]
- Mendez, M.A.; Popkin, B.M.; Buckland, G.; Schroder, H.; Amiano, P.; Barricarte, A.; Huerta, J.M.; Quirós, J.R.; Sánchez, M.J.; González, C.A. Alternative methods of accounting for underreporting and overreporting when measuring dietary intake-obesity relations. Am. J. Epidemiol. 2011, 173, 448–458. [Google Scholar] [CrossRef]
- Bird, S.R.; Hawley, J.A. Update on the effects of physical activity on insulin sensitivity in humans. BMJ Open Sport Exerc. Med. 2017, 2, e000143. [Google Scholar] [CrossRef]
- Goran, M.I.; Gower, B.A. Longitudinal study on pubertal insulin resistance. Diabetes 2001, 50, 2444–2450. [Google Scholar] [CrossRef] [PubMed]


| Variables | Energy-Adjusted Dietary Fiber Intake | p-Value b | |||
|---|---|---|---|---|---|
| T1 | T2 | T3 | Total | ||
| n = 73 | n = 72 | n = 72 | n = 217 | ||
| Demographic Characteristics | |||||
| Sex (% female) | 57.5 | 52.8 | 36.1 | 48.9 | 0.026 |
| Age (years) c | 14.1 (13.9–14.2) | 14.1 (14.0–14.3) | 14.2 (14.0–14.4) | 14.1 (14.0–14.3) | 0.004 d |
| Geographic area (%) | <0.001 | ||||
| Urban | 93.2 | 81.9 | 51.4 | 75.6 | |
| Rural | 6.9 | 18.1 | 48.6 | 24.4 | |
| Region (%) | 0.034 | ||||
| Altos | 74.0 | 72.2 | 55.6 | 67.3 | |
| Selva | 26.0 | 27.8 | 44.4 | 32.7 | |
| Mother’s education level (%) | <0.001 | ||||
| Illiterate | 21.7 | 35.2 | 55.7 | 37.6 | |
| Elementary school | 14.5 | 25.4 | 21.4 | 20.5 | |
| Middle school | 39.1 | 25.4 | 20.0 | 28.1 | |
| High school | 13.0 | 9.9 | 1.4 | 8.1 | |
| Bachelor’s degree | 11.6 | 4.2 | 1.4 | 5.7 | |
| Mother’s language (%) | <0.001 | ||||
| Spanish | 76.7 | 50.0 | 30.6 | 52.5 | |
| Indigenous (Mayan) | 17.8 | 48.6 | 66.7 | 44.2 | |
| No data available | 5.5 | 1.4 | 2.8 | 3.2 | |
| Family history of diabetes (%) | 54.8 | 45.8 | 37.5 | 46.1 | 0.153 |
| Family history of obesity (%) | 27.8 | 20.8 | 19.4 | 22.7 | 0.441 |
| Weight status (%) | 0.029 | ||||
| Underweight | 1.4 | 1.4 | 0.0 | 0.9 | |
| Normal weight | 58.9 | 75.0 | 83.3 | 72.4 | |
| Overweight | 31.5 | 18.1 | 16.7 | 22.1 | |
| Obesity | 8.2 | 5.6 | 0.0 | 4.6 | |
| Waist circumference (cm) | 73.0 (68.0–79.0) | 71.0 (66.0–75.3) | 72.0 (69.0–75.0) | 72.0 (68.0–77.0) | 0.160 d |
| Abdominal obesity (%) | 19.2 | 12.5 | 9.7 | 13.8 | 0.237 |
| % Body fat | 24.8 (18.9–30.2) | 24.3 (14.2–29.3) | 19.8 (14.1–24.9) | 22.8 (15.0–28.4) | 0.002 d |
| Body fat excess (%) | 31.5 | 22.2 | 8.3 | 20.7 | 0.002 |
| WHtR (units) | 0.5 (0.4–0.5) | 0.5 (0.4–0.5) | 0.5 (0.5–0.5) | 0.5 (0.4–0.5) | 0.116 d |
| High WHtR (>0.5 units) (%) | 27.4 | 25.0 | 27.8 | 26.7 | 0.920 |
| Dietary Intake | |||||
| Energy intake (kcal/day) | 2139 (1970–2566) | 2119 (1672–2610) | 2069 (1759–2668) | 2128 (1782–2588) | 0.454 d |
| Total carbohydrates (g/day) e | 307.8 (45.3) | 329.3 (40.5) | 368.8 (42.5) | 335.2 (49.6) | <0.001 |
| Total carbohydrates (% energy) | 55.6 (8.7) | 59.7 (7.8) | 67.2 (8.1) | 60.8 (9.5) | <0.001 |
| Protein (g/day) c,e | 64.9 (51.1–78.5) | 71.9 (61.5–86.0) | 69.7 (60.6–79.9) | 69.5 (58.7–82.7) | 0.089 d |
| Protein (% energy) | 11.7 (9.4–15.0) | 13.1 (11.1–15.0) | 12.8 (10.8–14.4) | 12.6 (10.6–14.6) | 0.117 d |
| Total fat (g/day) e | 81.2 (19.4) | 69.0 (14.2) | 53.3 (18.1) | 67.9 (20.8) | <0.001 |
| Total fat (% energy) | 33.0 (8.2) | 28.0 (6.1) | 21.0 (7.8) | 27.4 (8.9) | <0.001 |
| MUFAs (g/day) e | 25.9 (7.9) | 22.6 (7.1) | 16.1 (7.4) | 21.5 (8.5) | <0.001 |
| PUFAs (g/day) c,e | 14.8 (10.4–19.7) | 11.5 (9.4–15.0) | 10.7 (6.9–14.7) | 11.9 (8.9–17.2) | <0.001 d |
| SFAs (g/day) e | 27.9 (9.2) | 22.4 (6.6) | 16.7 (8.8) | 22.4 (9.4) | <0.001 |
| Dietary fiber (g/day) c,e | 18.7 (16.2–20.3) | 26.6 (25.0–29.7) | 38.1 (34.3–43.8) | 26.6 (20.3–34.3) | <0.001 d |
| Total sugars (g/day) c,e | 110.8 (69.0–142.0) | 82.7 (66.6–95.0) | 60.1 (37.3–76.3) | 79.1 (55.4–103.6) | <0.001 d |
| Dietary GI (g/day) c | 53.5 (50.5–56.8) | 51.5 (49.1–54.4) | 48.3 (46.2–51.4) | 51.2 (47.7–54.3) | <0.001 d |
| Dietary GL (g/day) e | 162.6 (29.7) | 169.5 (29.0) | 178.2 (25.0) | 170.1 (28.6) | 0.004 |
| Variables | n | Parameters | |||||
|---|---|---|---|---|---|---|---|
| Fasting Serum Glucose (mg/dL) a | Fasting Serum Insulin (μU/mL) a | HOMA-IR (Units) a | HOMA-IR > 3.16 (%) | HOMA-IR > 2.97 (%) | Fasting Serum Insulin ≥ 14.38 μU/mL (%) | ||
| Total Sample | 217 | 83.0 (80.0–88.0) | 9.1 (1.0–13.6) | 1.8 (0.2–2.8) | 21.2 | 23.0 | 21.7 |
| Total Carbohydrates b | |||||||
| T1 | 73 | 84.0 (80.0–87.0) | 9.7 (1.0–15.8) | 2.1 (0.2–3.4) | 27.4 | 27.4 | 27.4 |
| T2 | 72 | 83.0 (77.8–87.5) | 6.1 (1.0–13.1) | 1.3 (0.2–2.8) | 22.2 | 23.6 | 23.6 |
| T3 | 72 | 84.0 (79.5–89.0) | 9.3 (4.0–12.5) | 1.9 (0.8–2.6) | 13.9 | 18.1 | 13.9 |
| p-value c | 0.675 | 0.189 | 0.194 | 0.133 | 0.406 | 0.126 | |
| Dietary Fiber b | |||||||
| T1 | 73 | 85.0 (80.0–89.0) | 10.1 (1.0–18.7) | 2.2 (0.2–4.4) | 34.3 | 34.3 | 35.6 |
| T2 | 72 | 84.0 (80.0–88.5) | 5.6 (1.0–12.7) | 1.1 (0.2–2.8) | 19.4 | 23.6 | 20.8 |
| T3 | 72 | 82.3 (78.0–87.0) | 8.7 (3.2–12.2) | 1.8 (0.6–2.5) | 9.7 | 11.1 | 8.3 |
| p-value c | 0.191 | 0.045 | 0.046 | 0.001 | 0.004 | <0.001 | |
| Total Sugars b | |||||||
| T1 | 73 | 83.0 (81.0–88.0) | 10.4 (1.0–13.6) | 2.1 (0.2–2.8) | 21.9 | 23.3 | 21.9 |
| T2 | 72 | 83.0 (78.5–87.0) | 5.6 (1.0–10.6) | 1.1 (0.2–2.2) | 13.9 | 13.9 | 12.5 |
| T3 | 72 | 83.0 (79.0–89.5) | 9.6 (1.0–17.6) | 2.1 (0.2–3.6) | 27.8 | 31.9 | 30.6 |
| p-value c | 0.543 | 0.009 | 0.008 | 0.123 | 0.036 | 0.031 | |
| Dietary GI | |||||||
| T1 | 73 | 82.0 (79.0–85.0) | 9.1 (1.0–12.3) | 1.8 (0.2–2.5) | 15.1 | 15.1 | 15.1 |
| T2 | 72 | 84.0 (77.0–89.5) | 7.7 (1.0–13.4) | 1.5 (0.2–2.7) | 20.8 | 23.6 | 20.8 |
| T3 | 72 | 86.0 (82.0–90.5) | 9.4 (1.0–16.6) | 1.9 (0.2–3.9) | 27.8 | 30.6 | 29.2 |
| p-value c | 0.001 | 0.488 | 0.336 | 0.173 | 0.085 | 0.117 | |
| Dietary GL b | |||||||
| T1 | 73 | 83.0 (80.0–86.0) | 9.1 (1.0–14.8) | 1.8 (0.2–3.4) | 26.0 | 26.0 | 26.0 |
| T2 | 72 | 82.0 (78.5–87.0) | 9.0 (1.0–12.8) | 1.9 (0.2–2.6) | 19.4 | 19.4 | 20.8 |
| T3 | 72 | 86.0 (80.0–90.0) | 9.2 (1.0–13.3) | 1.8 (0.2–2.7) | 18.1 | 23.6 | 18.1 |
| p-value c | 0.193 | 0.929 | 0.926 | 0.454 | 0.636 | 0.496 | |
| Factor Variables | Insulin Resistance (HOMA-IR > 3.16) | |||||
|---|---|---|---|---|---|---|
| OR (95% CI) | OR (95% CI) | OR (95% CI) | OR (95% CI) | |||
| Total Carbohydrates a,b | n | Median | Model 1 | Model 2 c | Model 3 d | Model 4 e |
| Males | ||||||
| T1 | 29 | 286.2 | 1 (Ref.) | 1 (Ref.) | 1 (Ref.) | 1 (Ref.) |
| T2 | 38 | 335.4 | 2.69 (0.66–11.01) | 2.92 (0.70–12.16) | 2.96 (0.69–12.67) | 5.04 (0.92–27.52) |
| T3 | 44 | 387.9 | 1.64 (0.39–6.94) | 1.92 (0.44–8.35) | 1.97 (0.44–8.80) | 4.76 (0.59–38.27) |
| p-trend | 0.667 | 0.510 | 0.498 | 0.181 | ||
| Females | ||||||
| T1 | 44 | 290.9 | 1 (Ref.) | 1 (Ref.) | 1 (Ref.) | 1 (Ref.) |
| T2 | 34 | 337.3 | 0.41 (0.15–1.15) | 0.43 (0.15–1.24) | 0.44 (0.15–1.26) | 1.44 (0.37–5.52) |
| T3 | 28 | 378.1 | 0.19 (0.05–0.73) | 0.20 (0.05–0.79) | 0.19 (0.05–0.75) | 1.08 (0.19–6.20) |
| p-trend | 0.009 | 0.013 | 0.011 | 0.839 | ||
| Dietary Fiber a | Model 1 | Model 2 f | Model 3 g | Model 4 h | ||
| T1 | 73 | 18.7 | 1 (Ref.) | 1 (Ref.) | 1 (Ref.) | 1 (Ref.) |
| T2 | 72 | 26.6 | 0.46 (0.22–0.99) | 0.51 (0.23–1.10) | 0.51 (0.24–1.11) | 0.61 (0.28–1.37) |
| T3 | 72 | 38.1 | 0.21 (0.08–0.52) | 0.26 (0.10–0.68) | 0.28 (0.11–0.72) | 0.46 (0.16–1.31) |
| p-trend | 0.001 | 0.005 | 0.007 | 0.129 | ||
| Total Sugars a | Model 1 | Model 2 f | Model 3 g | Model 4 i | ||
| T1 | 73 | 46.0 | 1 (Ref.) | 1 (Ref.) | 1 (Ref.) | 1 (Ref.) |
| T2 | 72 | 79.5 | 0.57 (0.24–1.37) | 0.53 (0.22–1.29) | 0.56 (0.23–1.36) | 0.63 (0.25–1.60) |
| T3 | 72 | 120.4 | 1.37 (0.64–2.92) | 1.10 (0.50–2.42) | 1.14 (0.51–2.53) | 1.29 (0.56–2.96) |
| p-trend | 0.337 | 0.706 | 0.640 | 0.442 | ||
| Dietary GI | Model 1 | Model 2 f | Model 3 j | Model 4 k | ||
| T1 | 73 | 46.5 | 1 (Ref.) | 1 (Ref.) | 1 (Ref.) | 1 (Ref.) |
| T2 | 72 | 51.3 | 1.48 (0.63–3.50) | 1.25 (0.52–3.01) | 1.21 (0.50–2.95) | 1.43 (0.57–3.58) |
| T3 | 72 | 55.7 | 2.17 (0.95–4.94) | 1.68 (0.71–3.98) | 1.49 (0.62–3.58) | 1.43 (0.59–3.48) |
| p-trend | 0.064 | 0.229 | 0.365 | 0.448 | ||
| Dietary GL a | Model 1 | Model 2 f | Model 3 j | Model 4 l | ||
| T1 | 73 | 144.1 | 1 (Ref.) | 1 (Ref.) | 1 (Ref.) | 1 (Ref.) |
| T2 | 72 | 172.9 | 0.69 (0.31–1.50) | 0.68 (0.31–1.52) | 0.84 (0.37–1.90) | 1.22 (0.50–2.94) |
| T3 | 72 | 198.3 | 0.63 (0.28–1.39) | 0.71 (0.31–1.60) | 0.79 (0.34–1.83) | 1.78 (0.64–4.96) |
| p-trend | 0.235 | 0.370 | 0.567 | 0.282 | ||
| Factor Variables | Insulin Resistance (HOMA-IR > 2.97) | |||||
|---|---|---|---|---|---|---|
| OR (95% CI) | OR (95% CI) | OR (95% CI) | OR (95% CI) | |||
| Total Carbohydrates a | n | Median | Model 1 | Model 2 b | Model 3 c | Model 4 d |
| T1 | 73 | 290.2 | 1 (Ref.) | 1 (Ref.) | 1 (Ref.) | 1 (Ref.) |
| T2 | 72 | 335.9 | 0.82 (0.39–1.73) | 0.92 (0.43–1.98) | 0.93 (0.43–1.99) | 1.09 (0.50–2.40) |
| T3 | 72 | 383.9 | 0.58 (0.26–1.29) | 0.72 (0.32–1.62) | 0.70 (0.31–1.59) | 1.15 (0.45–2.93) |
| p-trend | 0.183 | 0.429 | 0.398 | 0.760 | ||
| Dietary Fiber a | Model 1 | Model 2 b | Model 3 c | Model 4 e | ||
| T1 | 73 | 18.7 | 1 (Ref.) | 1 (Ref.) | 1 (Ref.) | 1 (Ref.) |
| T2 | 72 | 26.6 | 0.59 (0.29–1.23) | 0.64 (0.30–1.34) | 0.65 (0.31–1.36) | 0.69 (0.32–1.50) |
| T3 | 72 | 38.1 | 0.24 (0.10–0.58) | 0.29 (0.12–0.72) | 0.30 (0.12–0.76) | 0.34 (0.13–0.93) |
| p-trend | 0.001 | 0.007 | 0.010 | 0.035 | ||
| Total Sugars a | Model 1 | Model 2 b | Model 3 c | Model 4 f | ||
| T1 | 73 | 46.0 | 1 (Ref.) | 1 (Ref.) | 1 (Ref.) | 1 (Ref.) |
| T2 | 72 | 79.5 | 0.53 (0.22–1.26) | 0.49 (0.21–1.18) | 0.51 (0.21–1.23) | 0.54 (0.22–1.32) |
| T3 | 72 | 120.4 | 1.55 (0.74–3.22) | 1.27 (0.59–2.73) | 1.31 (0.61–2.82) | 1.42 (0.65–3.10) |
| p-trend | 0.176 | 0.413 | 0.377 | 0.278 | ||
| Dietary GI | Model 1 | Model 2 b | Model 3 c | Model 4 g | ||
| T1 | 73 | 46.5 | 1 (Ref.) | 1 (Ref.) | 1 (Ref.) | 1 (Ref.) |
| T2 | 72 | 51.3 | 1.74 (0.75–4.04) | 1.54 (0.65–3.64) | 1.53 (0.65–3.61) | 1.70 (0.70–4.09) |
| T3 | 72 | 55.7 | 2.48 (1.10–5.60) | 2.09 (0.90–4.87) | 2.00 (0.85–4.70) | 1.83 (0.77–4.35) |
| p-trend | 0.028 | 0.088 | 0.334 | 0.240 | ||
| Dietary GL a | Model 1 | Model 2 b | Model 3 h | Model 4 i | ||
| T1 | 73 | 144.1 | 1 (Ref.) | 1 (Ref.) | 1 (Ref.) | 1 (Ref.) |
| T2 | 72 | 172.9 | 0.69 (0.31–1.50) | 0.68 (0.31–1.52) | 0.68 (0.31–1.51) | 0.79 (0.35–1.79) |
| T3 | 72 | 198.3 | 0.88 (0.41–1.87) | 1.02 (0.47–2.21) | 0.99 (0.45–2.15) | 1.23 (0.55–2.79) |
| p-trend | 0.704 | 0.968 | 0.907 | 0.669 | ||
| Factor Variables | Elevated Fasting Insulin Concentration (≥14.38 μU/mL) | |||||
|---|---|---|---|---|---|---|
| OR (95% CI) | OR (95% CI) | OR (95% CI) | OR (95% CI) | |||
| Total Carbohydrates a | n | Median | Model 1 | Model 2 b | Model 3 c | Model 4 d |
| T1 | 73 | 290.2 | 1 (Ref.) | 1 (Ref.) | 1 (Ref.) | 1 (Ref.) |
| T2 | 72 | 335.9 | 0.82 (0.39–1.73) | 0.95 (0.44–2.05) | 0.93 (0.42–2.04) | 1.66 (0.67–4.12) |
| T3 | 72 | 383.9 | 0.43 (0.18–0.99) | 0.54 (0.23–1.30) | 0.52 (0.22–1.26) | 1.42 (0.45–4.46) |
| p-trend | 0.050 | 0.184 | 0.161 | 0.528 | ||
| Dietary Fiber a | Model 1 | Model 2 b | Model 3 c | Model 4 e | ||
| T1 | 73 | 18.7 | 1 (Ref.) | 1 (Ref.) | 1 (Ref.) | 1 (Ref.) |
| T2 | 72 | 26.6 | 0.48 (0.23–1.00) | 0.53 (0.25–1.13) | 0.56 (0.26–1.21) | 0.65 (0.29–1.42) |
| T3 | 72 | 38.1 | 0.16 (0.06–0.43) | 0.21 (0.08–0.57) | 0.24 (0.09–0.64) | 0.34 (0.12–1.00) |
| p-trend | <0.001 | 0.002 | 0.004 | 0.047 | ||
| Total Sugars a | Model 1 | Model 2 b | Model 3 c | Model 4 d | ||
| T1 | 73 | 46 | 1 (Ref.) | 1 (Ref.) | 1 (Ref.) | 1 (Ref.) |
| T2 | 72 | 79.5 | 0.51 (0.21–1.24) | 0.46 (0.18–1.14) | 0.49 (0.20–1.24) | 0.54 (0.21–1.40) |
| T3 | 72 | 120.4 | 1.57 (0.74–3.31) | 1.21 (0.55–2.65) | 1.25 (0.56–2.78) | 1.40 (0.62–3.19) |
| p-trend | 0.168 | 0.492 | 0.446 | 0.301 | ||
| Dietary GI | Model 1 | Model 2 b | Model 3 f | Model 4 g | ||
| T1 | 73 | 46.5 | 1 (Ref.) | 1 (Ref.) | 1 (Ref.) | 1 (Ref.) |
| T2 | 72 | 51.3 | 1.48 (0.63–3.50) | 1.22 (0.50–2.95) | 1.18 (0.48–2.91) | 1.05 (0.42–2.66) |
| T3 | 72 | 55.7 | 2.32 (1.02–5.26) | 1.76 (0.74–4.15) | 1.47 (0.61–3.57) | 1.10 (0.43–2.78) |
| p-trend | 0.042 | 0.189 | 0.382 | 0.842 | ||
| Dietary GL a | Model 1 | Model 2 b | Model 3 f | Model 4 h | ||
| T1 | 73 | 144.1 | 1 (Ref.) | 1 (Ref.) | 1 (Ref.) | 1 (Ref.) |
| T2 | 72 | 172.9 | 0.75 (0.35–1.62) | 0.74 (0.34–1.64) | 0.88 (0.39–2.00) | 0.96 (0.42–2.19) |
| T3 | 72 | 198.3 | 0.63 (0.28–1.39) | 0.72 (0.32–1.65) | 0.82 (0.35–1.92) | 0.93 (0.39–2.23) |
| p-trend | 0.242 | 0.417 | 0.642 | 0.875 | ||
© 2019 by the authors. Licensee MDPI, Basel, Switzerland. This article is an open access article distributed under the terms and conditions of the Creative Commons Attribution (CC BY) license (http://creativecommons.org/licenses/by/4.0/).
Share and Cite
Castro-Quezada, I.; Flores-Guillén, E.; Núñez-Ortega, P.E.; Irecta-Nájera, C.A.; Sánchez-Chino, X.M.; Mendez-Flores, O.G.; Olivo-Vidal, Z.E.; García-Miranda, R.; Solís-Hernández, R.; Ochoa-Díaz-López, H. Dietary Carbohydrates and Insulin Resistance in Adolescents from Marginalized Areas of Chiapas, México. Nutrients 2019, 11, 3066. https://doi.org/10.3390/nu11123066
Castro-Quezada I, Flores-Guillén E, Núñez-Ortega PE, Irecta-Nájera CA, Sánchez-Chino XM, Mendez-Flores OG, Olivo-Vidal ZE, García-Miranda R, Solís-Hernández R, Ochoa-Díaz-López H. Dietary Carbohydrates and Insulin Resistance in Adolescents from Marginalized Areas of Chiapas, México. Nutrients. 2019; 11(12):3066. https://doi.org/10.3390/nu11123066
Chicago/Turabian StyleCastro-Quezada, Itandehui, Elena Flores-Guillén, Pilar E. Núñez-Ortega, César A. Irecta-Nájera, Xariss M. Sánchez-Chino, Orquidia G. Mendez-Flores, Zendy E. Olivo-Vidal, Rosario García-Miranda, Roberto Solís-Hernández, and Héctor Ochoa-Díaz-López. 2019. "Dietary Carbohydrates and Insulin Resistance in Adolescents from Marginalized Areas of Chiapas, México" Nutrients 11, no. 12: 3066. https://doi.org/10.3390/nu11123066
APA StyleCastro-Quezada, I., Flores-Guillén, E., Núñez-Ortega, P. E., Irecta-Nájera, C. A., Sánchez-Chino, X. M., Mendez-Flores, O. G., Olivo-Vidal, Z. E., García-Miranda, R., Solís-Hernández, R., & Ochoa-Díaz-López, H. (2019). Dietary Carbohydrates and Insulin Resistance in Adolescents from Marginalized Areas of Chiapas, México. Nutrients, 11(12), 3066. https://doi.org/10.3390/nu11123066