Nutrient Estimation from 24-Hour Food Recalls Using Machine Learning and Database Mapping: A Case Study with Lactose


Abstract
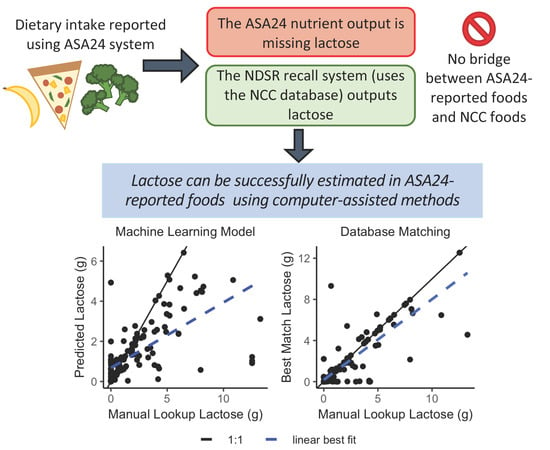
1. Introduction
2. Materials and Methods
2.1. Data Sources
2.1.1. 24-hour Dietary Recall Data Collection
2.1.2. Manual Lookup of ASA24-Reported Foods into ASA24-2016
2.1.3. Manual Lookup of ASA24-Reported Foods into NDSR
2.1.4. Creation of Training and Test Data
2.2. Machine Learning Models
2.2.1. Data Preprocessing
2.2.2. Baseline Models
2.2.3. LASSO Models
2.2.4. Ridge Models
2.2.5. Feed Forward Neural Network (FFNN)
2.2.6. Gradient Boosted Trees
2.2.7. Machine Learning Model Evaluation
2.3. Database Matching
2.3.1. Nutrient-Only Database Matching
2.3.2. Nutrient + Text Database Matching
2.3.3. Database Matching Evaluation
3. Results
3.1. Machine Learning Models
3.1.1. Training Results
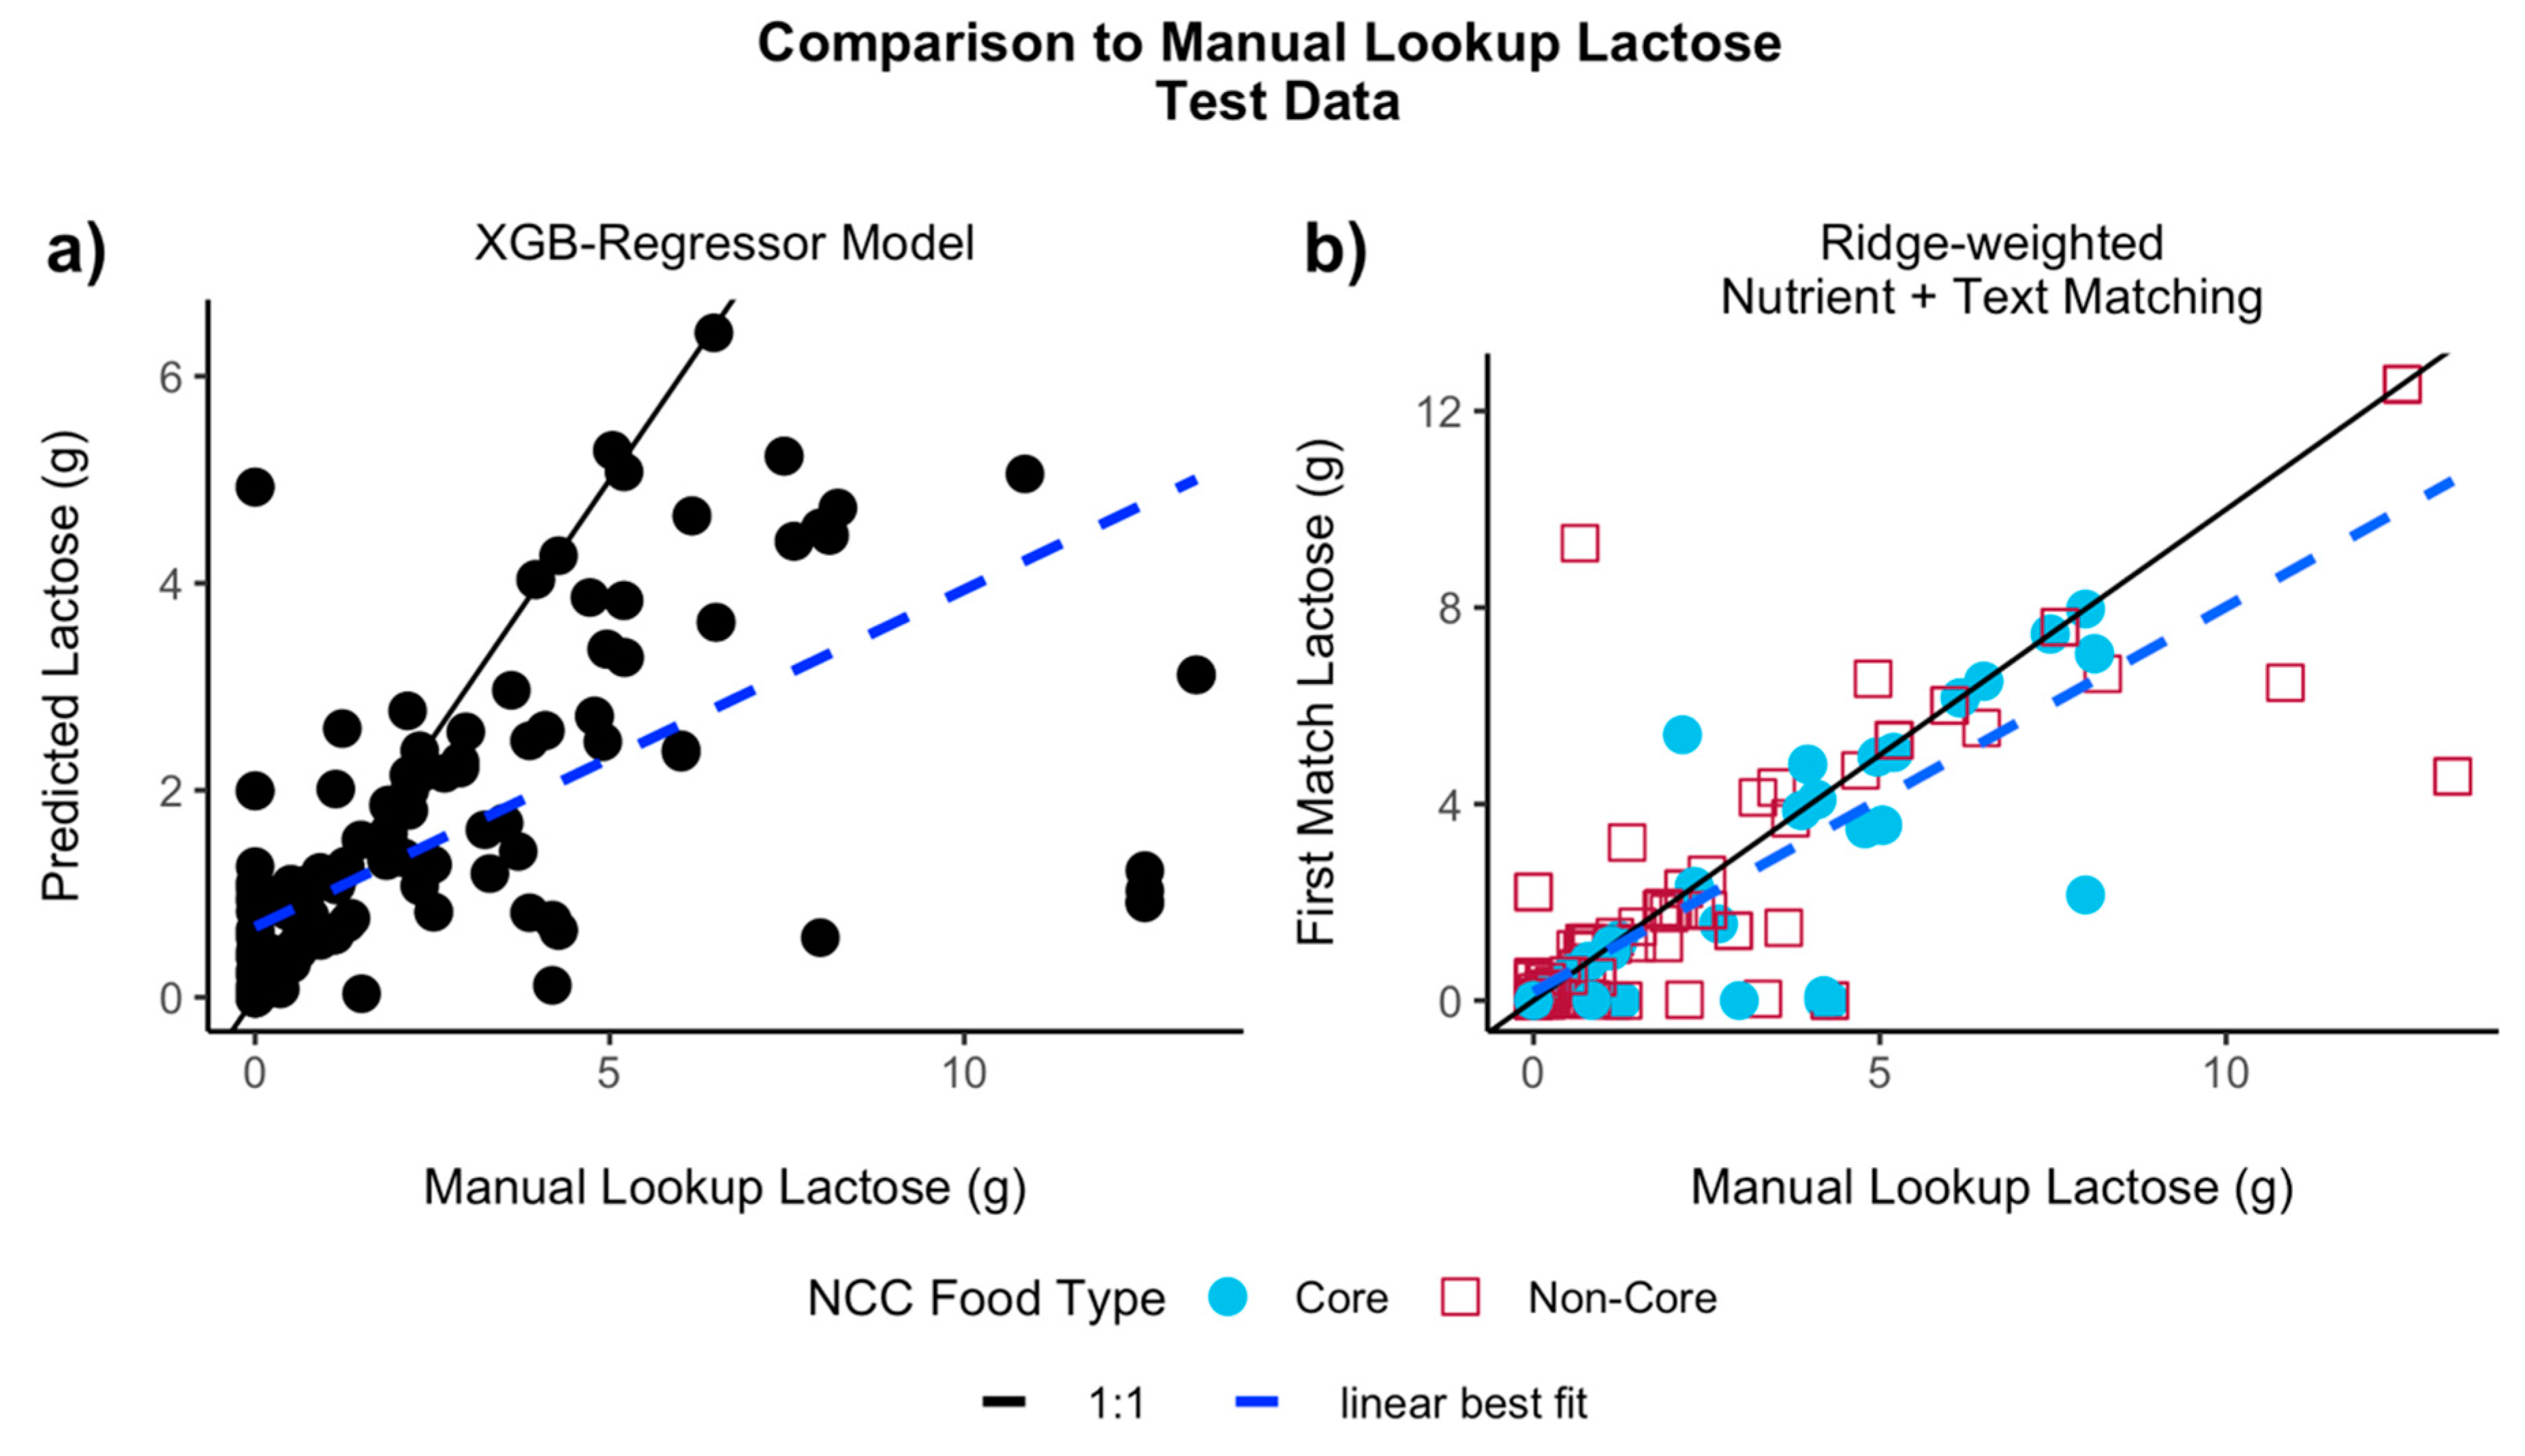
3.1.2. Test results
3.1.3. Feature Importances
3.2. Database Matching
3.2.1. Nutrient-Only Database Matching
Comparison of Lactose to the Manual Lookup
3.2.2. Nutrient + Text Database Matching
Comparison of Lactose to the Manual Lookup
Comparison of Nutrient + Text Outputs Between Datasets
3.2.3. Comparison of the First Matches Between Database Matching Algorithms
3.2.4. Variation in Lactose, and Matching to FoodLinks and Lactose-Free Foods
4. Discussion
4.1. Machine Learning Models
4.2. Database Matching
4.3. Time Required for Manual Lookup and Computer-Assisted Methods
4.4. Limitations and Future Work
5. Conclusions
Supplementary Materials
Author Contributions
Funding
Acknowledgments
Conflicts of Interest
References
- National Cancer Institute. Automated Self-Administered 24-Hour (ASA24®) Dietary Assessment Tool. Available online: https://epi.grants.cancer.gov/asa24/ (accessed on 21 March 2019).
- Subar, A.F.; Kirkpatrick, S.I.; Mittl, B.; Zimmerman, T.P.; Thompson, F.E.; Bingley, C.; Willis, G.; Islam, N.G.; Baranowski, T.; McNutt, S.; et al. The Automated Self-Administered 24-hour dietary recall (ASA24): A resource for researchers, clinicians, and educators from the National Cancer Institute. J. Acad. Nutr. Diet. 2012, 112, 1134–1137. [Google Scholar] [CrossRef] [PubMed]
- Nutrition Coordinating Center. NDSR Software. Available online: http://www.ncc.umn.edu/products/ (accessed on 4 September 2019).
- National Cancer Institute. ASA24® Frequently Asked Questions. Available online: https://epi.grants.cancer.gov/asa24/resources/faq.html (accessed on 16 October 2019).
- National Cancer Institute. Nutrient & Food Group Analysis Using ASA24-2016 & ASA24-2018. Available online: https://epi.grants.cancer.gov/asa24/researcher/analysis.html (accessed on 26 November 2019).
- Nutrition Coordinating Center. NCC Database Nutrient, Nutrient Ratios, and Other Food Components. Available online: http://www.ncc.umn.edu/ncc-database-nutrient-nutrient-ratios-food-components/ (accessed on 4 September 2019).
- Ségurel, L.; Bon, C. On the Evolution of Lactase Persistence in Humans. Annu. Rev. Genom. Hum. Genet. 2017, 8, 297–319. [Google Scholar] [CrossRef] [PubMed]
- Szilagyi, A. Adaptation to lactose in lactase non persistent people: Effects on intolerance and the relationship between dairy food consumption and evalution of diseases. Nutrients 2015, 7, 6751–6779. [Google Scholar] [CrossRef] [PubMed]
- Misselwitz, B.; Butter, M.; Verbeke, K.; Fox, M.R. Update on lactose malabsorption and intolerance: Pathogenesis, diagnosis and clinical management. Gut 2019, 68, 2080–2091. [Google Scholar] [CrossRef] [PubMed]
- National Cancer Institute. ASA24® Sample Analysis Files & Data Dictionaries. Available online: https://epi.grants.cancer.gov/asa24/researcher/sample.html (accessed on 22 March 2019).
- Chin, E.L.; Huang, L.; Bouzid, Y.Y.; Kirschke, C.P.; Durbin-Johnson, B.; Baldiviez, L.M.; Bonnel, E.L.; Keim, N.L.; Korf, I.; Stephensen, C.B.; et al. Association of Lactase Persistence Genotypes (rs4988235) and Ethnicity with Dairy Intake in a Healthy, U.S. Population. Nutrients 2019, 11, 1860. [Google Scholar] [CrossRef] [PubMed]
- Bell, R.M.; Keesey, J.; Richards, T. The Urge to Merge: Linking Vital Statistics Records and Medicaid Claims. Med. Care 1994, 32, 1004–1018. [Google Scholar] [CrossRef] [PubMed]
- Paixão, E.S.; Harron, K.; Andrade, K.; Teixeira, M.G.; Fiaccone, R.L.; Costa, M.D.C.N.; Rodrigues, L.C. Evaluation of record linkage of two large administrative databases in a middle income country: Stillbirths and notifications of dengue during pregnancy in Brazil. BMC Med. Inform. Decis. Mak. 2017, 17, 108. [Google Scholar] [CrossRef]
- Wu, J.; Faux, S.G.; Harris, I.; Poulos, C.J.; Alexander, T. Record linkage is feasible with non-identifiable trauma and rehabilitation datasets. Aust. N. Z. J. Public Health 2016, 40, 245–249. [Google Scholar] [CrossRef]
- Roos, L.L.; Wajda, A.; Nicol, J.P. The art and science of record linkage: Methods that work with few identifiers. Comput. Biol. Med. 1986, 16, 45–57. [Google Scholar] [CrossRef]
- Oliveira, G.P.; Bierrenbach, A.L.; Camargo, K.R.J.; Coeli, C.M.; Pinheiro, R.S. Accuracy of probabilistic and deterministic record linkage: The case of tuberculosis. Rev. Saude Publica 2016, 50, 49. [Google Scholar] [CrossRef]
- Pacheco, A.G.; Saraceni, V.; Tuboi, S.H.; Moulton, L.H.; Chaisson, R.E.; Cavalcante, S.C.; Durovni, B.; Faulhaber, J.C.; Golub, J.E.; King, B.; et al. Validation of a Hierarchical Deterministic Record-Linkage Algorithm Using Data From 2 Different Cohorts of Human Immunodeficiency Virus-Infected Persons and Mortality Databases in Brazil. Am. J. Epidemiol. 2008, 168, 1326–1332. [Google Scholar] [CrossRef] [PubMed]
- Li, B.; Quan, H.; Fong, A.; Lu, M. Assessing record linkage between health care and Vital Statistics databases using deterministic methods. BMC Health Serv. Res. 2006, 6, 48. [Google Scholar] [CrossRef] [PubMed]
- European Food Safety Authority. Data Standardisation. Available online: https://www.efsa.europa.eu/en/data/data-standardisation (accessed on 4 September 2019).
- Ireland, J.D.; Møller, A. LanguaL Food Description: A Learning Process. Eur. J. Clin. Nutr. 2010, 64, S44–S48. [Google Scholar] [CrossRef] [PubMed]
- Eftimov, T.; Korošec, P.; Koroušić Seljak, B. StandFood: Standardization of Foods Using a Semi-Automatic System for Classifying and Describing Foods According to FoodEx2. Nutrients 2017, 9, 542. [Google Scholar] [CrossRef]
- Koroušić Seljak, B.; Korošec, P.; Eftimov, T.; Ocke, M.; van der Laan, J.; Roe, M.; Berry, R.; Crispim, S.; Turrini, A.; Krems, C.; et al. Identification of Requirements for Computer-Supported Matching of Food Consumption Data with Food Composition Data. Nutrients 2018, 10, 433. [Google Scholar] [CrossRef]
- Danish Food Informatics. LanguaL Home Page. Available online: http://www.langual.org/Default.asp (accessed on 10 September 2019).
- Lamarine, M.; Hager, J.; Saris, W.H.M.; Astrup, A.; Valsesia, A. Fast and Accurate Approaches for Large-Scale, Automated Mapping of Food Diaries on Food Composition Tables. Front. Nutr. 2018, 5, 38. [Google Scholar] [CrossRef]
- Baldiviez, L.M.; Keim, N.L.; Laugero, K.D.; Hwang, D.H.; Huang, L.; Woodhouse, L.R.; Burnett, D.J.; Zerofsky, M.S.; Bonnel, E.L.; Allen, L.H.; et al. Design and implementation of a cross-sectional nutritional phenotyping study in healthy US adults. BMC Nutr. 2017, 3, 79. [Google Scholar] [CrossRef]
- Bowman, S.A.; Clemens, J.C.; Friday, J.E.; Thoerig, R.C.; Shimizu, M.; Barrows, B.R.; Moshfegh, A.J. Food Patterns Equivalents Database 2007–08: Methodology and User Guide. Available online: https://www.ars.usda.gov/ARSUserFiles/80400530/pdf/fped/FPED_1516.pdf (accessed on 22 March 2019).
- Liu, F.T.; Ting, K.M.; Zhou, Z. Isolation Forest. In Proceedings of the ICDM 2008: The 8th IEEE International Conference on Data Mining, Pisa, Italy, 15–19 December 2008; IEEE Computer Society: Washington, DC, USA; pp. 413–422. [Google Scholar]
- Liu, F.T.; Ting, K.M.; Zhou, Z.H. Isolation-Based Anomaly Detection. ACM Trans. Knowl. Discov. Data 2012, 6, 1–39. [Google Scholar] [CrossRef]
- Chris van den Berg. Super Fast String Matching in Python. Available online: https://bergvca.github.io/2017/10/14/super-fast-string-matching.html (accessed on 31 May 2019).
- U.S. Department of Agriculture Agricultral Research Service. FoodData Central. Available online: https://fdc.nal.usda.gov/ (accessed on 4 September 2019).
- U.S. Department of Agriculture Agricultral Research Service. Food Surveys Research Group Food and Nutrient Database for Dietary Studies. Available online: https://www.ars.usda.gov/northeast-area/beltsville-md-bhnrc/beltsville-human-nutrition-research-center/food-surveys-research-group/docs/fndds/ (accessed on 4 September 2019).
- Drewnowski, A. The Nutrient Rich Foods Index helps to identify healthy, affordable foods. Am. J. Clin. Nutr. 2010, 91, 1095S–1101S. [Google Scholar] [CrossRef]
- U.S. Department of Agriculture Agricultural Research Service. Download FoodData Central Data. Available online: https://fdc.nal.usda.gov/download-datasets.html (accessed on 30 September 2019).
- Rashmi, K.V.; Gilad-Bachrach, R. DART: Dropouts meet Multiple Additive Regression Trees. CoRR 2015, abs/1505.0. [Google Scholar]
- Hinton, G.E.; Srivastava, N.; Krizhevsky, A.; Sutskever, I.; Salakhutdinov, R. Improving neural networks by preventing co-adaptation of feature detectors. CoRR 2012, abs/1207.0. [Google Scholar]
- National Institutes of Health Office of Dietary Supplements. Potassium Fact Sheet for Health Professionals. Available online: https://ods.od.nih.gov/factsheets/Potassium-HealthProfessional (accessed on 25 September 2019).
- National Institutes of Health Office of Dietary Supplements. Choline Fact Sheet for Health Professionals. Available online: https://ods.od.nih.gov/factsheets/Choline-HealthProfessional (accessed on 25 September 2019).
- National Institutes of Health Office of Dietary Supplements. Riboflavin Fact Sheet for Consumers. Available online: https://ods.od.nih.gov/factsheets/Riboflavin-HealthProfessional (accessed on 25 September 2019).
- Sauleau, E.A.; Paumier, J.P.; Buemi, A. Medical record linkage in health information systems by approximate string matching and clustering. BMC Med. Inform. Decis. Mak. 2005, 5, 32. [Google Scholar] [CrossRef] [PubMed]


| Performance Metric | LASSO | Bounded-LASSO a | Combined LASSO b | Ridge | Bounded-Ridge a | Combined Ridge b | FFNN | XGB-Regressor | Combined XGB b |
|---|---|---|---|---|---|---|---|---|---|
| Training Results * | |||||||||
| R2 | 0.45 | 0.55 | 0.64 | 0.42 | 0.53 | 0.64 | 0.74 | 0.81 | 0.81 |
| SRC | 0.61 | 0.64 | 0.80 | 0.60 | 0.63 | 0.81 | 0.77 | 0.84 | 0.90 |
| PCC | 0.70 | 0.75 | 0.82 | 0.69 | 0.74 | 0.82 | 0.88 | 0.90 | 0.91 |
| MAE | 1.23 | 1.08 | 0.86 | 1.23 | 1.10 | 0.87 | 0.69 | 0.48 | 0.43 |
| Classifier Accuracy | NA | NA | 0.89 | NA | NA | 0.89 | NA | NA | 0.97 |
| Test Results | |||||||||
| R2 | 0.32 (0.36) | 0.30 (0.53) | 0.32 (0.54) | 0.15 (0.27) | 0.12 (0.50) | 0.18 (0.46) | 0.27 (0.28) | 0.33 (0.33) | 0.31 (0.31) |
| SRC | 0.64 (0.67) | 0.63 (0.68) | 0.71 (0.75) | 0.61 (0.66) | 0.64 (0.69) | 0.72 (0.77) | 0.70 (0.69) | 0.75 (0.76) | 0.76 (0.76) |
| PCC | 0.62 (0.67) | 0.58 (0.78) | 0.61 (0.80) | 0.47 (0.59) | 0.48 (0.76) | 0.51 (0.77) | 0.60 (0.60) | 0.65 (0.65) | 0.64 (0.63) |
| MAE | 1.53 (1.49) | 1.37 (1.24) | 1.28 (1.16) | 1.64 (1.56) | 1.43 (1.27) | 1.37 (1.23) | 1.3 (1.28) | 1.18 (1.19) | 1.14 (1.16) |
| Classifier Accuracy | NA | NA | 0.85 (0.86) | NA | NA | 0.85 (0.86) | NA | NA | 0.92 (0.91) |
| Matching Algorithm | Weighting | Training (n = 378) | Test (n = 189) | All Data (n = 567) | |||||||||
|---|---|---|---|---|---|---|---|---|---|---|---|---|---|
| R2 | PCC | MAE | Variation | R2 | PCC | MAE | Variation | R2 | PCC | MAE | Variation | ||
| Nutrient-Only | Unweighted | 0.51 | 0.71 | 0.71 | 0.39 | 0.32 | 0.58 | 1.18 | 0.52 | 0.44 | 0.66 | 0.87 | 0.44 |
| LASSO-weighted | 0.31 (0.47) | 0.55 (0.69) | 1.05 (0.93) | 0.66 (0.68) | 0.19 | 0.44 | 1.45 | 0.77 | 0.25 (0.36) | 0.50 (0.60) | 1.18 (1.11) | 0.70 (0.70) | |
| Ridge-weighted | 0.51 | 0.72 | 0.74 | 0.48 | 0.32 | 0.56 | 1.24 | 0.61 | 0.44 | 0.66 | 0.91 | 0.50 | |
| Nutrient + Text | Unweighted | 0.78 | 0.88 | 0.48 | 0.60 | 0.72 | 0.85 | 0.69 | 0.54 | 0.76 | 0.87 | 0.54 | 0.58 |
| LASSO-weighted | 0.20 (0.57) | 0.44 (0.76) | 0.92 (0.66) | 0.60 (0.59) | 0.64 | 0.80 | 0.78 | 0.63 | 0.26 (0.58) | 0.51 (0.76) | 0.90 (0.73) | 0.60 (0.60) | |
| Ridge-weighted | 0.23 (0.65) | 0.48 (0.81) | 0.89 (0.63) | 0.54 (0.54) | 0.75 | 0.86 | 0.62 | 0.54 | 0.31 (0.68) | 0.56 (0.82) | 0.81 (0.64) | 0.54 (0.54) | |
| Input ASA24 Food Description | NDSR/NCC Manual Lookup | Matching Scheme | First MatchNCC Short Description | g Lactose per 100g of Food | |||||
|---|---|---|---|---|---|---|---|---|---|
| Unweighted | LASSO-Weighted | Ridge-Weighted | Manual Lookup | Un-Weighted | LASSO-Weighted | Ridge-Weighted | |||
| Milk, cow’s, fluid, whole | Milk, whole (3.5–4% fat) | Nutrient-Only | Milk, lactose reduced (Lactaid), whole | Milk, lactose reduced (Lactaid), whole | Milk, lactose reduced (Lactaid), whole | 5.05 | 0.00 | 0.00 | 0.00 |
| Nutrient + Text | Milk, whole | Milk, whole | Milk, whole | 5.05 | 5.05 | 5.05 | 5.05 | ||
| Milk, cow’s, fluid, lactose reduced, 2% fat | Milk, lactose reduced (Lactaid), 2% fat or reduced fat | Nutrient-Only | Arby’s milk | Milk, acidophilus, 2% fat (reduced fat) | Milk, lactose reduced (Lactaid), 2% fat (reduced fat) | 0.00 | 5.01 | 5.01 | 0.00 |
| Nutrient + Text | Milk, lactose reduced (Lactaid), 2% fat (reduced fat) | Milk, lactose reduced (Lactaid), 2% fat (reduced fat) | Milk, lactose reduced (Lactaid), 2% fat (reduced fat) | 0.00 | 0.00 | 0.00 | 0.00 | ||
| Milk, soy, ready-to-drink, not baby’s | Milk, soy milk, ready-to-drink, plain or original, unknown if sweetened, unknown sweetening, unknown type, unknown if fortified | Nutrient-Only | Soy milk, plain or original, sweetened with sugar, ready-to-drink, enriched | Soy milk, vanilla or other flavors, sweetened with sugar, ready-to-drink, enriched | Soy milk, vanilla or other flavors, sweetened with sugar, ready-to-drink, enriched | 0.00 | 0.00 | 0.00 | 0.00 |
| Nutrient + Text | Soy milk, chocolate, sweetened with sugar, light, ready-to-drink | Soy milk, chocolate, sweetened with sugar, ready-to-drink, not fortified | Soy milk, chocolate, sweetened with sugar, ready-to-drink, not fortified | 0.00 | 0.00 | 0.00 | 0.00 | ||
| Milk, almond, ready-to-drink | Milk, almond beverage, plain or original, unknown type | Nutrient-Only | Cashew milk, chocolate | SnackWell’s 100 Calorie Pack—Fudge Drizzled Double Chocolate Chip (Nabisco) | Cashew milk, chocolate | 0.00 | 0.00 | 0.00 | 0.00 |
| Nutrient + Text | Almond milk, chocolate, sweetened | Chocolate milk, ready-to-drink | Almond milk, chocolate, sweetened | 0.00 | 0.00 | 5.12 | 0.00 | ||
| Cheese, Cheddar | Cheddar cheese, unknown type | Nutrient-Only | Colby cheese, natural | Pepper Jack cheese | Colby Jack cheese | 0.12 | 0.23 | 0.67 | 0.37 |
| Nutrient + Text | Cheddar cheese, natural | Cheddar cheese, natural | Cheddar cheese, natural | 0.12 | 0.12 | 0.12 | 0.12 | ||
| Yogurt, plain, whole milk | Yogurt, plain, whole milk (3%–4% fat) | Nutrient-Only | Mountain High Original Style Yoghurt—plain | Mountain High Original Style Yoghurt—plain | Stonyfield Organic YoBaby Yogurt—plain | 3.38 | 3.38 | 3.38 | 3.38 |
| Nutrient + Text | Yogurt, plain, whole milk | Yogurt, plain, whole milk | Yogurt, plain, whole milk | 3.38 | 3.38 | 3.38 | 3.38 | ||
| High protein bar, candy-like, soy and milk base | Special formulated products, Tiger’s Milk Nutrition Bar—Protein Rich | Nutrient-Only | Tiger’s Milk Nutrition Bar—Peanut Butter and Honey | Tiger’s Milk Nutrition Bar—Peanut Butter and Honey | Tiger’s Milk Nutrition Bar—Peanut Butter and Honey | 3.24 | 4.52 | 4.52 | 4.52 |
| Nutrient + Text | Nutribar High Protein Meal Replacement Bar—Milk Chocolate Peanut | Slim-Fast High Protein—Creamy Milk Chocolate, dry mix (unprepared) | High-protein bar | 3.24 | 1.54 | 12.19 | 0.12 | ||
| Clam chowder, NS as to Manhattan or New England style | Clams, soup—clam chowder, New England (cream base), unknown preparation | Nutrient-Only | Pescado frito con mojo (fish a la creole) | Dairy Queen Hot Dog with chili | Cheeseburger on a bun, single patty (1/10 LB), with ketchup, tomato, lettuce, pickle, onion, mustard | 2.46 | 0.00 | 0.00 | 0.17 |
| Nutrient + Text | Manhattan clam chowder, tomato base, homemade | Manhattan clam chowder, tomato base, ready-to-serve can | Manhattan clam chowder, condensed | 2.46 | 0.00 | 0.00 | 0.00 | ||
| Cocoa, sugar, and dry milk mixture, water added | Cocoa or hot chocolate, prepared from dry mix, unknown type | Nutrient-Only | Soy milk, vanilla or other flavors, sweetened with sugar, light, ready-to-drink, not fortified | Almond milk, vanilla or other flavors, sweetened | Gerber Breakfast Buddies Hot Cereal with Real Fruit and Yogurt—Bananas and Cream | 0.92 | 0.00 | 0.00 | 2.80 |
| Nutrient + Text | Land O’Lakes Cocoa Classics—Arctic White Cocoa, prepared | Swiss Miss Hot Cocoa Sensible Sweets—No Sugar Added, dry mix (unprepared) | Swiss Miss Hot Cocoa Sensible Sweets—No Sugar Added, dry mix (unprepared) | 0.92 | 0.89 | 51.88 | 51.88 | ||
© 2019 by the authors. Licensee MDPI, Basel, Switzerland. This article is an open access article distributed under the terms and conditions of the Creative Commons Attribution (CC BY) license (http://creativecommons.org/licenses/by/4.0/).
Share and Cite
Chin, E.L.; Simmons, G.; Bouzid, Y.Y.; Kan, A.; Burnett, D.J.; Tagkopoulos, I.; Lemay, D.G. Nutrient Estimation from 24-Hour Food Recalls Using Machine Learning and Database Mapping: A Case Study with Lactose. Nutrients 2019, 11, 3045. https://doi.org/10.3390/nu11123045
Chin EL, Simmons G, Bouzid YY, Kan A, Burnett DJ, Tagkopoulos I, Lemay DG. Nutrient Estimation from 24-Hour Food Recalls Using Machine Learning and Database Mapping: A Case Study with Lactose. Nutrients. 2019; 11(12):3045. https://doi.org/10.3390/nu11123045
Chicago/Turabian StyleChin, Elizabeth L., Gabriel Simmons, Yasmine Y. Bouzid, Annie Kan, Dustin J. Burnett, Ilias Tagkopoulos, and Danielle G. Lemay. 2019. "Nutrient Estimation from 24-Hour Food Recalls Using Machine Learning and Database Mapping: A Case Study with Lactose" Nutrients 11, no. 12: 3045. https://doi.org/10.3390/nu11123045
APA StyleChin, E. L., Simmons, G., Bouzid, Y. Y., Kan, A., Burnett, D. J., Tagkopoulos, I., & Lemay, D. G. (2019). Nutrient Estimation from 24-Hour Food Recalls Using Machine Learning and Database Mapping: A Case Study with Lactose. Nutrients, 11(12), 3045. https://doi.org/10.3390/nu11123045