Nutrition Transition in the Post-Economic Crisis of Greece: Assessing the Nutritional Gap of Food-Insecure Individuals. A Cross-Sectional Study

 , , and
Abstract
:1. Introduction
2. Methodology
2.1. Research Design and Inclusion Exclusion Criteria of Study Sample
2.2. Socio-Demographic Characteristics
2.3. Anthropometry and Dietary Assessment
2.4. Statistical Analysis
3. Results
4. Discussion
5. Conclusions
Supplementary Materials
Author Contributions
Funding
Acknowledgments
Conflicts of Interest
References
- FAO. Trade Reforms and Food Security; Food and Agriculture Organization of the United Nations: Rome, Italy, 2003. [Google Scholar]
- UN. Transforming Our World: The 2030 Agenda for Sustainable Development; UN: New York, NY, USA, 2015. [Google Scholar]
- Ballard, T.J.; Kepple, A.W.; Cafiero, C. The Food Insecurity Experience Scale: Development of a Global Standard for Monitoring Hunger Worldwide; Technical Paper; Food and Agriculture Organization of the United Nations: Rome, Italy, 2013. [Google Scholar]
- FAO; UNICEF; WFP; WHO. The State of Food Security and Nutrition in the World 2018. Building Climate Resilience for Food Security and Nutrition; Food and Agriculture Organization of the United Nations: Rome, Italy, 2018. [Google Scholar]
- Gundersen, C. Food Insecurity Is an Ongoing National Concern. Adv. Nutr. 2013, 4, 36–41. [Google Scholar] [CrossRef] [PubMed]
- USDA, Supplemental Nutrition Assistance Program (SNAP). Available online: https://www.fns.usda.gov/snap/supplemental-nutrition-assistance-program, (accessed on 22 September 2019).
- Loopstra, R.; Reeves, A.; McKee, M.; Stuckler, D. Food insecurity and social protection in Europe: Quasi-natural experiment of Europe’s great recessions 2004–2012. Prev. Med. 2016, 89, 44–50. [Google Scholar] [CrossRef] [PubMed]
- WHO Europe. European Food and Nutrition Action Plan 2015–2020; WHO: Copenhagen, Denmark, 2014; Available online: http://www.euro.who.int/__data/assets/pdf_file/0008/253727/64wd14e_FoodNutAP_140426.pdf (accessed on 22 September 2019).
- Metis. FEAD Mid-Term Evaluation Interim Report; EU Publications: Brussels, Belgium, 2018. [Google Scholar]
- Regulation (EU) No223/2014 of the European Parliament and of the Council of 11 March 2014 on the Fund for European aid to the most deprived. Off. J. Eur. Union 2014. Available online: https://op.europa.eu/en/publication-detail/-/publication/bdb97849-48fb-11e8-be1d-01aa75ed71a1/language-en (accessed on 22 September 2019).
- Warehouse ECB-SD. Greece—Standardised Unemployment 2012. Available online: http://sdw.ecb.europa.eu/quickview.do?SERIES_KEY=132.STS.M.GR.S.UNEH.RTT000.4.000 (accessed on 22 September 2019).
- Tyrovolas, S.K.N.; Stergachis, A.; Stefanos, T.; Kassebaum, J.K.; Niguse, H.; Alla, F.; Chrepa, V.; Car, M.; Haro, J.M.; Jonas, J.B.; et al. The burden of disease in Greece, health loss, risk factors, and health financing, 2000–16: An analysis of the Global Burden of Disease Study 2016. Lancet Public Health 2018, 3, e395–e406. [Google Scholar] [CrossRef]
- European Commission. Employment SAI. Fund for European Aid to the Most Deprived—Annual Implementation Report Summary 2016; European Commission: Greece, 2016; Available online: https://eur-lex.europa.eu/legal-content/EN/TXT/?uri=COM:2018:742:FIN (accessed on 22 September 2019).
- Ministry of Employment, Social Security & Solidarity. Criteria for enrollment in the FEAD program, Journal of the Goverment of Greece 2017, Issue 1474, Government of Greece, Athens, Greece. Available online: http://teba.eiead.gr/wp-content/uploads/2017/05/%CE%A6%CE%95%CE%9A-%CE%A4%CE%95%CE%92%CE%91-%CE%9A%CE%95%CE%91-1474.pdf (accessed on 22 September 2019).
- Borch, A.; Kjaernes, U. Food security and food insecurity in Europe: An analysis of the academic discourse (1975–2013). Appetite 2016, 103, 137–147. [Google Scholar] [CrossRef]
- Davis, O.; Geiger, B. Did Food Insecurity rise across Europe after the 2008 Crisis? An analysis across welfare regimes. Soci. Policy Soc. 2017, 3, 343–360. [Google Scholar] [CrossRef]
- Bountziouka, V.B.E.; Giotopoulou, A.; Katsagoni, C.; Bonou, M.; Vallianou, N.; Barbetseas, J. Avgerinos, P.C; Panagiotakos D.B. Development, repeatability and validity regarding energy and macronutrient intake of a semi-quantitative food frequency questionnaire: Methodological considerations. Nut. Metab. Cardiovasc. Dis. 2012, 22, 659–667. [Google Scholar] [CrossRef]
- Hellenic Health Foundation, Food Composition Tables. Nutritional Composition of Greek Foods. Available online: http://www.hhf-greece.gr/tables/home.aspx?l=en (accessed on 22 September 2019).
- And Traditional DIishes by Laboratory Analyses. Available online: http://www.hhf-greece.gr/tables/FoodItemsIntro.aspx?l=el (accessed on 16 December 2018).
- USDA. Food Composition Database Show Foods List. Available online: https://ndb.nal.usda.gov/ (accessed on 22 September 2019).
- Consultation RoaJFWUE. Energy and Protein Requirements; World Health Organization: Geneva, Switzerland, 1991. [Google Scholar]
- WHO/FAO. Population Nutrient Intake Goals for Preventing Diet-Related Chronic Diseases. 2003. Available online: https://www.who.int/nutrition/topics/5_population_nutrient/en/ (accessed on 22 September 2019).
- EFSA. Dietary Reference Values for Nutrients Summary Report; EFSA: Parma, Italy, 2017. [Google Scholar]
- Prolepsis. Ethnikos diatrofikos odigos gia enilikes—scientific documentation. 2014. Available online: http://lyk-esp-kilkis.kil.sch.gr/odigos_diatrofis.pdf. (accessed on 22 September 2019).
- WHO. Promoting a Healthy Diet for the WHO Eastern Mediterranean Region: User-Friendly Guide; WHO Regional Office for the Eastern Mediterranean: Cairo, Egypt, 2012. [Google Scholar]
- Zagorsky, J.L.; Smith, P.K. Does the U.S. Food Stamp Program contribute to adult weight gain? Econ. Hum. Biol. 2009, 7, 246–258. [Google Scholar] [CrossRef]
- Baum, C. The Effects of Food Stamps on Obesity. Southern Economic Journal; John Wiley & Sons, Inc.: New York, NY, USA, 2011. [Google Scholar]
- Meyerhoefer, C.D.P.Y. Does participation in the food stamp program increase the prevalence of obesity and health care spending? Am. J. Agric. Econ. 2008, 90, 287–305. [Google Scholar] [CrossRef]
- Pan, L.; Sherry, B.; Njai, R.; Blanck, H.M. Food insecurity is associated with obesity among US adults in 12 states. J. Acad. Nutr. Diet. 2012, 112, 1403–1409. [Google Scholar] [CrossRef]
- Athanasatou, A.; Kandyliari, A.; Malisova, O.; Pepa, A.; Kapsokefalou, M. Sodium and Potassium Intake from Food Diaries and 24-h Urine Collections from 7 Days in a Sample of Healthy Greek Adults. Front. Nutr. 2018, 5, 13. [Google Scholar] [CrossRef] [PubMed]
- James, W.P.; Ralph, A.; Sanchez-Castillo, C.P. The dominance of salt in manufactured food in the sodium intake of affluent societies. Lancet 1987, 1, 426–429. [Google Scholar] [CrossRef]
- Mattes, R.D.; Donnelly, D. Relative contributions of dietary sodium sources. J. Am. Coll. Nutr. 1991, 10, 383–393. [Google Scholar] [CrossRef] [PubMed]
- EFET. Salt Content of Bread in Greece; EFET: Athens, Greece, 2016. [Google Scholar]
- Rao, M.; Afshin, A.; Singh, G.; Mozaffarian, D. Do healthier foods and diet patterns cost more than less healthy options? A systematic review and meta-analysis. BMJ Open 2013, 3, e004277. [Google Scholar] [CrossRef] [PubMed]
- Sustain. 1 in 4 UK Parents Skipping Meals due to Lack of Money. Sustain: The Alliance for Better Food and Farming. Available online: https://www.sustainweb.org/news/jan18_calls_grow_for_government_food_insecurity_measurement/ (accessed on 4 February 2019).
- Freiberg. Obesity and Diabetes—Side Effects of Globalization: Global Problem with Local Solutions. Available online: http://www.academia.edu/35189032/Obesity_and_Diabetes_-Side-effects_of_Globalization_Global_problem_with_local_solutions (accessed on 4 February 2019).
- Baraldi, L.G.; Martinez Steele, E.; Canella, D.S.; Monteiro, C.A. Consumption of ultra-processed foods and associated sociodemographic factors in the USA between 2007 and 2012: Evidence from a nationally representative cross-sectional study. BMJ Open 2018, 8, e020574. [Google Scholar] [CrossRef] [PubMed]
- Spinosa, J.C.P.; Dickson, J.; Lorenzetti, V.; Hardman, C. From Socioeconomic Disadvantage to Obesity: The Mediating Role of Psychological Distress and Emotional Eating. Obesity 2019, 27, 559–564. [Google Scholar] [CrossRef] [PubMed]
- Bonaccio, M.; Di Castelnuovo, A.; Bonanni, A.; Costanzo, S.; De Lucia, F.; Persichillo, M.; Zito, F.; Donati, M.B.; de Gaetano, G.; Iacoviello, L. Decline of the Mediterranean diet at a time of economic crisis. Results from the Moli-sani study. Nutr. Metab. Cardiovasc. Dis. 2014, 24, 853–860. [Google Scholar] [CrossRef]
- Bonaccio, M.D.M.; Iacoviello, L.; de Gaetano, G. Socioeconomic Determinants of the Adherence to the Mediterranean Diet at a Time of Economic Crisis: The Experience of the MOLI-SANI Study1. Agric. Agric. Sci. Procedia 2016, 8, 741–774. [Google Scholar] [CrossRef]
- CIHEAM; FAO. Mediterranean Food Consumption Patterns: Diet, Environment, Society, Economy and Health; A White Paper Priority 5 of Feeding Knowledge Programme 2015, Expo Milan 2015; CIHEAM-IAMB: Bari, Italy; FAO: Rome, Italy, 2015. [Google Scholar]
- Bonaccio, M.B.R.M.; de Gaetano, G.; Iacoviello, L. Challenges to the Mediterranean diet at a time of economic crisis. Nutr. Metab. Cardiovasc. Dis. 2016, 26, 1057–1063. [Google Scholar] [CrossRef]
- Gorber, S.C.T.M.; Moher, D.; Connor, G.S.; Tremblay, M. A comparison of direct vs. self-report measures for assessing height, weight and body mass index: A systematic review. Obes. Rev. 2007, 8, 307–326. [Google Scholar] [CrossRef]
- Stommel, M.S.C. Accuracy and usefulness of BMI measures based on self-reported weight and height: Findings from the NHANES & NHIS 2001–2006. BMC Public Health 2009, 9, 421. [Google Scholar]
- Magriplis, E.; Dimakopoulos, I.; Karageorgou, D.; Mitsopoulou, A.; Bakogianni, I.; Micha, R.; Michas, G.; Ntouroupi, T.; Argyri, K.; Danezis, G.; et al. Aims, design and preliminary findings of the Hellenic National Nutrition and Health Survey (HNNHS). BMC Med. Res. Methodol. 2019, 19, 37. [Google Scholar] [CrossRef] [PubMed]
- Filippou, K.; Pepa, A.; Vlassopoulos, A.; Soofi, S.; Nagaraja, S.; Basnayake, S.; Gupta, A.; Grammatikaki, E.; Ruiz, L.; Barka, A.; et al. Nutritional evaluation of food security policies during the economic crisis. The case of Greece. In Conference Proceedings, International Symposium on Understanding the Double Burden of Malnutrition for Effective Interventions; International Atomic Energy Agency: Vienna Austria, 2018; Available online: https://humanhealth.iaea.org/HHW/Nutrition/Symposium2018/posters/Poster_Session_8_Interventions.pdf (accessed on 22 September 2019).


| Food Insecure N = 499 | General Population N = 545 | pb | |
|---|---|---|---|
| Female, n (%) | 301 (60.7) | 264 (48.7) | <0.001 |
| Years of age (mean ± SD) | 47.53 ± 13.1 | 47.82 ± 13.6 | 0.727 |
| Years of education (mean ± SD) | 10.98 ± 8.5 | 12.66 ± 3.6 | <0.001 |
| Number of children, n (%) | <0.001 | ||
| 0 | 68 (15.3) | 161 (30.9) | |
| 1 | 107 (24.0) | 83 (15.9) | |
| 2 | 150 (33.7) | 209 (40.1) | |
| 3 | 76 (17.1) | 54 (10.4) | |
| Occupational status, n (%) | <0.001 | ||
| Employed | 62 (12.6) | 321 (59.3) | |
| Unemployed | 375 (76.4) | 84 (15.5) | |
| Retired | 25 (5.1) | 94 (17.4) | |
| Housewife | 28 (5.7) | 42 (7.8) | |
| Marital status, n (%) | <0.001 | ||
| Single | 123 (24.8) | 137 (25.6) | |
| Married | 245 (49.5) | 328 (61.2) | |
| Divorced | 105 (21.2) | 42 (7.8) | |
| Widowed | 22 (4.4) | 29 (5.4) | |
| Body mass index (kg/m2) (mean ± SD) | 27.25 ± 5.3 | 25.93 ± 5.1 | <0.001 |
| BMI categories (%) | <0.001 | ||
| Underweight (<18 kg/m2) | 1.7% | 2.4% | |
| Normal (18–24.9 kg/m2) | 28.8% | 42.1% | |
| Overweight (24.9–29.9 kg/m2) | 44.0% | 37.5% | |
| Obese (> 29.9 kg/m2) | 25.4% | 18.0% |
| FEAD Recipients | General Population | pb | |
|---|---|---|---|
| Energy (kcal/day) | 2225.3 ± 832.5 | 2498.2 ± 728.0 | <0.001 |
| Carbohydrates (%E) | 30.92 ± 6.2 | 27.12 ± 6.0 | <0.001 |
| Protein (%E) | 21.32 ± 7.5 | 18.07 (15.34, 23.2) | <0.001 |
| Protein per kg (g) | 1.37 (0.91, 2.09) | 1.52 (1.09, 2.10) | 0.004 |
| Protein from plant sources (%E) | 5.81 ± 1.7 | 4.94 ± 1.3 | <0.001 |
| Protein from animal sources (%E) | 15.59 ± 7.5 | 15.22 ± 7.1 | 0.409 |
| Total fat (%E) | 55.60 ± 8.1 | 57.52 ± 7.8 | <0.001 |
| PUFA (%E) | 8.00 ± 2.3 | 7.59 ± 1.9 | 0.001 |
| MUFA (%E) | 29.62 ± 6.6 | 31.48 ± 6.0 | <0.001 |
| SFA (%E) | 14.36(12.18, 18.70) | 14.85 (12.85, 20.38) | 0.126 |
| Fiber (g/day) | 27.37(21.77, 45.21) | 25.27 (20.04, 31.65) | <0.001 |
| Calcium (mg/day) | 33.10 ± 15.8 | 28.03 ± 12.5 | 0.031 |
| Sodium (mg/day) | 1037.9 ± 509.3 | 1245.29 ± 531.81 | <0.001 |
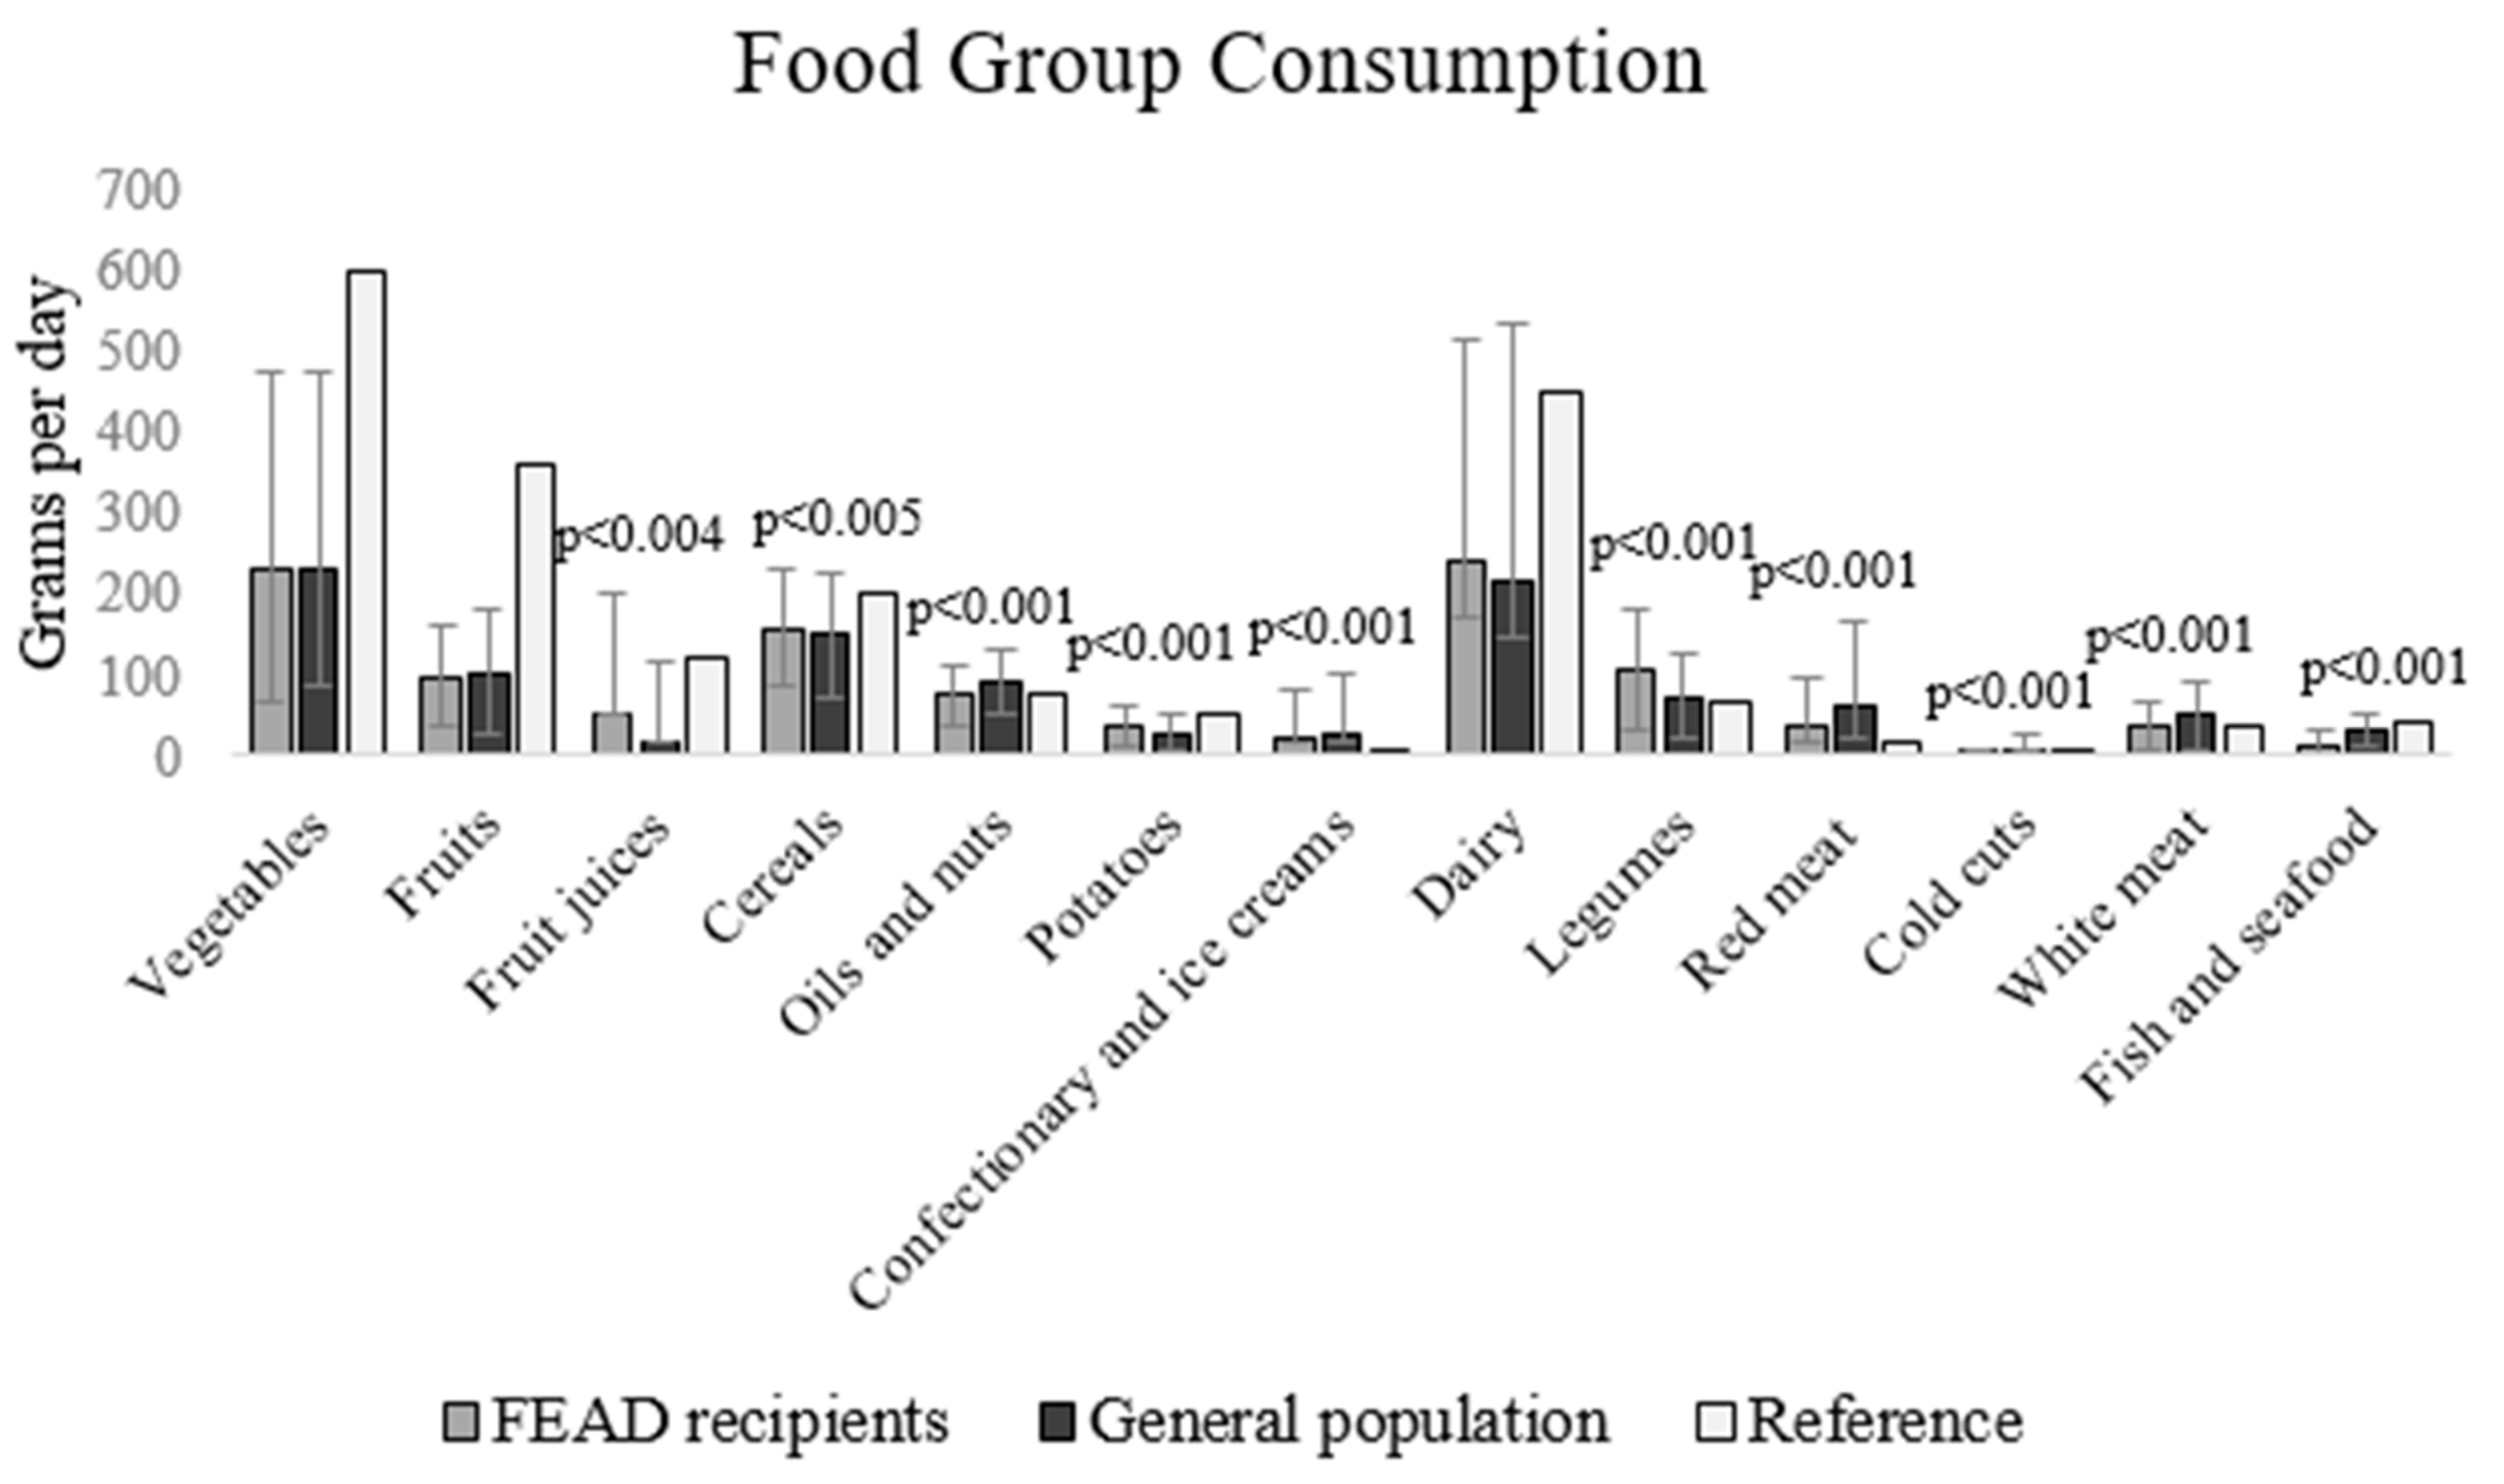
| Food Groups | g/day | Portions/day c | WHO Portions | |||
|---|---|---|---|---|---|---|
| FEAD Recipients | General Population | FEAD Recipients | General Population | FEAD Recipients | General Population | |
| Vegetables | 231.5 (163.4, 244.4) | 231.48 (144.0, 244.4) | 1.54 (1.09, 1.63) | 1.54 (0.96, 1.63) | 2.57 (1.82, 2.72) | 2.57 (1.60, 2.72) |
| Fruits | 98.29 ± 63.7 | 103.9 ± 78.6 | 1.03 (0.66, 1.03) | 1.03 (0.22, 1.03) | 1.38 (0.88, 1.38) | 1.37(0.29, 1.38) |
| Fruit juices | 50.4 (0.0, 153.6 | 16.8 (0.00, 102.0) * | 0.40 (0.00, 1.23 | 0.13 (0.00, 0.82) * | 0.40 (0.00, 1.23 | 0.13 (0.00, 0.82) * |
| Cereals | 158.58 ± 70.85 | 149.7 ± 77.2 | 5.29 ± 2.4 | 4.99 ± 2.6 * | ||
| Pasta, rice | 1.88 (1.33, 2.31 | 1.33 (0.90, 2.31) * | ||||
| Bread | 1.00 (1.00, 2.00) | 1.00 (0.64, 2.00) | ||||
| Dairy | 244.0 (70.44, 274.0) | 214.98 (70.44, 319.9) | 1.22 (0.35, 1.37) | 1.07 (0.35, 1.60) | ||
| Cheese | 0.38(0.13, 0.60 | 0.60 (0.60, 0.60) * | ||||
| Milk | 1.00(0.21, 1.01) | 0.64(0.21, 1.21) | ||||
| Olive & nuts | 75.8 ± 37.2 | 91.96 ± 38.4 * | ||||
| Oils | 4.68 (3.33, 6.82 | 6.67 (3.49, 6.82) * | 4.68 (3.33, 6.82 | 22.5 (11.76, 23.03) * | ||
| Nuts | 0.22 (0.00, 0.67 | 0.67 (0.00, 2.04) * | 0.23 (0.00, 0.070 | 0.70 (0.00, 2.13) * | ||
| Legumes | 104.96 ± 74.5 | 73.6 ± 53 * | 0.42 (0.42, 1.28 | 0.42 (0.42, 0.42) * | 2.10 (2.10, 6.40 | 2.10 (2.10, 2.10) * |
| Red meat | 38.85 (19.95, 59.85 | 59.85 (38.85, 105.98) * | 0.32 (0.17, 0.50 | 0.50 (0.32, 0.88) * | 1.30 (0.67, 2.00 | 2.00 (1.30, 3.53) * |
| Cold cuts | 2.10 (0.00, 6.30 | 6.30 (0.00, 19.20) * | 0.11 (1.09, 1.63 | 0.32 (0.00, 0.96) * | a.c. e | a.c. e |
| White meat | 37.7 ± 29.6 | 51.2 ± 43.1* | 0.26 (0.26, 0.26 | 0.26 (0.26, 0.80) * | 1.05 (1.05, 1.05 | 1.05 (1.05, 3.20) * |
| Eggs | 22.09 ± 19.6 | 20.03 ± 21.5 | 0.24 (0.24, 0.73 | 0.24 (0.24, 0.73) * | 0.24 (0.24, 0.73 | 0.24 (0.24, 0.74) * |
| Fish & seafood | 10.5 (10.5, 31.5 | 31.5 (10.5, 42.0) * | 0.07 (0.07, 0.21 | 0.21 (0.07, 0.28) * | 0.35 (0.35, 1.05 | 1.05 (0.35, 1.40) * |
| Potatoes | 38.16 ± 25.7 | 29.1 ± 23.7* | 0.43 (0.14, 0.43 | 0.14 (0.14, 0.43) * | 1.31 (0.43, 1.31 | 0.43 (0.43, 1.31) * |
© 2019 by the authors. Licensee MDPI, Basel, Switzerland. This article is an open access article distributed under the terms and conditions of the Creative Commons Attribution (CC BY) license (http://creativecommons.org/licenses/by/4.0/).
Share and Cite
Chatzivagia, E.; Pepa, A.; Vlassopoulos, A.; Malisova, O.; Filippou, K.; Kapsokefalou, M. Nutrition Transition in the Post-Economic Crisis of Greece: Assessing the Nutritional Gap of Food-Insecure Individuals. A Cross-Sectional Study. Nutrients 2019, 11, 2914. https://doi.org/10.3390/nu11122914
Chatzivagia E, Pepa A, Vlassopoulos A, Malisova O, Filippou K, Kapsokefalou M. Nutrition Transition in the Post-Economic Crisis of Greece: Assessing the Nutritional Gap of Food-Insecure Individuals. A Cross-Sectional Study. Nutrients. 2019; 11(12):2914. https://doi.org/10.3390/nu11122914
Chicago/Turabian StyleChatzivagia, Eleni, Aleks Pepa, Antonis Vlassopoulos, Olga Malisova, Konstantina Filippou, and Maria Kapsokefalou. 2019. "Nutrition Transition in the Post-Economic Crisis of Greece: Assessing the Nutritional Gap of Food-Insecure Individuals. A Cross-Sectional Study" Nutrients 11, no. 12: 2914. https://doi.org/10.3390/nu11122914
APA StyleChatzivagia, E., Pepa, A., Vlassopoulos, A., Malisova, O., Filippou, K., & Kapsokefalou, M. (2019). Nutrition Transition in the Post-Economic Crisis of Greece: Assessing the Nutritional Gap of Food-Insecure Individuals. A Cross-Sectional Study. Nutrients, 11(12), 2914. https://doi.org/10.3390/nu11122914