Tea Consumption Patterns in Relation to Diet Quality among Children and Adults in the United States: Analyses of NHANES 2011–2016 Data


Abstract
1. Introduction
2. Materials and Methods
2.1. Dietary Intake Databases
2.2. Participant Characteristics
2.3. Consumption of Tea and Beverages
2.4. Diet Quality Indicators
2.5. Data Availability and Ethical Approval
2.6. Statistical Analyses
3. Results
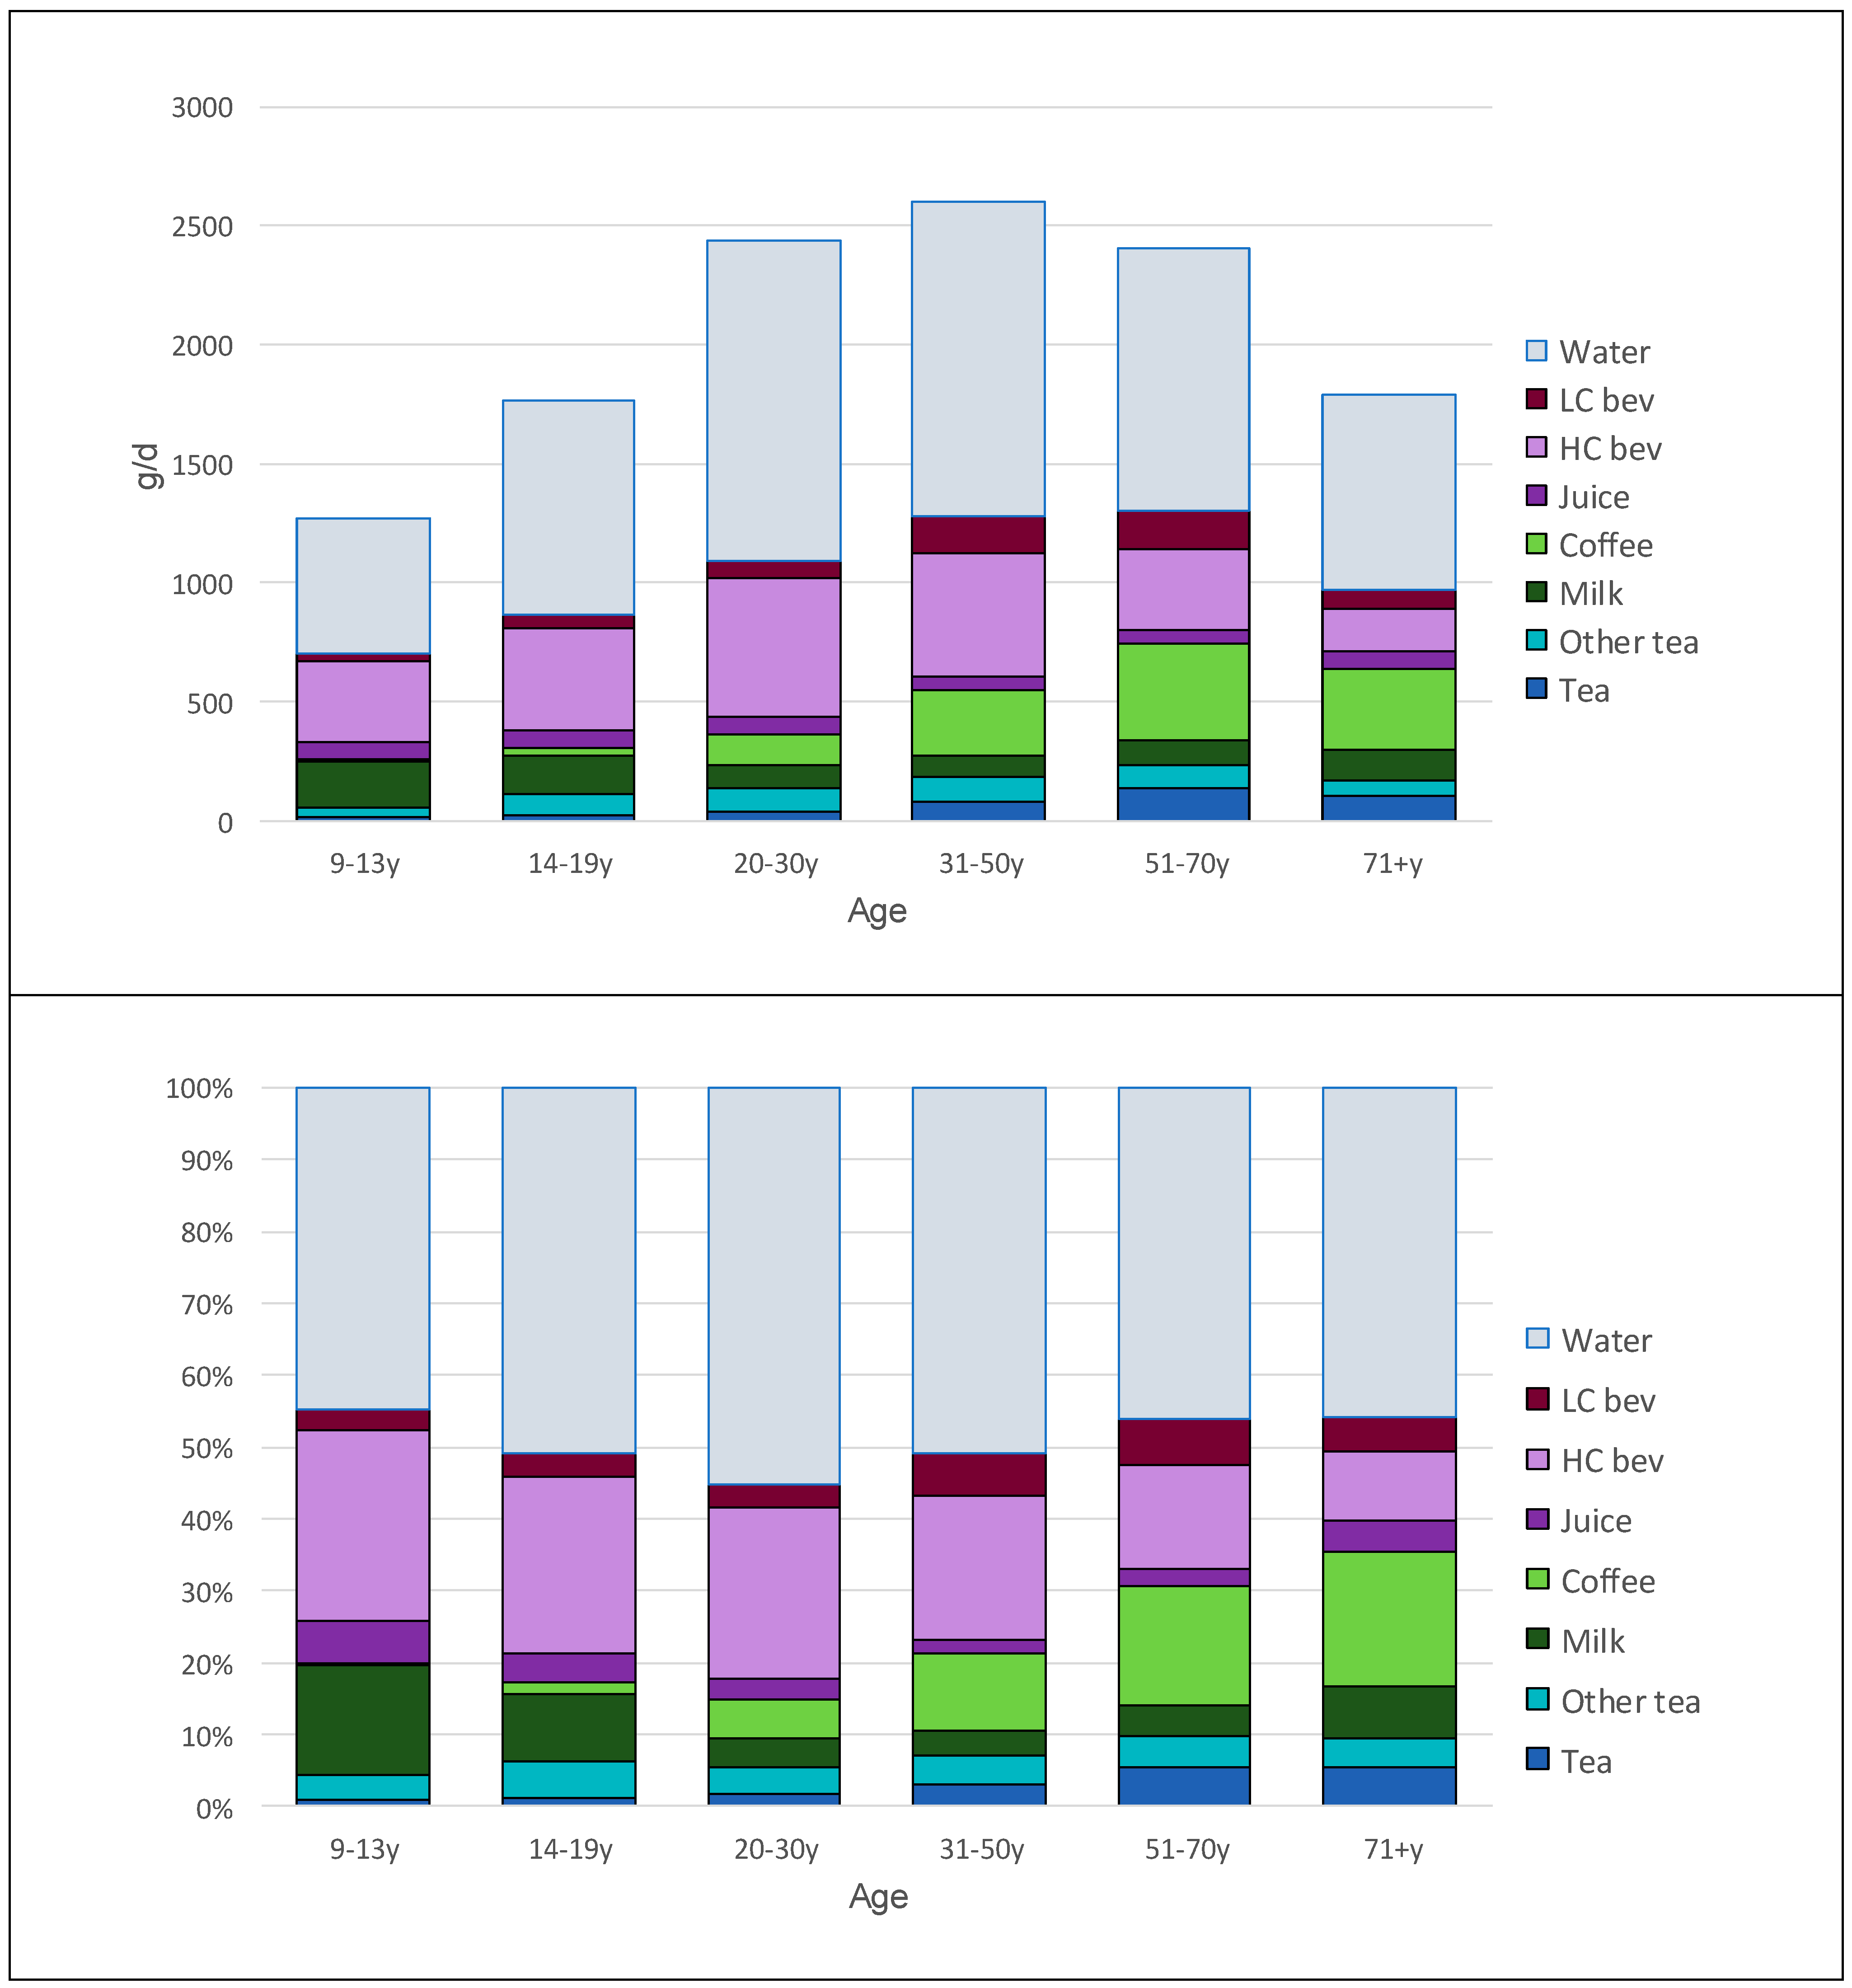
3.1. Tea Consumption by Age and Socio-Demographics
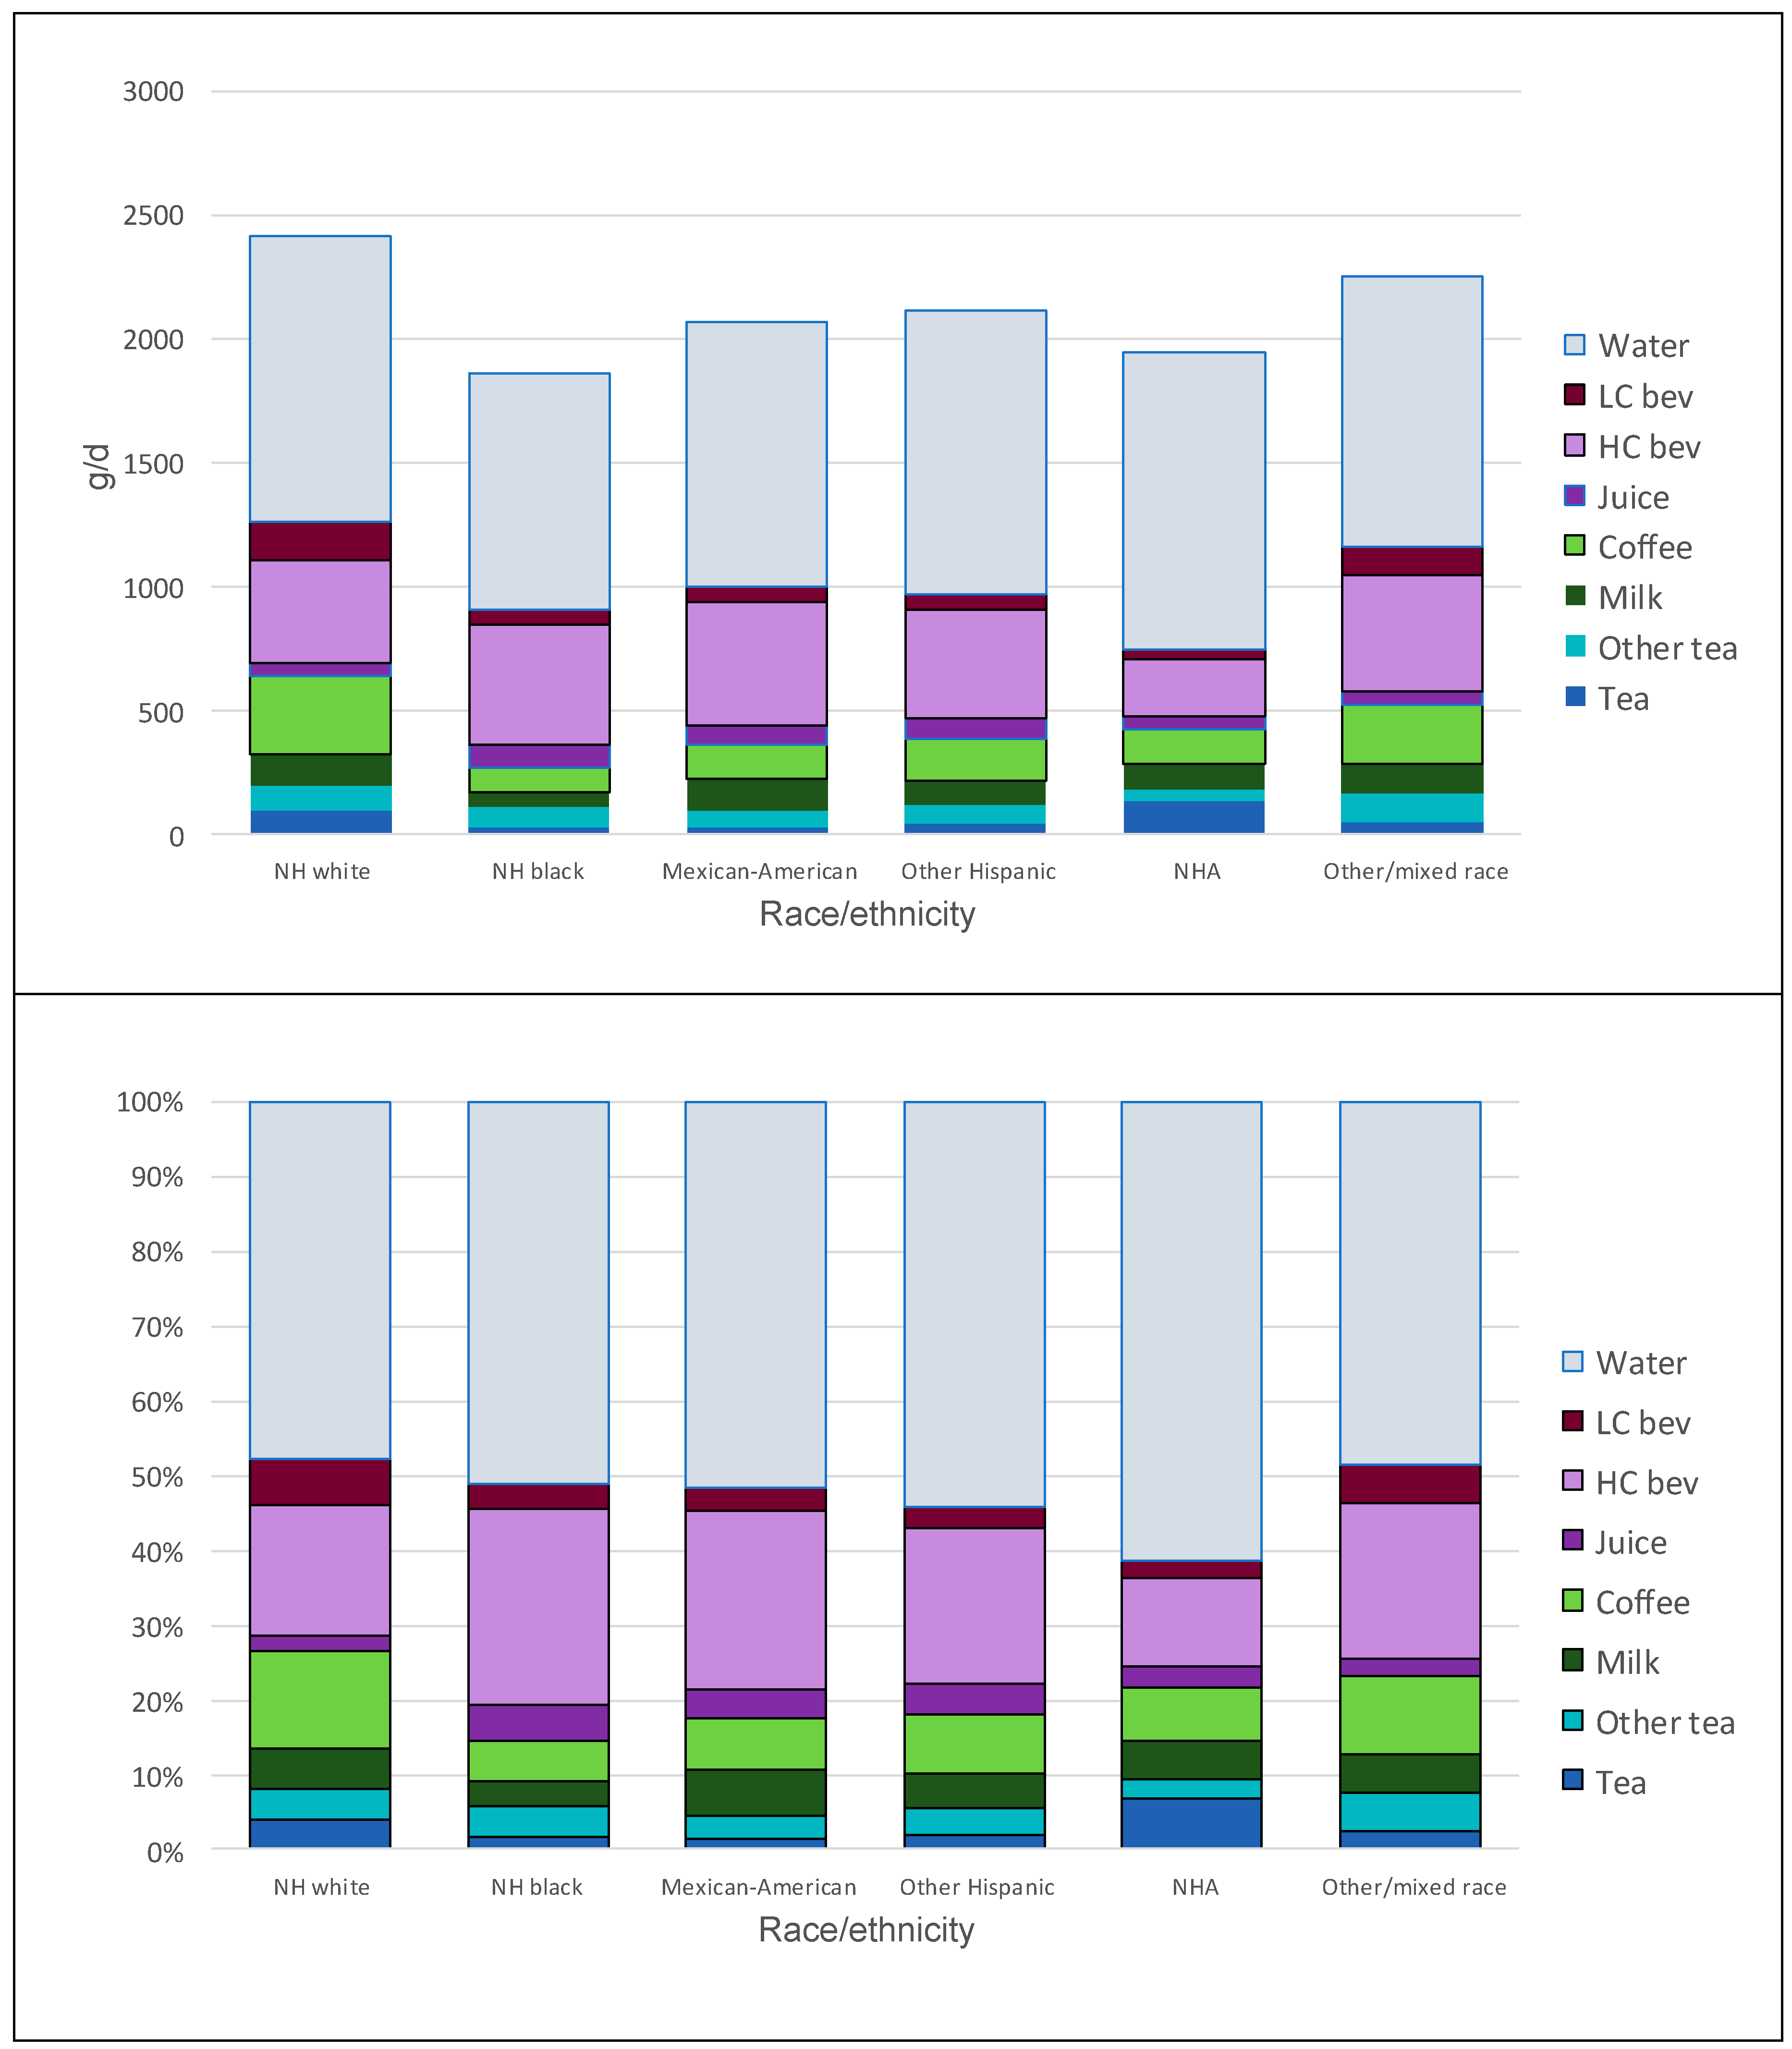
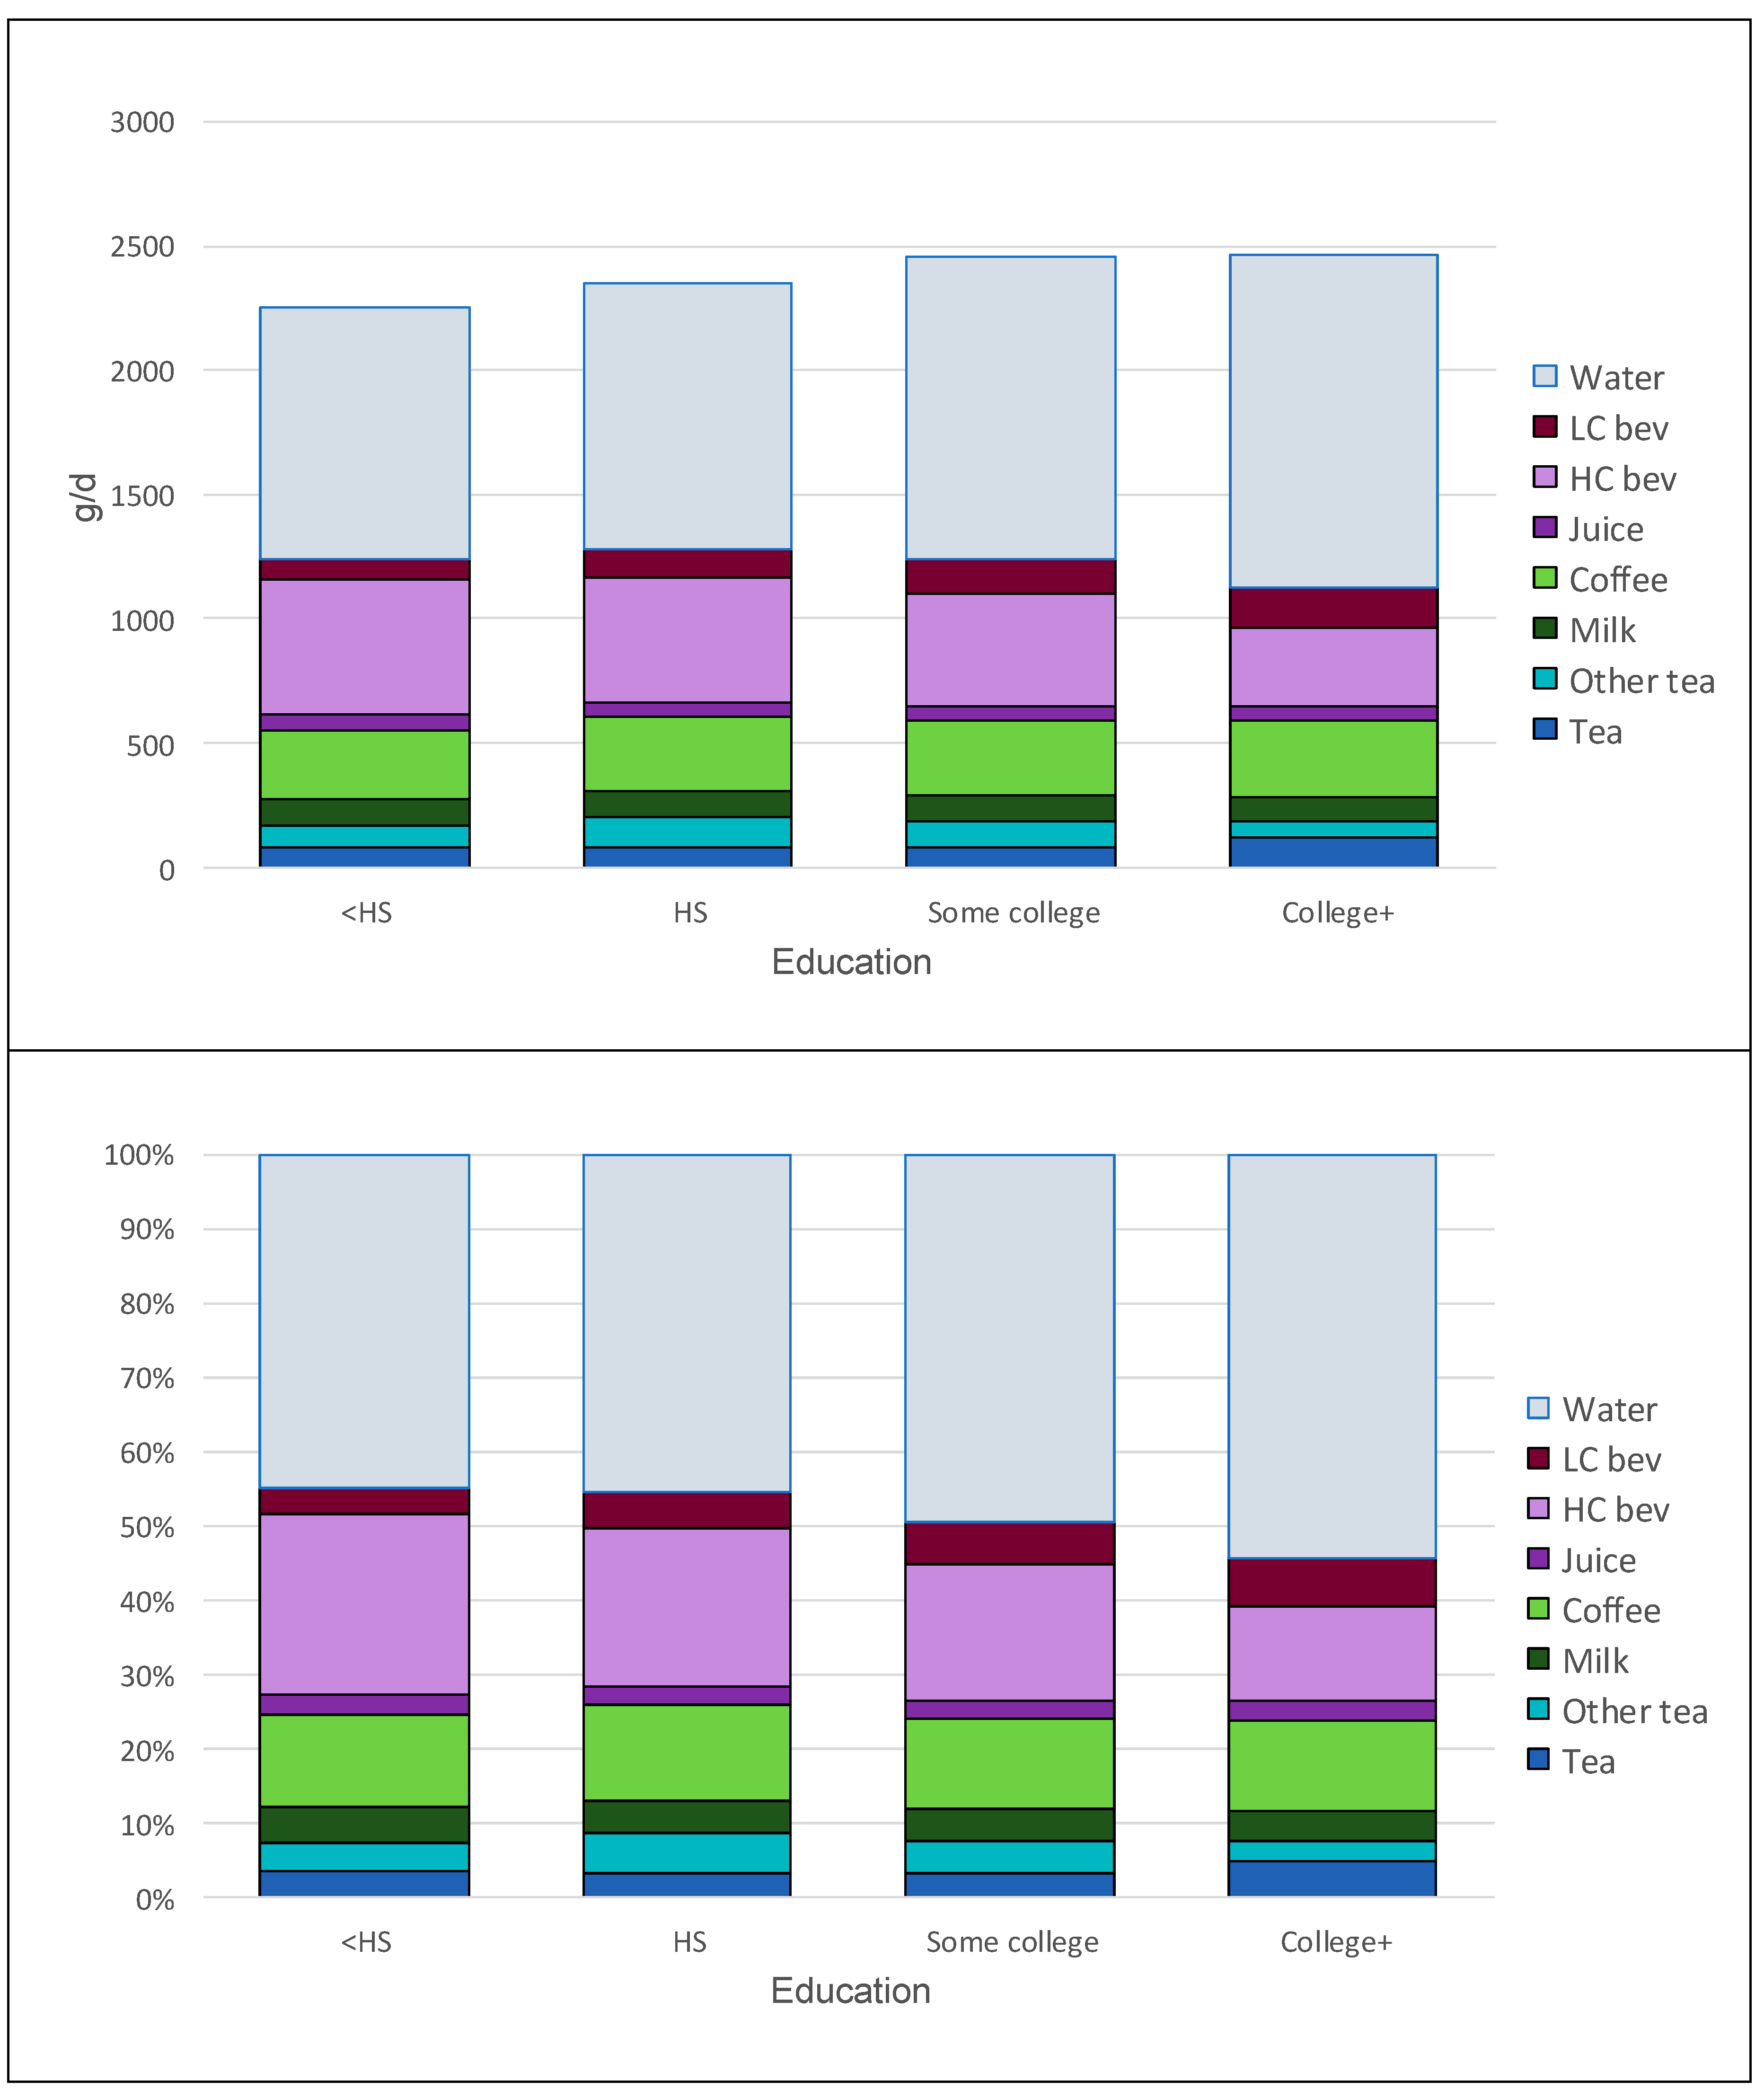
3.2. Tea and Other Beverage Consumption by Socio-Demographics
3.3. Tea Consumption in Relation to Other Beverages
3.4. Tea Consumption and Diet Quality
3.5. Tea Consumption in Relation to Health Outcomes
4. Discussion
5. Conclusions
Author Contributions
Funding
Conflicts of Interest
References
- Grigg, D. The worlds of tea and coffee: Patterns of consumption. GeoJournal 2002, 57, 283–294. [Google Scholar] [CrossRef]
- Hayat, K.; Iqbal, H.; Malik, U.; Bilal, U.; Mushtaq, S. Tea and its consumption: Benefits and risks. Crit. Rev. Food Sci. Nutr. 2015, 55, 939–954. [Google Scholar] [CrossRef] [PubMed]
- Landais, E.; Moskal, A.; Mullee, A.; Nicolas, G.; Gunte, M.J.; Huybrechts, I.; Overvad, K.; Roswall, N.; Affret, A.; Fagherazz, G.; et al. Coffee and tea consumption and the contribution of their added ingredients to total energy and nutrient intakes in 10 European countries: Benchmark data from the late 1990s. Nutrients 2018, 10, 725. [Google Scholar] [CrossRef] [PubMed]
- Lieberman, H.R.; Agarwal, S.; Fulgoni, V.L. Daily patterns of caffeine intake and the association of intake with multiple sociodemographic and lifestyle factors in US adults Based on the NHANES 2007–2012 Surveys. J. Acad. Nutr. Diet. 2019, 119, 106–114. [Google Scholar] [CrossRef] [PubMed]
- Drewnowski, A.; Rehm, C.D.; Constant, F. Water and beverage consumption among adults in the United States: Cross-sectional study using data from NHANES 2005–2010. BMC Public Health 2013, 13, 1068. [Google Scholar] [CrossRef]
- Drewnowski, A.; Rehm, C.D.; Constant, F. Water and beverage consumption among children age 4–13y in the United States: Analyses of 2005–2010 NHANES data. Nutr. J. 2013, 12, 85. [Google Scholar] [CrossRef]
- Drewnowski, A.; Rehm, C.D. Socioeconomic gradient in consumption of whole fruit and 100% fruit juice among US children and adults. Nutr. J. 2015, 14, 3. [Google Scholar] [CrossRef]
- Song, W.O.; Chun, O.K. Tea is the major source of flavan-3-ol and flavonol in the U.S. diet. J. Nutr. 2008, 138, 1543S–1547S. [Google Scholar] [CrossRef]
- Greyling, A.; Ras, R.T.; Zock, P.L.; Lorenz, M.; Hopman, M.T.; Thijssen, D.H.J.; Draijer, R. The effect of black tea on blood pressure: A systematic review with meta-analysis of randomized controlled trials. PLoS ONE 2014, 9, e103247. [Google Scholar] [CrossRef]
- Kim, K.; Vance, T.M.; Chun, O.K. Greater flavonoid intake is associated with improved CVD risk factors in US adults. Br. J. Nutr. 2016, 115, 1481–1488. [Google Scholar] [CrossRef]
- McKay, D.L.; Blumberg, J.B. The role of tea in human health: An Update. J. Am. Coll. Nutr. 2002, 21, 1–13. [Google Scholar] [CrossRef] [PubMed]
- Bai, W.; Wang, C.; Ren, C. Intakes of total and individual flavonoids by US adults. Int. J. Food Sci. Nutr. 2014, 65, 9–20. [Google Scholar] [CrossRef] [PubMed]
- Ivey, K.L.; Hodgson, J.M.; Croft, K.D.; Lewis, J.R.; Prince, R.L. Flavonoid intake and all-cause mortality. Am. J. Clin. Nutr. 2015, 101, 1012–1020. [Google Scholar] [CrossRef] [PubMed]
- Hodgson, J.M.; Puddey, I.B.; Burke, V.; Beilin, L.J.; Jordan, N. Effects on blood pressure of drinking green and black tea. J. Hypertens. 1999, 17, 457–463. [Google Scholar] [CrossRef] [PubMed]
- Hodgson, J.M.; Croft, K.D. Tea flavonoids and cardiovascular health. Mol. Asp. Med. 2010, 31, 495–502. [Google Scholar] [CrossRef]
- Khalesi, S.; Sun, J.; Buys, N.; Jamshidi, A.; Nikbakht-Nasrabadi, E.; Khosravi-Boroujeni, H. Green tea catechins and blood pressure: A systematic review and meta-analysis of randomised controlled trials. Eur. J. Nutr. 2014, 53, 1299–1311. [Google Scholar] [CrossRef]
- Naumovski, N.; Foscolou, A.; D’Cunha, N.M.; Tyrovolas, S.; Chrysohoou, C.; Sidossis, L.S.; Rallidis, L.; Matalas, A.L.; Polychronopoulos, E.; Pitsavos, C.; et al. The association between green and black tea consumption on successful aging: A combined analysis of the Attica and Mediterranean Islands (MEDIS) epidemiological studies. Molecules 2019, 24, 1862. [Google Scholar] [CrossRef]
- Ivey, K.L.; Jensen, M.K.; Hodgson, J.M.; Eliassen, A.H.; Cassidy, A.; Rimm, E.B. Association of flavonoid-rich foods and flavonoids with risk of all-cause mortality. Br. J. Nutr. 2017, 117, 1470–1477. [Google Scholar] [CrossRef]
- National Center for Health Statistics NHANES—About the National Health and Nutrition Examination Survey. Available online: https://www.cdc.gov/nchs/nhanes/about_nhanes.htm (accessed on 22 July 2019).
- Moshfegh, A.J.; Rhodes, D.G.; Baer, D.J.; Murayi, T.; Clemens, J.C.; Rumpler, W.V.; Paul, D.R.; Sebastian, R.S.; Kuczynski, K.J.; Ingwersen, L.A.; et al. The US Department of Agriculture Automated Multiple-Pass Method reduces bias in the collection of energy intakes. Am. J. Clin. Nutr. 2008, 88, 324–332. [Google Scholar] [CrossRef]
- Center for Health Statistics. NHANES Phone Follow-up Dietary Interviewer Procedures Manual. Available online: https://www.cdc.gov/nchs/data/nhanes/nhanes_09_10/phone_follow_up_dietary_procedures_manual_mar_2010.pdf (accessed on 23 July 2019).
- U.S. Department of Agriculture. A.R.S. USDA Food and Nutrient Database for Dietary Studies 2013–2014. Food Surveys Research Group Home Page. Available online: https://data.nal.usda.gov/dataset/food-and-nutrient-database-dietary-studies-fndds (accessed on 23 July 2019).
- Bowman, S.A.; Clemens, J.C.; Thoerig, R.C.; Friday, J.E.; Shimizu, M.; Moshfegh, A.J. Food Patterns Equivalents Database 2009–10: Methodology and User Guide; Food Surveys Research Group, Beltsville Human Nutrition Research Center, Agricultural Research Service, United States Department of Agriculture: Washington, DC, USA, 2013.
- Krebs-Smith, S.M.; Pannucci, T.E.; Subar, A.F.; Kirkpatrick, S.I.; Lerman, J.L.; Tooze, J.A.; Wilson, M.M.; Reedy, J. Update of the healthy eating index: HEI-2015. J. Acad. Nutr. Diet. 2018, 118, 1591–1602. [Google Scholar] [CrossRef]
- Vieux, F.; Maillot, M.; Rehm, C.D.; Drewnowski, A. Designing optimal breakfast for the United States using linear programming and the NHANES 2011–2014 database: A Study from the International Breakfast Research Initiative (IBRI). Nutrients 2019, 11, 1374. [Google Scholar] [CrossRef] [PubMed]
- Centers for Disease Control and Prevention. NHANES—NCHS Research Ethics Review Board Approval. Available online: https://www.cdc.gov/nchs/nhanes/irba98.htm (accessed on 23 July 2019).
- Centers for Disease Control and Prevention. NHANES—National Health and Nutrition Examination Survey Homepage. Available online: https://www.cdc.gov/nchs/nhanes/index.htm (accessed on 23 July 2019).
- US Department of Health and Human Services. Dietary Guidelines for Americans 2015–2020; Skyhorse Publishing Inc.: New York, NY, USA, 2017; ISBN 9780160934650.
- Drewnowski, A.; Dwyer, J.; King, J.C.; Weaver, C.M. A proposed nutrient density score that includes food groups and nutrients to better align with dietary guidance. Nutr. Rev. 2019, 77, 404–416. [Google Scholar] [CrossRef] [PubMed]
- Panche, A.N.; Diwan, A.D.; Chandra, S.R. Flavonoids: An overview. J. Nutr. Sci. 2019, 5. [Google Scholar] [CrossRef] [PubMed]
- Sebastian, R.S.; Wilkinson Enns, C.; Goldman, J.D.; Martin, C.L.; Steinfeldt, L.C.; Murayi, T.; Moshfegh, A.J. A new database facilitates characterization of flavonoid intake. Sources. and positive associations with diet quality among US adults. J. Nutr. 2015, 145, 1239–1248. [Google Scholar] [CrossRef]
- Popkin, B.M.; Armstrong, L.E.; Bray, G.M.; Caballero, B.; Frei, B.; Willett, W.C. A new proposed guidance system for beverage consumption in the United States. Am. J. Clin. Nutr. 2006, 83, 529–542. [Google Scholar] [CrossRef]
- Rivera, J.A.; Muñoz-Hernández, O.; Rosas-Peralta, M.; Aguilar-Salinas, C.A.; Popkin, B.M.; Willett, W.C. Drink consumption for a healthy life: Recommendations for the general population in Mexico. Gac. Med. Mex. 2008, 144, 369–388. [Google Scholar]
- Peluso, I.; Serafini, M. Antioxidants from black and green tea: From dietary modulation of oxidative stress to pharmacological mechanisms. Br. J. Pharmacol. 2017, 174, 1195–1208. [Google Scholar] [CrossRef]
- Peterson, J.J.; Dwyer, J.T.; Jacques, P.F.; Mccullough, M.L. Associations between flavonoids and cardiovascular disease incidence or mortality in European and US populations. Nutr. Rev. 2012, 70, 491–508. [Google Scholar] [CrossRef]
- Zhao, Y.; Asimi, S.; Wu, K.; Zheng, J.; Li, D. Black tea consumption and serum cholesterol concentration: Systematic review and meta-analysis of randomized controlled trials. Clin. Nutr. 2015, 34, 612–619. [Google Scholar] [CrossRef]
- Pan, C.-W.; Ma, Q.; Sun, H.-P.; Xu, Y.; Luo, N.; Wang, P. Tea consumption and health-related quality of life in older adults. J. Nutr. Health Aging 2017, 21, 480–486. [Google Scholar] [CrossRef]
- Yarmolinsky, J.; Gon, G.; Edwards, P. Effect of tea on blood pressure for secondary prevention of cardiovascular disease: A systematic review and meta-analysis of randomized controlled trials. Nutr. Rev. 2015, 73, 236–246. [Google Scholar] [CrossRef] [PubMed]


| N | Consumers % | Amounts Grams (SD) | Obesity Prevalence % [Confidence Intervals] | ||
|---|---|---|---|---|---|
| Gender | Male | 8425 | 16.06 | 75.13 (6.72) | 31.43 [29.68;33.18] |
| Female | 9081 | 20.73 | 82.34 (5.36) | 35.33 [33.53;37.13] | |
| Test | <0.0001 | 0.2266 | <0.0001 | ||
| Age (year) | 9–13 | 2176 | 5.21 | 10.11 (2.04) | 5.76 [4.20,7.31] |
| 14–19 | 2339 | 8.04 | 20.85 (3.81) | 17.84 [14.89,20.78] | |
| 20–30 | 2370 | 11.91 | 39.67 (5.51) | 30.57 [27.77,33.36] | |
| 31–50 | 4391 | 17.73 | 74.83 (5.51) | 39.32 [36.95;41.70] | |
| 51–70 | 4368 | 26.67 | 133.55 (12.42) | 41.26 [38.28;44.25] | |
| 71+ | 1862 | 26.98 | 98.87 (6.91) | 32.77 [29.81;35.73] | |
| Test | <0.0001 | <0.0001 | <0.0001 | ||
| Race/Ethnicity | Non-Hispanic White | 6351 | 20.44 | 95.82 (7.15) | 32.58 [30.82;34.34] |
| Non-Hispanic Black | 4120 | 10.88 | 29.44 (3.21) | 42.33 [40.04;44.62] | |
| Mexican American | 2656 | 10.32 | 29.73 (3.41) | 38.02 [35.53;40.51] | |
| Other Hispanic | 1827 | 12.98 | 40.66 (5.73) | 35.15 [32.54;37.75] | |
| Non-Hispanic Asian | 1872 | 34.20 | 131.41 (9.83) | 11.55 [9.73;13.37] | |
| Other-Mix | 680 | 16.56 | 52.93 (13.24) | 36.81 [30.43;43.18] | |
| <0.0001 | <0.0001 | <0.0001 | |||
| Family income-to-poverty ratio (IPR) | <1 | 4008 | 10.55 | 42.6 (4.37) | 34.55 [32.32;36.77] |
| 1–1.99 | 4262 | 16.05 | 63.16 (7.53) | 36.89 [34.24;39.55] | |
| 2–3.49 | 3327 | 18.49 | 73.48 (7.12) | 33.30 [31.08;35.52] | |
| 3.5+ | 4554 | 23.31 | 107.43 (9.18) | 31.04 [28.39;33.69] | |
| Missing | 1355 | 17.62 | 68.24 (10.25) | 34.68 [30.68;38.67] | |
| Test | <0.0001 | <0.0001 | 0.002 | ||
| Education (adults only) | <High school | 2679 | 15.66 | 76.05 (16.05) | 40.88 [38.68;43.08] |
| High school | 2852 | 17.62 | 78.29 (8.14) | 41.13 [37.55;44.72] | |
| Some college | 3994 | 19.18 | 80.7 (7.82) | 42.22 [39.51;44.93] | |
| College+ | 3459 | 26.75 | 116.87 (8.63) | 28.77 [26.15;31.40] | |
| Test | <0.0001 | 0.0015 | <0.0001 |
| Tea Non-Consumers (N = 10,386) | Tea Consumers (N = 2605) | ||||
|---|---|---|---|---|---|
| T1 [0;0.85] | T2 [0.85;1.77] | T3 > 1.77 | p-Value | ||
| Tea | −2.87 | 130.00 | 285.5 | 874.05 | <0.0001 a,b,c |
| Other tea | 85.31 | 86.83 | 87.25 | 95.21 | 0.9083 |
| Milk | 95.37 | 99.83 | 82.70 | 70.99 | 0.0018 c |
| Coffee | 261.30 | 226.01 | 200.24 | 111.97 | <0.0001 b,c |
| Juice | 69.82 | 63.93 | 57.02 | 63.68 | 0.0801 |
| Water | 1131.92 | 1157.15 | 1054.27 | 1115.73 | 0.2041 |
| HC beverages | 443.30 | 328.79 | 348.07 | 309.94 | <0.0001 a,b,c |
| LC beverages | 89.60 | 79.85 | 65.50 | 65.73 | 0.4682 |
| Children/Teenagers | Adults | |||||||
|---|---|---|---|---|---|---|---|---|
| Non Consumers (N = 4229) | Consumers (N = 286) | p-Value (Unadjusted) | p-Value Adjusted * | Non Consumers (N = 10,386) | Consumers (N = 2605) | p-Value (Unadjusted) | p-Value Adjusted * | |
| Energy (kcal/d) | 1999 | 1914 | 0.0917 | 0.0397 | 2092 | 1977 | <0.0001 | 0.2633 |
| Protein (g/2000 kcal) | 76.06 | 78.36 | 0.2678 | 0.3919 | 80.80 | 83.39 | 0.0015 | 0.0066 |
| Total sugar (g/2000 kcal) | 117.36 | 113.94 | 0.1782 | 0.2696 | 105.53 | 98.28 | <0.0001 | 0.0003 |
| Added sugar (tsp/2000 kcal) | 17.83 | 17.59 | 0.7575 | 0.7800 | 15.80 | 12.94 | <0.0001 | <0.0001 |
| Saturated fat (g/2000 kcal) | 25.49 | 25.56 | 0.9023 | 0.9108 | 24.50 | 24.18 | 0.1849 | 0.2234 |
| Sodium (mg/2000 kcal) | 3410 | 3537 | 0.0870 | 0.2113 | 3425 | 3511 | 0.0039 | 0.0403 |
| Fiber (g/2000 kcal) | 15.26 | 16.58 | 0.0083 | 0.0098 | 17.16 | 19.60 | <0.0001 | <0.0001 |
| Vitamin D (mcg/2000 kcal) | 5 | 5 | 0.2032 | 0.1951 | 5 | 5 | 0.0169 | 0.4788 |
| Vitamin A (mcg/2000 kcal) | 618 | 755 | 0.5244 | 0.4779 | 666 | 726 | 0.0042 | 0.9421 |
| Vitamin E (mg/2000 kcal) | 7 | 8 | 0.6477 | 0.8068 | 9 | 10 | <0.0001 | 0.0009 |
| Vitamin C (mg/2000 kcal) | 74 | 75 | 0.8483 | 0.5167 | 85 | 94 | 0.0004 | 0.1731 |
| Calcium (mg/2000 kcal) | 1060 | 1053 | 0.8716 | 0.7620 | 961 | 960 | 0.9300 | 0.3830 |
| Potassium (mg/2000 kcal) | 2326 | 2419 | 0.0784 | 0.0946 | 2669 | 2963 | <0.0001 | <0.0001 |
| Iron (mg/2000 kcal) | 15 | 16 | 0.6927 | 0.6249 | 14 | 15 | <0.0001 | 0.0008 |
| Magnesium (mg/2000 kcal) | 253 | 271 | 0.0085 | 0.0177 | 303 | 333 | <0.0001 | <0.0001 |
| NR9 subscore | 550.89 | 556.25 | 0.5744 | 0.4428 | 559.24 | 597.20 | <0.0001 | <0.00001 |
| LIM subscore | 79.55 | 85.04 | 0.1146 | 0.2814 | 77.54 | 80.14 | 0.0666 | 0.2627 |
| NRF9.3 score | 471.34 | 471.21 | 0.9898 | 0.7522 | 481.70 | 517.05 | <0.0001 | 0.0004 |
| All | Non-consumers (N = 14,615) | Consumers (N = 2891) | p-value |
| HEI-2015 | 50.51 | 54.89 | <0.0001 |
| Adjusted for gender, age, ethnicity, and IPR * | 50.96 | 53.18 | <0.0001 |
| Adjusted for gender, age, ethnicity, IPR, and energy * | 50.96 | 53.18 | <0.0001 |
| Children | Non-consumers (N = 4229) | Consumers (N = 286) | p-value |
| HEI-2015 | 46.74 | 47.25 | 0.6472 |
| Adjusted for gender, age, ethnicity, and IPR * | 47.70 | 48.25 | 0.6079 |
| Adjusted for gender, age, ethnicity, IPR, and energy * | 47.70 | 48.21 | 0.6313 |
| Adults | Non-consumers (N = 10,386) | Consumers (N = 2605) | p-value |
| HEI-2015 | 51.37 | 55.37 | <0.0001 |
| Adjusted for gender, age, ethnicity, IPR, and education * | 51.94 | 53.90 | <0.0001 |
| Adjusted for gender, age, ethnicity, IPR, education, and energy * | 51.94 | 53.90 | <0.0001 |
| Unadjusted | Adjusted Model 1 | ** Adjusted Model 2 | |||||||
|---|---|---|---|---|---|---|---|---|---|
| Non Consumers (N = 10,386) | Consumers (N = 2605) | p-Value | Non Consumers (N = 10,386) | Consumers (N = 2605) | p-Value * | Non Consumers (N = 10,386) | Consumers (N = 2605) | p-Value ** | |
| Total fruit (cups/day) | 0.96 (0.02) | 1.13 (0.04) | 0.0003 | 0.95 (0.02) | 1.14 (0.04) | <0.0001 | 1.04 (0.04) | 1.15 (0.04) | 0.0233 |
| Citrus (cups/day) | 0.21 (0.01) | 0.30 (0.02) | 0.0004 | 0.21 (0.01) | 0.30 (0.02) | 0.0002 | 0.24 (0.03) | 0.29 (0.03) | 0.0292 |
| Other (cups/day) | 0.48 (0.02) | 0.61 (0.02) | <0.0001 | 0.48 (0.01) | 0.62 (0.02) | <0.0001 | 0.51 (0.02) | 0.59 (0.02) | 0.0073 |
| Juice (cups/day) | 0.26 (0.01) | 0.22 (0.02) | 0.0091 | 0.26 (0.01) | 0.22 (0.02) | 0.0356 | 0.30 (0.01) | 0.27 (0.02 | 0.163 |
| Total vegetables (cups/day) | 1.52 (0.02) | 1.73 (0.03) | <0.0001 | 1.50 (0.02) | 1.75 (0.03) | <0.0001 | 1.47 (0.02) | 1.62 (0.04) | 0.0002 |
| Dark greens (cups/day) | 0.16 (0.01) | 0.21 (0.01) | 0.0003 | 0.16 (0.01) | 0.21 (0.01) | 0.0003 | 0.16 (0.01) | 0.19 (0.01) | 0.0469 |
| Red orange (cups/day) | 0.39 (0.01) | 0.43 (0.01) | 0.0053 | 0.38 (0.01) | 0.43 (0.01) | <0.0001 | 0.36 (0.01) | 0.39 (0.01) | 0.0205 |
| Other (cups/day) | 0.55 (0.01) | 0.66 (0.02) | <0.0001 | 0.54 (0.01) | 0.67 (0.02) | <0.0001 | 0.54 (0.01) | 0.61 (0.02) | 0.002 |
| Total grains (oz/day) | 6.44 (0.05) | 6.34 (0.09) | 0.321 | 6.24 (0.04) | 6.49 (0.06) | 0.0007 | 6.54 (0.05) | 6.84 (0.07) | 0.0001 |
| Whole grains (oz/day) | 0.96 (0.02) | 1.11 (0.03) | 0.0007 | 0.94 (0.02) | 1.12 (0.03) | <0.0001 | 0.93 (0.03) | 0.10 (0.04) | 0.1184 |
| Refined grains (oz/day) | 5.48 (0.05) | 5.23 (0.09) | 0.0077 | 5.30 (0.04) | 5.36 (0.06) | 0.3515 | 5.60 (0.05) | 5.84 (0.06) | 0.0005 |
| Protein foods (oz/day) | 6.19 (0.06) | 6.14 (0.12) | 0.7173 | 6.03 (0.05) | 6.26 (0.11) | 0.043 | 6.26 (0.07) | 6.47 (0.11) | 0.063 |
| Eggs (oz/day) | 0.55 (0.01) | 0.58 (0.02) | 0.2336 | 0.54 (0.01) | 0.59 (0.02) | 0.0339 | 0.57 (0.01) | 0.63 (0.02) | 0.0315 |
| Soy (oz/day) | 0.08 (0.01) | 0.11 (0.01) | 0.007 | 0.08 (0.01) | 0.11 (0.01) | 0.0036 | 0.07 (0.01) | 0.09 (0.01) | 0.0138 |
| Nuts/seeds (oz/day) | 0.78 (0.04) | 0.91 (0.04) | 0.0017 | 0.75 (0.03) | 0.94 (0.04) | <0.0001 | 0.68 (0.04) | 0.72 (0.04) | 0.3866 |
| Total legumes (oz/day) | 0.12 (0.00) | 0.11 (0.01) | 0.1048 | 0.12 (0.00) | 0.12 (0.01) | 0.5213 | 0.16 (0.01) | 0.16 (0.01) | 0.952 |
| Total dairy (cups/day) | 1.58 (0.02) | 1.45 (0.03) | <0.0001 | 1.53 (0.02) | 1.48 (0.03) | 0.0863 | 1.36 (0.02) | 1.30 (0.03) | 0.0398 |
| Oils (g/day) | 26.14 (0.30) | 26.89 (0.40) | 0.108 | 25.30 (0.23) | 27.51 (0.34) | <0.0001 | 24.81 (0.28) | 26.28 (0.42) | 0.0022 |
| Solid fats (g/day) | 34.88 (0.37) | 31.99 (0.60) | <0.0001 | 33.61 (0.23) | 32.92 (0.48) | 0.1509 | 32.00 (0.27) | 31.49 (0.41) | 0.24 |
| Added sugars (tsp/day) | 16.86 (0.25) | 13.21 (0.32) | <0.0001 | 16.27 (0.23) | 13.65 (0.29) | <0.0001 | 15.76 (0.27) | 14.19 (0.30) | <0.0001 |
| Alcohol (servings/day) | 0.71 (0.02) | 0.47 (0.03) | <0.0001 | 0.67 (0.02) | 0.50 (0.03) | <0.0001 | 0.53 (0.02) | 0.35 (0.03) | <0.0001 |
| N | Non-Consumers | Consumers | p-Value (Unadjusted) | |
|---|---|---|---|---|
| High-density lipoprotein (HDL) Cholesterol | ||||
| Direct HDL Cholesterol (mg/dL) | 12,416 | 53.49 (0.34) | 55.41 (0.51) | 0.0013 |
| Direct HDL Cholesterol (mmol/L) | 12,416 | 1.38 (0.01) | 1.43 (0.01) | 0.0012 |
| Triglyceride and LDL cholesterol | ||||
| Triglyceride (mg/dL) | 5900 | 121.7 (1.86) | 125.88 (3.71) | 0.3097 |
| Triglyceride (mmol/L) | 5900 | 1.37 (0.02) | 1.42 (0.04) | 0.3096 |
| LDL cholesterol (mg/dL) | 5817 | 113.99 (0.87) | 115.75 (1.22) | 0.2235 |
| LDL cholesterol (mmol/L) | 5817 | 2.95 (0.02) | 2.99 (0.03) | 0.2237 |
| Blood pressure | ||||
| Average systolic blood pressure (mmHg) | 12,725 | 122.21 (0.33) | 123.52 (0.66) | 0.0617 |
| Average diastolic blood pressure (mmHg) | 12,691 | 70.54 (0.25) | 70.41 (0.4) | 0.7097 |
| Body weight | ||||
| Body mass index | 12,711 | 29.29 (0.13) | 28.70 (0.28) | 0.0389 |
© 2019 by the authors. Licensee MDPI, Basel, Switzerland. This article is an open access article distributed under the terms and conditions of the Creative Commons Attribution (CC BY) license (http://creativecommons.org/licenses/by/4.0/).
Share and Cite
Vieux, F.; Maillot, M.; Rehm, C.D.; Drewnowski, A. Tea Consumption Patterns in Relation to Diet Quality among Children and Adults in the United States: Analyses of NHANES 2011–2016 Data. Nutrients 2019, 11, 2635. https://doi.org/10.3390/nu11112635
Vieux F, Maillot M, Rehm CD, Drewnowski A. Tea Consumption Patterns in Relation to Diet Quality among Children and Adults in the United States: Analyses of NHANES 2011–2016 Data. Nutrients. 2019; 11(11):2635. https://doi.org/10.3390/nu11112635
Chicago/Turabian StyleVieux, Florent, Matthieu Maillot, Colin D. Rehm, and Adam Drewnowski. 2019. "Tea Consumption Patterns in Relation to Diet Quality among Children and Adults in the United States: Analyses of NHANES 2011–2016 Data" Nutrients 11, no. 11: 2635. https://doi.org/10.3390/nu11112635
APA StyleVieux, F., Maillot, M., Rehm, C. D., & Drewnowski, A. (2019). Tea Consumption Patterns in Relation to Diet Quality among Children and Adults in the United States: Analyses of NHANES 2011–2016 Data. Nutrients, 11(11), 2635. https://doi.org/10.3390/nu11112635