Single Nucleotide Polymorphisms in PEMT and MTHFR Genes are Associated with Omega 3 and 6 Fatty Acid Levels in the Red Blood Cells of Children with Obesity

 , ,
, ,
Abstract
1. Introduction
2. Materials and Methods
2.1. Participants and Samples
2.2. Anthropometric Measurements
2.3. Food Intake
2.4. Hematological and Biochemical Tests
2.5. Fatty Acids Quantification
2.6. Preparation of Libraries for Next-Generation Sequencing
2.7. Analysis of Genetic Variants
2.8. Statistical Analyses
3. Results
4. Discussion
5. Conclusions
Author Contributions
Funding
Acknowledgments
Conflicts of Interest
Appendix A

| Fatty Acids (µmol/L) | Plasma Free | Plasma Conjugated | RBC | |||
|---|---|---|---|---|---|---|
| Median | IQR | Median | IQR | Median | IQR | |
| ALA | 3.72 | 4.27 | 16.47 | 15.42 | 1.41 | 1.02 |
| ARA | 7.15 | 4.31 | 375.51 | 156.61 | 354.22 | 168.25 |
| DHA | 6.13 | 4.52 | 271.70 | 159.49 | 160.13 | 116.52 |
| EPA | 0.24 | 0.14 | 7.23 | 5.39 | 2.86 | 2.12 |
| LA | 137.40 | 117.75 | 1208.13 | 462.86 | 209.49 | 135.82 |
| Gene | Rs Chr Position GRCh37 | AA/AB/BB | AA% | AB% | BB% |
|---|---|---|---|---|---|
| ABCB4 | rs1149222 chr7:87073775 | GG/GT/TT | 2.0 | 28.1 | 69.9 |
| rs2071645 chr7:87105276 | GG/GC/CC | 73.4 | 25.0 | 1.6 | |
| rs31672 chr7:87059699 | CC/CT/TT | 2.6 | 30.1 | 67.3 | |
| rs4148811 chr7:87101486 | TT/TG/GG | 73.5 | 24.5 | 2.0 | |
| rs9655950 chr7:87033561 | CC/CT/TT | 0.5 | 27.6 | 71.9 | |
| rs1202283 chr7:87082292 | GG/GA/AA | 16.0 | 49.5 | 34.5 | |
| APOC3 | rs2854117 chr11:116700142 | TT/TC/CC | 9.7 | 43.4 | 46.9 |
| CHDH | rs12676 chr3:53857803 | AA/AC/CC | 9.7 | 42.9 | 47.4 |
| rs2289209 chr3:53852835 | CC/CT/TT | 89.8 | 10.2 | 0.0 | |
| rs4563403 chr3:53850814 | CC/CT/TT | 78.6 | 21.4 | 0.0 | |
| rs4687591 chr3:53864407 | AA/AG/GG | 86.2 | 12.8 | 1.0 | |
| rs6807783 chr3:53859662 | GG/GC/CC | 65.3 | 31.1 | 3.6 | |
| rs7634578 chr3:53876728 | CC/CT/TT | 98.5 | 1.5 | 0.0 | |
| rs881883 chr3:53847805 | AA/AG/GG | 68.9 | 28.5 | 2.6 | |
| CHKB | rs1557502 chr22:51013998 | CC/CT/TT | 61.7 | 32.7 | 5.6 |
| rs1557503 chr22:51013072 | GG/GA/AA | 87.7 | 11.8 | 0.5 | |
| rs470117 chr22:51009953 | CC/CT/TT | 33.2 | 47.6 | 19.3 | |
| rs7238 chr22:51007488 | AA/AG/GG | 80.7 | 19.3 | 0.0 | |
| FADS2 | rs2526678chr1161623793 | GG/GA/AA | 82.1 | 17.9 | 0.0 |
| rs526126chr1161624885 | GG/GC/CC | 3.1 | 26.3 | 70.6 | |
| MTHFD1 | rs10135928 chr14:64866439 | TT/TC/CC | 95.4 | 4.6 | 0.0 |
| MTHFR | rs1801133 chr1:11856378 | GG/GA/AA | 43.4 | 43.4 | 13.3 |
| rs2066471 chr1:11860458 | CC/CT/TT | 68.4 | 29.6 | 2.0 | |
| rs4846048 chr1:11846252 | GG/GA/AA | 10.7 | 42.9 | 46.4 | |
| rs4846052 chr1:11857951 | TT/TC/CC | 16.9 | 49.7 | 33.3 | |
| rs7525338 chr1:11862332 | CC/CT/TT | 100.0 | 0.0 | 0.0 | |
| rs868014 chr1:11849447 | AA/AG/GG | 0.0 | 0.0 | 100.0 | |
| SCD | rs11557927 chr10:102121816 | TT/TG/GG | 88.8 | 10.7 | 0.5 |
| rs11599710 chr10:102105788 | GG/GA/AA | 89.3 | 10.2 | 0.5 | |
| rs12247426 chr10:102115327 | CC/CG/GG | 98.5 | 1.5 | 0.0 | |
| rs2167444 chr10:102124744 | TT/TA/AA | 74.5 | 22.4 | 3.1 | |
| rs7849 chr10:102122603 | TT/TC/CC | 69.6 | 25.8 | 4.6 | |
| SLC44A1 | rs10120572chr9108077756 | TT/TG/GG | 97.4 | 2.6 | 0.0 |
| rs10820799 chr9:108092216 | AA/AC/CC | 92.3 | 7.7 | 0.0 | |
| rs193008 chr9:108042806 | TT/TC/CC | 83.6 | 16.4 | 0.0 | |
| rs328006 chr9:108039808 | GG/GC/CC | 83.2 | 16.8 | 0.0 | |
| rs440290 chr9:107987290 | TT/TC/CC | 82.7 | 17.3 | 0.0 | |
| rs443094 chr9:108016685 | GG/GC/CC | 84.7 | 15.3 | 0.0 | |
| rs7018875 chr9:108077434 | CC/CA/AA | 95.4 | 4.6 | 0.0 | |
| STAT3 | rs9891119 chr17:40507980 | AA/AC/CC | 41.8 | 43.9 | 14.3 |
| PCYT1A | rs1580820 chr3:195966258 | GG/GA/AA | 0.5 | 20.9 | 78.6 |
| rs4898190 chrX:24607933 | AA/AC/CC | 1.5 | 6.7 | 91.8 | |
| PEMT | rs1109859chr1717424333 | GG/GA/AA | 6.2 | 34.9 | 59.0 |
| rs12103822 chr17:17418432 | CC/CG/GG | 99.5 | 0.5 | 0.0 | |
| rs16961845 chr17:17432456 | CC/CT/TT | 83.2 | 16.3 | 0.5 | |
| rs4244593 chr17:17420218 | TT/TG/GG | 20.0 | 51.8 | 28.2 | |
| rs4479310 chr17:17405504 | CC/CT/TT | 12.2 | 43.9 | 43.9 | |
| rs7214988 chr17:17491836 | CC/CG/GG | 83.2 | 16.3 | 0.5 | |
| rs7946 chr17:17409560 | CC/CT/TT | 13.3 | 44.1 | 42.6 | |
| rs8068641chr1717480187 | AA/AG/GG | 78.6 | 20.9 | 0.5 | |
| rs936108 chr17:17439793 | CC/CT/TT | 26.5 | 52.0 | 21.4 | |
| rs13342397 chr17:17460926 | TT/TC/CC | 79.5 | 19.9 | 0.6 | |
| rs6502603 chr17:17445680 | GG/GT/TT | 26.0 | 52.6 | 21.4 | |
| PNPLA3 | rs2281135 chr22:44332570 rs738409 chr22:44324727 | GG/GA/AA CC/CG/GG | 64.3 52.8 | 33.7 21.1 | 2.0 26.1 |
| rs1109859 in PEMT gene | |||||
| ALA | ARA | DHA | EPA | LA | |
| GG/GA | 0.978 | 0.524 | 0.201 | 0.370 | 0.984 |
| GA/AA | 0.059 | 0.007 | 0.014 | 0.029 | 0.011 |
| GG/AA | 0.299 | 0.058 | 0.011 | 0.045 | 0.202 |
| rs4846052 in MTHFR gene | |||||
| ALA | ARA | DHA | EPA | LA | |
| TT/TC | 0.020 | 0.003 | 0.016 | 0.027 | 0.018 |
| TC/CC | 0.394 | 0.624 | 0.805 | 0.914 | 0.734 |
| TT/CC | 0.138 | 0.009 | 0.004 | 0.045 | 0.048 |
| Dependent Variable: ALA in RBC | |||||
| Source | Type III Sum of Squares | df | Mean Square | F | Sig. |
| Corrected Model | 12.449 a | 8 | 1.556 | 1.548 | 0.145 |
| Intercept | 6.563 | 1 | 6.563 | 6.528 | 0.012 |
| Gender | 4.011 | 1 | 4.011 | 3.989 | 0.048 |
| rs1109859 in PEMT gene | 4.900 | 2 | 2.450 | 2.437 | 0.091 |
| rs4846052 in MTHFR gene | 2.513 | 2 | 1.256 | 1.250 | 0.289 |
| Hemoglobin | 0.045 | 1 | 0.045 | 0.045 | 0.833 |
| Hematocrit | 0.356 | 1 | 0.356 | 0.354 | 0.553 |
| ALA intake | 0.275 | 1 | 0.275 | 0.273 | 0.602 |
| Error | 159.858 | 159 | 1.005 | ||
| Total | 656.808 | 168 | |||
| Corrected Total | 172.307 | 167 | |||
| a. R Squared = 0.072 (Adjusted R Squared = 0.026) | |||||
| Dependent Variable: ARA in RBC | |||||
| Source | Type III Sum of Squares | df | Mean Square | F | Sig. |
| Corrected Model | 552433.852 a | 7 | 78919.122 | 3.657 | 0.001 |
| Intercept | 284923.202 | 1 | 284923.202 | 13.204 | 0.000 |
| Gender | 38020.108 | 1 | 38020.108 | 1.762 | 0.186 |
| rs1109859 in PEMT gene | 290956.552 | 2 | 145478.276 | 6.742 | 0.001 |
| rs4846052 in MTHFR gene | 92203.136 | 2 | 46101.568 | 2.136 | 0.121 |
| Hemoglobin | 69691.519 | 1 | 69691.519 | 3.230 | 0.074 |
| Hematocrit | 95978.498 | 1 | 95978.498 | 4.448 | 0.036 |
| Error | 3927257.216 | 182 | 21578.336 | ||
| Total | 30801660.185 | 190 | |||
| Corrected Total | 4479691.068 | 189 | |||
| a. R Squared = 0.123 (Adjusted R Squared = 0.090) | |||||
| Dependent Variable: DHA in RBC | |||||
| Source | Type III Sum of Squares | df | Mean Square | F | Sig. |
| Corrected Model | 111644.265 a | 8 | 13955.533 | 1.831 | 0.075 |
| Intercept | 44569.962 | 1 | 44569.962 | 5.847 | 0.017 |
| Gender | 6232.763 | 1 | 6232.763 | 0.818 | 0.367 |
| rs1109859 in PEMT gene | 69225.385 | 2 | 34612.692 | 4.541 | 0.012 |
| rs4846052 in MTHFR gene | 33145.490 | 2 | 16572.745 | 2.174 | 0.117 |
| Hemoglobin | 2690.465 | 1 | 2690.465 | 0.353 | 0.553 |
| Hematocrit | 3791.682 | 1 | 3791.682 | 0.497 | 0.482 |
| DHA intake | 943.244 | 1 | 943.244 | 0.124 | 0.725 |
| Error | 1212070.616 | 159 | 7623.086 | ||
| Total | 7032444.484 | 168 | |||
| Corrected Total | 1323714.880 | 167 | |||
| a. R Squared = 0.084 (Adjusted R Squared = 0.038) | |||||
| Dependent Variable: EPA in RBC | |||||
| Source | Type III Sum of Squares | df | Mean Square | F | Sig. |
| Corrected Model | 33.140 a | 8 | 4.143 | 0.853 | 0.558 |
| Intercept | 19.043 | 1 | 19.043 | 3.921 | 0.049 |
| Gender | 2.858 | 1 | 2.858 | 0.588 | 0.444 |
| rs1109859 in PEMT gene | 21.406 | 2 | 10.703 | 2.204 | 0.114 |
| rs4846052 in MTHFR gene | 5.710 | 2 | 2.855 | 0.588 | 0.557 |
| Hemoglobin | 0.758 | 1 | 0.758 | 0.156 | 0.693 |
| Hematocrit | 1.599 | 1 | 1.599 | 0.329 | 0.567 |
| EPA intake | 1.324 | 1 | 1.324 | 0.272 | 0.602 |
| Error | 772.318 | 159 | 4.857 | ||
| Total | 2855.067 | 168 | |||
| Corrected Total | 805.458 | 167 | |||
| a. R Squared = 0.041 (Adjusted R Squared = −0.007) | |||||
| Dependent Variable: LA in RBC | |||||
| Source | Type III Sum of Squares | df | Mean Square | F | Sig. |
| Corrected Model | 220014.263 a | 8 | 27501.783 | 2.829 | 0.006 |
| Intercept | 142585.361 | 1 | 142585.361 | 14.665 | 0.000 |
| Gender | 86981.037 | 1 | 86981.037 | 8.946 | 0.003 |
| rs1109859 in PEMT gene | 64090.372 | 2 | 32045.186 | 3.296 | 0.040 |
| rs4846052 in MTHFR gene | 19491.620 | 2 | 9745.810 | 1.002 | 0.369 |
| Hemoglobin | 13805.541 | 1 | 13805.541 | 1.420 | 0.235 |
| Hematocrit | 29920.071 | 1 | 29920.071 | 3.077 | 0.081 |
| LA intake | 21692.633 | 1 | 21692.633 | 2.231 | 0.137 |
| Error | 1545925.144 | 159 | 9722.800 | ||
| Total | 10938772.094 | 168 | |||
| Corrected Total | 1765939.407 | 167 | |||
| a. R Squared = 0.125 (Adjusted R Squared = 0.081) | |||||
References
- Tocher, D.R.; Betancor, M.B.; Sprague, M.; Olsen, R.E.; Napier, J.A. Omega-3 Long-Chain Polyunsaturated Fatty Acids, EPA and DHA: Bridging the Gap between Supply and Demand. Nutrients 2019, 11, 89. [Google Scholar] [CrossRef] [PubMed]
- Da Costa, K.A.; Sanders, L.M.; Fischer, L.M.; Zeisel, S.H. Docosahexaenoic Acid in Plasma Phosphatidylcholine May Be a Potential Marker for in Vivo Phosphatidylethanolamine A/-Methyltransferase Activity in Humans. Am. J. Clin. Nutr. 2011. [Google Scholar] [CrossRef] [PubMed]
- Ainsworth, H.; Seeds, M.C.; Mathias, R.A. Diet-Gene Interactions and PUFA Metabolism: A Potential Contributor to Health Disparities and Human Diseases. Nutrients 2014, 6, 1993–2022. [Google Scholar] [CrossRef]
- Sergeant, S.; Rahbar, E.; Chilton, F.H. Gamma-Linolenic Acid, Dihommo-Gamma Linolenic, Eicosanoids and Inflammatory Processes. Eur. J. Pharmacol. 2016. [Google Scholar] [CrossRef]
- Tanjung, C.; Rzehak, P.; Sudoyo, H.; Mansyur, M.; Munasir, Z.; Immanuel, S.; Irawan, R.; Reischl, E.; Demmelmair, H.; Hadinegoro, S.R.; et al. The Association of Fatty Acid Desaturase Gene Polymorphisms on Long-Chain Polyunsaturated Fatty Acid Composition in Indonesian Infants. Am. J. Clin. Nutr. 2018, 108, 1135–1144. [Google Scholar] [CrossRef]
- Niculescu, M. Choline and Phosphatidylcholine. In Encyclopedia of Human Nutrition, 3rd ed.; Caballero, B., Ed.; Elsevier: Amsterdam, The Netherlands, 2013; pp. 346–351. [Google Scholar]
- Khot, V.; Kale, A.; Joshi, A.; Chavan-gautam, P.; Joshi, S. Expression of Genes Encoding Enzymes Involved in the One Carbon Cycle in Rat Placenta Is Determined by Maternal Micronutrients (Folic Acid, Vitamin B12) and Omega-3 Fatty Acids. BioMed Res. Int. 2014, 2014, 613078. [Google Scholar] [CrossRef]
- Kume, A.; Kurotani, K.; Sato, M.; Ejima, Y.; Pham, N.M.; Nanri, A.; Kuwahara, K. Polyunsaturated Fatty Acids in Serum and Homocysteine Concentrations in Japanese Men and Women: A Cross-Sectional Study. Nutr. Metab. 2013, 10, 1. [Google Scholar] [CrossRef]
- Fenton, J.I.; Gurzell, E.A.; Davidson, E.A.; Harris, W.S. Red Blood Cell PUFAs Reflect the Phospholipid PUFA Composition of Major Organs. Prostaglandins Leukot. Essent. Fat. Acids 2016. [Google Scholar] [CrossRef]
- Jacobs, S.; Schiller, K.; Jansen, E.; Fritsche, A.; Weikert, C.; Di Giuseppe, R.; Boeing, H.; Schulze, M.B.; Kröger, J. Association between Erythrocyte Membrane Fatty Acids and Biomarkers of Dyslipidemia in the EPIC-Potsdam Study. Eur. J. Clin. Nutr. 2014. [Google Scholar] [CrossRef]
- De Onis, M.; Onyango, A.W.; Borghi, E.; Siyam, A.; Nishida, C.; Siekmann, J. Development of a WHO Growth Reference for School-Aged Children and Adolescents. Bull. World Health Organ. 2007, 85, 660–667. [Google Scholar] [CrossRef]
- De Onis, M.; Wijnhoven, T.M.A.; Onyango, A.W. Worldwide Practices in Child Growth Monitoring. J. Pediatr. 2004. [Google Scholar] [CrossRef]
- Șerban, C.L.; Sima, A.; Hogea, C.M.; Chiriță-Emandi, A.; Perva, I.T.; Vlad, A.; Albai, A.; Nicolae, G.; Putnoky, S.; Timar, R.; et al. Assessment of Nutritional Intakes in Individuals with Obesity under Medical Supervision. A Cross-Sectional Study. Int. J. Environ. Res. Public Health 2019, 16, 3036. [Google Scholar] [CrossRef]
- Serafim, V.; Tiugan, D.-A.; Andreescu, N.; Mihailescu, A.; Paul, C.; Velea, I.; Puiu, M.; Niculescu, M. Development and Validation of a LC–MS/MS-Based Assay for Quantification of Free and Total Omega 3 and 6 Fatty Acids from Human Plasma. Molecules 2019, 24, 360. [Google Scholar] [CrossRef]
- Corbin, K.D.; Abdelmalek, M.F.; Spencer, M.D.; da Costa, K.-A.; Galanko, J.A.; Sha, W.; Suzuki, A.; Guy, C.D.; Cardona, D.M.; Torquati, A.; et al. Genetic Signatures in Choline and 1-Carbon Metabolism Are Associated with the Severity of Hepatic Steatosis. FASEB J. 2013, 27, 1674–1689. [Google Scholar] [CrossRef]
- Wang, K.; Li, M.; Hakonarson, H. ANNOVAR: Functional Annotation of Genetic Variants from High-Throughput Sequencing Data. Nucleic Acids Res. 2010, 38, 1–7. [Google Scholar] [CrossRef]
- Liu, X.; Wu, C.; Li, C.; Boerwinkle, E. DbNSFP v3.0: A One-Stop Database of Functional Predictions and Annotations for Human Nonsynonymous and Splice-Site SNVs. Hum. Mutat. 2016, 37, 235–241. [Google Scholar] [CrossRef]
- Chirita Emandi, A.; Puiu, M.; Gafencu, M.; Pienar, C. Growth References for School Aged Children in Western Romania. Acta Endocrinol. 2012, 8, 133–152. [Google Scholar] [CrossRef]
- Chirita-Emandi, A.; Barbu, C.G.; Cinteza, E.E.; Chesaru, B.I.; Gafencu, M.; Mocanu, V.; Pascanu, I.M.; Tatar, S.A.; Balgradean, M.; Dobre, M.; et al. Overweight and Underweight Prevalence Trends in Children from Romania—Pooled Analysis of Cross-Sectional Studies between 2006 and 2015. Obes. Facts 2016, 9, 206–220. [Google Scholar] [CrossRef]
- Abarca-Gómez, L.; Abdeen, Z.A.; Hamid, Z.A.; Abu-Rmeileh, N.M.; Acosta-Cazares, B.; Acuin, C.; Adams, R.J.; Aekplakorn, W.; Afsana, K.; Aguilar-Salinas, C.A.; et al. Worldwide Trends in Body-Mass Index, Underweight, Overweight, and Obesity from 1975 to 2016: A Pooled Analysis of 2416 Population-Based Measurement Studies in 128·9 Million Children, Adolescents, and Adults. Lancet 2017, 390, 2627–2642. [Google Scholar] [CrossRef]
- Murphy, W.G. The Sex Difference in Haemoglobin Levels in Adults—Mechanisms, Causes, and Consequences. Blood Rev. 2014, 28, 41–47. [Google Scholar] [CrossRef]
- Engelmann, G.; Hoffmann, G.F.; Grulich-Henn, J.; Teufel, U. Alanine Aminotransferase Elevation in Obese Infants and Children: A Marker of Early Onset Non Alcoholic Fatty Liver Disease. Hepat. Mon. 2014, 14. [Google Scholar] [CrossRef]
- Chirita Emandi, A.; Gafencu, M.; Pienar, C. Impact of Increased Body Mass on Growth Patterns in School Children. Acta Endo 2012, 8, 551–563. [Google Scholar] [CrossRef]
- Svensson, V.; Jacobsson, J.A.; Fredriksson, R.; Danielsson, P.; Sobko, T.; Schiöth, H.B.; Marcus, C. Associations between Severity of Obesity in Childhood and Adolescence, Obesity Onset and Parental BMI: A Longitudinal Cohort Study. Int. J. Obes. 2011, 35, 46–52. [Google Scholar] [CrossRef]
- Arnold, L.E.; Young, A.S.; Belury, M.A.; Cole, R.M.; Gracious, B.; Seidenfeld, A.M.; Wolfson, H.; Fristad, M.A. Omega-3 Fatty Acid Plasma Levels Before and After Supplementation: Correlations with Mood and Clinical Outcomes in the Omega-3 and Therapy Studies. J. Child Adolesc. Psychopharmacol. 2017, 27, 223–233. [Google Scholar] [CrossRef]
- Mann, J.; Skeaff, M. Lipids. In Essentials of Human Nutrition; Mann, J., Truswell, A.S., Eds.; Oxford University Press: New York, NY, USA, 2002; pp. 31–53. [Google Scholar]
- Franco, R.S. Critical Review the Measurement and Importance of Red Cell Survival. Am. J. Hematol. 2009, 84, 109–114. [Google Scholar] [CrossRef]
- DeLong, C.J.; Shen, Y.J.; Thomas, M.J.; Cui, Z. Molecular Distinction of Phosphatidylcholine Synthesis between the CDP-Choline Pathway and Phosphatidylethanolamine Methylation Pathway. J. Biol. Chem. 1999. [Google Scholar] [CrossRef]
- Scambi, C.; Guarini, P.; De Franceschi, L.; Bambara, L.M. Can 5-Methyltetrahydrofolate Modify the Phospholipid Fatty Acid Pattern in Cystic Fibrosis Pediatric Patients? J. Cyst. Fibros. 2006. [Google Scholar] [CrossRef]
- Zhou, M.M.; Xue, Y.; Sun, S.H.; Wen, M.; Li, Z.J.; Xu, J.; Wang, J.F.; Yanagita, T.; Wang, Y.M.; Xue, C.H. Effects of Different Fatty Acids Composition of Phosphatidylcholine on Brain Function of Dementia Mice Induced by Scopolamine. Lipids Health Dis. 2016. [Google Scholar] [CrossRef]
- Liu, X.; Xue, Y.; Liu, C.; Lou, Q.; Wang, J.; Yanagita, T.; Xue, C.; Wang, Y. Eicosapentaenoic Acid-Enriched Phospholipid Ameliorates Insulin Resistance and Lipid Metabolism in Diet-Induced-Obese Mice. Lipids Health Dis. 2013. [Google Scholar] [CrossRef]
- Livingstone, M.B.E.; Robson, P.J.; Wallace, J.M.W. Issues in Dietary Intake Assessment of Children and Adolescents. Br. J. Nutr. 2004, 92, S213–S222. [Google Scholar] [CrossRef]
- Basch, C.E.; Shea, S.; Arliss, R.; Contento, I.R.; Rips, J.; Gutin, B.; Irigoyen, M.; Zybert, P. Validation of Mothers’ Reports of Dietary Intake by Four to Seven Year-Old Children. Am. J. Public Health 1990, 80, 1314–1317. [Google Scholar] [CrossRef]
- Burrows, T.L.; Martin, R.J.; Collins, C.E. A Systematic Review of the Validity of Dietary Assessment Methods in Children When Compared with the Method of Doubly Labeled Water. J. Am. Diet. Assoc. 2010, 110, 1501–1510. [Google Scholar] [CrossRef]
- Kirkpatrick, S.I.; Gilsing, A.M.; Hobin, E.; Solbak, N.M.; Wallace, A.; Haines, J.; Mayhew, A.J.; Orr, S.K.; Raina, P.; Robson, P.J.; et al. Lessons from Studies to Evaluate an Online 24-Hour Recall for Use with Children and Adults in Canada. Nutrients 2017, 9, 100. [Google Scholar] [CrossRef]

| Variables | All n = 196 | Females n = 101 | Males n = 95 | p Value | |||
|---|---|---|---|---|---|---|---|
| Median | IQR | Median | IQR | Median | IQR | ||
| Anthropometric data | |||||||
| Age (years) | 12 | 5 | 12.00 | 5.0 | 12.00 | 4.75 | 0.787 |
| zBMI | 3.13 | 1.20 | 2.83 | 1.21 | 3.44 | 1.37 | 0.001 |
| Hematological and biochemical analysis | |||||||
| Hemoglobin (g/dL) | 13.60 | 1.20 | 13.50 | 1.10 | 13.70 | 1.47 | 0.034 |
| Hematocrit (%) | 40.20 | 2.85 | 39.90 | 2.80 | 40.25 | 3.40 | 0.152 |
| HOMA-IR | 3.95 | 2.95 | 4.04 | 3.04 | 3.94 | 3.09 | 0.470 |
| TC (mg/dL) | 174.00 | 54.00 | 166.00 | 52.00 | 182.50 | 55.50 | 0.109 |
| TG (mg/dL) | 129.00 | 86.50 | 125.00 | 88.00 | 133.00 | 99.75 | 0.237 |
| HDL (mg/dL) | 46.00 | 18.00 | 43.00 | 19.00 | 48.00 | 6.75 | 0.085 |
| AST (U/L) | 29.00 | 14.00 | 29.00 | 14.00 | 29.50 | 15.50 | 0.127 |
| ALT (U/L) | 32.00 | 15.00 | 31.00 | 16.00 | 33.50 | 14.75 | 0.167 |
| CRP (mg/dL) | 4.70 | 7.90 | 4.80 | 8.70 | 4.75 | 7.72 | 0.315 |
| Homocysteine (µmoL/L) | 14.78 | 8.78 | 14.16 | 8.08 | 15.33 | 9.28 | 0.398 |
| PUFA measurements in RBCs | |||||||
| ALA RBC (µmol/L) | 1.41 | 1.00 | 1.28 | 1.00 | 1.46 | 1.1 | 0.038 |
| ARA RBC (µmol/L) | 354.22 | 168.25 | 338.64 | 175.45 | 368.18 | 152.23 | 0.142 |
| DHA RBC (µmol/L) | 160.13 | 116.52 | 150.06 | 117.12 | 175.11 | 113.39 | 0.309 |
| EPA RBC (µmol/L) | 2.86 | 2.12 | 2.64 | 2.34 | 2.92 | 1.72 | 0.115 |
| LA RBC (µmol/L) | 209.49 | 135.82 | 193.86 | 119.7 | 239.89 | 140.5 | 0.029 |
| Selected daily nutrient intakes evaluated in 24 h dietary recalls | |||||||
| Kilocalories | 1201.59 | 494.72 | 1201.49 | 440.11 | 1205.77 | 580.32 | 0.889 |
| Protein (g) | 66.60 | 22.11 | 66.63 | 23.00 | 66.48 | 23.80 | 0.832 |
| Lipids (g) | 44.59 | 25.08 | 44.17 | 22.99 | 45.67 | 28.42 | 0.781 |
| Carbohydrates (g) | 135.93 | 58.15 | 138.52 | 51.27 | 129.93 | 61.29 | 0.266 |
| Water (g) | 21.96 | 829.49 | 2146.43 | 749.58 | 2280.80 | 912.78 | 0.207 |
| Cholesterol (mg) | 260.54 | 157.94 | 255.68 | 129.83 | 274.79 | 158.47 | 0.853 |
| ALA (mg) | 77.16 | 217.21 | 57.29 | 196.85 | 87 | 272.44 | 0.280 |
| DHA (mg) | 10.63 | 24 | 10.16 | 19.47 | 10.95 | 24.74 | 0.547 |
| EPA (mg) | 3.4 | 5.99 | 3.09 | 5.81 | 4.00 | 6.20 | 0.971 |
| LA (mg) | 943.08 | 2306.07 | 953.40 | 2072.57 | 943.08 | 2334.76 | 0.527 |
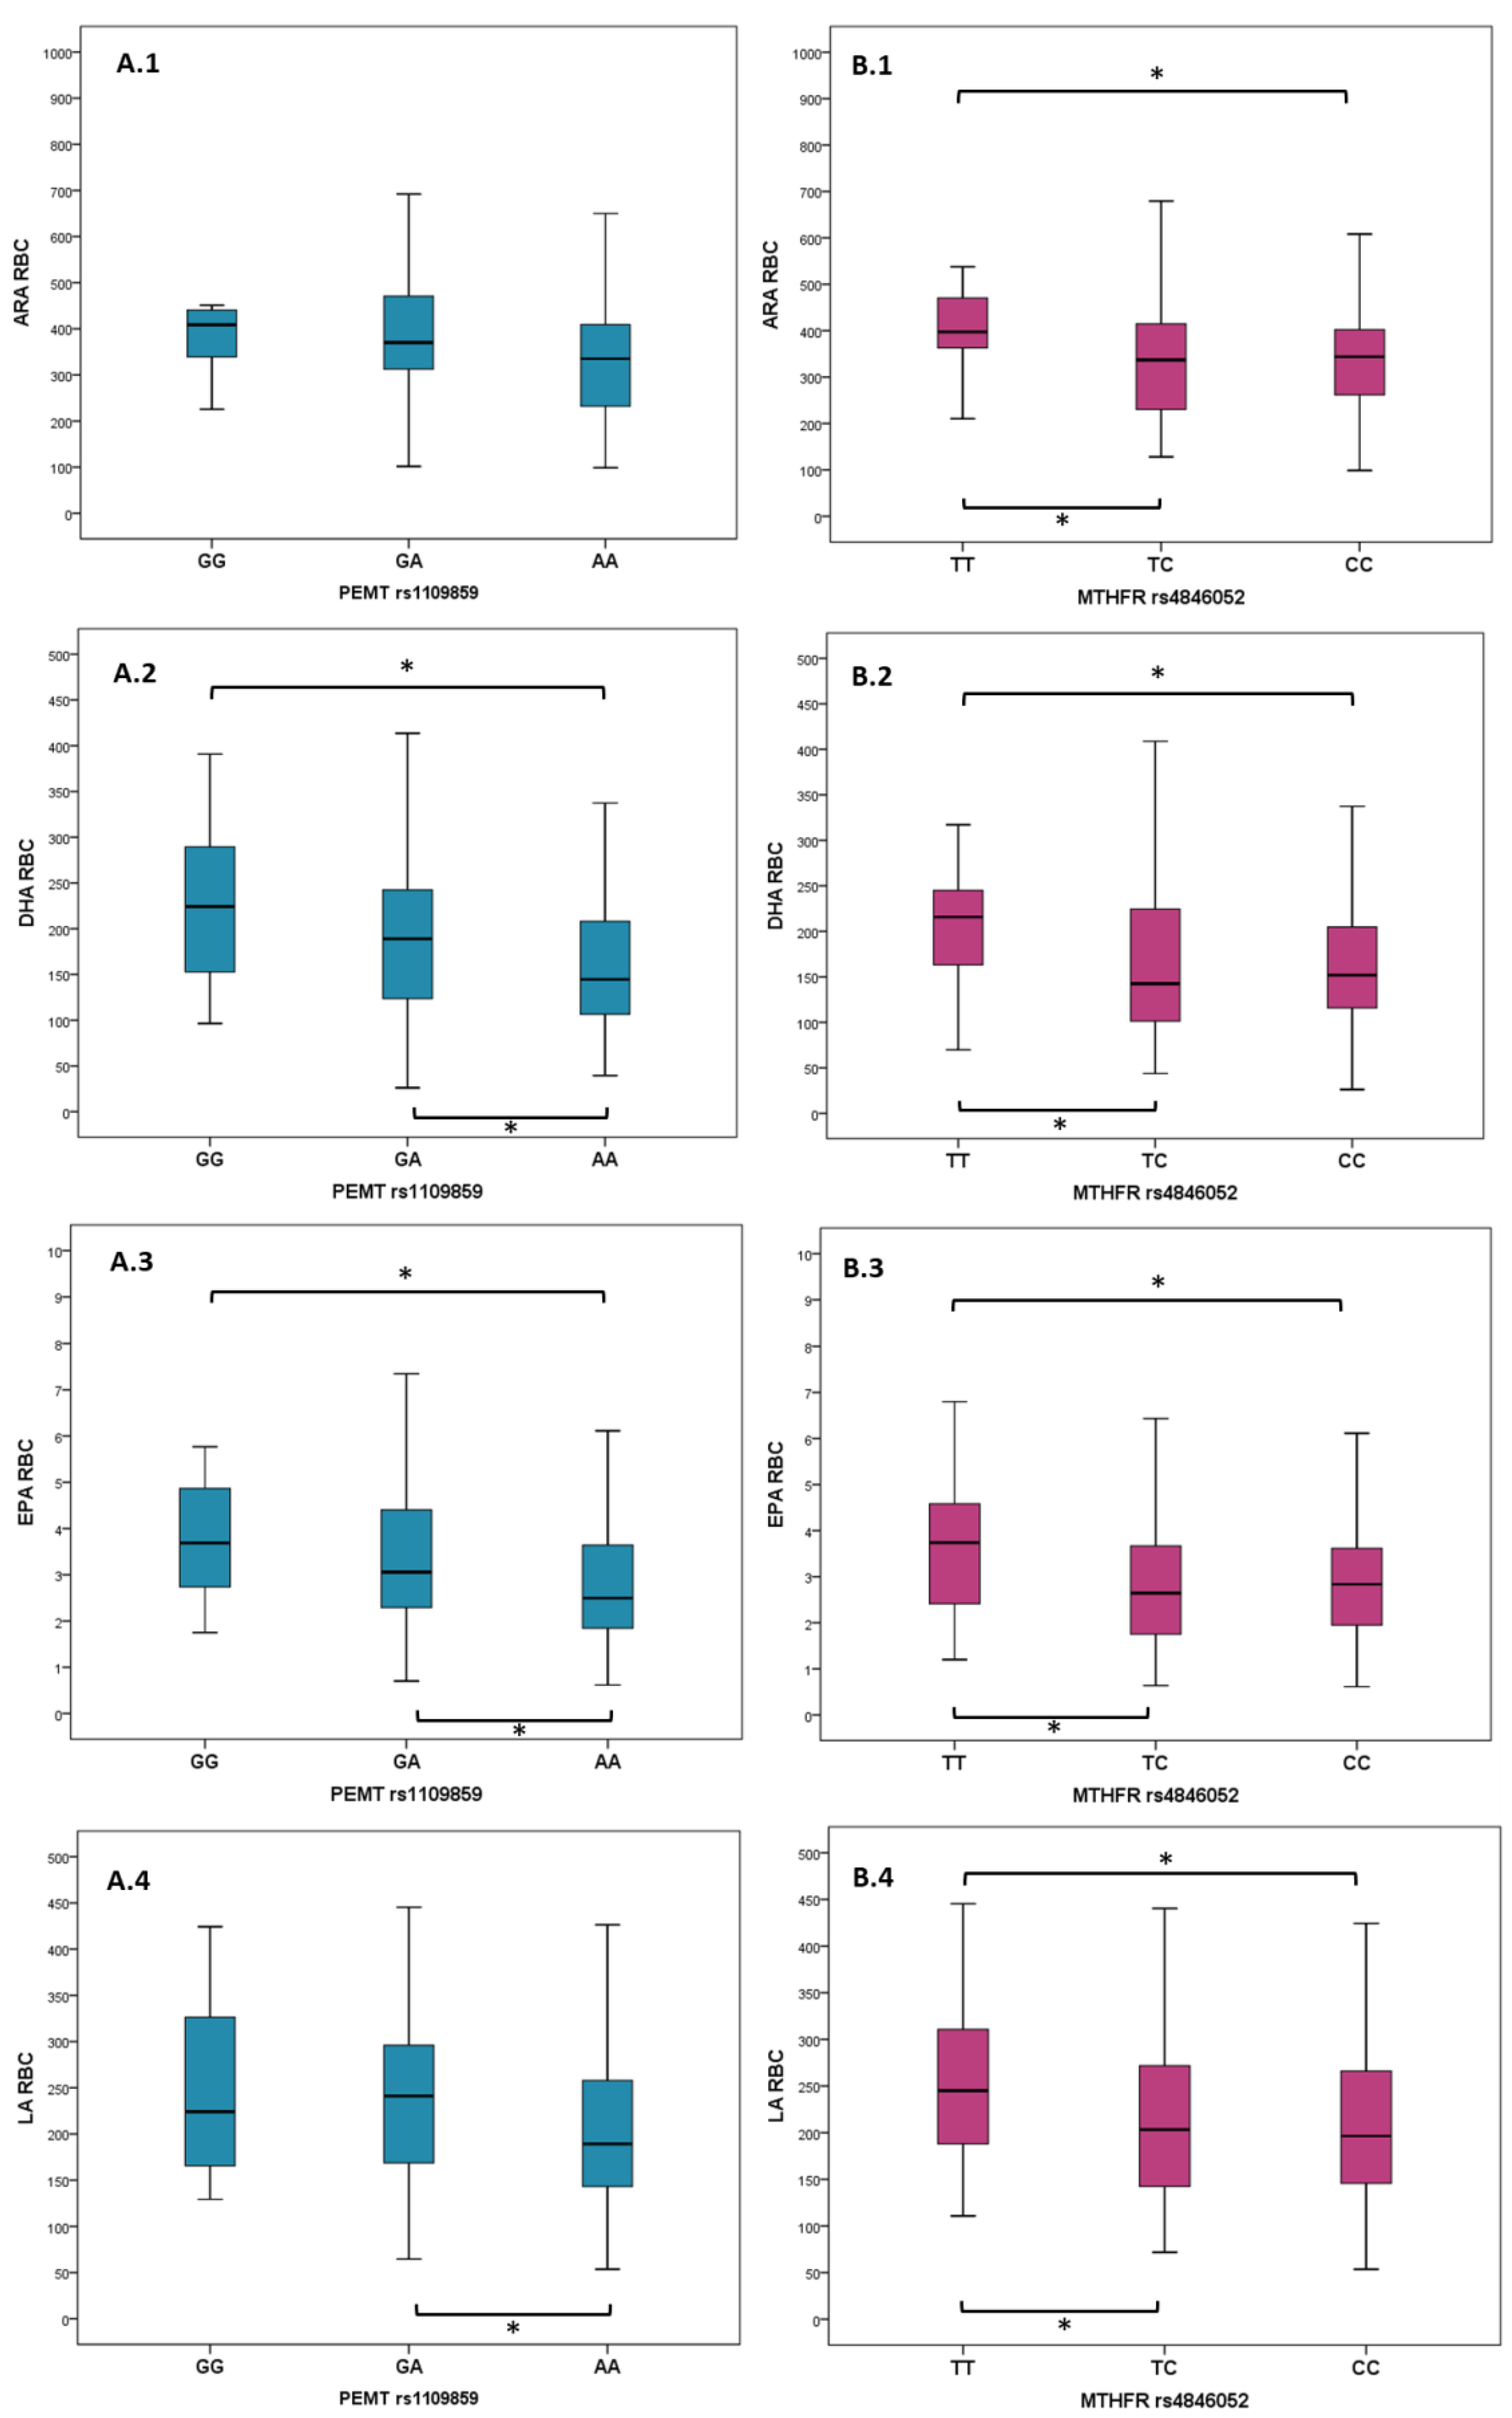
| PEMT rs1109859 | GG, n = 12 (6.1%) | GA, n = 68 (34.7%) | AA, n = 116 (59.2%) | p Value | |||
| Median | IQR | Median | IQR | Median | IQR | ||
| ALA RBC (µmol/L) | 1.65 | 1.46 | 1.54 | 1.11 | 1.34 | 0.99 | 0.090 |
| ARA RBC (µmol/L) | 408.72 | 112.81 | 370.48 | 162.76 | 366.92 | 178.73 | 0.007 |
| DHA RBC (µmol/L) | 224.10 | 151.89 | 190.15 | 120.4 | 144.62 | 102.81 | 0.040 |
| EPA RBC (µmol/L) | 3.69 | 2.51 | 3.09 | 2.27 | 2.50 | 1.83 | 0.017 |
| LA RBC (µmol/L) | 224.02 | 191.77 | 243.88 | 129.83 | 188.88 | 116 | 0.022 |
| MTHFR rs4846052 | TT, n = 33 (16.8%) | TC, n = 97 (49.5%) | CC, n = 66 (33.7%) | p Value | |||
| Median | IQR | Median | IQR | Median | IQR | ||
| ALA RBC (µmol/L) | 1.54 | 0.99 | 1.34 | 0.92 | 1.35 | 1.32 | 0.061 |
| ARA RBC (µmol/L) | 397.38 | 133.61 | 337.05 | 186.2 | 344.86 | 148.14 | 0.006 |
| DHA RBC (µmol/L) | 215.69 | 87.64 | 142.47 | 1338.86 | 153.82 | 91.28 | 0.015 |
| EPA RBC (µmol/L) | 3.74 | 2.33 | 2.67 | 1.92 | 2.83 | 1.77 | 0.066 |
| LA RBC (µmol/L) | 244.93 | 140.51 | 199.15 | 130.24 | 199.41 | 134.80 | 0.044 |
© 2019 by the authors. Licensee MDPI, Basel, Switzerland. This article is an open access article distributed under the terms and conditions of the Creative Commons Attribution (CC BY) license (http://creativecommons.org/licenses/by/4.0/).
Share and Cite
Serafim, V.; Chirita-Emandi, A.; Andreescu, N.; Tiugan, D.-A.; Tutac, P.; Paul, C.; Velea, I.; Mihailescu, A.; Șerban, C.L.; Zimbru, C.G.; et al. Single Nucleotide Polymorphisms in PEMT and MTHFR Genes are Associated with Omega 3 and 6 Fatty Acid Levels in the Red Blood Cells of Children with Obesity. Nutrients 2019, 11, 2600. https://doi.org/10.3390/nu11112600
Serafim V, Chirita-Emandi A, Andreescu N, Tiugan D-A, Tutac P, Paul C, Velea I, Mihailescu A, Șerban CL, Zimbru CG, et al. Single Nucleotide Polymorphisms in PEMT and MTHFR Genes are Associated with Omega 3 and 6 Fatty Acid Levels in the Red Blood Cells of Children with Obesity. Nutrients. 2019; 11(11):2600. https://doi.org/10.3390/nu11112600
Chicago/Turabian StyleSerafim, Vlad, Adela Chirita-Emandi, Nicoleta Andreescu, Diana-Andreea Tiugan, Paul Tutac, Corina Paul, Iulian Velea, Alexandra Mihailescu, Costela Lăcrimioara Șerban, Cristian G. Zimbru, and et al. 2019. "Single Nucleotide Polymorphisms in PEMT and MTHFR Genes are Associated with Omega 3 and 6 Fatty Acid Levels in the Red Blood Cells of Children with Obesity" Nutrients 11, no. 11: 2600. https://doi.org/10.3390/nu11112600
APA StyleSerafim, V., Chirita-Emandi, A., Andreescu, N., Tiugan, D.-A., Tutac, P., Paul, C., Velea, I., Mihailescu, A., Șerban, C. L., Zimbru, C. G., Puiu, M., & Niculescu, M. D. (2019). Single Nucleotide Polymorphisms in PEMT and MTHFR Genes are Associated with Omega 3 and 6 Fatty Acid Levels in the Red Blood Cells of Children with Obesity. Nutrients, 11(11), 2600. https://doi.org/10.3390/nu11112600