Selection of Target Nutrients for the Nutritional Standards of School Lunches in Korea


Abstract
:1. Introduction
2. Subjects and Methods
2.1. Data Source and Subjects
2.2. Estimation of the Usual Intake among School-Aged Children and Adolescents
2.3. Assessment of the Dietary Intake among School-Aged Children and Adolescents
2.3.1. Energy and the Percentages of Energy from Carbohydrates, Protein, and Fat
2.3.2. Nutrients
2.4. Statistical Analysis
3. Results
3.1. Usual Intake of School-Aged Children and Adolescents
3.2. Dietary Intake Status of School-Aged Children and Adolescents
3.2.1. Energy and the Percentages of Energy from Carbohydrates, Protein, and Fat
3.2.2. Nutrients
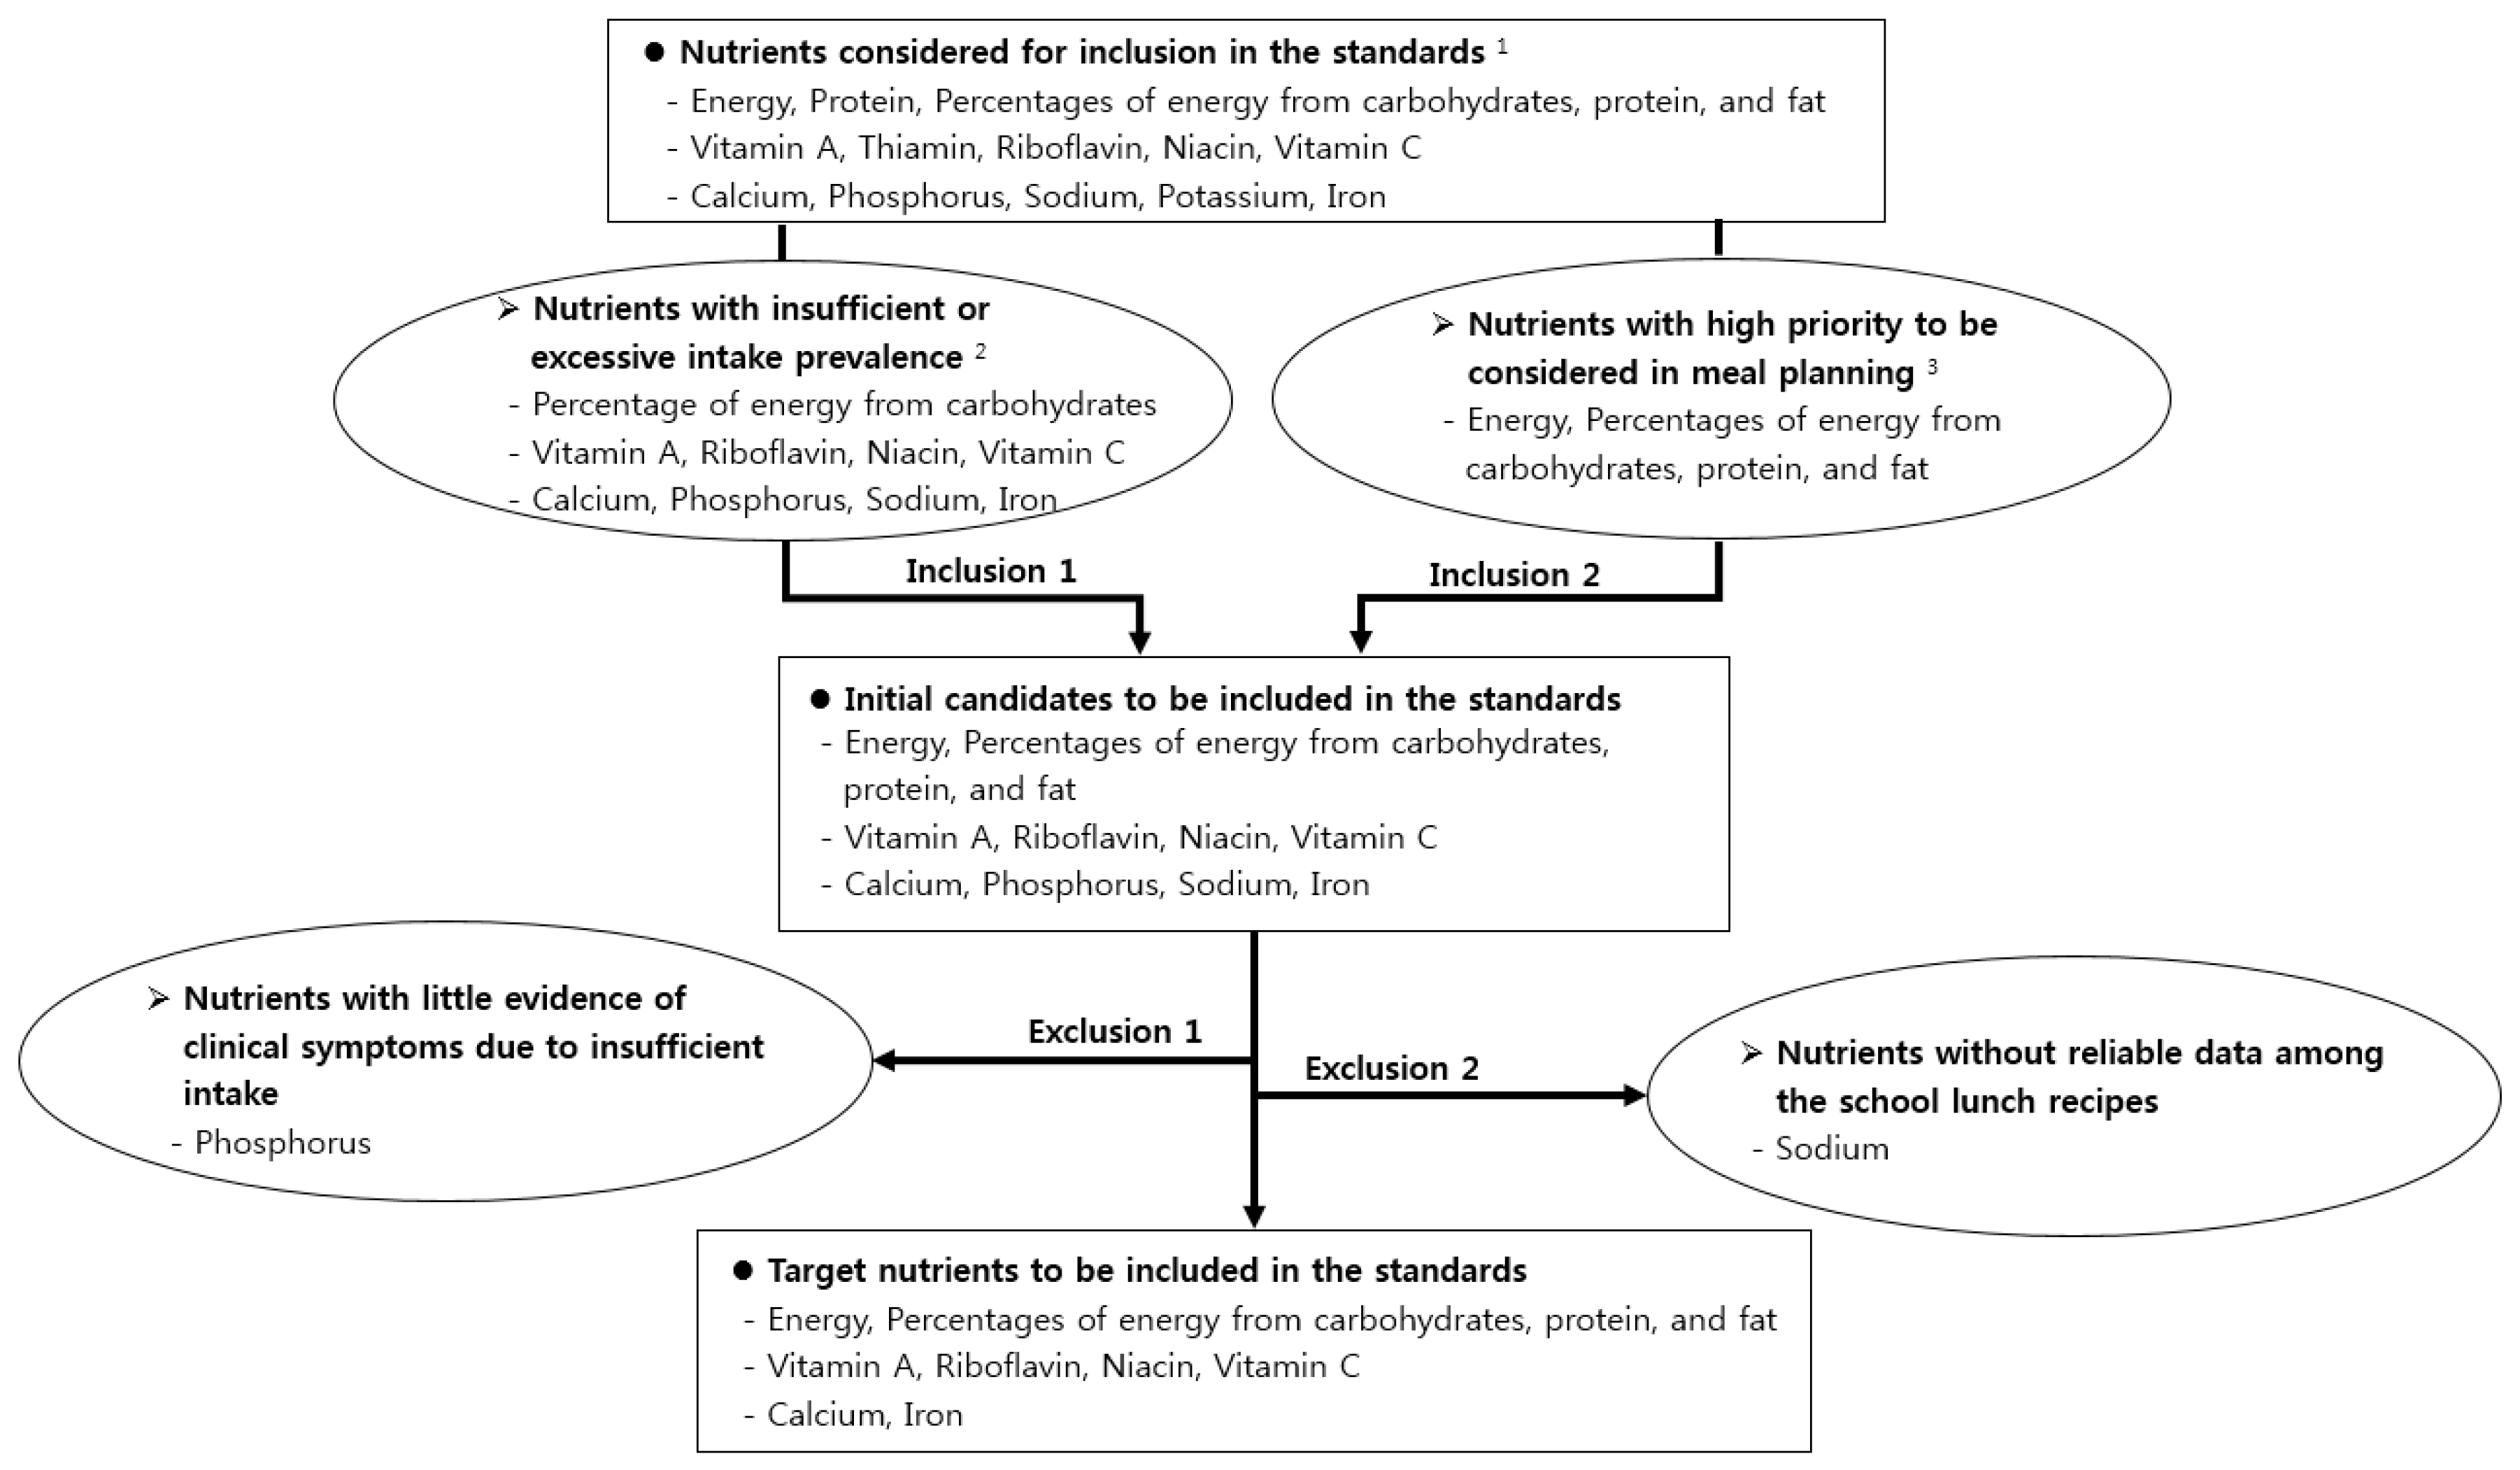
3.3. Target Nutrients to Be Included in the Standards
3.3.1. Initial Candidates to be Included in the Nutritional Standards
3.3.2. Target Nutrients to Be Included in the Nutritional Standards
4. Discussion
5. Conclusions
Supplementary Materials
Author Contributions
Funding
Conflicts of Interest
References
- Status of Implementation of School Lunch Programs in 2018 School Year. Available online: https://www.moe.go.kr/boardCnts/view.do?boardID=316&lev=0&statusYN=W&s=moe&m=0302&opType=N&boardSeq=78138 (accessed on 6 October 2019).
- Status of Free School Lunches in Elementary, Middle and High Schools in 2019; Ministry for Education of Korea: Sejong, Korea, 2019.
- Adamson, A.; Spence, S.; Reed, L.; Conway, R.; Palmer, A.; Stewart, E.; McBratney, J.; Carter, L.; Beattie, S.; Nelson, M. School food standards in the UK: Implementation and evaluation. Public Health Nutr. 2013, 16, 968–981. [Google Scholar] [CrossRef] [PubMed]
- Haroun, D.; Harper, C.; Wood, L.; Nelson, M. The impact of the food-based and nutrient-based standards on lunchtime food and drink provision and consumption in primary schools in England. Public Health Nutr. 2011, 14, 209–218. [Google Scholar] [CrossRef] [PubMed]
- Spence, S.; Delve, J.; Stamp, E.; Matthews, J.N.S.; White, M.; Adamson, A.J. The impact of food and nutrient-based standards on primary school children’s lunch and total dietary intake: A natural experimental evaluation of government policy in England. PLoS ONE 2013, 8, e78298. [Google Scholar] [CrossRef] [PubMed]
- The Korean Nutrition Society. Dietary Reference Intakes for Koreans; The Korean Nutrition Society: Seoul, Korea, 2005; pp. 1–6. [Google Scholar]
- Kim, M.; Kim, S.; Yoon, J. Study on necessity of updating nutritional standards for school lunch programs in Korea. J. East Asian Soc. Diet. Life 2017, 27, 137–147. [Google Scholar] [CrossRef]
- Kim, M.; Abe, S.; Zhang, C.; Kim, S.; Choi, J.; Hernandez, E.; Nozue, M.; Yoon, J. Comparison of the nutrient-based standards for school lunches among South Korea, Japan, and Taiwan. Asia Pac. J. Clin. Nutr. 2017, 26, 160–168. [Google Scholar]
- Enforcement Decree of School Meals Act, Nutritional Standards for the School Lunch Program; Ministry of Education of Korea: Sejong, Korea, 1981.
- Enforcement Rules of School Meals Act, Nutritional Standards for the School Lunch Program; Ministry of Education of Korea: Sejong, Korea, 1993.
- Enforcement Rules of School Meals Act, Nutritional Standards for the School Lunch Program; Ministry of Education of Korea: Sejong, Korea, 2007.
- Enforcement Rules of Bioethics and Safety Act, Scope of Research on Human Subjects; Ministry of Health & Welfare of Korea: Sejong, Korea, 2018.
- Status of Implementation of the Korea National Health and Nutrition Examination Survey. Available online: https://knhanes.cdc.go.kr/knhanes/sub02/sub02_01.do (accessed on 6 October 2019).
- Nutrition Survey Guidebook for National Health and Nutrition Survey VI (2013–2015); Ministry of Health & Welfare of Korea; Korea Centers for Disease Control and Prevention: Cheongju, Korea, 2015; pp. 39–61.
- Institute of Medicine. Dietary Reference Intakes: Application in Dietary Planning; National Academies Press: Washington, DC, USA, 2003; p. 24. [Google Scholar]
- Hoffmann, K.; Boeing, H.; Dufour, A.; Volatier, J.L.; Telman, J.; Virtanen, M.; Becker, W.; De Henauw, S. Estimating the distribution of usual dietary intake by short-term measurements. Eur. J. Clin. Nutr. 2002, 56, S53–S62. [Google Scholar] [CrossRef] [Green Version]
- Institute of Medicine. Dietary Reference Intakes: Application in Dietary Assessment; The National Academy Press: Washington, DC, USA, 2000; pp. 73–105. [Google Scholar]
- Morimoto, J.M.; Marchioni, D.M.L.; Fisberg, R.M. Using dietary reference intake: Based methods to estimate prevalence of inadequate nutrient intake among female students in Brazil. J. Acad. Nutr. Diet. Assoc. 2006, 106, 733–736. [Google Scholar] [CrossRef]
- Iowa State University. A User’s Guide to C-SIDE: Software for Intake Distribution Estimation; Iowa State University Statistical Laboratory: Ames, IA, USA, 1996; pp. 1–48. [Google Scholar]
- Jahns, L.; Arab, L.; Carriquiry, A.; Popkin, B.M. The use of external within-person variance estimates to adjust nutrient intake distributions over time and across populations. Public Health Nutr. 2005, 8, 69–76. [Google Scholar] [CrossRef]
- Chang, H.Y.; Suchindran, C.M.; Pan, W.H. Using the overdispersed exponential family to estimate the distribution of usual daily intake of people aged between 18 and 28 in Taiwan. Stat. Med. 2001, 20, 2337–2350. [Google Scholar] [CrossRef]
- Kim, D.W.; Shim, J.E.; Paik, H.Y.; Song, W.O.; Joung, H. Nutritional intake of Korean population before and after adjusting for within-individual variations: 2001 Korean National Health and Nutrition Survey Data. Nutr. Res. Pract. 2011, 5, 266–274. [Google Scholar] [CrossRef]
- Moshfefg, A.; Goldman, J.L.C.; Linda, C. What We Eat in America, NHANES 2001-2002: Usual Nutrient Intake from Food Compared to Dietary Reference Intakes; United States Department of Agriculture & Agricultural Research Service: Washington, DC, USA, 2005; pp. 4–7. [Google Scholar]
- In-Depth Analysis on the Dietary Intake Survey of Infant, Children and Adolescents (II); National Institute of Food and Drug Safety Evaluation; Korea Health Industry Development Institute: Cheongju, Korea, 2010.
- Ministry of Health & Welfare; The Korean Nutrition Society. Dietary Reference Intakes for Koreans; Ministry of Health and Welfare: Sejong, Korea, 2015; pp. 27–28, 71, 102, 144, 251–253, 607, 639, 645, 737–738, 933–944. [Google Scholar]
- Gibson, R.S.; Ferguson, E.L. An Interactive 24-hour Recall for Assessing the Adequacy of Iron and Zinc Intake in Developing Countries; HarvestPlus: Washington, DC, USA, 2008; pp. 120–124. [Google Scholar]
- Kim, M.; Yoon, J. Estimation of usual intake and assessment of nutrient intake for Korean adolescents: Analysis of the 2010–2012 Korea National Health and Nutrition Examination Survey. Fam. Environ. Res. 2017, 55, 385–397. [Google Scholar] [CrossRef]
- The Korean Nutrition Society. Dietary Reference Intakes for Koreans; The Korean Nutrition Society: Seoul, Korea, 2010; p. 354. [Google Scholar]
- Institute of Medicine. Dietary Reference Intakes: The Essential Guide to Nutrient Requirements; The National Academies Press: Washington, DC, USA, 2006; p. 71. [Google Scholar]
- Han, M.R.; Lim, J.H.; Song, Y.J. The effect of high-carbohydrate diet and low-fat diet for the risk factors of metabolic syndrome in Korean adolescents: Using the Korean National Health and Nutrition Examination Surveys (KNHANES) 1998–2009. J. Nutr. Health 2014, 47, 186–192. [Google Scholar] [CrossRef]
- Kim, E.K.; Lee, J.S.; Hong, H.O.; Yu, C.H. Association between glycemic index, glycemic load, dietary carbohydrates and diabetes from Korean National Health and Nutrition Examination Survey 2005. Korean J. Nutr. 2009, 42, 622–630. [Google Scholar] [CrossRef]
- Park, S.H.; Lee, K.S.; Park, H.Y. Dietary carbohydrate intake is associated with cardiovascular disease risk in Korean: Analysis of the third Korea National Health and Nutrition Examination Survey (KNHANES III). Int. J. Cardiol. 2010, 139, 234–240. [Google Scholar] [CrossRef]
- Korea National Health and Nutrition Examination Survey. Available online: https://knhanes.cdc.go.kr/knhanes/sub04/sub04_03.do?classType=7 (accessed on 13 August 2019).
- Song, Y.J.; Joung, H.J.; Kim, Y.N.; Paik, H.Y. The physical development and dietary intake for Korean children and adolescents: Food and nutrient intake. Korean J. Nutr. 2006, 39, 50–57. [Google Scholar]
- Pak, S.; Lee, J.S.; Hong, H. The food and nutrient intake on weekdays and weekends among high school girls in Seoul. Korean J. Nutr. 2010, 43, 513–523. [Google Scholar] [CrossRef]
- Joshipura, K.J.; Hu, F.B.; Manson, J.E.; Stampfer, M.J.; Rimm, E.B.; Speizer, F.E.; Colditz, G.; Ascherio, A.; Rosner, B.; Spiegelman, D.; et al. The effect of fruit and vegetable intake on risk for coronary heart disease. Ann. Intern. Med. 2001, 134, 1106–1114. [Google Scholar] [CrossRef]
- Pesa, J.A.; Turner, L.W. Fruit and vegetable intake and weight-control behaviors among US youth. Am. J. Health Behav. 2001, 25, 3–9. [Google Scholar] [CrossRef]
- Veer, P.V.; Jansen, M.C.J.F.; Klerk, M.; Kok, F.J. Fruits and vegetables in the prevention of cancer and cardiovascular disease. Public Health Nutr. 2000, 3, 103–107. [Google Scholar] [CrossRef] [Green Version]
- The 2017 Korean Youth Health Risk Behavior On-Line Survey; Department of Education; Ministry of Health & Welfare of Korea; Korea Centers for Disease Control and Prevention: Cheongju, Korea, 2017; pp. 167, 171.
- The 2018 Korean Youth Health Risk Behavior On-Line Survey; Department of Education of Korea; Ministry of Health & Welfare of Korea; Korea Centers for Disease Control and Prevention: Cheongju, Korea, 2018; p. 159.
- Choe, W.H.; Lyu, E.S.; Lee, K.A. Study on perception and preference of vegetable intake of alienated children in Gyeongbuk area according to gender and grade. Korean J. Food Cook Sci. 2018, 34, 394–403. [Google Scholar] [CrossRef]
- Yoo, J.Y.; Kim, H.Y. A study on the preference and acceptance of vegetables in menus for primary school students. J. Table Food Coord. 2012, 7, 1–14. [Google Scholar]
- Lee, K.A. Comparisons of the eating habit, preferences and intake frequency of vegetables between middle and high school students in Busan. J. Korean Home Econ. Educ. Assoc. 2015, 27, 93–107. [Google Scholar] [CrossRef]
- Park, S.H.; Kim, M.J. Acceptance and preference of vegetables in menus for middle school students. J Korean Soc. Food Sci. Nutr. 2008, 37, 1660–1666. [Google Scholar] [CrossRef]
- Lotz, M.; Zisman, E.; Bartter, F.C. Evidence for a phosphorus-depletion syndrome in man. N. Engl. J. Med. 1968, 278, 409–415. [Google Scholar] [CrossRef] [PubMed]
- Oh, S.Y. The association of dietary life, nutrition and mental health in Korean adolescents. J. Korea Entertain. Ind. Assoc. 2016, 10, 235–250. [Google Scholar] [CrossRef]
- Oh, S.Y.; Wang, S.G. A comparative study on dietary life and nutrition, health behaviors, mental health of adolescent students according to residential type. J. Korea Entertain. Ind. Assoc. 2013, 7, 293–305. [Google Scholar] [CrossRef]
- Kim, S.H. A study on the relationship between milk consumption, dietary nutrient intake and physical strength of adolescents in middle and small-sized cities in Korea for dietary education of home economics subject at middle and high Schools. J. Korean Home Econ. Educ. Assoc. 2016, 28, 159–167. [Google Scholar] [CrossRef]
- Kim, S.H.; Kim, W.K.; Kang, M.H. Effect of milk and milk products consumption on physical growth and bone mineral density in Korean adolescents. Nutr. Res. Pract. 2013, 7, 309–314. [Google Scholar] [CrossRef]
- Wiley, A.S. Consumption of milk, but not other dairy products, is associated with height among US preschool children in NHANES 1999–2002. Ann. Hum. Biol. 2009, 36, 125–138. [Google Scholar] [CrossRef]
- Kim, T.Y.; Kim, H.S. Comparison of calcium intake status among elementary students by participation in the school milk program. J. Korean Soc. Food Cult. 2009, 24, 106–115. [Google Scholar]
- Park, S.H.; Lee, K.S.; Choi, S.K.; Seo, J.S. Calcium and milk intake of elementary school students from school foodservices: Focus on the Gyeongsangbukdo province. J. Korean Diet. Assoc. 2014, 20, 12–25. [Google Scholar] [CrossRef]
- Kim, S.M.; Sung, H.J. A study on the nutritional intake status of female adolescents. J. Living Sci. Res. 1999, 25, 51–58. [Google Scholar]
- Nagata, C.; Takatsuka, N.; Shimizu, N.; Shimizu, H. Sodium intake and risk of death from stroke in Japanese men and women. Stroke 2004, 35, 1543–1547. [Google Scholar] [CrossRef] [PubMed]
- He, F.J.; Marrero, N.M.; MacGregor, G.A. Salt intake is related to soft drink consumption in children and adolescents. Hypertension 2008, 51, 629–634. [Google Scholar] [CrossRef] [PubMed]
- Ho, S.C.; Chen, Y.M.; Woo, J.L.; Leung, S.S.; Lam, T.H.; Janus, E.D. Sodium is the leading dietary factor associated with urinary calcium excretion in Hong Kong Chinese adults. Osteoporos. Int. 2001, 12, 723–731. [Google Scholar] [CrossRef]
- Kurosawa, M.; Kikuchi, S.; Xu, J.; Inaba, Y. Highly salted food and mountain herbs elevate the risk for stomach cancer death in a rural area of Japan. J. Gastroenterol. Hepatol. 2006, 21, 1681–1686. [Google Scholar] [CrossRef]
- School-Meals Act, School Meals Performance Standards; Culture, Sports, Science and Technology of Japan: Tokyo, Japan, 2018.
- School-Health Act, Standards for Food and Nutrition Facts of School Lunch Programs; Ministry of Education of Taiwan: Taipei, Taiwan, 2013.
- Rules and Regulations, Nutrition Standards in the National School Lunch and School Breakfast Programs; United States Department of Agriculture: Washington, DC, USA, 2012.
- Requirements for School Food Regulations; Ministry for Education of England: London, UK, 2014.
- Im, K.S. Guidelines of Food Standards and Nutrition Management for School Meals; Ministry of Education & Human Resources Development: Seoul, Korea, 2004; p. 309. [Google Scholar]
- Taxas on Sugary Drinks: Why Do it? World Health Organization: Geneva, Switzerland, 2017; p. 1.


| Gender | Age (Years) | n | Energy (kcal) | Protein (g) | Carbohydrates (% Energy) | Protein (% Energy) | Fat (% Energy) | Vitamin A | Thiamin (mg) | Riboflavin (mg) | Niacin (mg NE 3) | Vitamin C (mg) | Calcium (mg) | Phosphorus (mg) | Sodium (mg) | Potassium (mg) | Iron (mg) |
|---|---|---|---|---|---|---|---|---|---|---|---|---|---|---|---|---|---|
| (μg RAE 2) | |||||||||||||||||
| Male | 6–8 | 612 | 0.5949 | 0.6752 | 0.7494 | 0.7831 | 0.7507 | 0.7188 | 0.6970 | 0.6024 | 0.7071 | 0.7723 | 0.5355 | 0.5686 | 0.5997 | 0.5752 | 0.6593 |
| 9–11 | 668 | 0.6737 | 0.7237 | 0.9049 | 0.8609 | 0.9436 | 0.8145 | 0.8162 | 0.7129 | 0.7504 | 0.8419 | 0.6217 | 0.6205 | 0.7920 | 0.6526 | 0.6901 | |
| 12-14 | 634 | 0.7023 | 0.7318 | 0.8030 | 0.8716 | 0.8570 | 0.8210 | 0.8074 | 0.6769 | 0.7756 | 0.7506 | 0.6549 | 0.6600 | 0.7939 | 0.6303 | 0.7344 | |
| 15-17 | 491 | 0.5985 | 0.6491 | 0.8330 | 0.8828 | 0.8157 | 0.7417 | 0.7948 | 0.6451 | 0.6913 | 0.7503 | 0.6600 | 0.5779 | 0.6562 | 0.5924 | 0.6750 | |
| Female | 6–8 | 584 | 0.6849 | 0.6989 | 0.8327 | 0.8638 | 0.8410 | 0.8374 | 0.7557 | 0.6759 | 0.7339 | 0.6887 | 0.6226 | 0.6231 | 0.7098 | 0.6356 | 0.6825 |
| 9–11 | 601 | 0.6747 | 0.8032 | 0.9467 | 0.8411 | 0.9332 | 0.7574 | 0.7728 | 0.6851 | 0.8121 | 0.7073 | 0.6325 | 0.6809 | 0.6874 | 0.6089 | 0.6822 | |
| 12–14 | 553 | 0.6144 | 0.6851 | 0.8491 | 0.8866 | 0.8191 | 0.7308 | 0.7898 | 0.6589 | 0.7180 | 0.7048 | 0.6191 | 0.5935 | 0.7034 | 0.6342 | 0.6890 | |
| 15–17 | 467 | 0.6624 | 0.7704 | 0.9303 | 0.9907 | 0.8324 | 0.8613 | 0.7559 | 0.7058 | 0.7236 | 0.7309 | 0.6632 | 0.6572 | 0.7565 | 0.6377 | 0.7216 | |
| All | 4610 | 0.5795 | 0.6467 | 0.8440 | 0.8727 | 0.8459 | 0.7702 | 0.7151 | 0.6426 | 0.6793 | 0.7408 | 0.6112 | 0.5744 | 0.6367 | 0.5909 | 0.6578 |
| Gender | Age (Years) | n | Average Usual Energy Intake (kcal) | EER (kcal) | Percentage of the Average Usual Energy Intake for the EER (%) |
|---|---|---|---|---|---|
| Male | 6–8 | 399 | 1912 | 1700 | 112.5 |
| 9–11 | 444 | 2169 | 2100 | 103.3 | |
| 12–14 | 407 | 2464 | 2500 | 98.6 | |
| 15–17 | 367 | 2592 | 2700 | 96.0 | |
| Female | 6–8 | 383 | 1592 | 1500 | 106.1 |
| 9–11 | 370 | 1942 | 1800 | 107.9 | |
| 12–14 | 373 | 1995 | 2000 | 99.8 | |
| 15–17 | 348 | 1922 | 2000 | 96.1 |
| Gender | Age (Years) | n | Proportion of the Subjects below the AMDR 1 (%) | Proportion of the Subjects above the AMDR (%) | ||||
|---|---|---|---|---|---|---|---|---|
| Carbohydrates | Protein | Fat | Carbohydrates | Protein | Fat | |||
| Male | 6–8 | 399 | 16.5 | 0 | 1.8 | 27.1 | 0.5 | 12.5 |
| 9–11 | 444 | 7.2 | 0 | 0.0 | 17.6 | 0.9 | 0.9 | |
| 12–14 | 407 | 17.0 | 0 | 1.0 | 21.4 | 0.5 | 5.9 | |
| 15–17 | 367 | 19.3 | 0 | 1.4 | 16.6 | 0.5 | 12.8 | |
| Female | 6–8 | 383 | 3.9 | 0 | 1.8 | 36.6 | 0.0 | 3.4 |
| 9–11 | 370 | 1.6 | 0 | 0.3 | 13.0 | 0.5 | 0.8 | |
| 12–14 | 373 | 8.6 | 0 | 1.9 | 22.8 | 0.5 | 8.8 | |
| 15–17 | 348 | 5.7 | 0 | 1.4 | 11.2 | 0.0 | 8.9 | |
| All | 3091 | 10.1 | 0 | 1.2 | 20.1 | 0.5 | 6.6 | |
| Gender | Age (Years) | n | Protein | Vitamin A | Thiamin | Riboflavin | Niacin | Vitamin C | Calcium | Phosphorus | Iron | |||||||||
|---|---|---|---|---|---|---|---|---|---|---|---|---|---|---|---|---|---|---|---|---|
| EAR 1 (g) | % Below the EAR | EAR (μg RAE 2) | % Below the EAR | EAR (mg) | % Below the EAR | EAR (mg) | % Below the EAR | EAR (mg NE 3) | % Below the EAR | EAR (mg) | % Below the EAR | EAR (mg) | % Below the EAR | EAR (mg) | % Below the EAR | EAR (mg) | % Below the EAR | |||
| Male | 6–8 | 399 | 25 | 0.0 | 320 | 47.1 | 0.6 | 0.0 | 0.7 | 3.8 | 7 | 2.5 | 40 | 21.3 | 580 | 64.2 | 490 | 0.8 | 7 | 4.5 |
| 9–11 | 444 | 35 | 0.9 | 420 | 53.2 | 0.7 | 0.0 | 1.0 | 14.0 | 9 | 7.0 | 55 | 28.8 | 650 | 71.2 | 1000 | 37.4 | 8 | 3.6 | |
| 12–14 | 407 | 45 | 1.2 | 540 | 64.1 | 1.0 | 0.0 | 1.2 | 18.7 | 11 | 7.4 | 70 | 46.7 | 800 | 85.5 | 1000 | 0.2 | 11 | 10.1 | |
| 15–17 | 367 | 50 | 6.3 | 620 | 84.5 | 1.1 | 0.8 | 1.4 | 38.4 | 13 | 16.6 | 80 | 56.4 | 720 | 78.7 | 1000 | 27.2 | 11 | 13.6 | |
| Female | 6–8 | 383 | 20 | 0.3 | 290 | 41.8 | 0.6 | 0.0 | 0.6 | 3.1 | 7 | 8.9 | 45 | 27.7 | 580 | 84.9 | 450 | 2.9 | 6 | 3.9 |
| 9–11 | 370 | 30 | 0.3 | 380 | 43.6 | 0.7 | 0.0 | 0.8 | 7.0 | 9 | 9.7 | 60 | 44.6 | 650 | 74.1 | 1000 | 51.9 | 7 | 3.0 | |
| 12–14 | 373 | 40 | 5.9 | 470 | 72.7 | 0.9 | 1.1 | 1.0 | 27.6 | 11 | 28.7 | 75 | 60.3 | 740 | 90.3 | 1000 | 55.8 | 13 | 37.8 4 | |
| 15–17 | 348 | 40 | 4.9 | 440 | 77.3 | 1.0 | 4.0 | 1.0 | 29.0 | 11 | 30.2 | 70 | 62.6 | 660 | 87.1 | 1000 | 60.6 | 11 | 41.1 4 | |
| All | 3091 | 2.4 | 60.0 | 0.7 | 17.3 | 13.4 | 42.8 | 79.2 | 28.9 | 14.1 | ||||||||||
| Age (Years) | n | Vitamin A | Niacin | Vitamin C | Calcium | Phosphorus | Sodium | Iron | ||||||||
|---|---|---|---|---|---|---|---|---|---|---|---|---|---|---|---|---|
| UL 1 (μg RAE) | % Above the UL | UL (mg NE 2) | % Above the UL | UL (mg) | % Above the μL | UL (mg) | % Above the UL | UL (mg) | % Above the UL | Intake Goal 3 (mg) | % Above the Intake Goal | UL (mg) | % Above the UL | |||
| Male | 6–8 | 399 | 1000 | 6.8 | 350 | 0 | 700 | 0 | 2500 | 0 | 3000 | 0 | n/a 4 | 40 | 0.3 | |
| 9–11 | 444 | 1500 | 0.9 | 500 | 0 | 1000 | 0 | 3000 | 0 | 3500 | 0 | 2000 | 93.2 | 40 | 0.5 | |
| 12–14 | 407 | 2100 | 2 | 700 | 0 | 1400 | 0 | 3000 | 0 | 3500 | 6.6 | 2000 | 98.3 | 40 | 7.4 | |
| 15–17 | 367 | 2300 | 0 | 800 | 0 | 1500 | 0 | 3000 | 0 | 3500 | 0 | 2000 | 94.6 | 45 | 2.7 | |
| Female | 6–8 | 383 | 1000 | 2.9 | 350 | 0 | 700 | 0 | 2500 | 0 | 3000 | 0 | n/a 4 | 40 | 0 | |
| 9–11 | 370 | 1500 | 3 | 500 | 0 | 1000 | 0 | 3000 | 0.3 | 3500 | 1.4 | 2000 | 81.4 | 40 | 0 | |
| 12–14 | 373 | 2100 | 0.8 | 700 | 0 | 1400 | 0 | 3000 | 0 | 3500 | 0 | 2000 | 85.8 | 40 | 0 | |
| 15–17 | 348 | 2300 | 0 | 800 | 0 | 1500 | 0 | 3000 | 0 | 3500 | 0 | 2000 | 86.5 | 45 | 0.3 | |
| All | 3,091 | 2.1 | 0 | 0 | 0 | 1.0 | 90.2 | 1.4 | ||||||||
| Probability of Inadequacy (%) (a) | Female 12–14 Years (n = 373) | Female 15–17 Years (n = 348) | ||||
|---|---|---|---|---|---|---|
| Range of the Intake with the Probability of Inadequacy 1 (mg/day, 12% Bioavailability) | Proportion of Females in this Intake Range 2 (%) (b) | Prevalence of Inadequacy 3 (%) (a × b) | Range of the Intake with the Probability of Inadequacy 1 (mg/day, 12% Bioavailability) | Proportion of Females in this Intake Range 2 (%) (c) | Prevalence of inadequacy 3 (%) (a × c) | |
| 0 | >20.9 | 8.3 | 0.00 | >21.6 | 10.6 | 0.00 |
| 0.04 | 18.5–20.9 | 4.8 | 0.19 | 19.2–21.6 | 5.2 | 0.21 |
| 0.08 | 16.2–18.5 | 9.1 | 0.73 | 16.8–19.2 | 10.6 | 0.85 |
| 0.15 | 14.0–16.2 | 16.9 | 2.54 | 14.7–16.8 | 12.1 | 1.82 |
| 0.25 | 12.7–14.0 | 8.8 | 2.20 | 13.4–14.7 | 6.9 | 1.73 |
| 0.35 | 11.7–12.7 | 11.5 | 4.03 | 12.3–13.4 | 10.6 | 3.71 |
| 0.45 | 10.9–11.7 | 7 | 3.15 | 11.6–12.3 | 6 | 2.70 |
| 0.55 | 10.2–10.9 | 7 | 3.85 | 10.8–11.6 | 4.9 | 2.70 |
| 0.65 | 9.3–10.2 | 8 | 5.20 | 10.0–10.8 | 7.5 | 4.88 |
| 0.75 | 8.6–9.3 | 5.1 | 3.83 | 9.3–10.0 | 4 | 3.00 |
| 0.85 | 7.5–8.6 | 7 | 5.95 | 8.2–9.3 | 10.3 | 8.76 |
| 0.93 | 6.7–7.5 | 2.9 | 2.70 | 7.3–8.2 | 4.6 | 4.28 |
| 0.96 | 6.1–6.7 | 1.6 | 1.54 | 6.8–7.3 | 2 | 1.92 |
| 1 | <6.1 | 1.9 | 1.90 | <6.8 | 4.6 | 4.60 |
| Total probability of inadequate intake for females 4 (%) | − | − | 37.79 | − | − | 41.13 |
© 2019 by the authors. Licensee MDPI, Basel, Switzerland. This article is an open access article distributed under the terms and conditions of the Creative Commons Attribution (CC BY) license (http://creativecommons.org/licenses/by/4.0/).
Share and Cite
Kim, M.; Kim, D.; Yoon, J. Selection of Target Nutrients for the Nutritional Standards of School Lunches in Korea. Nutrients 2019, 11, 2578. https://doi.org/10.3390/nu11112578
Kim M, Kim D, Yoon J. Selection of Target Nutrients for the Nutritional Standards of School Lunches in Korea. Nutrients. 2019; 11(11):2578. https://doi.org/10.3390/nu11112578
Chicago/Turabian StyleKim, Meeyoung, Dongwoo Kim, and Jihyun Yoon. 2019. "Selection of Target Nutrients for the Nutritional Standards of School Lunches in Korea" Nutrients 11, no. 11: 2578. https://doi.org/10.3390/nu11112578
APA StyleKim, M., Kim, D., & Yoon, J. (2019). Selection of Target Nutrients for the Nutritional Standards of School Lunches in Korea. Nutrients, 11(11), 2578. https://doi.org/10.3390/nu11112578