Design, Development and Construct Validation of the Children’s Dietary Inflammatory Index


Abstract
1. Introduction
2. Methods
2.1. C-DIITM Development
Developing a Composite Database Representing a Diversity of Children’s Diets
2.2. Calculation of the Children’s Dietary Inflammatory Index
2.3. Validation Study: NHANES Study Population
2.4. Dietary Assessment
2.5. CRP Data
2.6. Study Population and Covariates
2.7. Statistical Analyses
3. Results
4. Discussion
5. Conclusions
Supplementary Materials
Author Contributions
Funding
Acknowledgments
Conflicts of Interest
References
- Neumann, P.A.; Koch, S.; Hilgarth, R.S.; Perez-Chanona, E.; Denning, P.; Jobin, C.; Nusrat, A. Gut commensal bacteria and regional Wnt gene expression in the proximal versus distal colon. Am. J. Pathol. 2014, 184, 592–599. [Google Scholar] [CrossRef] [PubMed]
- Shehzad, A.; Ha, T.; Subhan, F.; Lee, Y.S. New mechanisms and the anti-inflammatory role of curcumin in obesity and obesity-related metabolic diseases. Eur. J. Nutr. 2011, 50, 151–161. [Google Scholar] [CrossRef] [PubMed]
- Maihöfner, C.; Charalambous, M.P.; Bhambra, U.; Lightfoot, T.; Geisslinger, G.; Gooderham, N.J. Expression of cyclooxygenase-2 parallels expression of interleukin-1beta, interleukin-6 and NF-kappaB in human colorectal cancer. Carcinogenesis 2003, 24, 665–671. [Google Scholar] [CrossRef] [PubMed]
- McCullough, L.E.; Miller, E.E.; Calderwood, L.E.; Shivappa, N.; Steck, S.E.; Forman, M.R.; Mendez, M.A.; Maguire, R.; Fuemmeler, B.F.; Kollins, S.H.; et al. Maternal inflammatory diet and adverse pregnancy outcomes: Circulating cytokines and genomic imprinting as potential regulators? Epigenetics 2017, 12, 688–697. [Google Scholar] [CrossRef] [PubMed]
- Chandra, R.K. Immunodeficiency in undernutrition and overnutrition. Nutr. Rev. 1981, 39, 225–231. [Google Scholar] [CrossRef] [PubMed]
- Chandra, R.K.; Tejpar, S. Diet and immunocompetence. Int. J. Immunopharmacol. 1983, 5, 175–180. [Google Scholar] [CrossRef]
- Chandra, R.K. Nutrition, immunity, and infection: Present knowledge and future directions. Lancet 1983, 1, 688–691. [Google Scholar] [PubMed]
- Kortman, G.A.; Mulder, M.L.; Richters, T.J.; Shanmugam, N.K.; Trebicka, E.; Boekhorst, J.; Timmerman, H.M.; Roelofs, R.; Wiegerinck, E.T.; Laarakkers, C.M.; et al. Low dietary iron intake restrains the intestinal inflammatory response and pathology of enteric infection by food-borne bacterial pathogens. Eur. J. Immunol. 2015, 45, 2553–2567. [Google Scholar] [CrossRef] [PubMed]
- Jones, K.D.; Thitiri, J.; Ngari, M.; Berkley, J.A. ; Childhood malnutrition: Toward an understanding of infections, inflammation, and antimicrobials. Food Nutr. Bull. 2014, 35, S64–S70. [Google Scholar] [CrossRef] [PubMed]
- Elenkov, I.J.; Iezzoni, D.G.; Daly, A.; Harris, A.G.; Chrousos, G.P. Cytokine dysregulation, inflammation and well-being. Neuroimmunomodulation 2005, 12, 255–269. [Google Scholar] [CrossRef] [PubMed]
- Kiecolt-Glaser, J.K.; Derry, H.M.; Fagundes, C.P. Inflammation: Depression fans the flames and feasts on the heat. Am. J. Psychiatry 2015, 172, 1075–1091. [Google Scholar] [CrossRef] [PubMed]
- Hebert, J.R. Growth monitoring: The “G” in GOBI FFF. In Child Health and Survival: The UNICEF GOBI FFF Program; Cash, R., Keusch, G.T., Lamstein, J., Eds.; Croom Helm: London, UK, 1987; pp. 11–20. [Google Scholar]
- Mathe, E.; Nguyen, G.H.; Funamizu, N.; He, P.; Moake, M.; Croce, C.M.; Hussain, S.P. Inflammation regulates microRNA expression in cooperation with p53 and nitric oxide. Int. J. Cancer 2012, 131, 760–765. [Google Scholar] [CrossRef] [PubMed]
- Larsen, J.M. The immune response to Prevotella bacteria in chronic inflammatory disease. Immunology 2017, 151, 363–374. [Google Scholar] [CrossRef] [PubMed]
- Kagnoff, M.F. Immunology of the intestinal tract. Gastroenterology 1993, 105, 1275–1280. [Google Scholar] [CrossRef]
- Saita, E.; Kondo, K.; Momiyama, Y. Anti-inflammatory diet for atherosclerosis and coronary artery disease: Antioxidant foods. Clin. Med. Insights Cardiol. 2014, 8, 61–65. [Google Scholar] [CrossRef] [PubMed]
- Ramallal, R.; Toledo, E.; Martinez, J.A.; Shivappa, N.; Hébert, J.R.; Martínez-González, M.A.; Ruiz-Canela, M. Inflammatory potential of diet, weight gain, and incidence of overweight/obesity: The SUN cohort. Obesity 2017, 25, 997–1005. [Google Scholar] [CrossRef] [PubMed]
- Cavicchia, P.P.; Steck, S.E.; Hurley, T.G.; Hussey, J.R.; Ma, Y.; Ockene, I.S.; Hébert, J.R. A new dietary inflammatory index predicts interval changes in high-sensitivity c-reactive protein. J. Nutr. 2009, 139, 2365–2372. [Google Scholar] [CrossRef] [PubMed]
- Shivappa, N.; Steck, S.E.; Hurley, T.G.; Hussey, J.R.; Hébert, J.R. Designing and developing a literature-derived population-based dietary inflammatory index. Public Health Nutr. 2014, 17, 1689–1696. [Google Scholar] [CrossRef] [PubMed]
- Shivappa, N.; Steck, S.E.; Hurley, T.G.; Hussey, J.R.; Ma, Y.; Ockene, I.S.; Tabung, F.; Hébert, J.R. A population-based dietary inflammatory index predicts levels of c-reactive protein (CRP) in the SEASONS Study. Public Health Nutr. 2014, 17, 1825–1833. [Google Scholar] [CrossRef] [PubMed]
- Shivappa, N.; Hebert, J.R.; Rietzschel, E.R.; De Buyzere, M.L.; Langlois, M.; Debruyne, E.; Marcos, A.; Huybrechts, I. Associations between dietary inflammatory index and inflammatory markers in the Asklepios Study. Br. J. Nutr. 2015, 113, 665–671. [Google Scholar] [CrossRef] [PubMed]
- Shivappa, N.; Wirth, M.D.; Hurley, T.G.; Hébert, J.R. Association between the Dietary Inflammatory Index (DII) and telomere length and C-reactive protein from the National Health and Nutrition Examination Survey-1999-2002. Mol. Nutr. Food Res. 2016, 61, 1600630. [Google Scholar] [CrossRef] [PubMed]
- Tabung, F.K.; Steck, S.E.; Zhang, J.; Ma, Y.; Liese, A.D.; Agalliu, I.; Hingle, M.; Hou, L.; Hurley, T.G.; Jiao, L.; et al. Construct validation of the dietary inflammatory index among postmenopausal women. Ann. Epidemiol. 2015, 25, 398–405. [Google Scholar] [CrossRef] [PubMed]
- Wirth, M.D.; Shivappa, N.; Davis, L.; Hurley, T.G.; Ortaglia, A.; Drayton, R.; Blair, S.N.; Hébert, J.R. Construct validation of the Dietary Inflammatory Index among African Americans. J. Nutr. Health Aging 2017, 21, 487–491. [Google Scholar] [CrossRef] [PubMed]
- Vahid, F.; Shivappa, N.; Hekmatdoost, A.; Hebert, J.R.; Davoodi, S.H.; Sadeghi, M. Association between Maternal Dietary Inflammatory Index (DII) and Abortion in Iranian Women and Validation of DII with Serum Concentration of Inflammatory Factors: Case-Control Study. Appl. Physiol. Nutr. Metab. 2017, 42, 511–516. [Google Scholar] [CrossRef] [PubMed]
- Boden, S.; Wennberg, M.; Van Guelpen, B.; Johansson, I.; Lindahl, B.; Andersson, J.; Shivappa, N.; Hebert, J.R.; Nilsson, L.M. Dietary inflammatory index and risk of first myocardial infarction; a prospective population-based study. Nutr. J. 2017, 16, 21. [Google Scholar] [CrossRef] [PubMed]
- Ge, I.; Rudolph, A.; Shivappa, N.; Flesch-Janys, D.; Hébert, J.R.; Chang-Claude, J. Dietary inflammation potential and postmenopausal breast cancer risk in a German case-control study. Breast 2015, 24, 491–496. [Google Scholar] [CrossRef] [PubMed]
- Peres, L.C.; Bandera, E.V.; Qin, B.; Guertin, K.A.; Shivappa, N.; Hebert, J.R.; Abbott, S.E.; Alberg, A.J.; Barnholtz-Sloan, J.; Bondy, M.; et al. Dietary Inflammatory Index and Risk of Epithelial Ovarian Cancer in African American Women. Int. J. Cancer 2017, 140, 535–543. [Google Scholar] [CrossRef] [PubMed]
- Harmon, B.E.; Wirth, M.D.; Boushey, C.J.; Wilkens, L.R.; Draluck, E.; Shivappa, N.; Steck, S.E.; Hofseth, L.; Haiman, C.A.; Le Marchand, L.; et al. The Dietary Inflammatory Index Is Associated with Colorectal Cancer Risk in the Multiethnic Cohort. J. Nutr. 2017, 147, 430–438. [Google Scholar] [CrossRef] [PubMed]
- 2005–2011 National Health and Nutrition Examination Survey (NHANES); Centers for Disease Control and Prevention, US Department of Health and Human Services: Hyattsville, MD, USA, 2011.
- Commonwealth Scientific Industrial Research Organisation (CSIRO). 2007 Australian National Children’s Nutrition and Physical Activity Survey: Main Findings; Australian Bureau of Statistics, Australian Government Publishing Service: Canberra, Australia, 2008. [Google Scholar]
- Ministry of Health, Labour and Welfare, Tokyo, Japan. National Health and Nutrition Survey, Continuous through Sept 2017. Available online: http://www.mhlw.go.jp/bunya/kenkou/kenkou_eiyou_chousa.html (accessed on 26 July 2018).
- Shivappa, N.; Hebert, J.R.; Marcos, A.; Diaz, L.E.; Gomez, S.; Nova, E.; Michels, N.; Arouca, A.; González-Gil, E.; Frederic, G.; et al. Association between dietary inflammatory index and inflammatory markers in the HELENA study. Mol. Nutr. Food Res. 2017, 61, 1600707. [Google Scholar] [CrossRef] [PubMed]
- Bernal, J.; Lorenzana, A. Dietary diversity and associated factors among beneficiaries of 77 child care centers: Central Regional, Venezuela. Arch. Latinoam. Nutr. 2003, 53, 52–58. [Google Scholar]
- Ali, H.; Ng, S.; Zaghloul, S.; Harrison, G.G.; Qazaq, H.S.; El Sadig, M.; Yeatts, K. ; High proportion of 6 to 18-year-old children and adolescents in the United Arab Emirates are not meeting dietary recommendations. Nutr. Res. 2013, 33, 447–456. [Google Scholar] [CrossRef] [PubMed]
- Liberona, Y.; Castillo, O.; Engler, V.; Villarroel, L.; Rozowski, J. Nutritional profile of schoolchildren from different socio-economic levels in Santiago, Chile. Public Health Nutr. 2010, 14, 142–149. [Google Scholar] [CrossRef] [PubMed]
- US Centers for Disease Control and Prevention (CDC), National Center for Health Statistics. National Health and Nutrition Examination Survey. Atlanta, GA, USA. Available online: https://www.cdc.gov/nchs/nhanes/index.htm (accessed on 26 July 2018).
- Lumley, T. Complex. Surveys: A Guide to Analysis Using R; John Wiley & Sons: Hoboken, NJ, USA, 2010. [Google Scholar]
- Bottai, M.; Frongillo, E.A.; Sui, X.; O’Neill, J.R.; McKeown, R.E.; Burns, T.L.; Liese, A.D.; Blair, S.N.; Pate, R.R. Use of Quantile Regression to Investigate the Longitudinal Association between Physical Activity and Body Mass Index. Obesity 2014, 22, E149–E156. [Google Scholar] [CrossRef] [PubMed]
- Ogden, C.L.; Carroll, M.D.; Curtin, L.R.; McDowell, M.A.; Tabak, C.J.; Flegal, K.M. Prevalence of overweight and obesity in the United States, 1999–2004. JAMA 2006, 295, 1549–1555. [Google Scholar] [CrossRef] [PubMed]
- Ogden, C.L.; Carroll, M.D.; Curtin, L.R.; Lamb, M.M.; Flegal, K.M. Prevalence of high body mass index in US children and adolescents, 2007–2008. JAMA 2010, 303, 242–249. [Google Scholar] [CrossRef] [PubMed]
- Ogden, C.L.; Carroll, M.D.; Kit, B.K.; Flegal, K.M. Prevalence of Childhood and Adult Obesity in the United States, 2011–2012. JAMA 2014, 311, 806–814. [Google Scholar] [CrossRef] [PubMed]
- Freedman, D.S.; Khan, L.K.; Serdula, M.K.; Dietz, W.H.; Srinivasan, S.R. The relation of childhood BMI to adult adiposity: The Bogalusa Heart Study. Pediatrics 2005, 115, 22–27. [Google Scholar] [CrossRef] [PubMed]
- Nathan, B.M.; Moran, A. Metabolic complications of obesity in childhood and adolescence: More than just diabetes. Curr. Opin. Endocrinol. 2008, 15, 21–29. [Google Scholar] [CrossRef] [PubMed]
- Sen, S.; Rifas-Shiman, S.L.; Shivappa, N.; Wirth, M.D.; Hebert, J.R.; Gold, D.R.; Gillman, M.W.; Oken, E. Associations of prenatal and early life dietary inflammatory potential with childhood adiposity and cardiometabolic risk in Project Viva. Pediatr. Obes. 2018, 13, 292–300. [Google Scholar] [CrossRef] [PubMed]
- Nielsen, S.J.; Siega-Riz, A.M.; Popkin, B.M. Trends in energy intake in U.S. between 1977 and 1996: Similar shifts seen across age groups. Obes. Res. 2002, 10, 370–378. [Google Scholar] [CrossRef] [PubMed]
- Nielsen, S.J.; Popkin, B.M. Patterns and trends in food portion sizes, 1977–1998. JAMA 2003, 289, 450–453. [Google Scholar] [CrossRef] [PubMed]
- Nielsen, S.J.; Popkin, B.M. Changes in beverage intake between 1977 and 2001. Am. J. Prev. Med. 2004, 27, 205–210. [Google Scholar] [CrossRef] [PubMed]
- Cui, X.; Jin, Y.; Singh, U.P.; Chumanevich, A.A.; Harmon, B.; Cavicchia, P.; Hofseth, A.B.; Kotakadi, V.; Poudyal, D.; Stroud, B.; et al. Suppression of DNA damage in human peripheral blood lymphocytes by a juice concentrate: A randomized, double-blind, placebo-controlled trial. Mol. Nutr. Food Res. 2012, 56, 666–670. [Google Scholar] [CrossRef] [PubMed]
- Giugliano, D.; Ceriello, A.; Esposito, K. The effects of diet on inflammation: Emphasis on the metabolic syndrome. J. Am. Coll. Cardiol. 2006, 48, 677–685. [Google Scholar] [CrossRef] [PubMed]
- Porrata-Maury, C.; Hernandez-Triana, M.; Rodriguez-Sotero, E.; Vilá-Dacosta-Calheiros, R.; Hernández-Hernández, H.; Mirabal-Sosa, M.; Campa-Huergo, C.; Pianesi, M. Medium- and short-term interventions with ma-pi 2 macrobiotic diet in type 2 diabetic adults of Bauta, Havana. J. Nutr. Metab. 2012, 2012, 856342. [Google Scholar] [CrossRef] [PubMed]
- Hickling, S.; Hung, J.; Knuiman, M.; Divitini, M.; Beilby, J. Are the associations between diet and C-reactive protein independent of obesity? Prev. Med. 2008, 47, 71–76. [Google Scholar] [CrossRef] [PubMed]
- Lopez-Garcia, E.; Schulze, M.B.; Manson, J.E.; Meigs, J.B.; Albert, C.M.; Rifai, N.; Willett, W.C.; Hu, F.B. Consumption of (n-3) fatty acids is related to plasma biomarkers of inflammation and endothelial activation in women. J. Nutr. 2004, 134, 1806–1811. [Google Scholar] [CrossRef] [PubMed]
- Bertran, N.; Camps, J.; Fernandez-Ballart, J.; Arija, V.; Ferre, N.; Tous, M.; Simo, D.; Murphy, M.M.; Vilella, E.; Joven, J. Diet and lifestyle are associated with serum C-reactive protein concentrations in a population-based study. J. Lab. Clin. Med. 2005, 145, 41–46. [Google Scholar] [CrossRef] [PubMed]
- Esmaillzadeh, A.; Kimiagar, M.; Mehrabi, Y.; Azadbakht, L.; Hu, F.B.; Willett, W.C. Fruit and vegetable intakes, C-reactive protein, and the metabolic syndrome. Am. J. Clin. Nutr. 2006, 84, 1489–1497. [Google Scholar] [CrossRef] [PubMed]
- King, D.E.; Mainous, A.G., III; Geesey, M.E.; Woolson, R.F. Dietary magnesium and C-reactive protein levels. J. Am. Coll. Nutr. 2005, 24, 166–171. [Google Scholar] [CrossRef] [PubMed]
- Ma, Y.; Griffith, J.A.; Chasan-Taber, L.; Olendzki, B.C.; Jackson, E.; Sanek, E.J., III; Li, W.; Pagoto, S.L.; Hafner, A.R.; Ockene, I.S. Association between dietary fiber and serum C-reactive protein. Am. J. Clin. Nutr. 2006, 83, 760–766. [Google Scholar] [CrossRef] [PubMed]
- Viscogliosi, G.; Cipriani, E.; Liguori, M.L.; Marigliano, B.; Saliola, M.; Ettorre, E.; Andreozzi, P. Mediterranean dietary pattern adherence: Associations with prediabetes, metabolic syndrome, and related microinflammation. Metab. Syndr. Relat. Disord. 2013, 11, 210–216. [Google Scholar] [CrossRef] [PubMed]
- Wannamethee, S.G.; Lowe, G.D.; Rumley, A.; Bruckdorfer, K.R.; Whincup, P.H. Associations of vitamin C status, fruit and vegetable intakes, and markers of inflammation and hemostasis. Am. J. Clin. Nutr. 2006, 83, 567–574. [Google Scholar] [CrossRef] [PubMed]
- Boynton, A.; Neuhouser, M.L.; Wener, M.H.; Wood, B.; Sorensen, B.; Chen-Levy, Z.; Kirk, E.A.; Yasui, Y.; Lacroix, K.; McTiernan, A. Associations between healthy eating patterns and immune function or inflammation in overweight or obese postmenopausal women. Am. J. Clin. Nutr. 2007, 86, 1445–1455. [Google Scholar] [CrossRef] [PubMed]
- Serrano-Martinez, M.; Palacios, M.; Martinez-Losa, E.; Lezaun, R.; Maravi, C.; Prado, M.; Martínez, J.A.; Martinez-Gonzalez, M.A. A Mediterranean dietary style influences TNF-alpha and VCAM-1 coronary blood levels in unstable angina patients. Eur. J. Nutr. 2005, 44, 348–354. [Google Scholar] [CrossRef] [PubMed]
- Wirth, M.D.; Burch, J.; Shivappa, N.; Violanti, J.M.; Burchfiel, C.M.; Fekedulegn, D.; Andrew, M.E.; Hartley, T.A.; Miller, D.B.; Mnatsakanova, A.; et al. Association of a dietary inflammatory index with inflammatory indices and metabolic syndrome among police officers. J. Occup. Environ. Med. 2014, 56, 986–989. [Google Scholar] [CrossRef] [PubMed]
- Shivappa, N.; Bosetti, C.; Zucchetto, A.; Serraino, D.; La Vecchia, C.; Hébert, J.R. Dietary inflammatory index and risk of pancreatic cancer in an Italian case-control study. Br. J. Nutr. 2015, 113, 292–298. [Google Scholar] [CrossRef] [PubMed]
- Hebert, J.R.; Shivappa, N.; Tabung, F.K.; Steck, S.E.; Wirth, M.D.; Hurley, T.G. On the use of the dietary inflammatory index in relation to low-grade inflammation and markers of glucose metabolism in the Cohort study on Diabetes and Atherosclerosis Maastricht (CODAM) and the Hoorn study. Am. J. Clin. Nutr. 2014, 99, 1520. [Google Scholar] [CrossRef] [PubMed]
- Wood, L.G.; Shivappa, N.; Berthon, B.S.; Gibson, P.G.; Hebert, J.R. Dietary inflammatory index is related to asthma risk, lung function and systemic inflammation in asthma. Clin. Exp. Allergy 2015, 45, 177–183. [Google Scholar] [CrossRef] [PubMed]
- Saneei, P.; Hashemipour, M.; Kelishadi, R.; Esmaillzadeh, A. The Dietary Approaches to Stop Hypertension (DASH) diet affects inflammation in childhood metabolic syndrome: A randomized cross-over clinical trial. Ann. Nutr. Metab. 2014, 64, 20–27. [Google Scholar] [CrossRef] [PubMed]
- Shim, Y.J.P.H. Reanalysis of 2007 Korean National Health and Nutrition Examination Survey (2007 KNHANES) Results by CAN-Pro 3.0 Nutrient Database. Korean J. Nutr. 2009, 42, 577–595. [Google Scholar] [CrossRef]
- Oldewage-Theron, W.; Kruger, R. The association between diet quality and subclinical inflammation among children aged 6–18 years in the Eastern Cape, South Africa. Public Health Nutr. 2017, 20, 102–111. [Google Scholar] [CrossRef] [PubMed]


| C-DII Quartiles | |||||
|---|---|---|---|---|---|
| 1st | 2nd | 3rd | 4th | ||
| Participant | (−3.99, −0.04) | (−0.05, 1.14) | (1.14, 2.07) | (2.08, 4.39) | p-value a |
| Characteristics | |||||
| Age (years) | <0.0001 | ||||
| 10.0 ± 3.0 | 11.0 ± 3.0 | 11.0 ± 3.0 | 11.0 ± 3.0 | ||
| Sex | 0.29 | ||||
| Male | 411 (48.52) | 430 (51.62) | 413 (49.64) | 409 (51.9) | |
| Female | 436 (51.48) | 403 (48.38) | 419 (50.36) | 379 (48.1) | |
| Race | <0.0001 | ||||
| Non-Hispanic Black | 180 (21.25) | 212 (25.45) | 223 (26.8) | 229 (29.06) | |
| Non-Hispanic White | 224 (26.45) | 228 (27.37) | 229 (27.52) | 251 (31.85) | |
| Mexican American | 323 (38.13) | 267 (32.05) | 262 (31.49) | 198 (25.13) | |
| Other | 120 (14.17) | 126 (15.13) | 118 (14.18) | 110 (13.96) | |
| Body mass index (tertiles) b,c,d | 0.19 | ||||
| I | 705 (83.43) | 682 (82.17) | 671 (81.04) | 640 (81.42) | |
| II | 82 (9.7) | 103 (12.41) | 101 (12.2) | 84 (10.69) | |
| III | 58 (6.69) | 45 (5.42) | 56 (6.76) | 62 (7.89) | |
| Asthma e | 0.01 | ||||
| Yes | 128 (15.11) | 134 (16.13) | 145 (17.45) | 155 (19.7) | |
| No | 719 (84.89) | 697 (83.87) | 686 (82.55) | 632 (80.3) | |
| Infection e | 0.06 | ||||
| Yes | 252 (27.39) | 237 (25.76) | 225 (24.46) | 206 (22.39) | |
| No | 571 (24.72) | 579 (25.06) | 595 (25.76) | 565 (24.46) | |
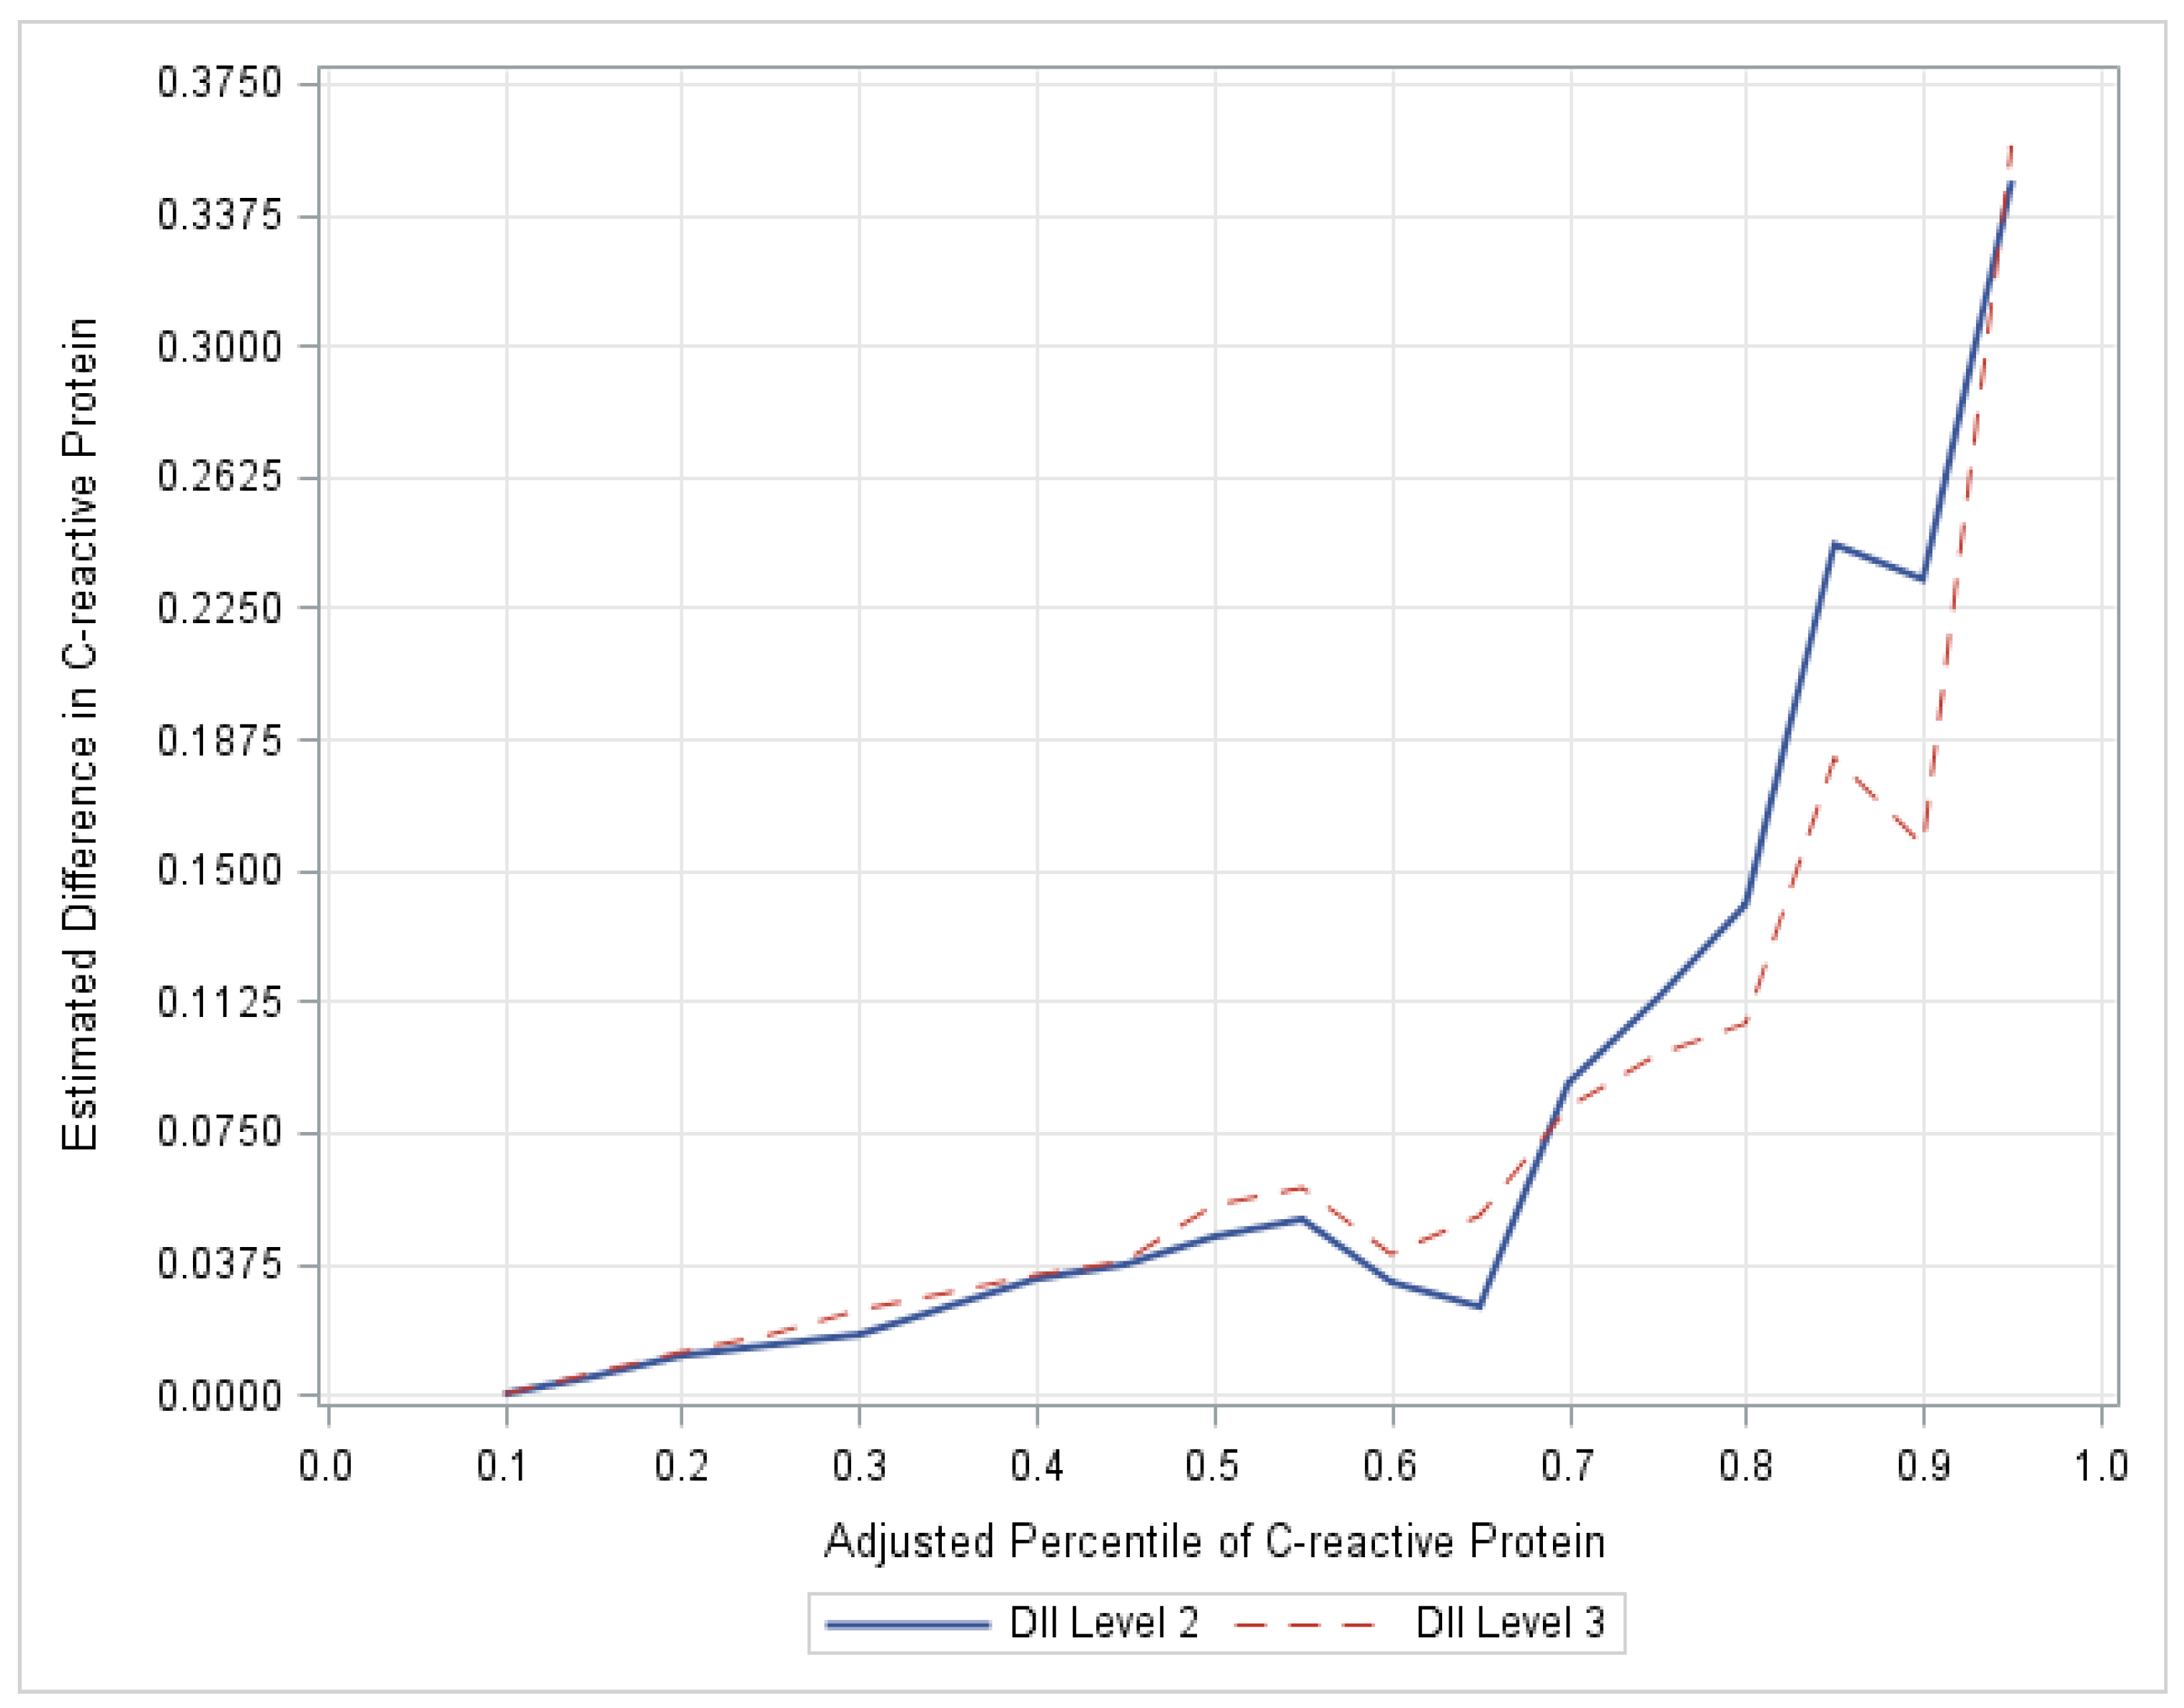
| Weighted CRP Levels | ||||||||||||
|---|---|---|---|---|---|---|---|---|---|---|---|---|
| 25th Percentile | 50th Percentile | 75th Percentile | 90th Percentile | |||||||||
| Est. | SE | 95% CI | Est. | SE | 95% CI | Est. | SE | 95% CI | Est. | SE | 95% CI | |
| C-DII Level | ||||||||||||
| 2 (Quartile 2) | 0.014 | 0.009 | (−0.004, 0.032) | † 0.045 | 0.020 | (0.005, 0.085) | † 0.113 | 0.055 | (0.005, 0.221) | 0.233 | 0.192 | (−0.144, 0.609) |
| 3 (Quartiles 3 + 4) | 0.017 | 0.009 | (−0.001, 0.035) | † 0.054 | 0.023 | (0.009, 0.099) | † 0.097 | 0.041 | (0.016, 0.177) | 0.157 | 0.142 | (−0.122, 0.436) |
© 2018 by the authors. Licensee MDPI, Basel, Switzerland. This article is an open access article distributed under the terms and conditions of the Creative Commons Attribution (CC BY) license (http://creativecommons.org/licenses/by/4.0/).
Share and Cite
Khan, S.; Wirth, M.D.; Ortaglia, A.; Alvarado, C.R.; Shivappa, N.; Hurley, T.G.; Hebert, J.R. Design, Development and Construct Validation of the Children’s Dietary Inflammatory Index. Nutrients 2018, 10, 993. https://doi.org/10.3390/nu10080993
Khan S, Wirth MD, Ortaglia A, Alvarado CR, Shivappa N, Hurley TG, Hebert JR. Design, Development and Construct Validation of the Children’s Dietary Inflammatory Index. Nutrients. 2018; 10(8):993. https://doi.org/10.3390/nu10080993
Chicago/Turabian StyleKhan, Samira, Michael D. Wirth, Andrew Ortaglia, Christian R. Alvarado, Nitin Shivappa, Thomas G. Hurley, and James R. Hebert. 2018. "Design, Development and Construct Validation of the Children’s Dietary Inflammatory Index" Nutrients 10, no. 8: 993. https://doi.org/10.3390/nu10080993
APA StyleKhan, S., Wirth, M. D., Ortaglia, A., Alvarado, C. R., Shivappa, N., Hurley, T. G., & Hebert, J. R. (2018). Design, Development and Construct Validation of the Children’s Dietary Inflammatory Index. Nutrients, 10(8), 993. https://doi.org/10.3390/nu10080993