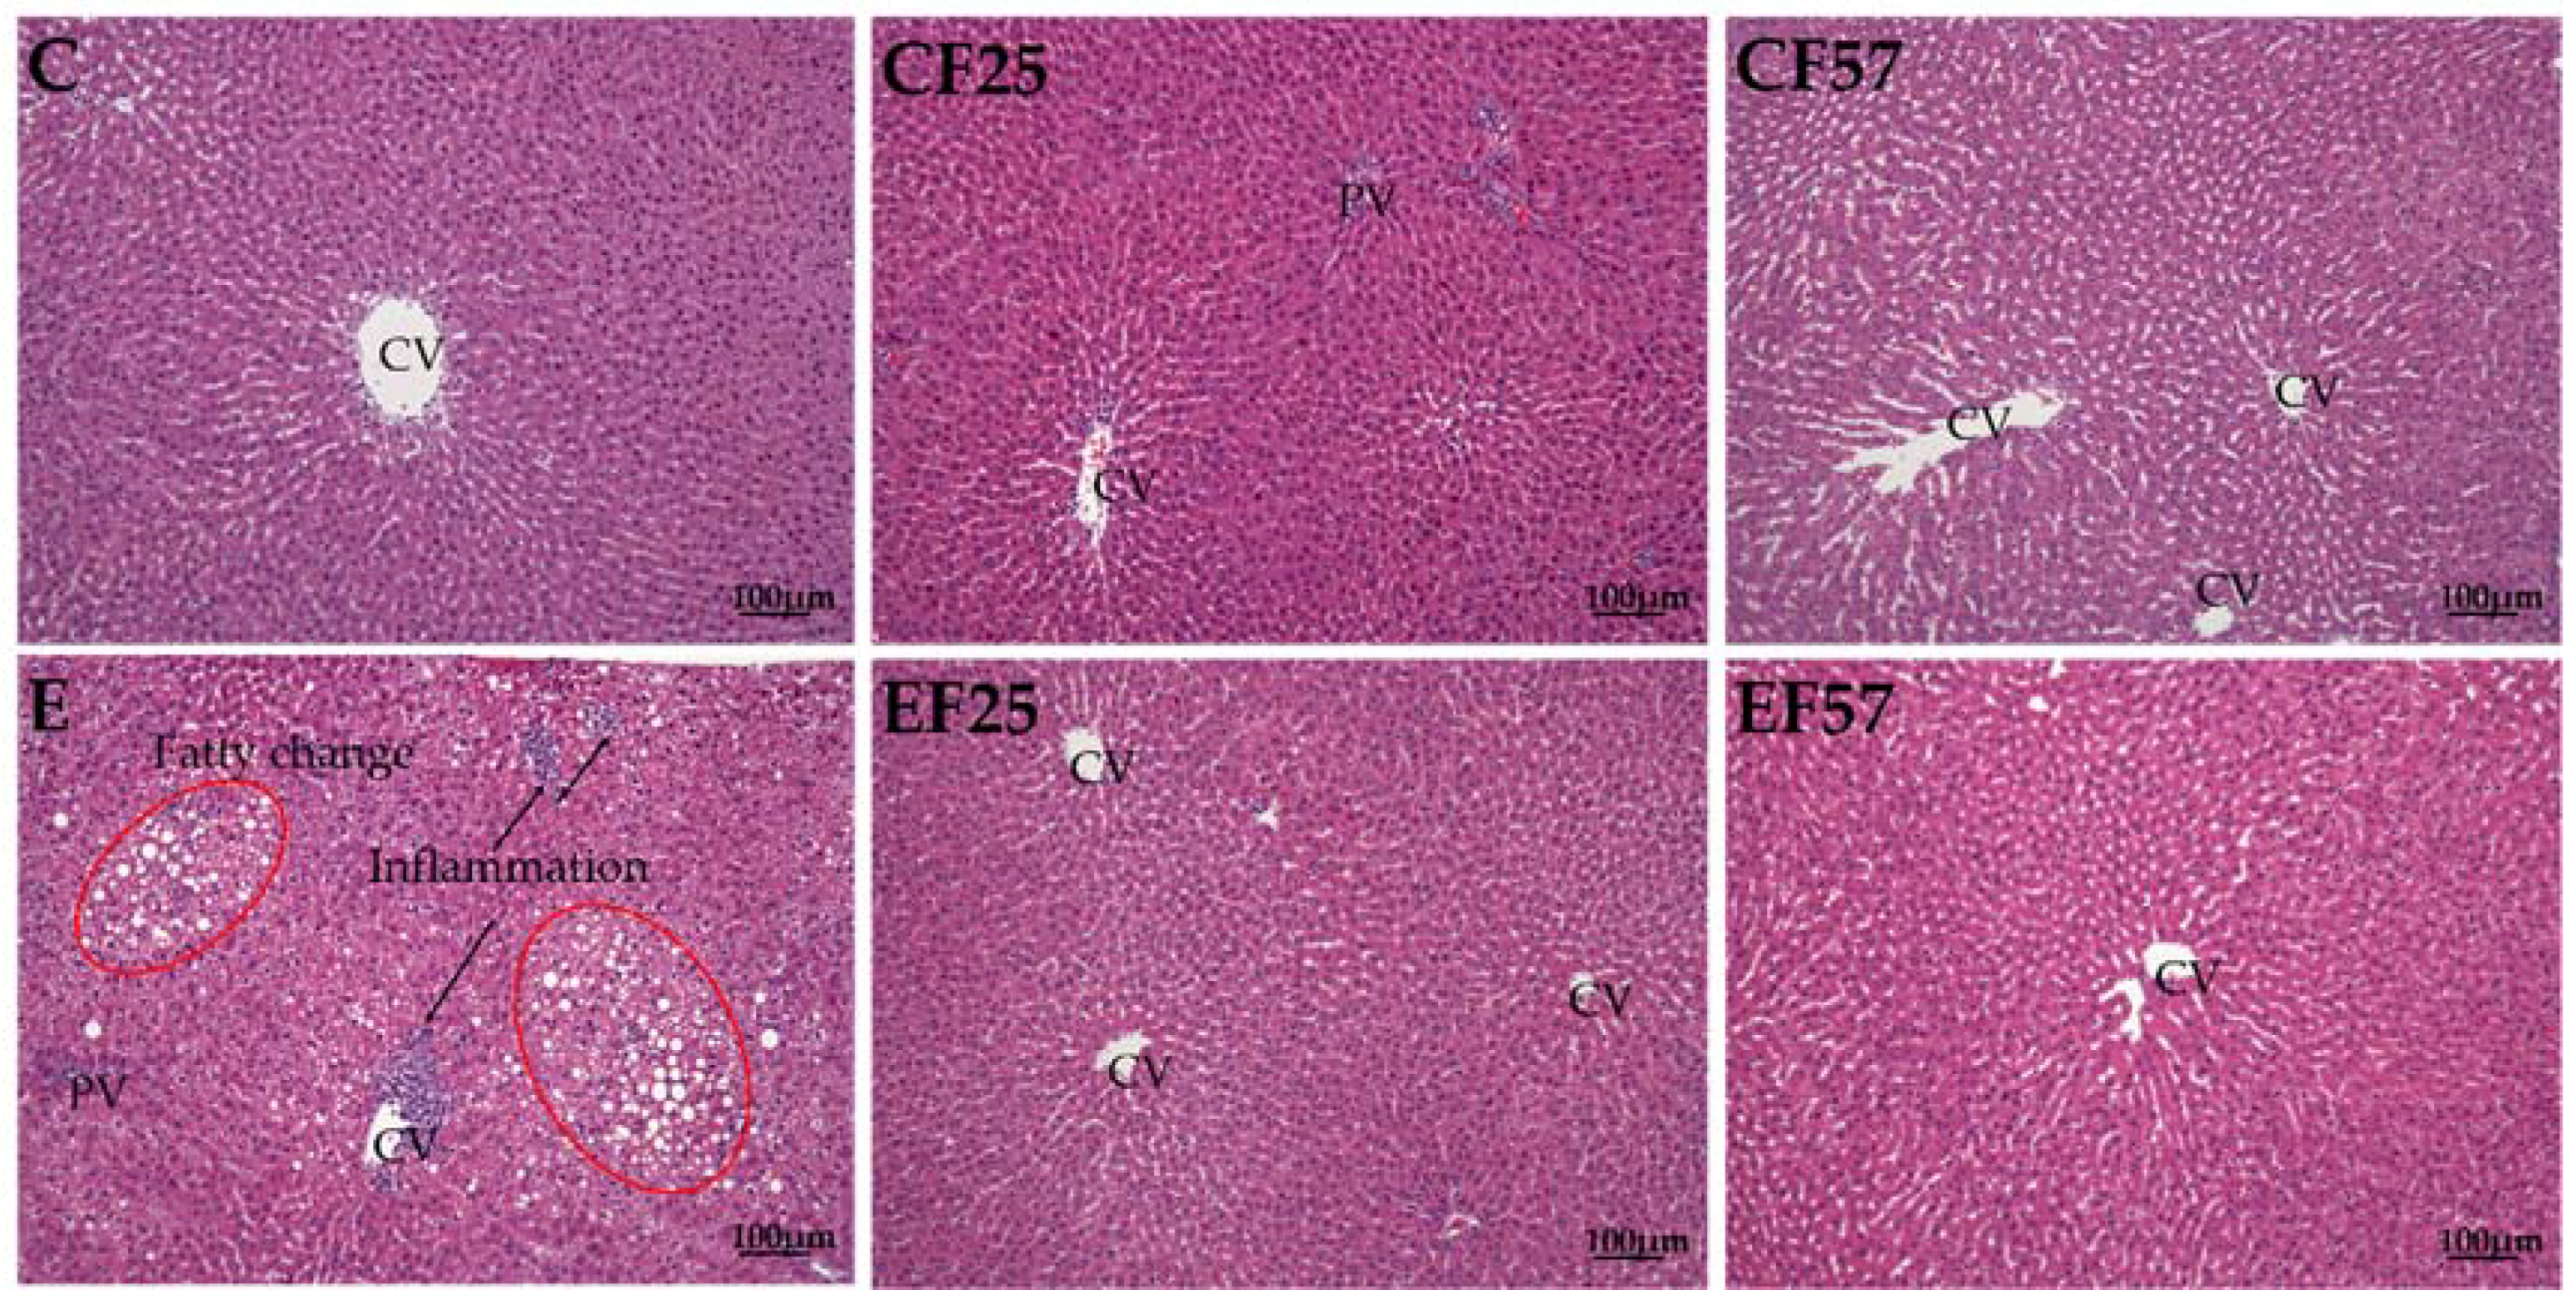
Figure 1.
Effects of fish oil on liver pathology in rats with chronic ethanol feeding. CV, central vein; PV, portal vein. C, control group; CF25, control diet with fish oil substituted for 25% of olive oil; CF57, control diet with fish oil substituted for 57% of olive oil; E, ethanol group; EF25, alcohol-containing diet with fish oil substituted for 25% of olive oil; EF57, alcohol-containing diet with fish oil substituted for 57% of olive oil. hematoxylin A & eosin (H&E) staining showed hepatocyte degeneration and necrosis accompanied by inflammatory cell infiltration (arrow) in E group. Moreover, fatty changes (red circle) were also found in E group.
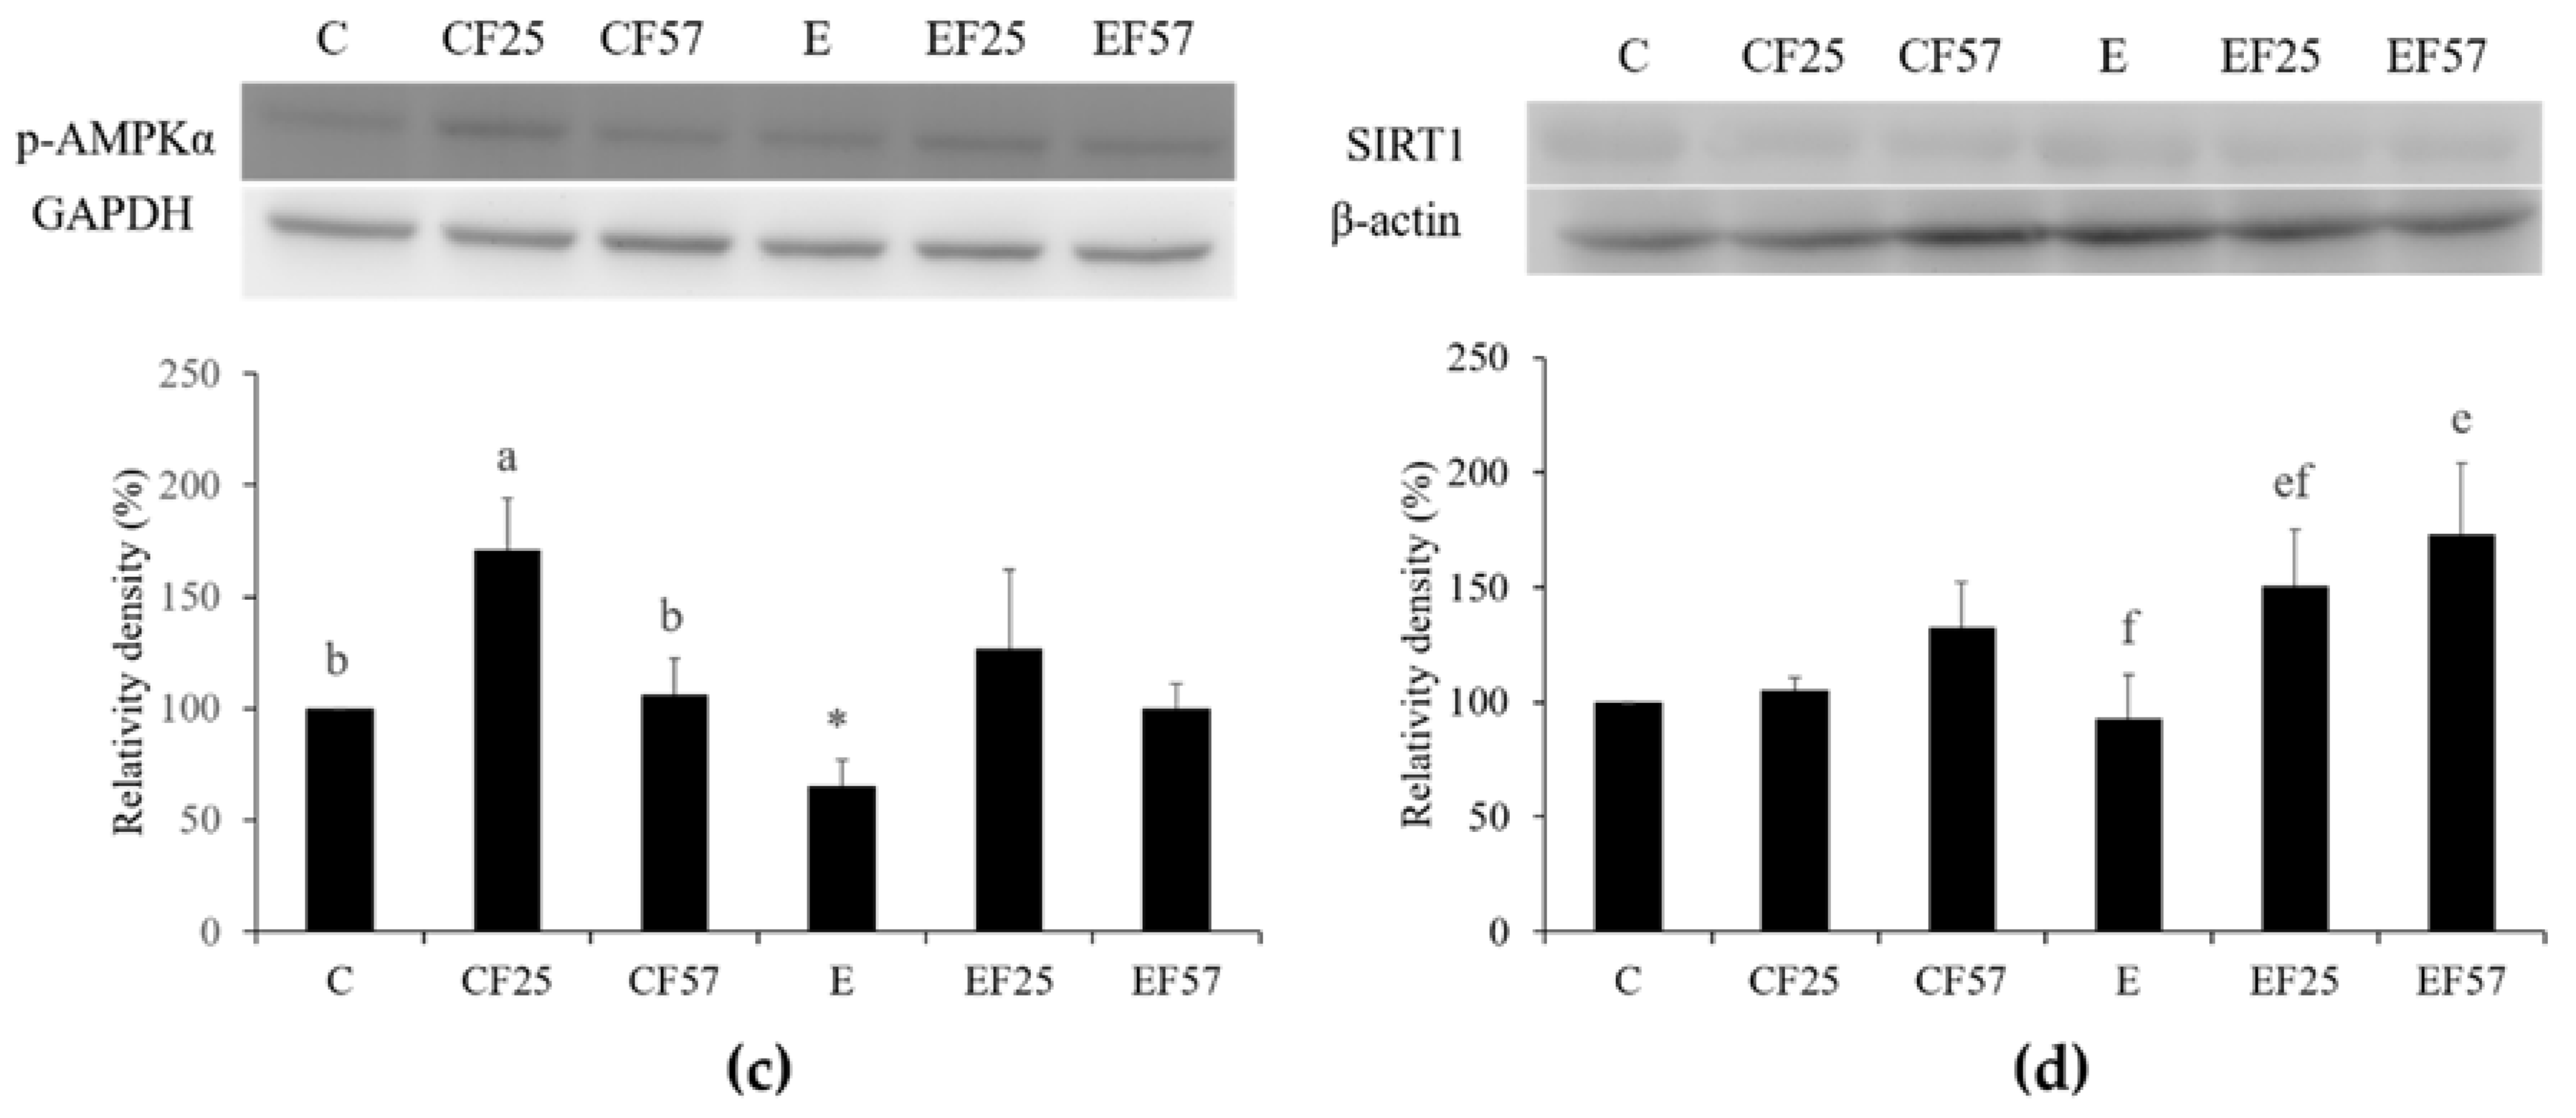
Figure 2.
Effects of fish oil on hepatic adiponectin receptor 2 (adipoR2), AMP-activated protein kinase-α (AMPKα), phosphorylated (p)-AMPKα, and NAD-dependent deacetylase sirtuin-1 (SIRT1) protein expressions in rats with chronic ethanol feeding. Western blots analysis of (a) adipoR2, (b) AMPKα, (c) p-AMPKα, and (d) SIRT1 protein expressions. β-Actin or glyceraldehyde 3-phosphate dehydrogenase (GAPDH) was used as an internal control. Quantitative analysis of protein levels and the ratio to each internal control was calculated by setting the value of group C as 1. Values are expressed as the mean ± SEM. An asterisk (*) shows a significant difference between C and E groups (p < 0.05). Means with different superscript letters shows a significant difference (a,b) among C, CF25, and CF57 groups (p < 0.05). Means with different superscript letters shows a significant difference (e,f) among E, EF25, and EF57 groups (p < 0.05).
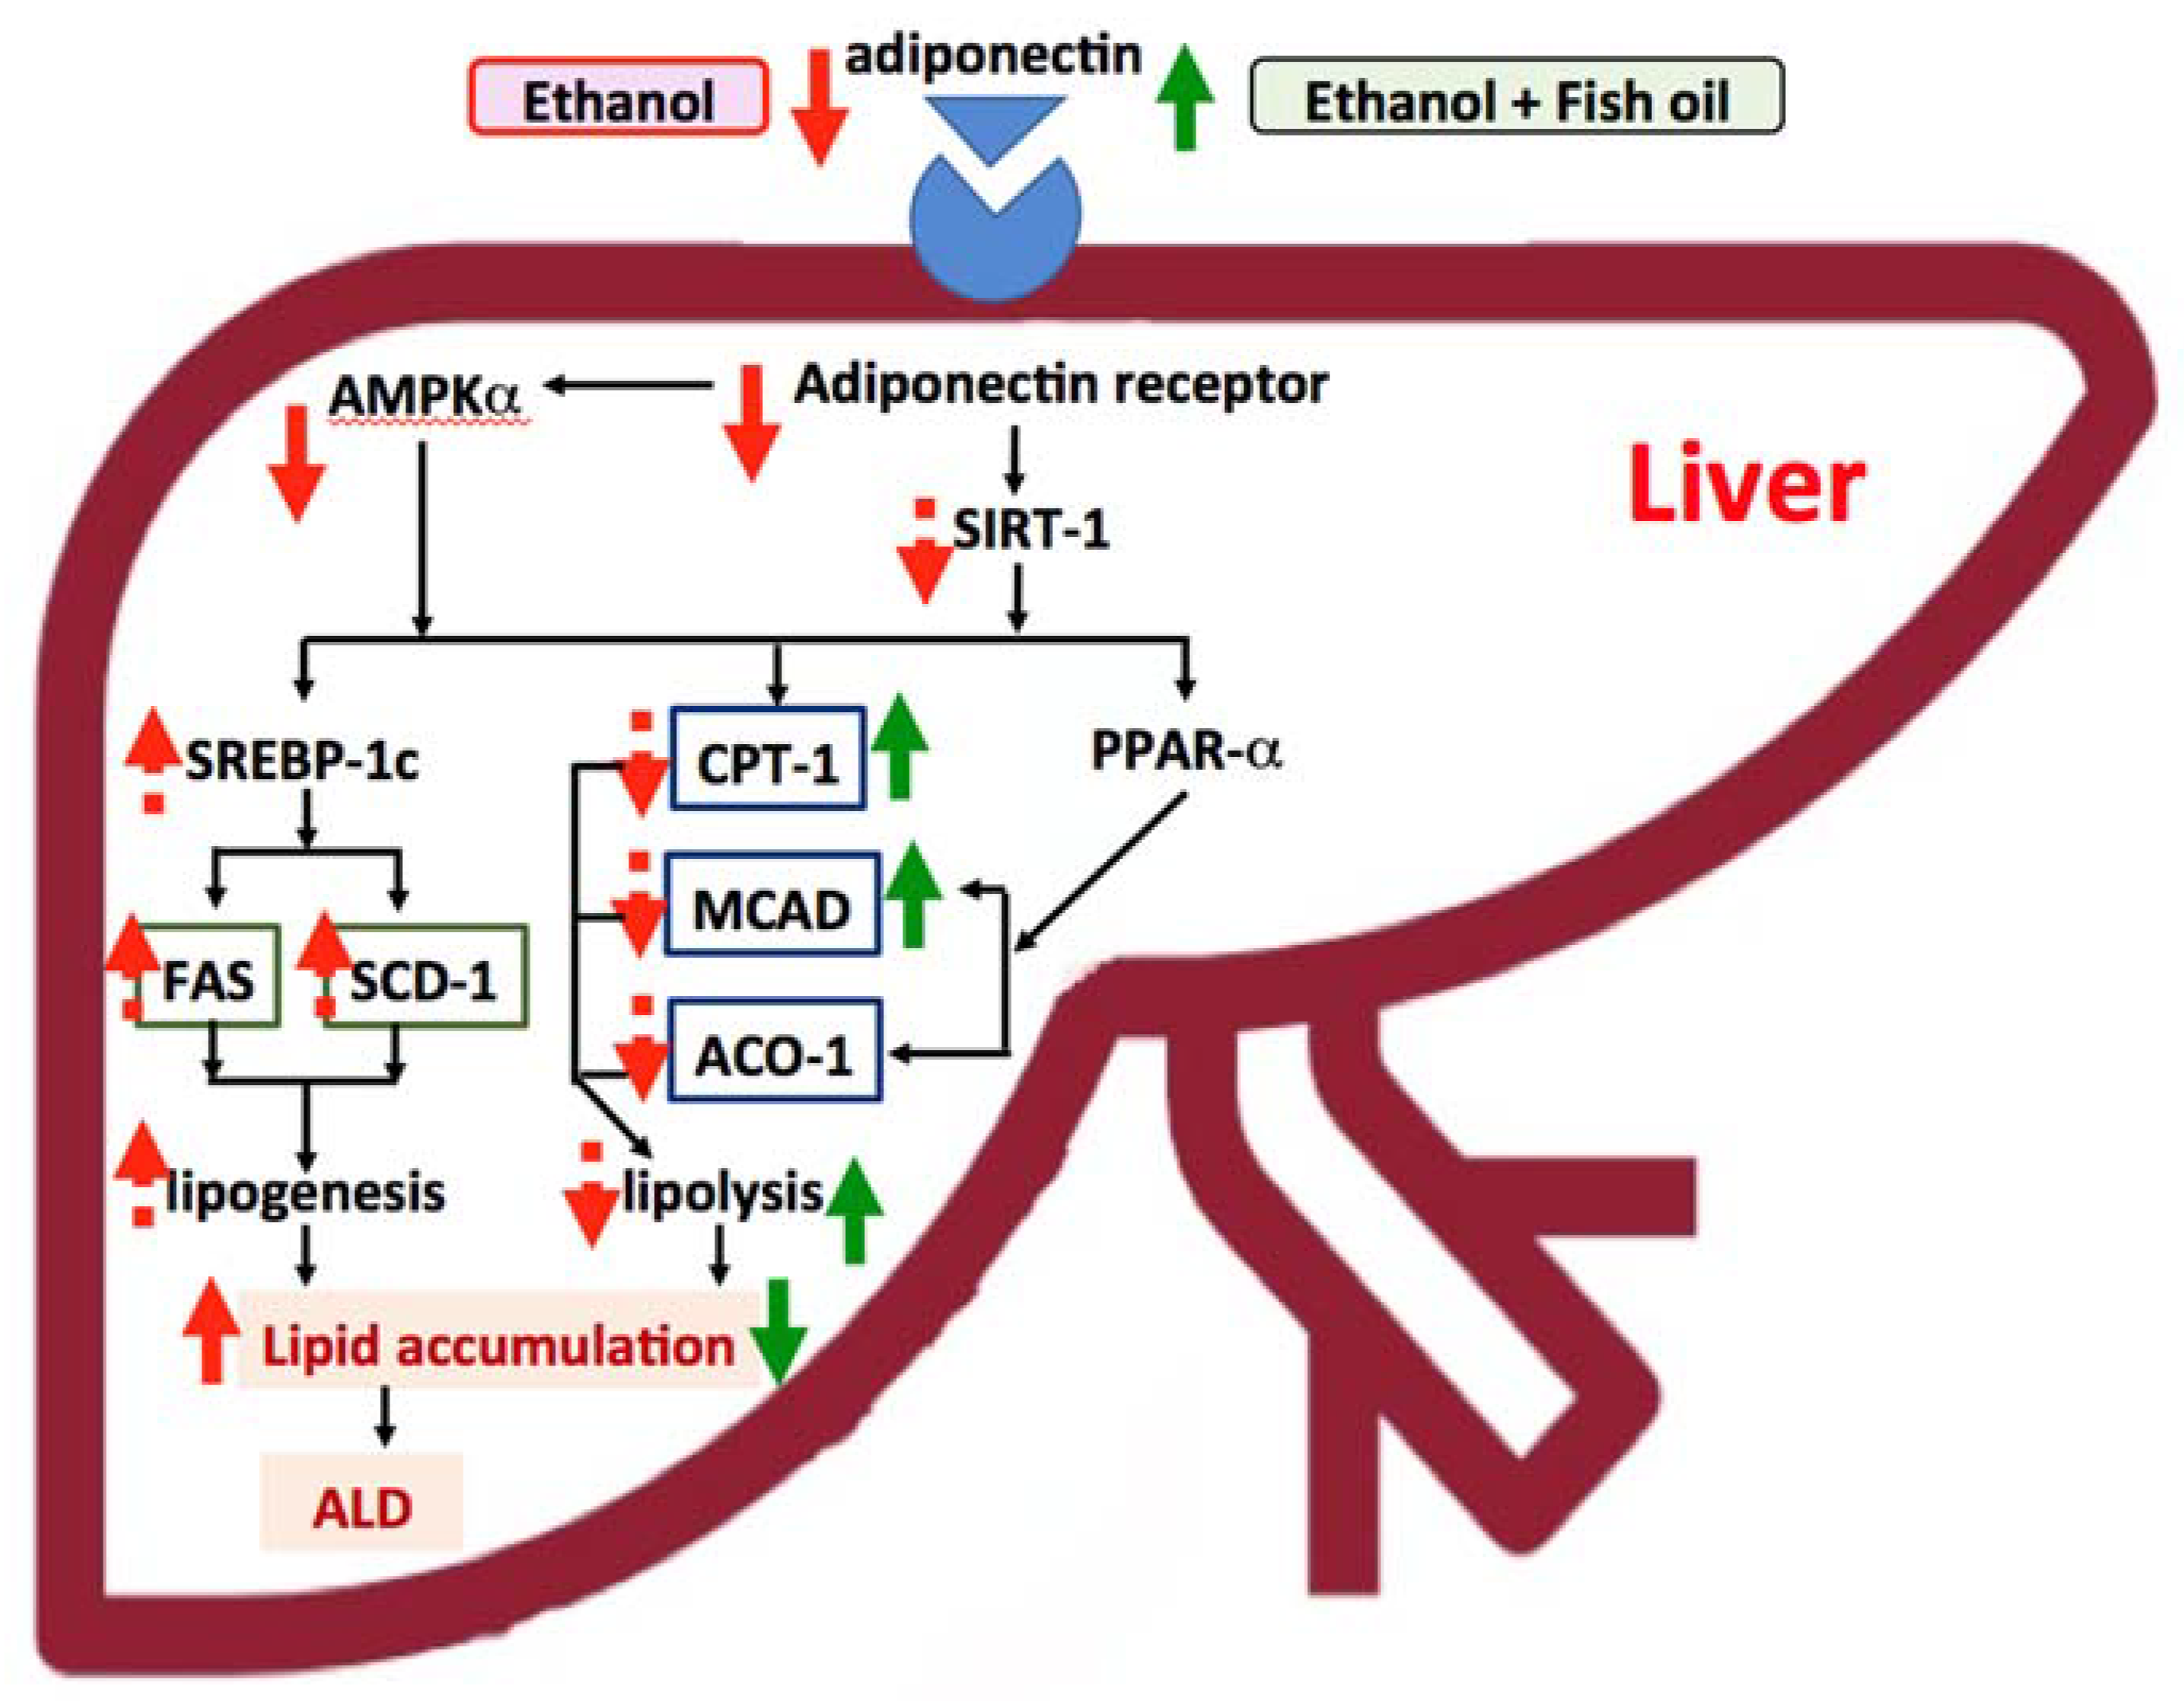
Figure 3.
Effects of fish oil on improving alcoholic liver disease (ALD). The effects for ethanol are presented as red-dotted and solid-line arrows, and dotted lines are presented as up- or down-trending effects. The effects for ethanol with fish oil are presented as green solid-line arrows. (1) In this study, we indicated that chronic ethanol intake decreased the plasma adiponectin level and hepatic adiponectin receptor 2 (adipoR2) protein expression and then possibly reduced AMP-activated protein kinase α (AMPKα). Decreased AMPKα might increase sterol response element-binding protein (SREBP)-1c, fatty acid synthase (FAS), and stearoyl coenzyme A desaturase (SCD)-1 mRNA levels and improve hepatic fatty acid synthesis (only an upward trend). The change of carnitine palmitoyl transferase I (CPT1), medium-chain acyl-coenzyme A dehydrogenase (MCAD), and acyl-CoA oxidase 1 (ACO1) mRNA levels were not observed in this study. (2) With 57% fish oil substitution for olive oil, the plasma adiponectin level was significantly increased and the mRNA levels of downstream enzymes, such as hepatic CPT1 and MCAD were also elevated, which might improve the lipolysis and ameliorate hepatic steatosis in rats fed with ethanol for eight weeks. SIRT1, NAD-dependent deacetylase sirtuin-1.

Table 1.
Antibodies used for Western blotting.
Table 1.
Antibodies used for Western blotting.
| | Antibody (Ab) | Ab Type | Product No. | Source |
|---|
| Primary antibody | adipoR2 | monoclonal | sc-514045 | Santa Cruz Biotechnology |
| SIRT1 | monoclonal | #9475 | Cell Signaling Technology |
| AMPKα | polyclonal | #2532 | Cell Signaling Technology |
| phospho-AMPKα | monoclonal | #2535 | Cell Signaling Technology |
| Internal | β-actin | monoclonal | MAB1501 | Millipore |
| control | GAPDH | monoclonal | #97166 | Cell Signaling Technology |
| Secondary antibody | anti-mouse IgG | | AP124P | Millipore |
| anti-rabbit IgG | | 111-035-003 | Jackson ImmunoResearch Laboratories |
Table 2.
Primers used for the quantitative polymerase chain reaction.
Table 2.
Primers used for the quantitative polymerase chain reaction.
| | Forward 5′→3′ | Reverse 5′→3′ | GenBank No. |
|---|
| SREBP-1c | AGGAGGCCATCTTGTTGCTT | GTTTTGACCCTTAGGGCAGC | XR_001840090.1 |
| FAS | CGGCGTGTGATGGGGCTGGTA | AGGAGTAGTAGGCGGTGGTGTAGA | X62889.1 |
| SCD1 | GTTGGGTGCCTTATCGCTTTCC | CTCCAGCCAGCCTCTTGTCTAC | XM_006231433.2 |
| PPARα | CGGGTCATACTCGCAGGAAA | AAGCGTCTTCTCAGCCATGC | XM_017594681.1 |
| MCAD | GCGGGCATTAAGACCAAAGC | GCCTTTCCCCCGTTGGTTAT | XM_021158408.1 |
| ACO1 | TTCAAGACAAAGCCGTCCAA | TGCTCCCCTCAAGAAAGTCC | XM_021635981.1 |
| CPT-1 | GCATCCCAGGCAAAGAGACA | CGAGCCCTCATAGAGCCAGA | JN960994.1 |
| β-Actin | CACCAGTTCGCCATGGATGACGA | CCATCACACCCTGGTGCCTAGGGC | XM_021163894.1 |
Table 3.
Effects of fish oil on the final body weight, relative liver weight, plasma alanine transaminase (ALT) and aspartate transaminase (AST) activities, plasma adiponectin, and hepatic lipid profiles levels in rats with chronic ethanol feeding 1,2.
Table 3.
Effects of fish oil on the final body weight, relative liver weight, plasma alanine transaminase (ALT) and aspartate transaminase (AST) activities, plasma adiponectin, and hepatic lipid profiles levels in rats with chronic ethanol feeding 1,2.
| | | | F25 | F57 | Ethanol × Fish Oil |
|---|
| Final body weight (g) | C | 425.2 ± 4.4 c | 440.2 ± 4.7 a | 437.0 ± 10.7 b | 0.74 |
| E | 392.0 ± 11.9 * | 379.3 ± 12.9 | 398.7 ± 6.0 | |
| Relative liver weight (%) 3 | C | 2.2 ± 0 b | 2.3 ± 0 b | 2.5 ± 0 a | 0.4533 |
| E | 2.9 ± 0 * | 3.1 ± 0.1 | 3.2 ± 0.2 | |
| Plasma ALT activity (U/L) | C | 33.7 ± 1.9 b | 39.7 ± 6.9 a,b | 41.8 ± 6.7 a | 0.1781 |
| E | 78.0 ± 15.0 * | 81.2 ± 21.4 | 66.2 ± 13.4 | |
| Plasma AST activity (U/L) | C | 75.8 ± 5.0 b | 77.2 ± 1.2 b | 91.5 ± 3.2 a | 0.0003 |
| E | 151.5 ± 10.0 *,e | 122.0 ± 9.8 f | 131.2 ± 16.8 f | |
| Hepatic TGs (mg TGs/g liver) | C | 9.05 ± 0.64 | 10.00 ± 0.68 | 12.26 ± 1.25 | <0.0001 |
| E | 15.51 ± 0.42 *,e | 11.61 ± 1.06 f | 8.93 ± 0.52 g | |
| Hepatic TC (mg TC/g liver) | C | 13.10 ± 0.70 b | 14.60 ± 1.00 a,b | 17.10 ± 1.10 a | 0.8515 |
| E | 17.90 ± 0.90 * | 19.00 ± 1.30 | 20.50 ± 1.40 | |
| Plasma adiponectin (μg/mL) | C | 12.2 ± 1.0 a | 13.9 ± 0.9 a,b | 16.5 ± 2.0 b | 0.947 |
| E | 5.1 ± 1.3 *,f | 7.4 ± 1.3 e,f | 10.3 ± 1.5 e | |
Table 4.
Effects of fish oil on hepatic histopathology in rats with chronic ethanol feeding 1,2.
Table 4.
Effects of fish oil on hepatic histopathology in rats with chronic ethanol feeding 1,2.
| | | | F25 | F57 | Ethanol × Fish Oil |
|---|
| Steatosis | C | 0.2 ± 0.2 | 0.2 ± 0.2 | 0.4 ± 0.2 | 0.0194 |
| E | 2.2 ± 0.2 *,e | 1.0 ± 0.4 f | 0.6 ± 0.4 f | |
| Inflammatory cell infiltration | C | 0.6 ± 0.2 | 0.4 ± 0.2 | 0 ± 0 | 0.042 |
| E | 2.8 ± 0.2 *,e | 1.2 ± 0.4 f | 0.8 ± 0.5 f | |
| Fibrosis | C | 0 ± 0 | 0 ± 0 | 0 ± 0 | 0.3157 |
| E | 0.6 ± 0.2 | 0.2 ± 0.2 | 0.2 ± 0.2 | |
Table 5.
Effects of fish oil on hepatic fatty acid metabolism-related gene mRNA levels in rats with chronic ethanol feeding 1,2,3.
Table 5.
Effects of fish oil on hepatic fatty acid metabolism-related gene mRNA levels in rats with chronic ethanol feeding 1,2,3.
| mRNA Levels | | | F25 | F57 | Ethanol × Fish Oil |
|---|
| SREBP-1c | C | 1.00 ± 0.30 | 1.54 ± 0.29 | 1.90 ± 0.38 | 0.5486 |
| | E | 1.55 ± 0.23 | 1.60 ± 0.17 | 1.92 ± 0.36 | |
| FAS | C | 1.00 ± 0.29 | 1.48 ± 0.19 | 1.87 ± 0.50 | 0.2566 |
| | E | 1.57 ± 0.27 | 1.50 ± 0.2 | 1.53 ± 0.12 | |
| SCD-1 | C | 1.00 ± 0.22 | 1.34 ± 0.19 | 1.37 ± 0.22 | 0.7705 |
| | E | 1.41 ± 0.29 | 1.48 ± 0.26 | 1.78 ± 0.19 | |
| PPARα | C | 1.00 ± 0.28 b | 2.03 ± 0.24 a | 2.11 ± 0.28 a | 0.7043 |
| | E | 1.39 ± 0.40 | 2.15 ± 0.42 | 2.03 ± 0.19 | |
| MCAD | C | 1.00 ± 0.14 | 0.96 ± 0.14 | 1.20 ± 0.14 | 0.2107 |
| | E | 0.83 ± 0.12 f | 1.13 ± 0.05 e,f | 1.63 ± 0.33 e | |
| ACO1 | C | 1.00 ± 0.51 | 1.32 ± 0.15 | 1.25 ± 0.14 | 0.9118 |
| | E | 0.93 ± 0.18 | 1.41 ± 0.32 | 1.40 ± 0.21 | |
| CPT-1 | C | 1.00 ± 0.21 | 1.16 ± 0.17 | 1.37 ± 0.43 | 0.5085 |
| | E | 0.99 ± 0.13 f | 1.09 ± 0.12 f | 1.74 ± 0.14 e | |
Table 6.
Effects of fish oil on the red blood cell membrane fatty acid composition in rats with chronic ethanol feeding 1,2.
Table 6.
Effects of fish oil on the red blood cell membrane fatty acid composition in rats with chronic ethanol feeding 1,2.
| Fatty Acid (%) | C | CF25 | CF57 | E | EF25 | EF57 | Ethanol × Fish Oil |
|---|
| C16:0 | 48.87 ± 2.35 b | 54.69 ± 1.4 a | 51.75 ± 1.42 a,b | 58.68 ± 2.89 *,e | 56.83 ± 3 e | 48.39 ± 0.46 f | 0.0072 |
| C18:0 | 21.72 ± 0.44 | 21.02 ± 0.69 | 20.59 ± 0.81 | 3.73 ± 4.09 *,f | 11.12 ± 5.45 e,f | 21.71 ± 0.39 e | 0.0034 |
| C18:1 (OA, n-9) | 15.59 ± 0.53 | 14.37 ± 0.8 | 15.01 ± 0.51 | 21.41 ± 1.28 *,e | 19.19 ± 1.25 e,f | 17.23 ± 0.16 f | 0.0752 |
| C18:2 (LA, n-6) | 5.01 ± 0.39 | 4.31 ± 0.64 | 4.63 ± 0.68 | 6.03 ± 0.45 | 5.26 ± 0.62 | 4.76 ± 0.17 | 0.5821 |
| C18:3 (ALA, n-3) | 0.82 ± 0.29 | 0.76 ± 0.21 | 1.1 ± 0.23 | 1.32 ± 0.13 | 1.26 ± 0.22 | 1.15 ± 0.08 | 0.4043 |
| C20:4 (AA, n-6) | 1.67 ± 0.48 | 0.76 ± 0.21 | 1.35 ± 0.5 | 1.99 ± 0.45 e | 0.96 ± 0.17 f | 1.19 ± 0.09 f | 0.7422 |
| C20:5 (EPA, n-3) | 1.87 ± 1.34 | 0.41 ± 0.12 | 0.67 ± 0.19 | 1.04 ± 0.24 | 0.82 ± 0.3 | 0.98 ± 0.14 | 0.4347 |
| C22:5 (DPA, n-3) | 0.07 ± 0.05 | 0.11 ± 0.05 | 0.33 ± 0.14 | 0.05 ± 0.06 e,f | 0.03 ± 0.03 f | 0.17 ± 0.04 e | 0.5656 |
| C22:6 (DHA, n-3) | 1.29 ± 0.94 | 0.4 ± 0.1 | 0.73 ± 0.24 | 0.84 ± 0.09 e | 0.72 ± 0.15 e,f | 0.49 ± 0.07 f | 0.5699 |
| SFAs | 71.48 ± 2.33 | 76.95 ± 2.05 | 73.72 ± 2.29 | 64.16 ± 1.51 *,f | 69.37 ± 2.62 e | 71.71 ± 0.56 e | 0.2471 |
| MUFAs | 15.59 ± 0.53 | 14.37 ± 0.8 | 15.01 ± 0.51 | 21.41 ± 1.28 *,e | 19.19 ± 1.25 e,f | 17.23 ± 0.16 f | 0.0752 |
| PUFAs | 12.94 ± 2.66 | 8.68 ± 1.32 | 11.27 ± 2.21 | 14.44 ± 0.48 e | 11.44 ± 1.56 f | 11.06 ± 0.47 f | 0.6211 |
| Total n-3 | 4.06 ± 2.04 | 1.68 ± 0.39 | 2.83 ± 0.68 | 3.26 ± 0.45 | 2.83 ± 0.65 | 2.79 ± 0.25 | 0.539 |
| Total n-6 | 3.87 ± 0.34 | 2.69 ± 0.46 | 3.82 ± 0.87 | 5.14 ± 0.21 *,e | 3.35 ± 0.5 f | 3.51 ± 0.18 f | 0.2175 |
| n-6/n-3 | 1.46 ± 0.26 | 1.84 ± 0.31 | 1.4 ± 0.08 | 1.86 ± 0.52 | 1.26 ± 0.09 | 1.29 ± 0.08 | 0.1641 |
Table 7.
Effects of fish oil on hepatic cell membrane fatty acid compositions in rats with chronic ethanol feeding 1,2.
Table 7.
Effects of fish oil on hepatic cell membrane fatty acid compositions in rats with chronic ethanol feeding 1,2.
| Fatty acid (%) | C | CF25 | CF57 | E | EF25 | EF57 | Ethanol × Fish Oil |
|---|
| C16:0 | 20.34 ± 0.8 | 21.42 ± 0.27 | 21.05 ± 0.76 | 16.88 ± 0.48 * | 17.05 ± 0.4 | 15.73 ± 0.5 | 0.2562 |
| C18:0 | 20.16 ± 0.82 a | 18.72 ± 0.44 a,b | 18.33 ± 0.4 b | 20.26 ± 0.47 | 20.5 ± 0.45 | 21.48 ± 0.91 | 0.0546 |
| C18:1 (OA, n-9) | 15.63 ± 1.43 a | 11.22 ± 0.49 b | 9.15 ± 0.28 b | 19.03 ± 0.66 *,e | 12.25 ± 0.84 f | 9.72 ± 0.63 g | 0.18 |
| C18:2 (LA, n-6) | 11.68 ± 0.3 a | 11.92 ± 0.34 a | 9.25 ± 0.49 b | 11.84 ± 0.42 e | 9.58 ± 0.3 f | 9.29 ± 0.21 f | 0.0005 |
| C18:3 (ALA, n-3) | 0.18 ± 0.01 | 0.17 ± 0.01 | 0.18 ± 0.02 | 0.09 ± 0.03 * | 0.19 ± 0.05 | 0.15 ± 0.05 | 0.1761 |
| C20:4 (AA, n-6) | 23.35 ± 1.12 a | 15.25 ± 0.37 b | 15.9 ± 0.39 b | 23.51 ± 0.35 e | 14.61 ± 0.57 g | 16.78 ± 0.69 f | 0.6259 |
| C20:5 (EPA, n-3) | 0.08 ± 0.02 c | 4.07 ± 0.21 b | 4.58 ± 0.13 a | 0.27 ± 0.29 g | 5.24 ± 0.15 f | 6.44 ± 0.33 e | 0.001 |
| C22:5 (DPA, n-3) | 0.47 ± 0.06 c | 1.81 ± 0.07 b | 2.02 ± 0.07 a | 0.5 ± 0.07 f | 2.9 ± 0.17 e | 2.52 ± 0.24 e | 0.0002 |
| C22:6 (DHA, n-3) | 4.8 ± 0.8 c | 13.53 ± 0.32 b | 17.14 ± 0.35 a | 4.4 ± 0.28 f | 15.4 ± 0.7 e | 15.85 ± 1.01 e | 0.0367 |
| SFAs | 41.72 ± 0.25 a | 40.57 ± 0.48 a,b | 39.96 ± 0.69 b | 37.51 ± 0.32 | 38.3 ± 0.55 | 38.08 ± 1.15 | 0.1566 |
| MUFAs | 16.2 ± 1.51 a | 11.52 ± 0.54 b | 9.56 ± 0.33 b | 19.03 ± 0.66 e | 12.25 ± 0.84 f | 9.78 ± 0.68 g | 0.2783 |
| PUFAs | 42.08 ± 1.54 b | 47.91 ± 0.31 a | 50.48 ± 0.49 a | 43.47 ± 0.41 g | 49.45 ± 0.69 f | 52.13 ± 0.59 e | 0.9785 |
| Total n-3 | 5.53 ± 0.85 b | 19.59 ± 0.21 a | 23.91 ± 0.28 a | 5.26 ± 0.52 f | 23.73 ± 0.71 e | 24.96 ± 1.16 e | 0.0054 |
| Total n-6 | 24.86 ± 1.08 a | 16.4 ± 0.38 b | 17.32 ± 0.41 b | 26.37 ± 0.21 e | 16.14 ± 0.5 g | 17.88 ± 0.73 f | 0.3082 |
| n-6/n-3 | 4.79 ± 0.48 a | 0.84 ± 0.02 b | 0.72 ± 0.02 b | 5.2 ± 0.45 e | 0.68 ± 0.04 f | 0.73 ± 0.06 f | 0.5105 |
Table 8.
Correlations of hepatic n-3 and n-6 fatty acids, the n-6/n-3 ratio, and histopathology scores with factors of lipid metabolism 1.
Table 8.
Correlations of hepatic n-3 and n-6 fatty acids, the n-6/n-3 ratio, and histopathology scores with factors of lipid metabolism 1.
| | Hepatic n-3 Fatty Acids | Hepatic n-6 Fatty Acids | Hepatic n-6/n-3 Ratio |
|---|
| | r | p | r | p | r | p |
| Steatosis | −0.28714 | 0.1239 | 0.37631 | 0.0404 | 0.35871 | 0.0516 |
| Inflammatory cell infiltration | −0.44613 | 0.00135 | 0.50184 | 0.0047 | 0.50691 | 0.0043 |
| Adiponectin | 0.29971 | 0.0758 | −0.35711 | 0.0325 | −0.34411 | 0.0399 |
| SIRT1 | 0.46795 | 0.004 | −0.32857 | 0.0504 | −0.44387 | 0.0067 |
| MCAD | 0.43524 | 0.008 | −0.25395 | 0.135 | −0.32566 | 0.0526 |
| CPT-1 | 0.37398 | 0.0418 | −0.1905 | 0.3133 | −0.32736 | 0.0774 |


 ,
, 


