Regression Analysis to Identify Factors Associated with Household Salt Iodine Content at the Sub-National Level in Bangladesh, India, Ghana and Senegal


Abstract
:1. Introduction
2. Materials and Methods
2.1. Survey Design
2.2. Survey Administration and Field Procedures
2.3. Indicators/Survey Tools
2.4. Determination of Salt Iodine Content
2.5. Data Analysis
3. Results
3.1. Single Variable Regression Analyses and Household Iodised Salt Coverage
3.2. Multiple Variable Regression Analyses
4. Discussion
5. Conclusions
Acknowledgments
Author Contributions
Conflicts of Interest
References
- United Nations Children’s Fund; World Health Organization. World Summit for Children-Mid-Decade Goal: Iodine Deficiency Disorders; Special Session; UNICEF-WHO Joint Committee on Health Policy: Geneva, Switzerland, 1994. [Google Scholar]
- Division of Communication, UNICEF. The State of the World’s Children 2017; UNICEF: New York, NY, USA, 2017. [Google Scholar]
- International Council for Control of Iodine Deficiency Disorders; United Nations Children’s Fund (UNICEF); World Health Organization (WHO). Assessment of Iodine Deficiency Disorders and Monitoring Their Elimination: A Guide for Programme Managers; World Health Organization (WHO): Geneva, Switzerland, 2007; ISBN 978-92-4-159582-7. [Google Scholar]
- Tran, T.D.; Hetzel, B.; Fisher, J. Access to iodized salt in 11 low- and lower-middle-income countries: 2000 and 2010. Bull. World Health Organ. 2016, 94, 122–129. [Google Scholar] [CrossRef] [PubMed]
- UNICEF STATISTICS. Available online: http://data.unicef.org/nutrition/iodine.html (accessed on 27 May 2016).
- Knowles, J.M.; Garrett, G.S.; Gorstein, J.; Kupka, R.; Situma, R.; Yadav, K.; Yusufali, R.; Pandav, C.; Aaron, G.J.; The Universal Salt Iodization Coverage Survey Team. Household Coverage with Adequately Iodized Salt Varies Greatly between Countries and by Residence Type and Socioeconomic Status within Countries: Results from 10 National Coverage Surveys. J. Nutr. 2017, 147, 1004S–1014S. [Google Scholar] [CrossRef] [PubMed]
- Tewari, G.M. Laws and Regulations to Foods and Food Additives. Country Report. Bangladesh; ILSI India: Tokyo, Japan, 2013. [Google Scholar]
- Ghana Standards Authority. Spices and Condiments—Specifications for Salt Fortified with Iodine GS 154, 3rd ed.; Government of Ghana: Accra, Ghana, 2006.
- Legislative Department. The Food Safety and Standards Act. Act No. 34; Ministry of Law and Justice: New Delhi, India, 2006.
- Republic of Senegal Répertoire des Normes Agroalimentaires de l’Association Sénégalaise de Normalisation (ASN). Available online: http://asn.sn/IMG/pdf/repertoire_des_normes_dans_le_domaine_agroalimentaire_de_l_asn.pdf (accessed on 8 August 2017).
- Salt Industry in India. Available online: http://www.saltcomindia.gov.in/industry_india.html?tp=Salt (accessed on 30 January 2017).
- Hoogendoorn, A.; Luthringer, C.L.; Parvanta, I.; Garrett, G.S. Food Fortification: Global Mapping Study; European Commission: Brussels, Belgium, 2016. [Google Scholar]
- Centre for Nutrition and Food Security, International Centre for Diarrhoeal Disease Research, Bangladesh (icddr,b); UNICEF Bangladesh; GAIN; Institute of Public Health and Nutrition National Micronutrients Status Survey 2011-12. Available online: https://static1.squarespace.com/static/56424f6ce4b0552eb7fdc4e8/t/57490d3159827e39bd4d2314/1464405328062/Bangladesh_NMS_final_report_2011-12.pdf (accessed on 2 April 2018).
- Iodine Global Network Global Iodine Nutrition Scorecard 2015. Available online: http://www.ign.org/cm_data/Scorecard_2015_August_26_new.pdf (accessed on 27 May 2016).
- Alkire, S.; Santos, M.E. Acute Multidimensional Poverty—A New Index for Developing Countries. Available online: http://www.ophi.org.uk/wp-content/uploads/ophi-wp-591.pdf (accessed on 27 May 2016).
- What Is the Multidimensional Poverty Index?|Human Development Reports. Available online: http://hdr.undp.org/en/content/what-multidimensional-poverty-index (accessed on 26 May 2016).
- Centre for Nutrition and Food Security, International Centre for Diarrhoeal Disease Research, Bangladesh (icddr,b); GAIN. National Salt Iodization Survey, Bangladesh 2015. Summary Report. Available online: http://www.gainhealth.org/wp-content/uploads/2016/05/20151230_National-Salt-Iodization-Survey-Bangladesh-short-form.pdf (accessed on 31 January 2017).
- AIIMS; GAIN; UNICEF India; IGN South Asia; Nielsen (India) Pvt. Ltd.; Ncsoii, India. National Iodine and Sodium Intake Report_India 2015; AIIMS: New Delhi, India, 2015. [Google Scholar]
- IPDSR Senegal; CLM Senegal; GAIN; UNICEF Dakar. Rapport Final de l’Enquête Nationale sur l’Utilisation du sel Adéquatement Iode et des Bouillons par les Ménages et sur le Statut en Iode des Femmes Enceintes et en Âge de Procréer. Sénégal 2014; [Final Report of the National Survey of Use of Adequately Iodized Salt and Bouillon in the Households and of the Iodine Status in Pregnant and Reproductive-Age Women. Senegal 2014]. Available online: http://www.gainhealth.org/wp-content/uploads/2018/03/Final-Report-on-TDCI-in-Senegal-August-2016-FR.pdf (accessed on 20 March 2018).
- Lumley, T. Survey: Analysis of Complex Survey Samples. Available online: https://cran.r-project.org/web/packages/survey/index.html (accessed on 20 March 2018).
- Nahar, B. Report of the National Salt Iodization Survey, Bangladesh 2015; Icddr,b, GAIN: Dhaka, India, 2015. [Google Scholar]
- Timmer, A. Iodine nutrition and universal salt iodization: A landscape analysis in 2012. IDD Newsl. 2012, 40, 5–9. [Google Scholar]
- UNICEF. Managing Universal Salt Iodization Communications (MUSIC): A Tool for Setting Supply Side Targets for Universal Salt Iodization Programs; UNICEF: New York, NY, USA, 2015; Available online: http://ign.org/cm_data/MUSIC_ToolFinal.pdf (accessed on 17 April 2018).
- Gerasimov, G.; van der Haar, F. Selling iodized salt: How a public health campaign fell short in Ukraine. IDD Newsl. 2015, 43, 9–10. [Google Scholar]
- Ambaye, T.G. Knowledge of Iodine Deficiency Disorders and Intake of Iodized Salt in Residents of Mekelle Tigray, Ethiopia. J. Food Sci. Nutr. 2015, 1, 2–7. [Google Scholar] [CrossRef]
- Bangladesh Universal Salt Iodization. Available online: http://www.gainhealth.org/knowledge-centre/project/bangladesh-universal-salt-iodization-2/ (accessed on 5 February 2017).
- Bangladesh. Available online: http://www.micronutrient.org/mi-in-the-world/asia/bangladesh/ (accessed on 5 February 2017).
- Souleymane the Senegalese Salt-Repreneur. Available online: http://www.micronutrient.org/2013/06/souleymane-sengalese-salt-repreneur/ (accessed on 5 February 2017).
- Jooste, P.L. Assessment of the iodine concentration in table salt at the production stage in South Africa. Bull. World Health Organ. 2003, 81, 517–521. [Google Scholar] [PubMed]
- Pandav, C.; Yadav, K.; Lakshmy, R.; Pandey, R.; Salve, H.; Chakrabarty, A.; Knowles, J.; Sankar, R.; Rah, J.; Ansari, M. Across India, women are iodine sufficient. IDD Newsl. 2015, 43, 1–4. [Google Scholar]
- Zimmermann, M.B.; Andersson, M. Assessment of iodine nutrition in populations: Past, present, and future. Nutr. Rev. 2012, 70, 553–570. [Google Scholar] [CrossRef] [PubMed]
- Abizari, A.-R.; Dold, S.; Kupka, R.; Zimmermann, M.B. More than two-thirds of dietary iodine in children in northern Ghana is obtained from bouillon cubes containing iodized salt. Public Health Nutr. 2017, 20, 1107–1113. [Google Scholar] [CrossRef] [PubMed]
- Spohrer, R.; Larson, M.; Maurin, C.; Laillou, A.; Capanzana, M.; Garrett, G.S. The growing importance of staple foods and condiments used as ingredients in the food industry and implications for large-scale food fortification programs in Southeast Asia. Food Nutr. Bull. 2013, 34, S50–S61. [Google Scholar] [CrossRef] [PubMed]
- Knowles, J.; van der Haar, F.; Shehata, M.; Gerasimov, G.; Bimo, B.; Cavenagh, B.; Maramag, C.; Otico, E.; Izwardy, D.; Spohrer, R.; et al. Iodine Intake through Processed Food: Case Studies from Egypt, Indonesia, the Philippines, the Russian Federation and Ukraine, 2010–2015. Nutrients 2017, 9, 797. [Google Scholar] [CrossRef] [PubMed]


| Country | Year | Target Sample Size—HHs (HHs/PSU) | Sample Design | Response Rate | Respondent Characteristics | |||
|---|---|---|---|---|---|---|---|---|
| Stratification | Sampling Scheme | Completed Interviews | Salt Iodine Result | Female | WRA (% 15–17 yo) | |||
| Bangladesh | 2015 | 1512 (12) | 3 strata: Urban (including slum), Rural other (non-low performing), Rural low-performing | Cross-sectional cluster, based on Multiple Indicator Cluster Survey 2009 sampling frame With replacements (99 HHs) | 100.0 | 99.0 | 99.8 | 91.9 (2.4) |
| India | 2014–2015 | 6048 (12) | 12 strata: Urban/Rural by 6 zones: North, North-East, East, West, Central, South | Cross-sectional cluster, PPS within strata Without replacements | 94.5 | 93.9 | 91.3 | 82.2 (0.7) |
| Ghana | 2015 | 2112 (16) | 4 strata: North, Mid, South non-salt-producing, South salt-producing | Cross-sectional cluster, PPS within strata Without replacements | 91.3 | 74.3 | 83.8 | 61.4 (0.0) |
| Senegal | 2014 | 1968 (16) | 3 strata: Urban, Rural non-salt-producing, Rural salt-producing | Cross-sectional cluster, PPS within strata Without replacements | 98.8 | 79.6 | 99.0 | 90.2 (1.4) |
| Single Variable Model—Salt Iodine mg/kg | Multiple Variable Model—Salt Iodine Level | ||||||||||||
|---|---|---|---|---|---|---|---|---|---|---|---|---|---|
| Variable | Level | Number of HHs | % HHs with Salt Iodine > 15 mg/kg | 95% CI | Median | IQR | Mean | 95% CI | p Value | Relative to Reference | 95% CI | p Value (Variable Effect) | p Value (Interaction with Strata) |
| Strata | Rural low-performing | 495 | 25.1 | 14.7, 35.6 | 5.1 | 3.0, 15.4 | 12.4 | 9.6, 15.2 | <0.001 | 0.111 | |||
| Rural other | 502 | 53.6 | 42.1, 65.0 | 20.2 | 3.4, 34.0 | 19.9 a | 16.4, 23.4 | 0.8 | 0.6, 1.0 | ||||
| Urban | 501 | 68.7 | 57.0, 80.4 | 26.7 | 4.2, 37.0 | 24.3 a | 20.4, 28.2 | 1.0 | 0.7, 1.3 | ||||
| Residence Type | Urban | 501 | 68.7 | 57.0, 80.4 | 26.7 | 4.2, 37.0 | 24.3 | 20.4, 28.2 | 0.014 | Not included in multiple variable analysis | |||
| Rural | 997 | 44.3 | 34.3, 54.3 | 9.4 | 3.3, 32.6 | 17.5 | 14.6, 20.4 | ||||||
| MPI Education | Deprived | 1007 | 47.4 | 37.8, 57.0 | 11.1 | 3.3, 33.9 | 18.5 | 15.6, 21.3 | 0.256 | 0.780 | 0.357 | ||
| Not deprived | 491 | 57.5 | 49.0, 66.0 | 22.0 | 3.8, 33.9 | 20.9 | 18.2, 23.7 | 1.0 | 0.8, 1.2 | ||||
| MPI Health | Deprived | 132 | 39.0 | 26.5, 51.5 | 5.8 | 3.0, 27.0 | 14.5 | 11.2, 17.9 | 0.035 | 0.951 | 0.013 | ||
| Not deprived | 1335 | 51.5 | 42.9, 60.0 | 17.8 | 3.4, 33.9 | 19.7 | 17.1, 22.2 | 1.0 | 0.8, 1.3 | ||||
| MPI Living Standards | Deprived | 1228 | 45.6 | 36.8, 54.5 | 10.2 | 3.3, 32.6 | 17.9 | 15.4, 20.5 | 0.002 | 0.669 | 0.629 | ||
| Not deprived | 270 | 72.1 | 62.3, 81.8 | 28.8 | 4.8, 36.9 | 25.0 | 22.1, 27.9 | 1.0 | 0.8, 1.2 | ||||
| Heard of iodine deficiency | No | 394 | 36.5 | 23.4, 49.5 | 5.0 | 2.9, 26.7 | 14.3 | 10.5, 18.1 | 0.002 | 0.983 | 0.089 | ||
| Yes | 1104 | 55.8 | 48.0, 63.7 | 22.4 | 4.0, 34.7 | 21.1 | 18.7, 23.5 | 1.0 | 0.8, 1.2 | ||||
| Heard of iodised salt | No | 283 | 31.1 | 17.2, 45.1 | 4.2 | 2.5, 24.1 | 12.7 | 8.6, 16.7 | <0.001 | 0.974 | 0.289 | ||
| Yes | 1215 | 56.1 | 48.6, 63.6 | 22.8 | 3.8, 34.7 | 21.1 | 18.8, 23.4 | 1.0 | 0.8, 1.2 | ||||
| Salt obtained in sealed pack | No | 403 | 3.5 | 1.0, 6.0 | 3.1 | 2.5, 4.9 | 4.7 | 4.2, 5.3 | <0.001 | <0.001 | <0.001 | ||
| Yes | 1093 | 71.8 | 63.1, 80.5 | 28.8 | 10.2, 36.8 | 25.8 | 23.1, 28.5 | 3.8 | 2.9, 5.0 | ||||
| Respondent looked for iodised salt purchase | No | 418 | 39.6 | 30.5, 48.7 | 5.9 | 3.0, 29.6 | 15.9 | 13.0, 18.9 | <0.001 | 0.003 | 0.086 | ||
| Yes | 179 | 87.0 | 81.0, 93.1 | 33.9 | 26.2, 40.3 | 32.0 a | 29.2, 34.7 | 1.6 a | 1.2, 2.0 | ||||
| Missing/Don’t know | 901 | 49.1 | 37.4, 60.7 | 13.5 | 3.4, 32.6 | 18.5 | 15.2, 21.8 | 1.1 | 0.9, 1.3 | ||||
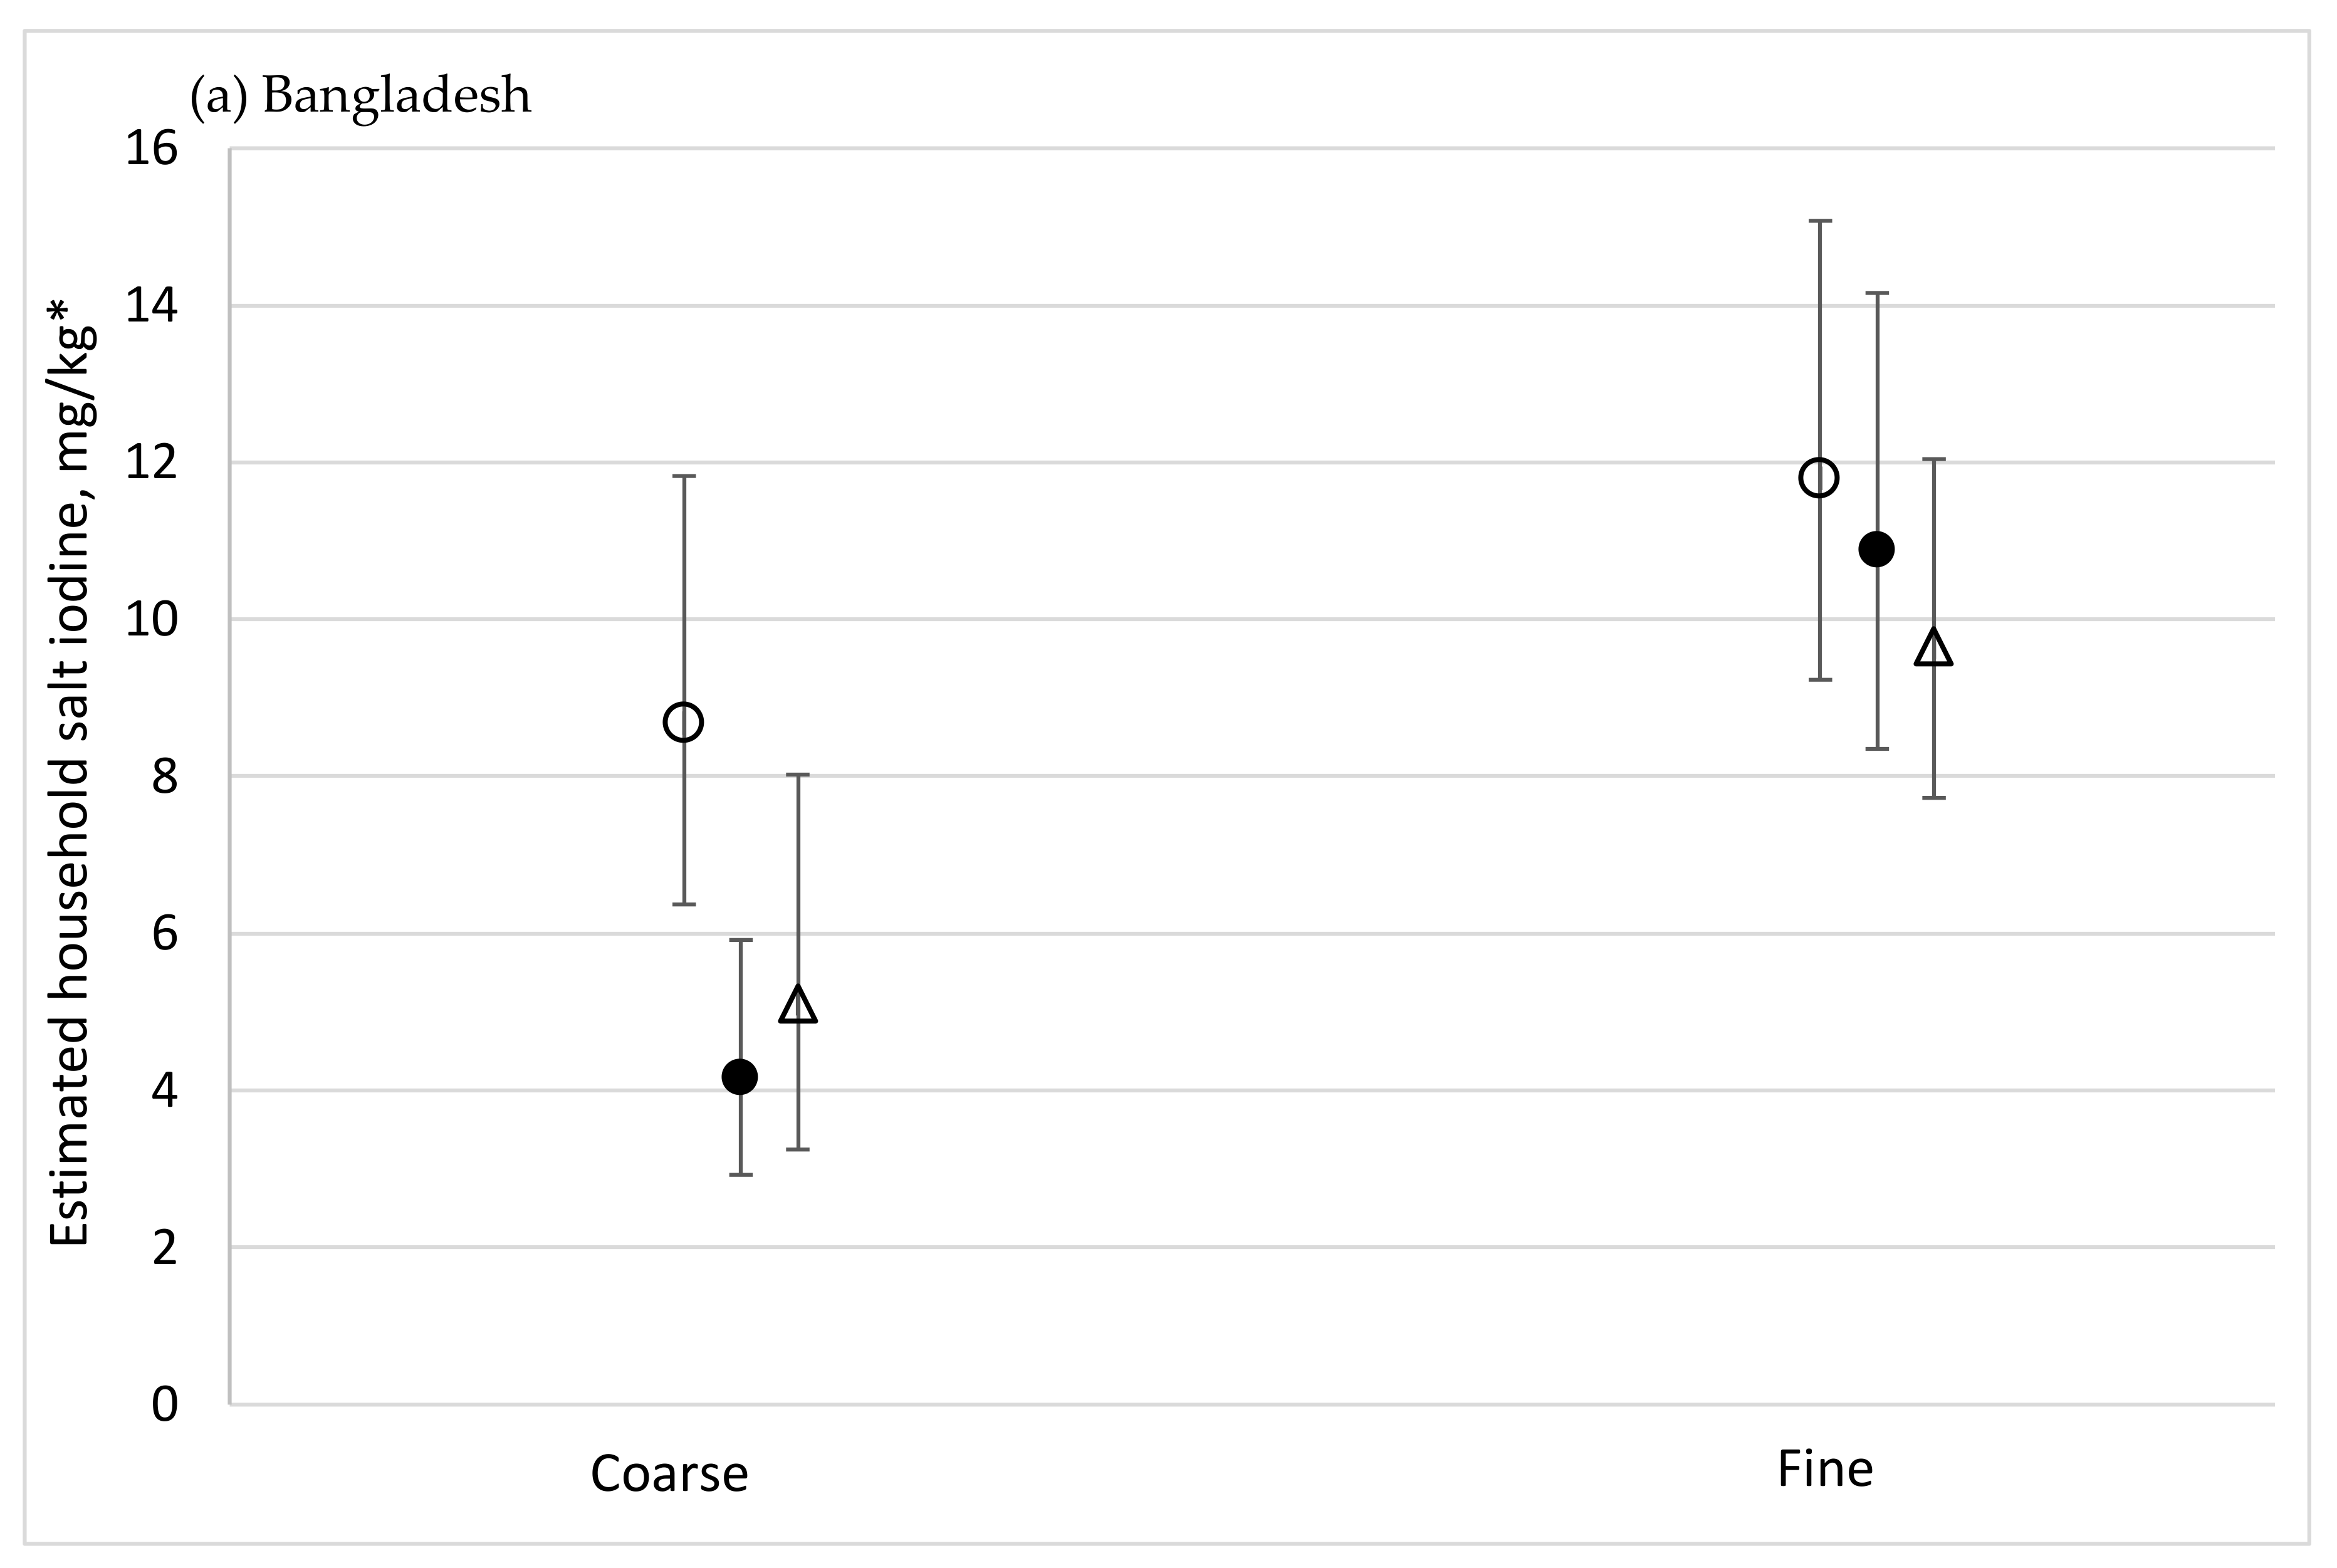
| Grain type | Coarse | 525 | 16.7 | 8.7, 24.8 | 3.8 | 2.5, 8.5 | 9.4 | 7.0, 11.8 | <0.001 | <0.001 | 0.030 | ||
| Fine | 973 | 68.5 | 61.4, 75.7 | 27.6 | 6.2, 36.3 | 24.5 | 22.2, 26.7 | 2.0 | 1.5, 2.6 | ||||
| Single Variable Model—Salt Iodine mg/kg | Multiple Variable MODEL—Salt Iodine Level | ||||||||||||
|---|---|---|---|---|---|---|---|---|---|---|---|---|---|
| Variable | Level | Number of HHs | % HHs with Salt Iodine > 15 mg/kg | 95% CI | Median | IQR | Mean | 95% CI | p Value | Relative to Reference | 95% CI | p Value (Variable Effect) | p Value (Interaction with Zone) |
| Strata | South—Urban | 492 | 69.4 | 62.5, 76.4 | 26.5 | 9.5, 32.8 | 23.8 | 20.6, 27.0 | <0.001 | ||||
| South—Rural | 491 | 55.4 | 46.3, 64.6 | 19.0 | 3.2, 31.7 | 19.7 a | 16.3, 23.2 | 0.9 | 0.7, 1.1 | <0.001 | |||
| West—Urban | 483 | 82.1 | 76.1, 88.0 | 28.6 | 20.1, 32.8 | 26.8 a | 24.7, 28.9 | 1.0 | 0.8, 1.2 | ||||
| West—Rural | 475 | 71.1 | 64.4, 77.8 | 21.3 | 13.8, 31.7 | 22.9 | 20.6, 25.2 | 1.0 | 0.8, 1.3 | ||||
| Central—Urban | 454 | 90.0 | 86.5, 93.4 | 29.6 | 23.3, 33.9 | 28.4 a | 27.0, 29.8 | 1.1 | 1.0, 1.3 | ||||
| Central—Rural | 473 | 67.6 | 60.9, 74.4 | 22.2 | 12.7, 31.7 | 22.5 | 20.7, 24.3 | 1.5 a | 1.2, 1.8 | ||||
| North—Urban | 422 | 95.9 | 93.6, 98.3 | 31.7 | 26.5, 34.9 | 30.4 a | 28.9, 31.8 | 1.1 | 1.0, 1.3 | N/A | |||
| North—Rural | 423 | 78.1 | 70.3, 85.8 | 26.5 | 16.9, 33.9 | 24.8 | 22.5, 27.1 | 0.9 | 0.7, 1.1 | ||||
| East—Urban | 484 | 88.7 | 84.9, 92.4 | 28.6 | 21.2, 32.8 | 27.7 a | 25.8, 29.7 | 1.0 | 0.9, 1.2 | ||||
| East—Rural | 488 | 71.7 | 64.3, 79.2 | 21.2 | 13.8, 30.7 | 23.3 | 20.7, 25.9 | 0.9 | 0.7, 1.1 | ||||
| North East—Urban | 503 | 93.5 | 90.9, 96.0 | 28.6 | 21.2, 33.9 | 29.2 a | 26.8, 31.7 | 1.0 | 0.9, 1.2 | ||||
| North East—Rural | 494 | 76.2 | 67.7, 84.6 | 24.3 | 15.9, 31.7 | 25.4 a | 22.1, 28.8 | 1.0 | 0.8, 1.2 | ||||
| Residence Type | Urban | 2838 | 86.4 | 84.5, 88.2 | 28.6 | 21.2, 33.9 | 27.7 | 26.7, 28.6 | <0.001 | Not included in multiple variable analysis | |||
| Rural | 2844 | 69.8 | 66.7, 73.0 | 22.2 | 12.7, 31.7 | 23.1 | 22.0, 24.2 | ||||||
| MPI Education | Deprived | 1453 | 74.8 | 71.8, 77.9 | 25.4 | 14.8, 32.8 | 25.0 | 23.8, 26.2 | 0.177 | 0.394 | 0.870 | ||
| Not deprived | 4229 | 79.2 | 77.2, 81.1 | 26.5 | 16.9, 32.8 | 25.5 | 24.7, 26.2 | 1.0 | 0.9, 1.0 | ||||
| MPI Health | Deprived | 1561 | 76.2 | 72.7, 79.8 | 24.3 | 15.9, 32.8 | 25.1 | 23.6, 26.6 | 0.240 | 0.035 | 0.290 | ||
| Not deprived | 4121 | 78.8 | 76.8, 80.7 | 26.5 | 16.9, 32.8 | 25.5 | 24.7, 26.2 | 1.1 a | 1.0, 1.2 | ||||
| MPI Living Standards | Deprived | 3418 | 72.9 | 70.4, 75.4 | 23.3 | 14.8, 31.7 | 24.0 | 23.0, 25.0 | <0.001 | 0.167 | 0.586 | ||
| Not deprived | 2258 | 85.8 | 83.8, 87.8 | 29.6 | 21.2, 33.9 | 27.4 | 26.5, 28.2 | 1.1 | 1.0, 1.1 | ||||
| Heard of iodine deficiency | No | 2540 | 73.1 | 70.3, 76.0 | 24.3 | 14.4, 31.7 | 23.7 | 22.7, 24.7 | <0.001 | 0.722 | 0.722 | ||
| Yes | 3142 | 82.0 | 79.9, 84.0 | 28.6 | 19.0, 33.9 | 26.7 | 25.8, 27.5 | 1.0 | 0.9, 1.1 | ||||
| Heard of iodised salt | No | 2096 | 71.9 | 68.7, 75.2 | 23.3 | 13.8, 31.7 | 23.2 | 22.1, 24.2 | <0.001 | 0.632 | 0.498 | ||
| Yes | 3586 | 81.6 | 79.7, 83.5 | 27.5 | 18.0, 33.9 | 26.6 | 25.8, 27.4 | 1.00 | 0.8, 1.1 | ||||
| Salt obtained in sealed pack | No | 293 | 38.9 | 31.4, 46.5 | 8.5 | 3.2, 22.1 | 14.4 | 12.0, 16.9 | <0.001 | 0.978 | 0.009 | ||
| Yes | 5095 | 80.6 | 78.8, 82.3 | 26.5 | 18.0, 32.8 | 26.1 | 25.4, 26.8 | 1.00 | 0.8, 1.3 | ||||
| Salt package had iodine logo or label 1 | No | 218 | 59.0 | 50.8, 67.2 | 19.0 | 5.3, 26.5 | 19.2 | 16.8, 21.6 | <0.001 | 0.110 | 0.006 | ||
| Yes | 3883 | 82.6 | 80.6, 84.5 | 27.5 | 19.0, 33.9 | 26.8 a | 26.0, 27.7 | 1.2 | 1.0, 1.5 | ||||
| Missing/Don’t know | 1581 | 69.5 | 66.0, 73.1 | 23.3 | 12.1, 31.7 | 22.5 a | 21.3, 23.7 | 1.1 | 0.9, 1.4 | ||||
| Salt Brand 1 | No brand | 289 | 50.7 | 43.2, 58.2 | 15.9 | 5.3, 26.5 | 16.6 | 14.5, 18.6 | <0.001 | <0.001 | 0.002 | ||
| Other brand | 1147 | 73.1 | 69.4, 76.7 | 21.2 | 14.8, 29.6 | 22.7 a | 21.6, 23.9 | 1.2 | 1.0, 1.5 | ||||
| Leading market brand | 3188 | 87.4 | 85.5, 89.3 | 29.6 | 21.2, 33.9 | 28.6 a | 27.7, 29.5 | 1.5 a | 1.2, 1.9 | ||||
| Missing/Don’t know | 1058 | 61.9 | 57.4, 66.4 | 20.1 | 7.4, 29.6 | 20.3 | 18.9, 21.7 | 1.2 | 0.9, 1.5 | ||||
| Respondent looked for iodised salt purchase | No | 1069 | 85.3 | 82.6, 87.9 | 29.6 | 21.2, 34.9 | 28.6 | 27.0, 30.2 | <0.001 | 0.210 | 0.028 | ||
| Yes | 1950 | 82.6 | 79.9, 85.2 | 27.5 | 19.0, 33.9 | 26.8 a | 25.7, 27.8 | 1.0 | 0.9, 1.0 | ||||
| Missing/Don’t know | 2663 | 71.7 | 68.7, 74.6 | 23.3 | 12.7, 31.7 | 22.9 a | 22.0, 23.9 | 0.9 | 0.8, 1.0 | ||||
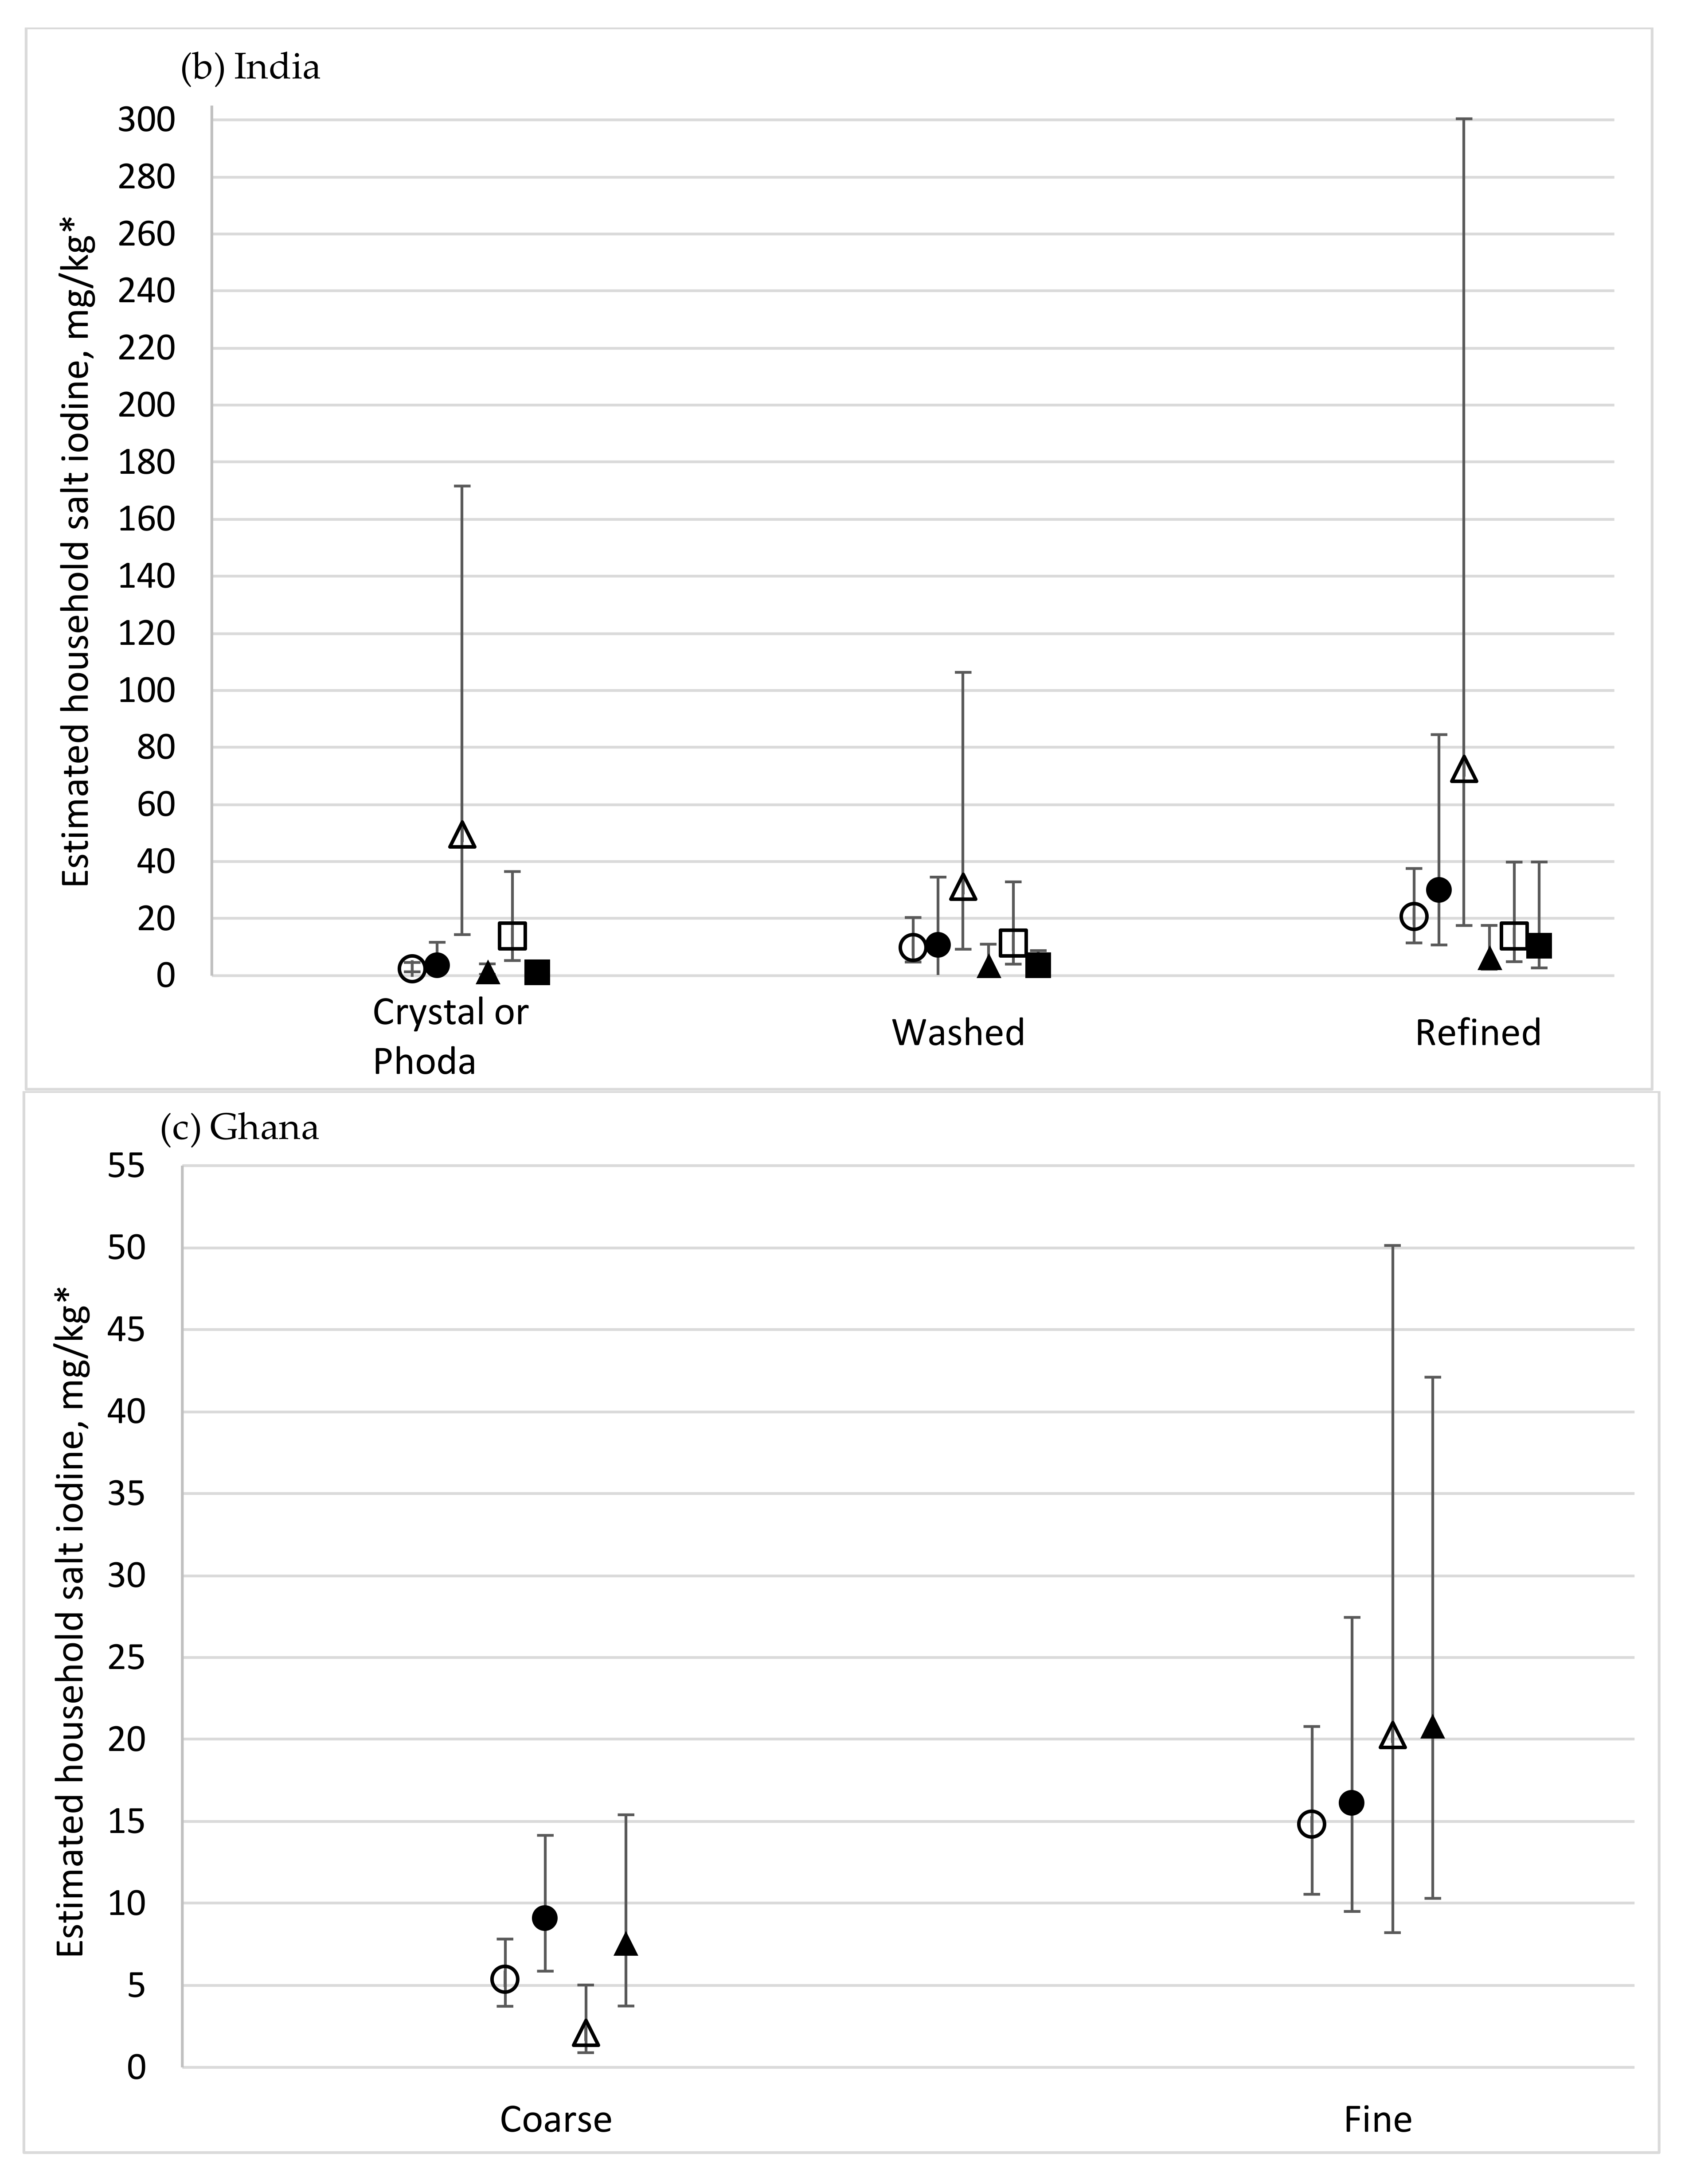
| Grain type | Crystal or phoda | 542 | 24.3 | 18.7, 29.9 | 4.2 | 1.1, 14.8 | 9.5 | 7.8, 11.1 | <0.001 | <0.001 | <0.001 | ||
| Refined | 3777 | 89.6 | 88.0, 91.3 | 29.6 | 21.2, 34.9 | 29.3 a | 28.5, 30.1 | 6.5 a | 4.9, 8.8 | ||||
| Washed | 1321 | 66.2 | 62.1, 70.2 | 20.1 | 12.7, 27.5 | 20.4 a | 19.3, 21.4 | 3.6 a | 2.6, 4.9 | ||||
| Single Variable Model—Salt Iodine mg/kg | Multiple Variable Model—Salt Iodine Level | ||||||||||||
|---|---|---|---|---|---|---|---|---|---|---|---|---|---|
| Variable | Level | Number of HHs | % HHs with Salt Iodine > 15 mg/kg | 95% CI | Median | IQR | Mean | 95% CI | p Value | Relative to Reference | 95% CI | p Value (Variable Effect) | p Value (Interaction with Strata) |
| Strata | South-salt-producing | 431 | 19.3 | 14.1, 24.4 | 4.0 | 2.7, 9.3 | 13.8 | 10.9, 16.7 | <0.001 | ||||
| North | 359 | 37.6 | 28.2, 47.0 | 9.3 | 4.0, 59.3 | 30.3 a | 23.6, 37.1 | 1.7 a | 1.3, 2.8 | <0.001 | |||
| Mid | 407 | 18.6 | 13.0, 24.1 | 5.3 | 2.7, 10.6 | 15.5 | 11.8, 19.1 | 0.8 a | 0.6, 1.0 | ||||
| South-non-salt producing | 372 | 48.6 | 38.2, 59.0 | 13.3 | 4.0, 55.9 | 32.3 a | 25.2, 39.4 | 1.4 a | 1.1, 1.8 | ||||
| Residence Type | Rural | 572 | 25.2 | 16.7, 33.6 | 6.7 | 2.7, 16.0 | 19.1 | 14.3, 23.8 | 0.400 | 0.300 | 0.413 | ||
| Urban | 997 | 31.4 | 26.2, 36.7 | 6.7 | 2.7, 30.6 | 23.5 | 19.7, 27.3 | 0.9 | 0.7, 1.1 | ||||
| MPI Education | Deprived | 654 | 23.6 | 18.4, 28.8 | 5.3 | 2.7, 13.3 | 18.2 | 15.0, 21.4 | 0.028 | 0.740 | 0.154 | ||
| Not deprived | 915 | 32.8 | 28.1, 37.6 | 6.7 | 2.7, 35.9 | 24.3 | 21.0, 27.6 | 1.0 | 0.9, 1.1 | ||||
| MPI Health | Deprived | 877 | 24.6 | 20.1, 29.2 | 5.3 | 2.7, 14.6 | 18.4 | 15.5, 21.3 | 0.008 | 0.639 | 0.566 | ||
| Not deprived | 688 | 33.8 | 28.0, 39.6 | 8.0 | 2.7, 38.6 | 25.4 | 21.3, 29.4 | 1.0 | 0.9, 1.2 | ||||
| MPI Living Standards | Deprived | 1401 | 27.0 | 23.0, 31.0 | 6.7 | 2.7, 17.3 | 20.2 | 17.6, 22.8 | <0.001 | 0.276 | 0.703 | ||
| Not deprived | 167 | 46.2 | 36.4, 55.9 | 14.5 | 4.0, 67.6 | 35.5 | 27.5, 43.5 | 1.1 | 0.9, 1.4 | ||||
| Heard of iodine deficiency | No | 976 | 24.0 | 19.5, 28.5 | 5.3 | 2.7, 13.3 | 18.7 | 15.8, 21.6 | <0.001 | 0.909 | 0.677 | ||
| Yes | 593 | 36.9 | 31.5, 42.3 | 9.3 | 4.0, 45.9 | 26.7 | 22.8, 30.5 | 1.0 | 0.9, 1.2 | ||||
| Heard of iodised salt | No | 291 | 18.1 | 11.8, 24.5 | 5.3 | 2.7, 9.3 | 14.9 | 11.1, 18.7 | <0.001 | 0.526 | 0.192 | ||
| Yes | 1278 | 31.7 | 27.2, 36.2 | 8.0 | 2.7, 30.8 | 23.5 | 20.4, 26.6 | 1.0 | 0.8, 1.1 | ||||
| Salt obtained in sealed pack | No | 1009 | 15.1 | 11.2, 18.9 | 5.3 | 2.7, 9.3 | 13.0 | 10.7, 15.4 | <0.001 | 0.799 | 0.011 | ||
| Yes | 550 | 59.0 | 53.4, 64.7 | 26.6 | 8.0, 75.3 | 40.5 | 35.9, 45.1 | 1.1 | 0.6, 1.8 | ||||
| Salt package had iodine logo or label 1 | No | 84 | 30.7 | 18.0, 43.4 | 5.3 | 2.7, 22.9 | 23.4 | 12.6, 34.2 | <0.001 | 0.773 | 0.564 | ||
| Yes | 396 | 64.7 | 58.6, 70.9 | 33.3 | 9.3, 77.9 | 43.5 a | 38.4, 48.5 | 1.1 | 0.6, 1.8 | ||||
| Missing/Don’t know | 1089 | 16.5 | 12.5, 20.4 | 5.3 | 2.7, 9.3 | 14.2 | 11.8, 16.6 | 1.2 | 0.7, 2.2 | ||||
| Salt Brand 1 | No brand | 66 | 14.9 | 4.8, 25.1 | 5.3 | 2.7, 9.3 | 10.9 | 5.6, 16.2 | <0.001 | 0.199 | 0.004 | ||
| Other brand | 50 | 59.2 | 42.7, 75.6 | 30.6 | 4.2, 58.6 | 39.7 a | 26.1, 53.3 | 1.3 | 0.7, 2.4 | ||||
| Leading market brand | 392 | 65.0 | 58.8, 71.1 | 35.9 | 9.3, 79.8 | 44.6 a | 39.2, 49.9 | 1.6 | 1.0, 2.8 | ||||
| Missing/Don’t know | 1061 | 16.0 | 12.0, 19.9 | 5.3 | 2.7, 9.3 | 13.7 | 11.3, 16.0 | 1.0 | 0.5, 1.9 | ||||
| Respondent looked for iodised salt purchase | No | 1068 | 15.1 | 11.5, 18.7 | 5.3 | 2.7, 9.3 | 12.6 | 10.4, 14.8 | <0.001 | <0.001 | 0.086 | ||
| Yes | 426 | 65.5 | 60.0, 71.0 | 37.2 | 9.3, 79.8 | 45.6 a | 40.6, 50.6 | 1.7 a | 1.4, 2.0 | ||||
| Missing/Don’t know | 75 | 27.9 | 15.4, 40.5 | 8.0 | 4.0, 26.0 | 22.5 a | 13.7, 31.4 | 1.1 | 0.8, 1.5 | ||||
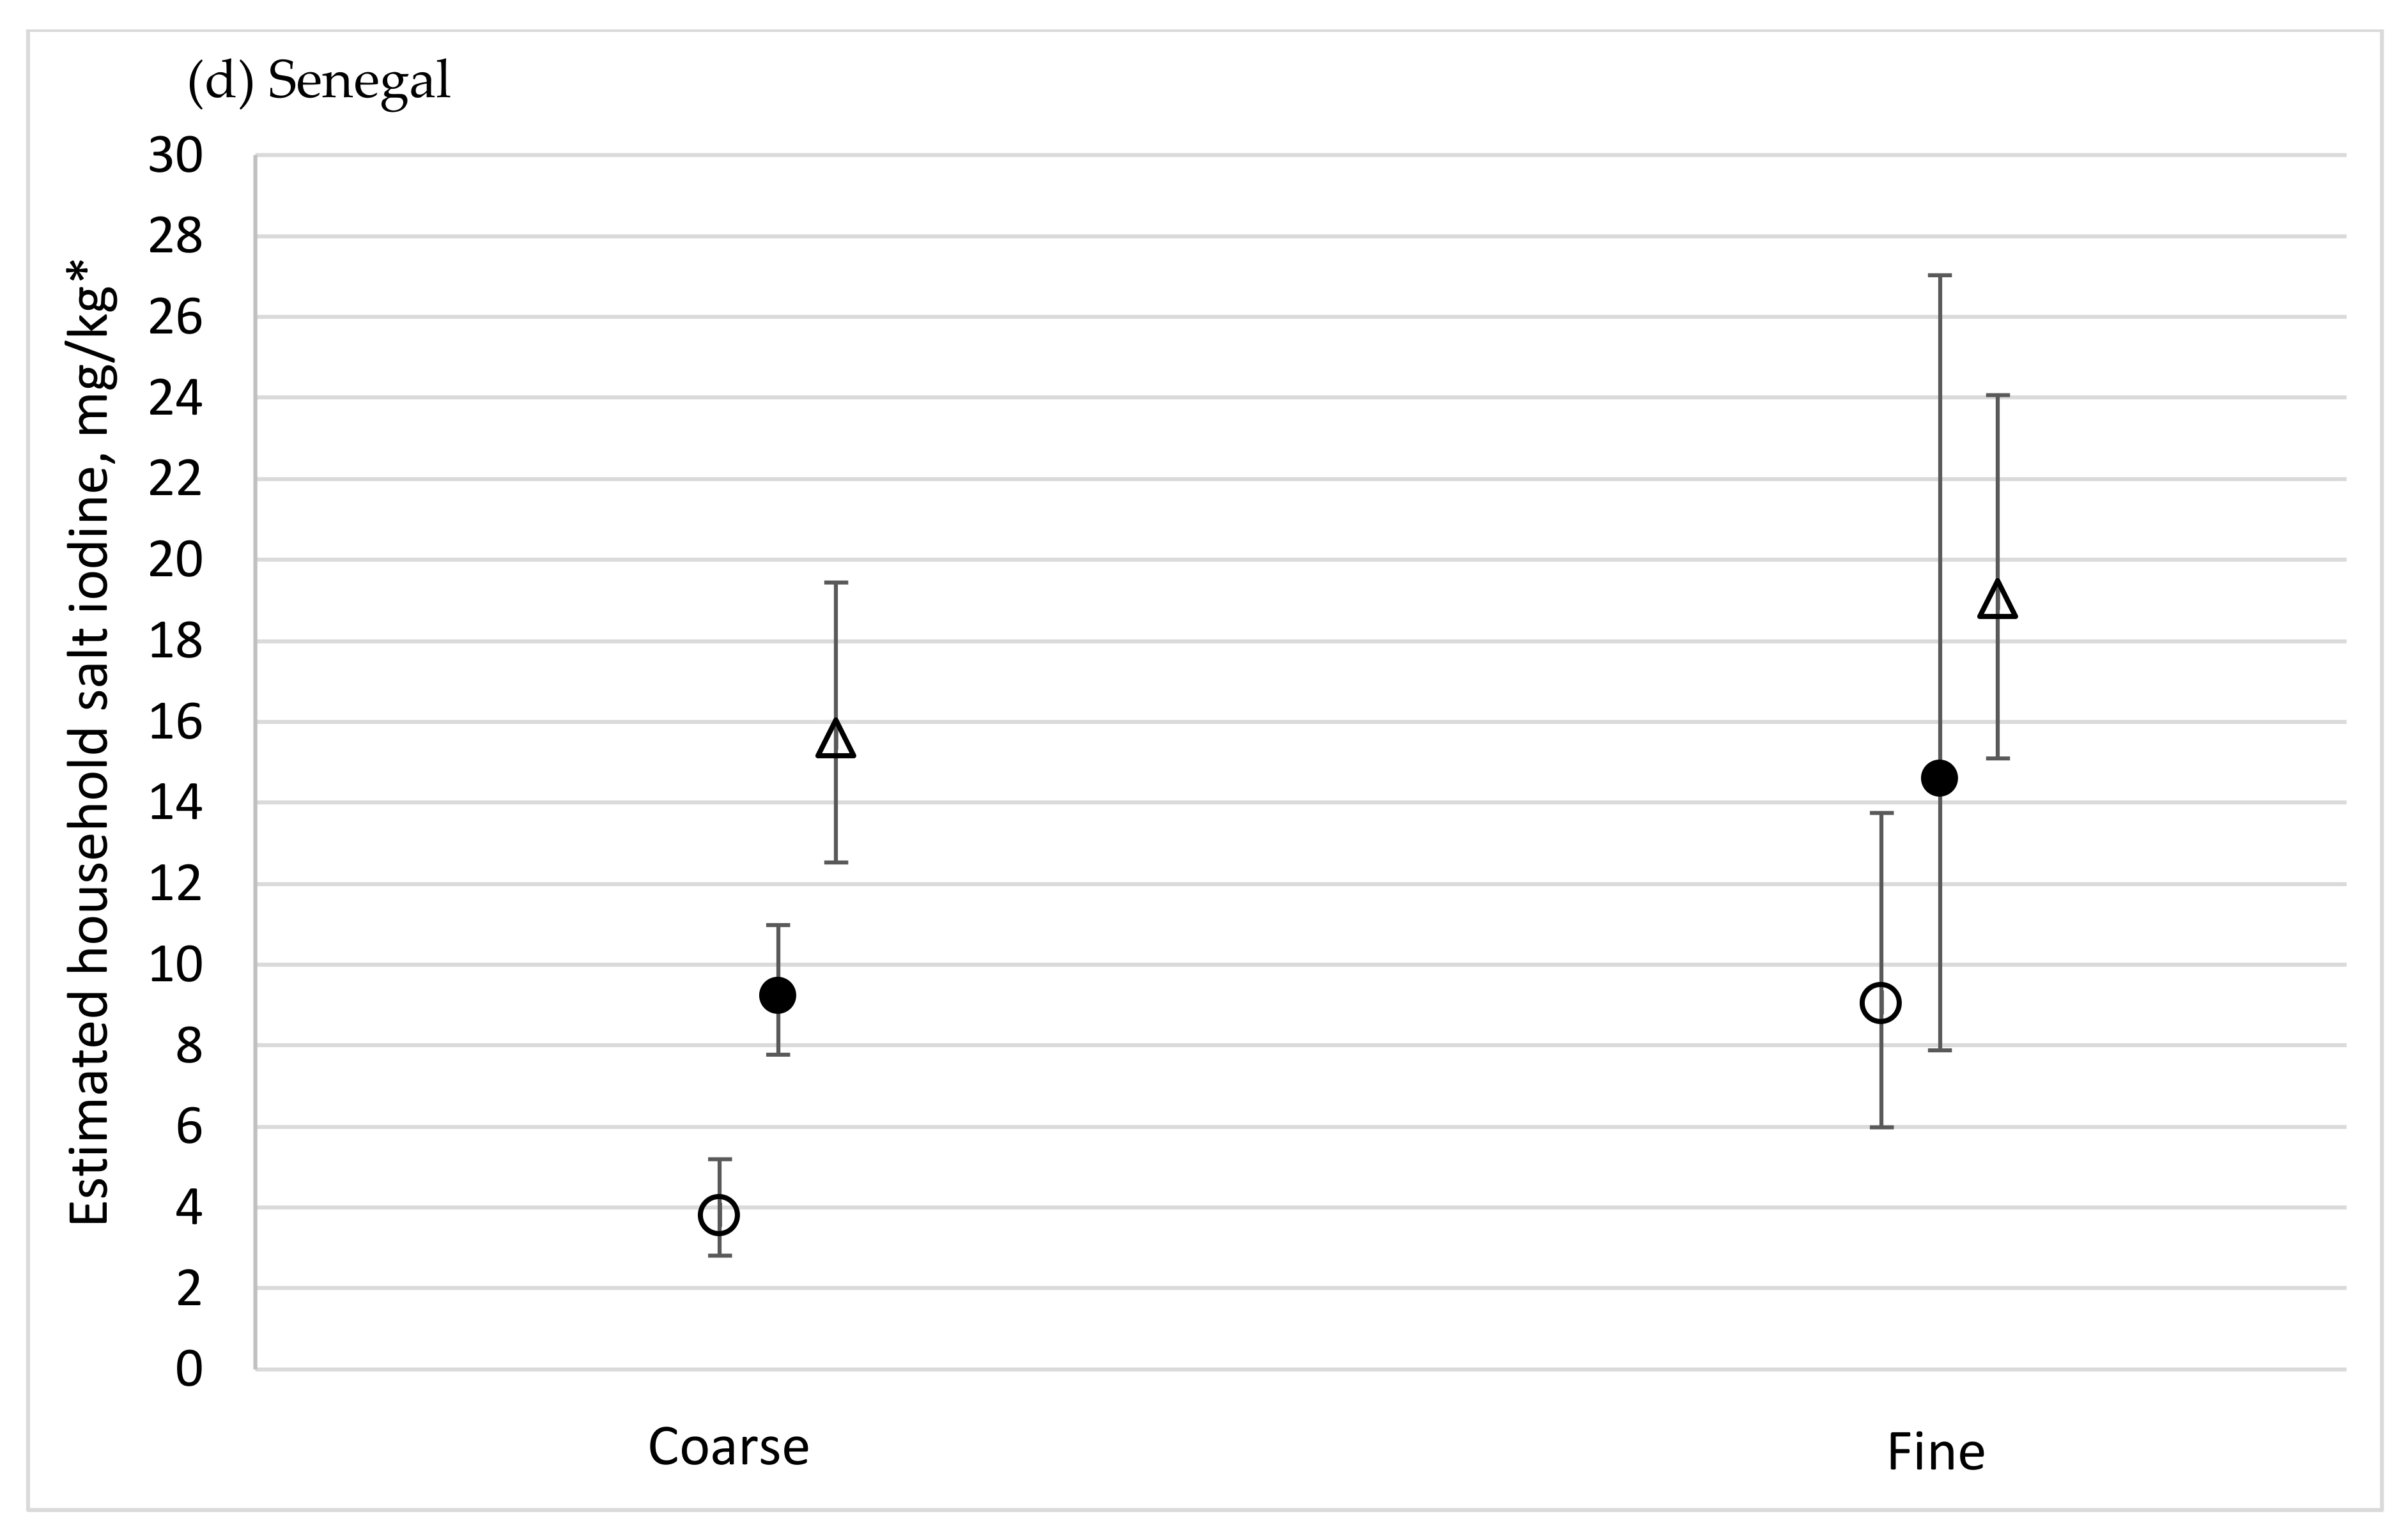
| Grain type | Coarse | 780 | 5.9 | 3.4, 8.5 | 4.0 | 2.7, 5.7 | 6.1 | 5.3, 6.9 | <0.001 | <0.001 | <0.001 | ||
| Fine | 789 | 45.2 | 38.3, 52.1 | 12.0 | 5.3, 61.2 | 32.8 | 28.2, 37.4 | 2.7 | 2.2, 3.3 | ||||
| Single Variable Model—Salt Iodine mg/kg | Multiple Variable Model—Salt Iodine Level | ||||||||||||
|---|---|---|---|---|---|---|---|---|---|---|---|---|---|
| Variable | Level | Number of HHs | % HHs with Salt Iodine > 15 mg/kg | 95% CI | Median | IQR | Mean | 95% CI | p Value | Relative to Reference | 95% CI | p Value (Variable Effect) | p Value (Interaction with Strata) |
| Strata | Rural-salt-producing | 568 | 10.9 | 6.7, 15.1 | 4.9 | 3.1, 8.1 | 8.8 | 6.9, 10.7 | <0.001 | ||||
| Rural-non-salt-producing | 524 | 19.1 | 11.9, 26.3 | 6.9 | 4.6, 11.2 | 10.7 a | 8.4, 13.0 | 1.4 a | 1.2, 1.6 | <0.001 | |||
| Urban | 474 | 53.3 | 46.1, 60.5 | 15.9 | 8.7, 22.8 | 17.8 a | 16.0, 19.6 | 2.1 a | 1.9, 2.4 | ||||
| Residence Type | Urban | 474 | 53.3 | 46.1, 60.5 | 15.9 | 8.7, 22.8 | 17.8 | 16.0, 19.6 | <0.001 | Not included in multiple variable analysis | |||
| Rural | 1092 | 19.0 | 11.9, 26.1 | 6.9 | 4.6, 11.2 | 10.7 | 8.1, 12.9 | ||||||
| MPI Education | Deprived | 1127 | 32.2 | 26.3, 38.1 | 8.8 | 5.4, 18.0 | 13.1 | 11.5, 14.7 | <0.001 | 0.315 | 0.397 | ||
| Not deprived | 439 | 48.1 | 41.2, 55.1 | 14.3 | 7.9, 22.4 | 17.6 | 15.6, 19.5 | 1.1 | 1.0, 1.2 | ||||
| MPI Health | Deprived | 961 | 32.8 | 26.4, 39.2 | 9.2 | 5.4, 18.7 | 14.2 | 12.2, 16.1 | 0.026 | 0.022 | 0.183 | ||
| Not deprived | 494 | 44.4 | 38.2, 50.6 | 12.5 | 6.6, 21.0 | 15.0 | 13.7, 16.3 | 0.9 | 0.8, 1.0 | ||||
| MPI Living Standards | Deprived | 1144 | 29.8 | 23.7, 35.9 | 8.3 | 5.1, 17.8 | 13.0 | 11.1, 14.9 | <0.001 | 0.383 | 0.036 | ||
| Not deprived | 413 | 51.7 | 44.5, 58.8 | 15.2 | 8.9, 22.8 | 17.3 | 15.6, 19.0 | 1.1 | 0.9, 1.2 | ||||
| Heard of iodine deficiency | No | 827 | 34.2 | 27.8, 40.7 | 9.5 | 5.6, 19.2 | 14.0 | 12.2, 15.9 | 0.106 | 0.609 | 0.584 | ||
| Yes | 739 | 41.8 | 35.5, 48.1 | 11.5 | 6.1, 20.5 | 15.1 | 13.5, 16.7 | 1.0 | 0.9, 1.1 | ||||
| Heard of iodised salt | No | 326 | 25.0 | 16.2, 33.8 | 7.9 | 5.1, 14.8 | 12.7 | 9.6, 15.8 | 0.013 | 0.847 | 0.062 | ||
| Yes | 1239 | 41.6 | 36.1, 47.1 | 11.5 | 6.1, 20.8 | 15.1 | 13.7, 16.5 | 1.0 | 0.9, 1.2 | ||||
| Salt obtained in sealed pack | No | 764 | 27.8 | 20.0, 35.5 | 7.9 | 4.8, 15.9 | 11.9 | 10.1, 13.7 | <0.001 | 0.643 | 0.024 | ||
| Yes | 754 | 43.3 | 37.2, 49.4 | 11.7 | 6.9, 21.6 | 16.2 | 14.4, 18.0 | 1.0 | 0.9, 1.2 | ||||
| Salt package had iodine logo or label 1 | No | 225 | 47.8 | 37.1, 58.5 | 14.1 | 7.6, 22.5 | 17.5 | 14.3, 20.8 | <0.001 | 0.468 | 0.186 | ||
| Yes | 401 | 46.9 | 40.3, 53.4 | 13.5 | 7.6, 22.8 | 17.3 | 15.4, 19.1 | 1.0 | 0.9, 1.3 | ||||
| Missing/Don’t know | 940 | 27.6 | 20.9, 34.3 | 8.0 | 4.9, 15.9 | 11.7 a | 10.2, 13.2 | 0.9 | 0.7, 1.2 | ||||
| Salt Brand 1 | No brand | 239 | 45.3 | 34.1, 56.4 | 14.1 | 7.7, 22.5 | 17.2 | 14.2, 20.2 | <0.001 | 0.292 | 0.713 | ||
| Other brand | 182 | 42.9 | 32.2, 53.6 | 11.5 | 6.4, 21.5 | 16.6 | 13.5, 19.7 | 0.9 | 0.7,1.1 | ||||
| Leading market brand | 90 | 56.7 | 42.1, 71.3 | 17.4 | 7.8, 23.9 | 18.4 | 15.5, 21.2 | 1.1 | 0.8,1.4 | ||||
| Missing/Don’t know | 1055 | 31.3 | 25.3, 37.3 | 8.9 | 5.3, 17.6 | 12.7 a | 11.4, 14.0 | 0.9 | 0.8,1.1 | ||||
| Respondent looked for iodised salt purchase | No | 1004 | 31.8 | 25.3, 38.2 | 8.6 | 5.4, 18.1 | 13.1 | 11.2, 15.0 | <0.001 | 0.083 | 0.818 | ||
| Yes | 435 | 50.5 | 44.3, 56.7 | 15.2 | 8.4, 22.8 | 17.9 a | 16.0, 19.7 | 1.2 a | 1.0, 1.3 | ||||
| Missing/Don’t know | 127 | 23.4 | 12.0, 34.8 | 7.5 | 4.8, 12.5 | 10.7 | 8.6, 12.8 | 1.0 | 0.8, 1.2 | ||||
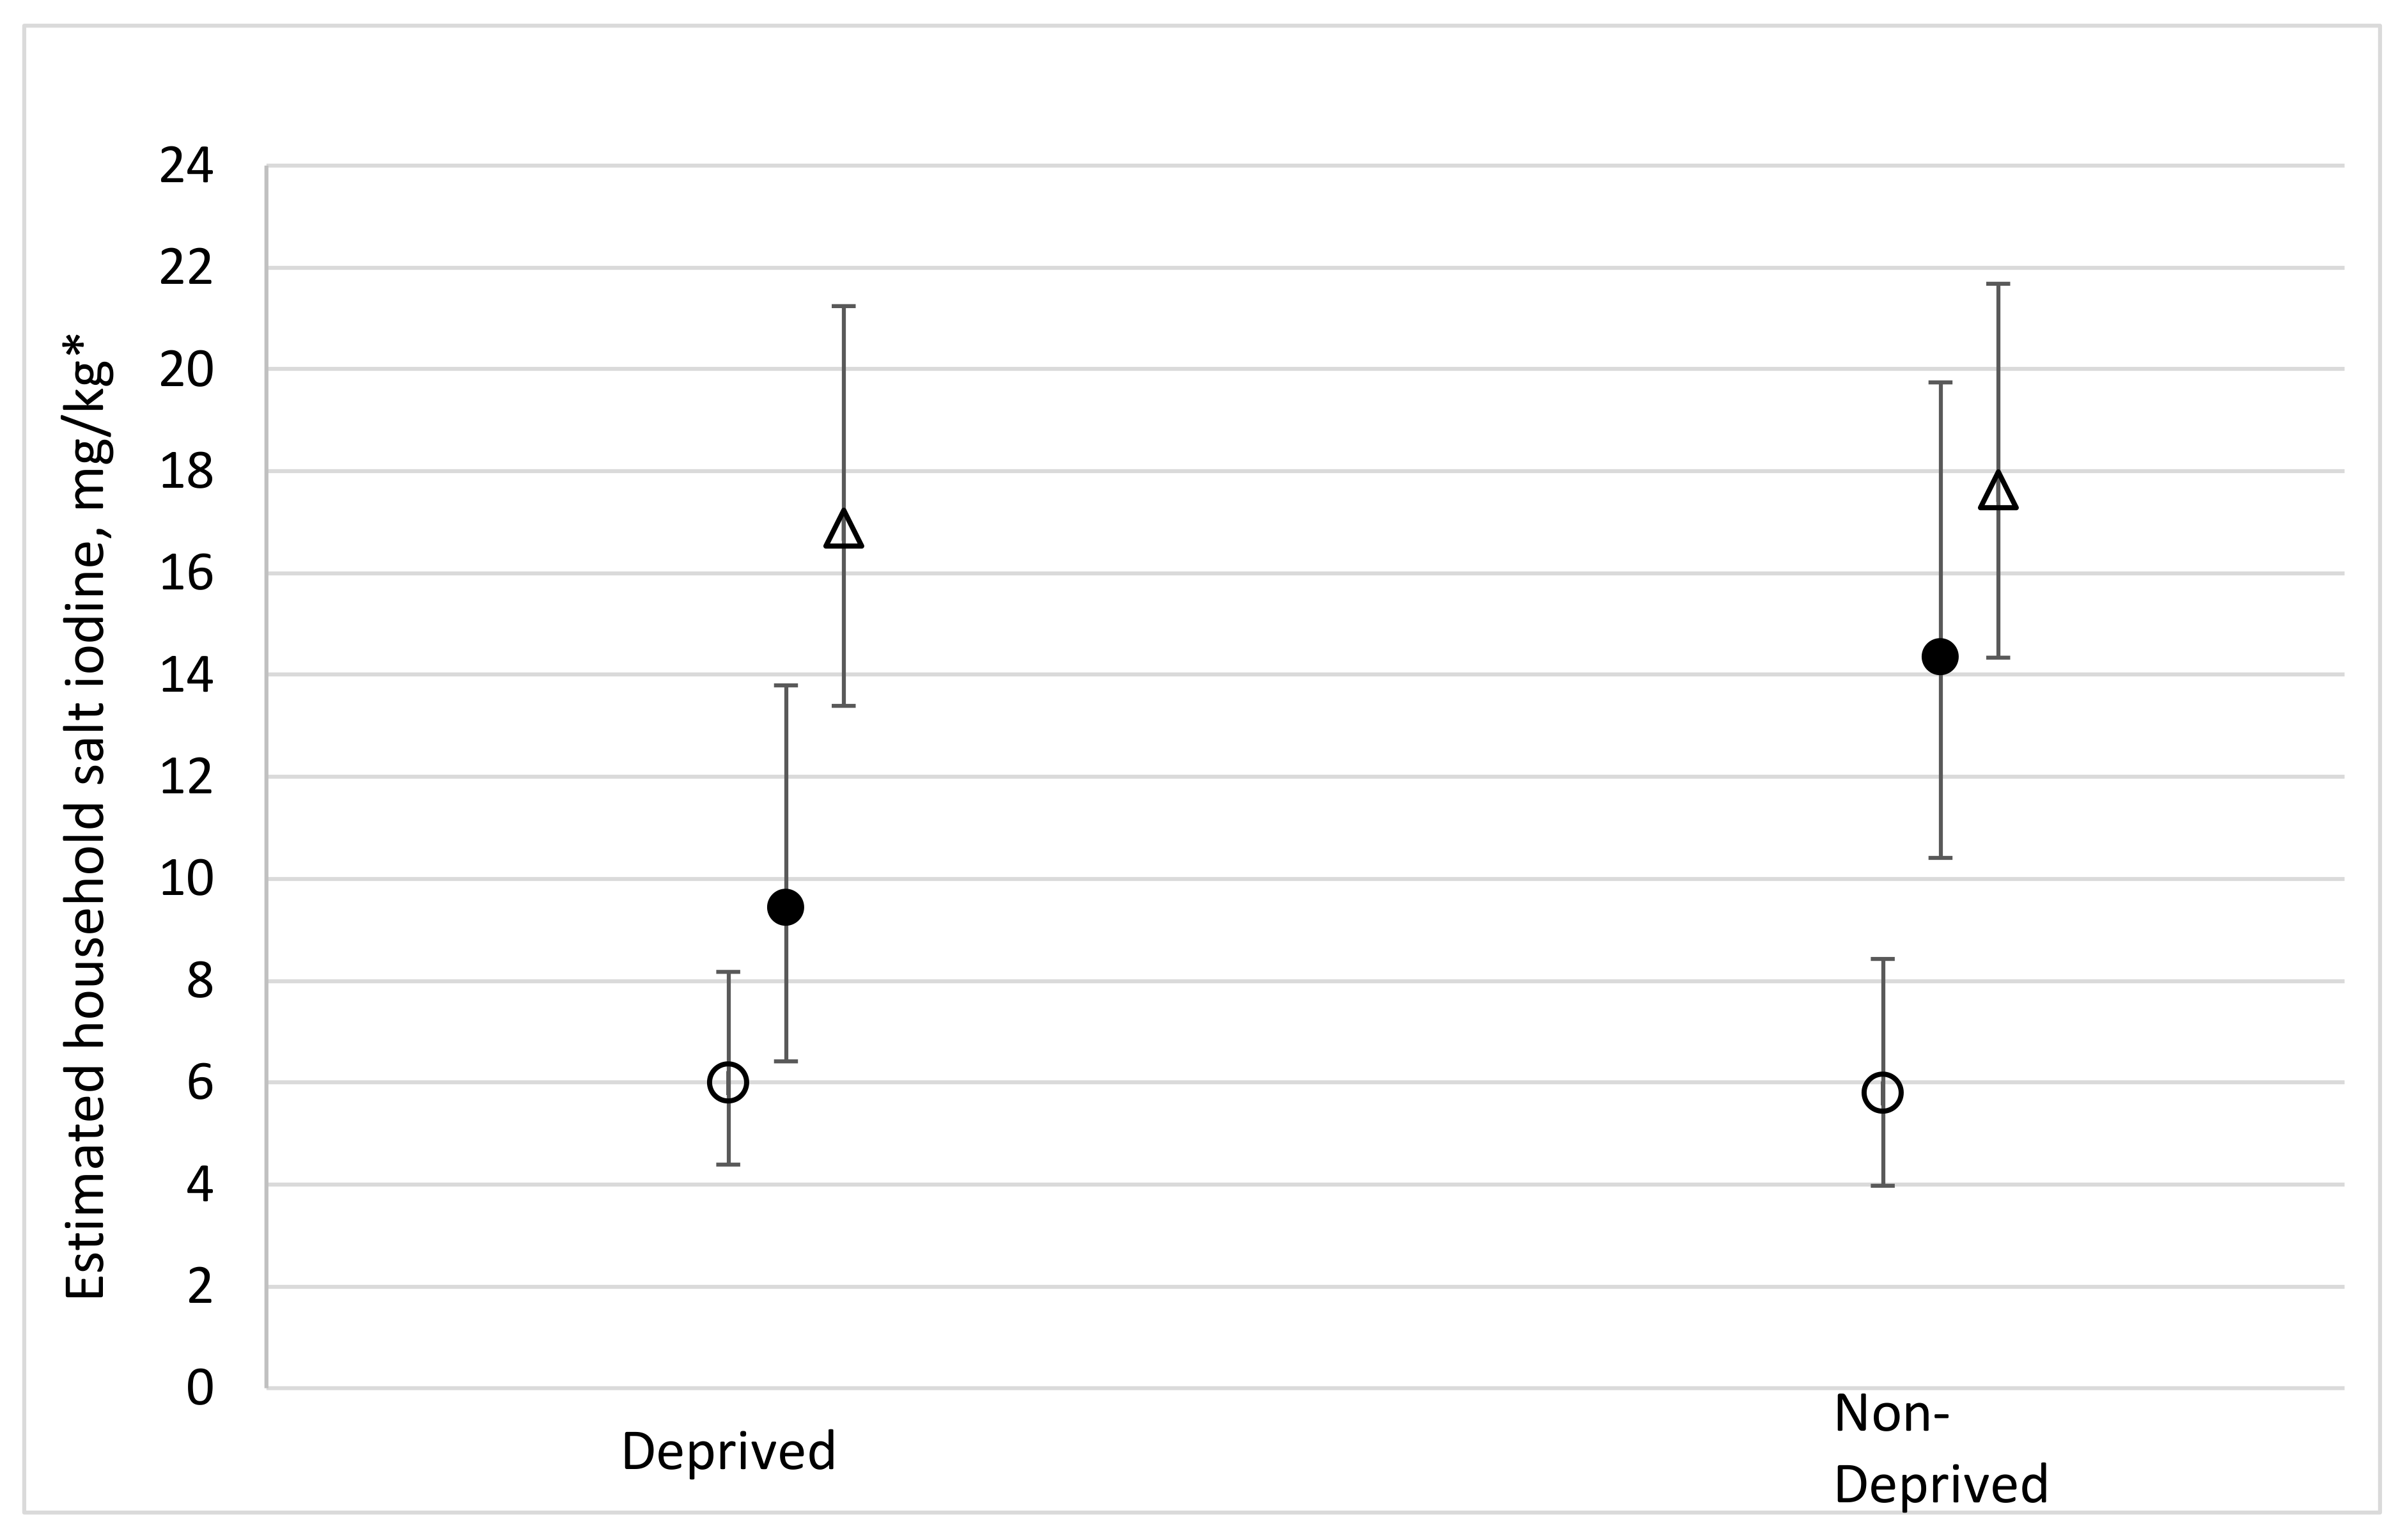
| Grain type | Coarse | 1237 | 30.3 | 24.1, 36.4 | 8.4 | 5.1, 17.6 | 12.2 | 10.9, 13.4 | <0.001 | <0.001 | 0.011 | ||
| Fine | 311 | 51.5 | 42.0, 61.1 | 15.6 | 9.0, 24.3 | 19.5 | 16.3, 22.7 | 1.3 | 1.2, 1.5 | ||||
© 2018 by the authors. Licensee MDPI, Basel, Switzerland. This article is an open access article distributed under the terms and conditions of the Creative Commons Attribution (CC BY) license (http://creativecommons.org/licenses/by/4.0/).
Share and Cite
Knowles, J.; Kupka, R.; Dumble, S.; Garrett, G.S.; Pandav, C.S.; Yadav, K.; Nahar, B.; Touré, N.K.; Amoaful, E.F.; Gorstein, J. Regression Analysis to Identify Factors Associated with Household Salt Iodine Content at the Sub-National Level in Bangladesh, India, Ghana and Senegal. Nutrients 2018, 10, 508. https://doi.org/10.3390/nu10040508
Knowles J, Kupka R, Dumble S, Garrett GS, Pandav CS, Yadav K, Nahar B, Touré NK, Amoaful EF, Gorstein J. Regression Analysis to Identify Factors Associated with Household Salt Iodine Content at the Sub-National Level in Bangladesh, India, Ghana and Senegal. Nutrients. 2018; 10(4):508. https://doi.org/10.3390/nu10040508
Chicago/Turabian StyleKnowles, Jacky, Roland Kupka, Sam Dumble, Greg S. Garrett, Chandrakant S. Pandav, Kapil Yadav, Baitun Nahar, Ndeye Khady Touré, Esi Foriwa Amoaful, and Jonathan Gorstein. 2018. "Regression Analysis to Identify Factors Associated with Household Salt Iodine Content at the Sub-National Level in Bangladesh, India, Ghana and Senegal" Nutrients 10, no. 4: 508. https://doi.org/10.3390/nu10040508
APA StyleKnowles, J., Kupka, R., Dumble, S., Garrett, G. S., Pandav, C. S., Yadav, K., Nahar, B., Touré, N. K., Amoaful, E. F., & Gorstein, J. (2018). Regression Analysis to Identify Factors Associated with Household Salt Iodine Content at the Sub-National Level in Bangladesh, India, Ghana and Senegal. Nutrients, 10(4), 508. https://doi.org/10.3390/nu10040508