The Influence of Place of Residence, Gender and Age Influence on Food Group Choices in the Spanish Population: Findings from the ANIBES Study

 ,
,  ,
,  , ,
, ,  , ,
, ,  and
and 
Abstract
1. Introduction
2. Materials and Methods
2.1. Sample
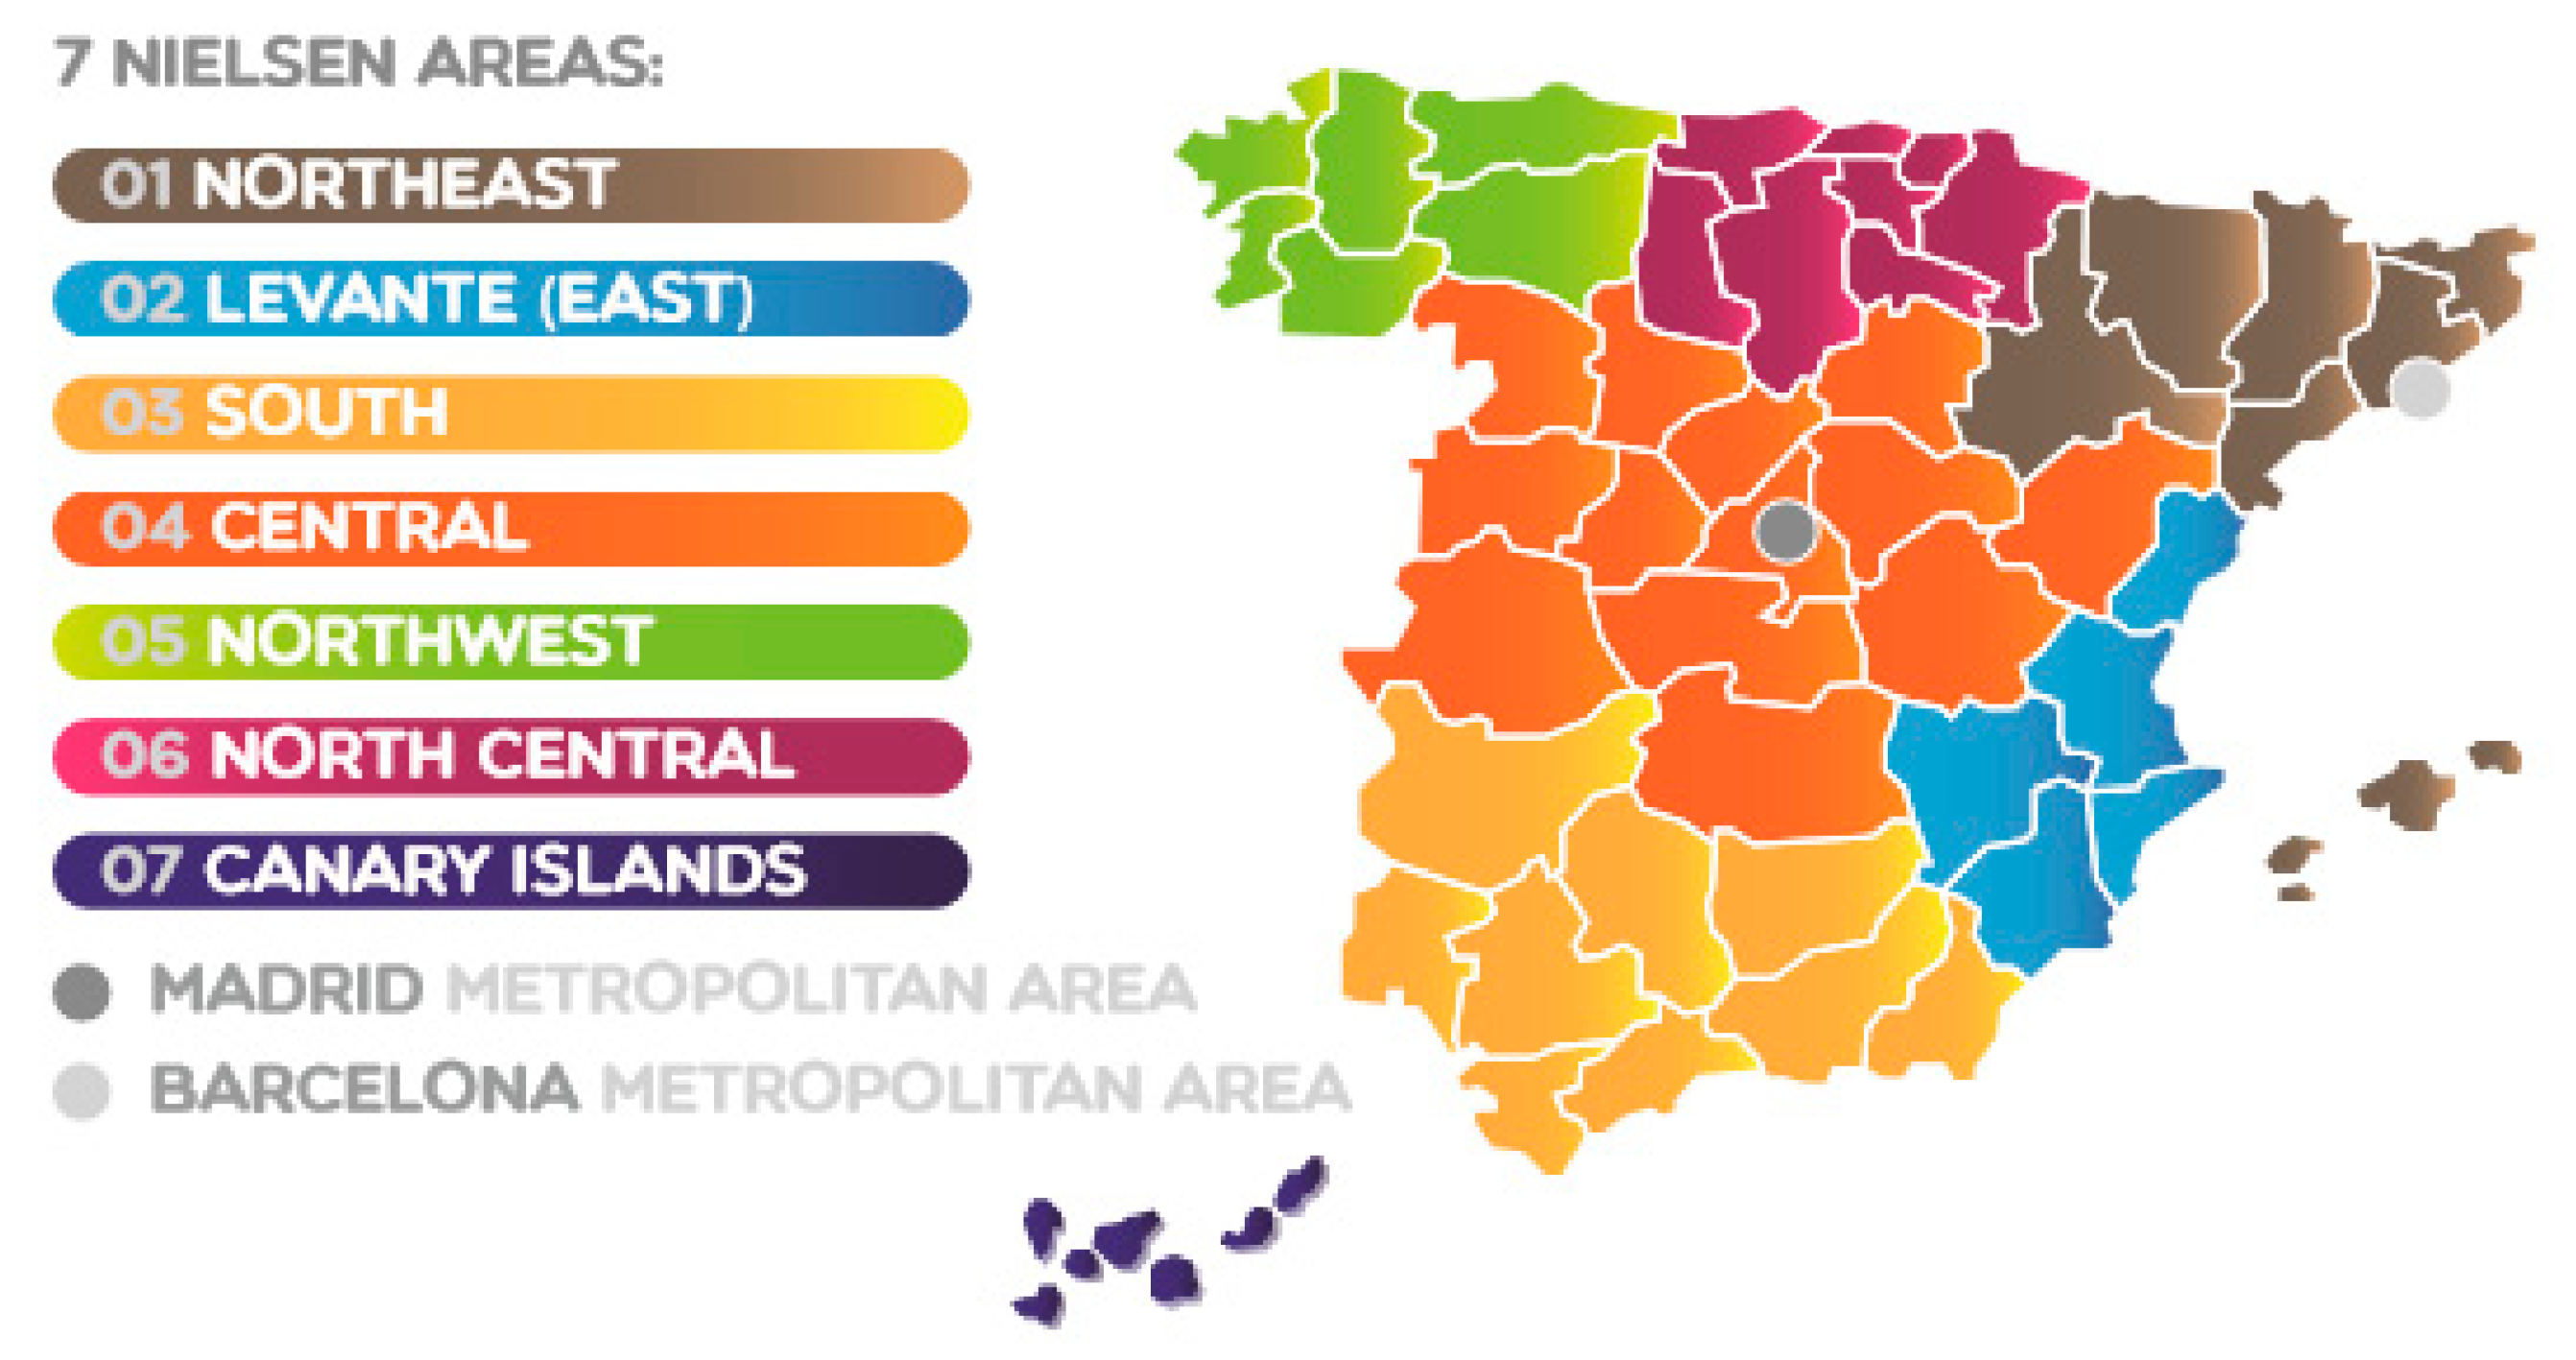
2.2. Socioeconomic Factors: Demographic Data and Area of Residence
2.3. Dietary Assessment
2.4. Statistical Analysis
3. Results
3.1. Children (9 to 12 Years)
3.2. Adolescents (13 to 17 Years)
3.3. Adults (18 to 64 Years)
3.4. Seniors (65 to 75 Years)
4. Discussion
4.1. Potential Factors Affecting Food Choice: Food Groups and Geographical Disparities in Spanish Geography
4.2. Consumption of Specific Food Groups Which Should Be Moderate According to Spanish Dietary Guidelines
4.3. Strengths and Limitations
5. Conclusions
Supplementary Materials
Acknowledgments
Author Contributions
Conflicts of Interest
References
- Varela-Moreiras, G.; Alguacil, M.L.; Alonso, A.E.; Aranceta, B.J.; Avila, T.J.; Aznar, L.S.; Belmonte, C.S.; Cabrerizo, G.L.; Dal Re, S.M.; Delgado, R.A. Consensus document and conclusions–obesity and sedentarism in the 21st Century: What can be done and what must be done? Nutr. Hosp. 2013, 28, 1–12. [Google Scholar] [PubMed]
- Aranceta Bartrina, J.; Pérez Rodrigo, C.; Alberdi Aresti, G.; Varela Moreiras, G.; Serra-Majem, L. Controversies about population, clinical or basic research studies related with food, nutrition, physical activity and lifestyle. Nutr. Hosp. 2015, 3, 15–21. [Google Scholar]
- Forouzanfar, M.H.; Afshin, A.; Alexander, L.T.; Anderson, H.R.; Bhutta, Z.A.; Biryukov, S.; Brauer, M.; Burnett, R.; Cercy, K.; Charlson, F.J. Global, regional, and national comparative risk assessment of 79 behavioural, environmental and occupational, and metabolic risks or clusters of risks, 1990–2015: A systematic analysis for the global burden of disease study 2015. Lancet 2016, 388, 1659–1724. [Google Scholar] [CrossRef]
- López-Sobaler, A.M.; Aparicio, A.; Aranceta-Bartrina, J.; Gil, Á.; González-Gross, M.; Serra-Majem, L.; Varela-Moreiras, G.; Ortega, R.M. Overweight and general and abdominal obesity in a representative sample of Spanish adults: Findings from the ANIBES study. BioMed Res. Int. 2016, 2016. [Google Scholar] [CrossRef] [PubMed]
- Basterra-Gortari, F.J.; Bes-Rastrollo, M.; Ruiz-Canela, M.; Gea, A.; Martinez-Gonzalez, M.Á. Prevalencia de obesidad y diabetes en adultos españoles, 1987–2012. Med. Clín. 2017, 148, 250–256. [Google Scholar] [CrossRef] [PubMed]
- Neira, M.; de Onis, M. The Spanish strategy for nutrition, physical activity and the prevention of obesity. Br. J. Nutr. 2007, 96, S8–S11. [Google Scholar] [CrossRef]
- Pérez-Farinós, N.; López-Sobaler, A.M.; Dal Re, M.; Villar, C.; Labrado, E.; Robledo, T.; Ortega, R.M. The aladino study: A national study of prevalence of overweight and obesity in Spanish children in 2011. BioMed Res. Int. 2013, 2013. [Google Scholar] [CrossRef] [PubMed]
- Giskes, K.; Avendaňo, M.; Brug, J.; Kunst, A.E. A systematic review of studies on socioeconomic inequalities in dietary intakes associated with weight gain and overweight/obesity conducted among european adults. Obes. Rev. 2010, 11, 413–429. [Google Scholar] [CrossRef] [PubMed]
- Ministry of Health and Consumer Affair. Strategy for Nutrition, Physical Activity and Prevention of Obesity (Naos); Ministry of Health and Consumer Affair: Madrid, Spain, 2005.
- James, W.P.; Nelson, M.; Ralph, A.; Leather, S. Socioeconomic determinants of health. The contribution of nutrition to inequalities in health. BMJ Br. Med. J. 1997, 314, 1545–1549. [Google Scholar] [CrossRef]
- Martín, A.; Cervero, M.; González Rodríguez, A.; Molinero, A.; Magro, M.; Partearroyo, T. Equidad y desigualdad nutricional en dos centros escolares de la ciudad de madrid (españa). Nutr. Hosp. 2014, 29, 128–135. [Google Scholar] [PubMed]
- de la Cámara, A.G.; de Andrés Esteban, E.; Cuchí, G.U.; Sandubete, E.C.; Herrera, M.Á.R.; Orenga, M.M.; Pablos, D.L. Variability of nutrients intake, lipid profile and cardiovascular mortality among geographical areas in Spain: The DRECE study. Geospat. Health 2017, 12, 524. [Google Scholar]
- Haveman-Nies, A.; De Groot, L.C.; Van Staveren, W.A. Dietary quality, lifestyle factors and healthy ageing in Europe: The Seneca study. Age Ageing 2003, 32, 427–434. [Google Scholar] [CrossRef] [PubMed]
- Aranceta, J.; Perez-Rodrigo, C.; Ribas, L.; Serra-Majem, L. Sociodemographic and lifestyle determinants of food patterns in Spanish children and adolescents: The Enkid study. Eur. J. Clin. Nutr. 2003, 57, S40–S44. [Google Scholar] [CrossRef] [PubMed]
- Varela-Moreiras, G.; Avila, J.; Cuadrado, C.; Del Pozo, S.; Ruiz, E.; Moreiras, O. Evaluation of food consumption and dietary patterns in Spain by the food consumption survey: Updated information. Eur. J. Clin. Nutr. 2010, 64, S37. [Google Scholar] [CrossRef] [PubMed]
- Sofi, F.; Cesari, F.; Abbate, R.; Gensini, G.F.; Casini, A. Adherence to mediterranean diet and health status: Meta-analysis. BMJ 2008, 337, a1344. [Google Scholar] [CrossRef] [PubMed]
- Naska, A.; Fouskakis, D.; Oikonomou, E.; Almeida, M.; Berg, M.; Gedrich, K.; Moreiras, O.; Nelson, M.; Trygg, K.; Turrini, A. Dietary patterns and their socio-demographic determinants in 10 European countries: Data from the DAFNE databank. Eur. J. Clin. Nutr. 2006, 60, 181. [Google Scholar] [CrossRef] [PubMed]
- Ruiz, E.; Ávila, J.; Castillo, A.; Valero, T.; del Pozo, S.; Rodriguez, P.; Bartrina, J.; Gil, Á.; González-Gross, M.; Ortega, R.; et al. The ANIBES study on energy balance in Spain: Design, protocol and methodology. Nutrients 2015, 7, 970–998. [Google Scholar] [CrossRef] [PubMed]
- Ruiz, E.; Ávila, J.M.; Valero, T.; del Pozo, S.; Rodriguez, P.; Aranceta-Bartrina, J.; Gil, A.; González-Gross, M.; Ortega, R.M.; Serra-Majem, L.; et al. Energy intake, profile, and dietary sources in the Spanish population: Findings of the ANIBES study. Nutrients 2015, 7, 4739–4762. [Google Scholar] [CrossRef] [PubMed]
- Ruiz, E.; Ávila, J.; Valero, T.; del Pozo, S.; Rodriguez, P.; Aranceta-Bartrina, J.; Gil, Á.; González-Gross, M.; Ortega, R.; Serra-Majem, L.; et al. Macronutrient distribution and dietary sources in the Spanish population: Findings from the ANIBES study. Nutrients 2016, 8, 177. [Google Scholar] [CrossRef] [PubMed]
- Rodríguez-Rodríguez, E.; Aparicio, A.; Aranceta-Bartrina, J.; Gil, Á.; González-Gross, M.; Serra-Majem, L.; Varela-Moreiras, G.; Ortega, R.M. Low adherence to dietary guidelines in Spain, especially in the overweight/obese population: The ANIBES study. J. Am. Coll. Nutr. 2017, 36, 240–247. [Google Scholar] [CrossRef] [PubMed]
- Pérez-Rodrigo, C.; Gianzo-Citores, M.; Gil, Á.; González-Gross, M.; Ortega, R.; Serra-Majem, L.; Varela-Moreiras, G.; Aranceta-Bartrina, J. Lifestyle patterns and weight status in Spanish adults: The cstudy. Nutrients 2017, 9, 606. [Google Scholar] [CrossRef] [PubMed]
- Varela Moreiras, G.; Ávila, J.M.; Ruiz, E. Energy balance, a new paradigm and methodological issues: The ANIBES study in Spain. Nutr. Hosp. 2015, 31, 101–112. [Google Scholar] [PubMed]
- Mielgo-Ayuso, J.; Aparicio-Ugarriza, R.; Castillo, A.; Ruiz, E.; Ávila, J.M.; Aranceta-Batrina, J.; Gil, Á.; Ortega, R.M.; Serra-Majem, L.; Varela-Moreiras, G.; et al. Physical activity patterns of the Spanish population are mostly determined by sex and age: Findings in the ANIBES study. PLoS ONE 2016, 11, e0149969. [Google Scholar] [CrossRef] [PubMed]
- Mielgo-Ayuso, J.; Aparicio-Ugarriza, R.; Castillo, A.; Ruiz, E.; Avila, J.M.; Aranceta-Bartrina, J.; Gil, A.; Ortega, R.M.; Serra-Majem, L.; Varela-Moreiras, G. Sedentary behavior among Spanish children and adolescents: Findings from the ANIBES study. BMC Public Health 2017, 17, 94. [Google Scholar] [CrossRef] [PubMed]
- Pérez-Rodrigo, C.; Gil, Á.; González-Gross, M.; Ortega, R.M.; Serra-Majem, L.; Varela-Moreiras, G.; Aranceta-Bartrina, J. Clustering of dietary patterns, lifestyles, and overweight among Spanish children and adolescents in the ANIBES study. Nutrients 2016, 8, 11. [Google Scholar] [CrossRef] [PubMed]
- López-Sobaler, A.M.; Rodríguez-Rodríguez, E.; Aranceta-Bartrina, J.; Gil, Á.; González-Gross, M.; Serra-Majem, L.; Varela-Moreiras, G.; Ortega, R.M. General and abdominal obesity is related to physical activity, smoking and sleeping behaviours and mediated by the educational level: Findings from the ANIBES study in Spain. PLoS ONE 2016, 11, e0169027. [Google Scholar] [CrossRef] [PubMed]
- Moreiras, O.; Carbajal, A.; Cabrera, L.; Cuadrado, C. Tablas de Composición de Alimentos, 15th ed.; Pirámide: Madrid, Spain, 2011. [Google Scholar]
- Grande Covián, F.; Rof Carballo, J.; Jiménez García, F. Alimentación y desarrollo infantil II: El desarrollo físico comparativo de dos grupos de niños en edad escolar y distinto nivel económico (rev clin esp 1944; 12:155–164). Nutr. Hosp. 2014, 30, 708–718. [Google Scholar] [PubMed]
- Culebras, J.M. Grande covián y la malnutrición infantil en la guerra civil española: Comentario a dos artículos clásicos publicados en revista clínica española hace setenta años. Nutr. Hosp. 2014, 30, 695–698. [Google Scholar] [PubMed]
- Wang, M.C.; Kim, S.; Gonzalez, A.A.; MacLeod, K.E.; Winkleby, M.A. Socioeconomic and food-related physical characteristics of the neighbourhood environment are associated with body mass index. J. Epidemiol. Community Health 2007, 61, 491–498. [Google Scholar] [CrossRef] [PubMed]
- Antentas, J.M.; Vivas, E. Impacto de la crisis en el derecho a una alimentación sana y saludable. Informe sespas 2014. Gac. Sanit. 2014, 28, 58–61. [Google Scholar] [CrossRef] [PubMed]
- Gracia, A.; Angulo, A.M. El Consumo de Alimentos en España: El Consumidor Rural versus Urbano. 1998. Available online: https://upcommons.upc.edu/bitstream/handle/2117/2379/6.2.30.pdf (accessed on 3 January 2018).
- Bibiloni, M.; González, M.; Julibert, A.; Llompart, I.; Pons, A.; Tur, J. Ten-year trends (1999–2010) of adherence to the mediterranean diet among the balearic islands’ adult population. Nutrients 2017, 9, 749. [Google Scholar] [CrossRef] [PubMed]
- Moreiras, G.V.; Torres, J.M.Á.; Vives, C.C.; de la Calle, S.D.P.; Moreno, E.R. Valoración de la dieta española de acuerdo al panel de consumo alimentario. Distrib. Consumo 2009, 19, 20–28. [Google Scholar]
- Martín Cerdeño, V.J. Evolución de los hábitos de compra y consumo en españa 1987–2007, dos décadas del panel de consumo alimentario. Distrib. Consumo 2008, 18, 208–239. [Google Scholar]
- Fernández San Juan, P.M. Dietary habits and nutritional status of school aged children in Spain. Nutr. Hosp. 2006, 21, 374–378. [Google Scholar] [PubMed]
- Perez-Rodrigo, C.; Ribas, L.; Serra-Majem, L.; Aranceta, J. Food preferences of Spanish children and young people: The enkid study. Eur. J. Clin. Nutr. 2003, 57, S45–S48. [Google Scholar] [CrossRef] [PubMed]
- Aranceta, J.; Serra-Majem, L. Dietary guidelines for the Spanish population. Public Health Nutr. 2001, 4, 1403. [Google Scholar] [CrossRef] [PubMed]
- Varela-Moreiras, G.; Ruiz, E.; Valero, T.; Ávila, J.M.; del Pozo, S. The Spanish diet: An update. Nutr. Hosp. 2013, 28, 13–20. [Google Scholar] [PubMed]
- Young, V.R.; Pellett, P.L. Plant proteins in relation to human protein and amino acid nutrition. Am. J. Clin. Nutr. 1994, 59, 1203S–1212S. [Google Scholar] [CrossRef] [PubMed]
- Flight, I.; Clifton, P. Cereal grains and legumes in the prevention of coronary heart disease and stroke: A review of the literature. Eur. J. Clin. Nutr. 2006, 60, 1145. [Google Scholar] [CrossRef] [PubMed]
- Bird, A.R.; Brown, I.L.; Topping, D.L. Starches, resistant starches, the gut microflora and human health. Curr. Issues Intest. Microbiol. 2000, 1, 25–37. [Google Scholar] [PubMed]
- Rochfort, S.; Panozzo, J. Phytochemicals for health, the role of pulses. J. Agric. Food Chem. 2007, 55, 7981–7994. [Google Scholar] [CrossRef] [PubMed]
- Paniagua, E. La ‘Guerra’ de la Comida a Domicilio. El Mundo, 10 April 2017. Available online: http://www.Elmundo.Es/economia/2017/04/10/58e7ae8f268e3e886d8b45f3.Html (accessed on 10 November 2017).
- Organization, W.H. Sugars Intake for Adults and Children. Guideline; World Health Organization: Geneva, Switzerland, 2015. [Google Scholar]
- Vorster, H.H.; Kruger, A.; Wentzel-Viljoen, E.; Kruger, H.S.; Margetts, B.M. Added sugar intake in South Africa: Findings from the adult prospective urban and rural epidemiology cohort study. Am. J. Clin. Nutr. 2014, 99, 1479–1486. [Google Scholar] [CrossRef] [PubMed]
- Ruiz, E.; Rodriguez, P.; Valero, T.; Ávila, J.; Aranceta-Bartrina, J.; Gil, Á.; González-Gross, M.; Ortega, R.; Serra-Majem, L.; Varela-Moreiras, G. Dietary intake of individual (free and intrinsic) sugars and food sources in the Spanish population: Findings from the ANIBES study. Nutrients 2017, 9, 275. [Google Scholar] [CrossRef] [PubMed]
- World Health Organization. Fiscal Policies for Diet and Prevention of Noncommunicable Diseases: Technical Meeting Report; World Health Organization: Geneva, Switzerland, 2015; Available online: Http://apps.Who.Int/iris/bitstream/10665/250131/1/9789241511247-eng.Pdf (accessed on 6 November 2017).
- Olza, J.; Aranceta-Bartrina, J.; González-Gross, M.; Ortega, R.; Serra-Majem, L.; Varela-Moreiras, G.; Gil, Á. Reported dietary intake and food sources of zinc, selenium, and vitamins A, E and C in the Spanish population: Findings from the ANIBES study. Nutrients 2017, 9, 697. [Google Scholar] [CrossRef] [PubMed]
- Olza, J.; Aranceta-Bartrina, J.; González-Gross, M.; Ortega, R.; Serra-Majem, L.; Varela-Moreiras, G.; Gil, Á. Reported dietary intake, disparity between the reported consumption and the level needed for adequacy and food sources of calcium, phosphorus, magnesium and vitamin d in the Spanish population: Findings from the ANIBES study. Nutrients 2017, 9, 168. [Google Scholar] [CrossRef] [PubMed]
- Samaniego-Vaesken, M.; Partearroyo, T.; Olza, J.; Aranceta-Bartrina, J.; Gil, Á.; González-Gross, M.; Ortega, R.; Serra-Majem, L.; Varela-Moreiras, G. Iron intake and dietary sources in the Spanish population: Findings from the ANIBES study. Nutrients 2017, 9, 203. [Google Scholar] [CrossRef] [PubMed]
- European Food Safety Authority. General principles for the collection of national food consumption data in the view of a pan-European dietary survey. EFSA J. 2009, 7. [Google Scholar] [CrossRef]
- Finglas, P.; Roe, M.; Pinchen, H.; Astley, S. The contribution of food composition resources to nutrition science methodology. Nutr. Bull. 2017, 42, 198–206. [Google Scholar] [CrossRef]
- Nissensohn, M.; Sánchez-Villegas, A.; Serra-Majem, L. Beverage consumption habits amongst the Spanish population: Association with total water and energy intake. Findings of the ANIBES study. Nutr. Hosp. 2015, 32, 10325. [Google Scholar] [PubMed]


| Total | Male | Female | ||||
|---|---|---|---|---|---|---|
| n | % | n | % | n | % | |
| Northeast | 240 | 11.9 | 121 | 11.9 | 119 | 11.9 |
| Levante (East) | 335 | 16.7 | 176 | 17.4 | 159 | 16.0 |
| South | 443 | 22.1 | 218 | 21.5 | 225 | 22.6 |
| Central | 191 | 9.5 | 107 | 10.6 | 84 | 8.4 |
| Northwest | 152 | 7.6 | 77 | 7.6 | 75 | 7.5 |
| North Central | 162 | 8.1 | 80 | 7.9 | 82 | 8.2 |
| Canary Islands | 93 | 4.6 | 44 | 4.3 | 49 | 4.9 |
| Madrid Metropolitan Area | 264 | 13.1 | 133 | 13.1 | 131 | 13.2 |
| Barcelona Metropolitan Area | 129 | 6.4 | 57 | 5.6 | 72 | 7.2 |
| Barcelona (Metropolitan Area) | Canary Islands | Central | Levante (East) | Madrid (Metropolitan Area) | Northeast | Northwest | North Central | South | |
|---|---|---|---|---|---|---|---|---|---|
| n | 57 | 44 | 107 | 176 | 133 | 121 | 77 | 80 | 218 |
| Oils and fats (g/day) | 24.1 a,b (9.7) | 24.9 a,b (14.3) | 25.3 a,b (11.7) | 24.1 a,b (10.1) | 22.1 a (9.4) | 25.8 a,b (11.7) | 23.1 a,b (12.9) | 27.5 b (11.2) | 26.0 a,b (12.7) |
| Appetizers (g/day) | 5.6 (9.5) | 5.9(10.8) | 5.6 (16.3) | 8.3 (13.0) | 2.9 (6.7) | 6.3 (11.5) | 3.8 (9.3) | 6.1 (13.1) | 6.6 (14.9) |
| Sugars and sweets (g/day) | 12.9 (11.8) | 17.0 (15.4) | 17.2 (17.2) | 14.9 (16.1) | 16.4 (14.2) | 17.0 (19.0) | 16.5 (16.7) | 18.5 (19.4) | 12.3 (13.9) |
| Alcoholic beverages (g/day) | 94. (163.2) | 151.4 (294.9) | 110.1 (184.0) | 154.9 (224.2) | 114.0 (201.2) | 88.2 (225.3) | 130.0 (274.5) | 121.2 (195.5) | 186.0 (290.9) |
| Non-alcoholic beverages (g/day) | 805.96 c,d (454.4) | 788.3 c,d (409.7) | 776.9 c,d (472.4) | 977.3 d (630.7) | 883.6 c,d (511.2) | 851.8 c,d (509.6) | 723.0 c (596.8) | 950.1 c,d (527.4) | 757.2 c,d (531.2) |
| Meat and meat products (g/day) | 170.0 e,f (84.9) | 146.1 e,g (80.2) | 157.3 e,f,g (86.7) | 172.3 e,f (88.1) | 180.1 e,f (92.5) | 179.7 e,f (90.1) | 134.2 g (73.9) | 187.2 g (87.8) | 152.4 e,f,g (85.9) |
| Cereals/grains (g/day) | 172.0 (73.6) | 166.4 (55.6) | 164.7 (65.4) | 173.3 (71.6) | 163.6 (71.8) | 175.9 (73.8) | 149.2 (66.8) | 155.4 (64.9) | 154.8 (60.8) |
| Fruits (g/day) | 153.9 h,i (151.7) | 216.7 i (236.2) | 151.9 h,i (170.0) | 161.8 h,i (170.8) | 153.7 h,i (193.4) | 145.9 h,i (178.7) | 122.9 h (159.0) | 193.1 h,i (200.3) | 117.0 h (139.4) |
| Eggs (g/day) | 27.0 j (27.4) | 31.8 j,k (26.5) | 38.4 j,k (31.6) | 29.1 j,k (31.0) | 31.4 j,k (30.1) | 33.4 j,k (45.5) | 32.1 j,k (32.4) | 43.5 k (34.2) | 31.7 j,k (29.4) |
| Milk and dairy products (g/day) | 233.1 (165.6) | 310.6 (219.8) | 267.2 (141.6) | 245.3 (193.6) | 288.6 (164.2) | 256.8 (191.5) | 248.0 (161.0) | 283.4 (152.8) | 237.5 (152.9) |
| Pulses (g/day) | 10.7 (14.6) | 15.7 (19.2) | 15.8 (20.9) | 10.2 (14.5) | 14.9 (21.9) | 15.1 (21.89 | 13.3 (16.5) | 15.1 (18.7) | 16.0 (18.2) |
| Fish and shellfish (g/day) | 72.7 (84.7) | 45.4 (63.9) | 62.4 (61.9) | 64.3 (67.7) | 56.0 (60.2) | 49.8 (67.1) | 72.9 (79.6) | 70.5 (80.7) | 58.4 (62.6) |
| Ready-to-eat meals (g/day) | 89.6 (90.8) | 76.2 (102.5) | 77.9 (94.5) | 75.9 (86.0) | 88.2 (86.6) | 91.6 (99.8) | 65.9 (81.7) | 60.5 (69.3) | 80.6 (74.7) |
| Sauces and condiments (g/day) | 15.6 (17.9) | 11.4 (11.4) | 12.9 (12.7) | 17.5 (16.9) | 14.0 (13.3) | 15.2 (18.5) | 11.3 (11.5) | 13.8 (14.7) | 14.1 (15.3) |
| Supplements and meal replacements (g/day) | 0.1 (0.9) | 1.7 (6.1) | 0.5 (3.3) | 0.0 (0.5) | 0.0 (0.0) | 1.5 (13.1) | 0.2 (1.2) | 0.3 (1.8) | 0.5 (3.6) |
| Vegetables (g/day) | 165.7 (94.2) | 194.9 (112.2) | 178.4 (114.9) | 176.3 (120.8) | 161.9 (101.4) | 195.0 (134.8) | 172.4 (107.8) | 208.4 (142.8) | 157.7 (104.0) |
| Barcelona (Metropolitan Area) | Canary Islands | Central | Levante (East) | Madrid (Metropolitan Area) | Northeast | Northwest | North Central | South | |
|---|---|---|---|---|---|---|---|---|---|
| n | 72 | 49 | 84 | 159 | 131 | 119 | 75 | 82 | 225 |
| Oils and fats (g/day) | 25.7 a,b,c (11.5) | 19.2 d (8.5) | 21.9 a,d (10.5) | 23.0 a,b,d (9.3) | 22.8 a,b,d (11.1) | 24.1 a,b,c (11.2) | 21.8 a,d (7.9) | 26.7 b,c (9.3) | 27.6 c (12.1) |
| Appetizers (g/day) | 5.8 (14.6) | 4.1 (8.8) | 4.3 (12.5) | 7.1 (14.3) | 2.0 (6.1) | 6.0 (14.1) | 3.8 (8.1) | 6.4 (12.4) | 5.2 (11.5) |
| Sugars and sweets (g/day) | 13.4 e (12.8) | 16.3 e,f (15.6) | 20.1 e,f (19.1) | 17.0 e,f (17.2) | 14.0 e (13.7) | 17.1 e,f (16.2) | 18.1 e,f (15.5) | 21.2 f (18.2) | 14.1 e (14.6) |
| Alcoholic beverages (g/day) | 28.1g (53.3) | 60.4 g,h (116.8) | 82.9 g,h (135.4) | 90.5 h (158.3) | 46.9 g,h (144.6) | 69.0 g,h (147.4) | 40.8 g,h (80.2) | 40.6 g,h (94.1) | 66.8 g,h (131.0) |
| Non-alcoholic beverages (g/day) | 838.4 i,j,k (496.4) | 900.0 j,k (464.8) | 843.7 i,j,k (444.7) | 1042.9 k (523.8) | 851.9 i,j,k (463.8) | 934.3 j,k (591.2) | 684.5 i (416.4) | 880.0 i,j,k (592.0) | 750.4 i,j (425.7) |
| Meat and meat products (g/day) | 131.6 l (84.7) | 94.2 m (59.0) | 113.3 l,m (68.6) | 123.7 l (68.4) | 135.0 l (71.3) | 125.1 l (76.0) | 136.3 l (83.4) | 137.2 l (71.6) | 126.5 l (67.2) |
| Cereals/grains (g/day) | 131.7 (54.0) | 134.8 (51.2) | 139.2 (58.4) | 142.9 (57.4) | 121.3 (51.5) | 133.4 (57.3) | 128.6 (62.1) | 133.1 (56.4) | 135.3 (51.4) |
| Fruits (g/day) | 196.5 (159.2) | 167.3 (182.0) | 143.1 (144.1) | 188.5 (178.0) | 182.5 (176.8) | 131.1 (156.1) | 187.0 (196.1) | 206.2 (264.4) | 137.9 (145.8) |
| Eggs (g/day) | 25.5 (28.3) | 20.9 (21.8) | 29.5 (25.3) | 25.4(25.2) | 25.1 (20.9) | 23.0 (21.3) | 30.6 (25.7) | 30.4 (29.8) | 23.9 (25.7) |
| Milk and dairy products (g/day) | 230.2 n (123.1) | 265.2 n,o (180.2) | 267.0 n,o (144.6) | 248.3 n (139.4) | 272.2 n,o (147.7) | 230.3 n,o (142.6) | 268.1 n (160.6) | 310.6 o (165.4) | 244.3 n (137.0) |
| Pulses (g/day) | 16.1 (20.1) | 13.2 (18.4) | 12.1 (14.4 | 12.4 (16.3) | 11.9 (15.8) | 11.0 (16.0) | 15.0 (22.1) | 11.6 (16.1) | 13.3 (15.6) |
| Fish and shellfish (g/day) | 88.2 p (88.0) | 43.4 q (51.7) | 60.2 p,q (95.6) | 58.4 p,q (64.2) | 69.8 p,q (71.0) | 53.6 q (63.4) | 66.6 p,q (66.3) | 72.8 p,q (72.8) | 63.7 p,q (68.0) |
| Ready-to-eat meals (g/day) | 47.7 (67.7) | 50.3 (53.0) | 67.4 (70.4) | 58.3 (63.8) | 54.6 (59.3) | 76.2 (75.0) | 55.7 (57.1) | 55.0 (61.6) | 66.3 (71.5) |
| Sauces and condiments (g/day) | 9.5 (10.0) | 13.2 (11.0) | 12.5 (15.4) | 12.8 (15.1) | 9.0 (11.7) | 10.9 (12.5) | 10.5 (14.9) | 12.0 (13.6) | 12.1 (13.9) |
| Supplements and meal replacements (g/day) | 0.5 (2.0) | 0.2 (1.4) | 0.1 (1.1) | 0.2 (1.6) | 0.0 (0.0) | 1.2 (10.8) | 0.1 (0.8) | 0.5 (3.4) | 0.0 (0.2) |
| Vegetables (g/day) | 212.6 r (125.3 | 181.7 (115.0) | 156.4 r,s (106.9) | 181.3 r,s (112.3) | 175.7 s (102.6) | 201.4 r,s (122.8) | 176.0 r,s (98.3) | 202.5 r,s (123.6) | 162.8 s (91.3) |
| Rural | Semi-Urban | Urban | ||||
|---|---|---|---|---|---|---|
| Male | Female | Male | Female | Male | Female | |
| n | 345.0 | 337.0 | 358.0 | 337.0 | 325.0 | 334.0 |
| Oils and fats | 25.6 * (11.1) | 24.7 (11.7) | 25.7 * (12.0) | 24.7 (9.6) | 23.9 (11.2) | 24.2 (11.1) |
| Appetizers | 7.6 ^ ^ (13.9) | 5.4 (11.8) | 5.5 (12.2) | 5.4 (12.1) | 5.2 (11.3) | 4.6 (11.9) |
| Sugars and sweets | 15.4 (17.2) | 18.1 + (16.8) | 16.0 (16.1) | 18.1 (16.9) | 15.9 (14.9) | 15.2 (14.0) |
| Alcoholic beverages | 153.2 (269.4) | 71.3 (146.2) | 119.6 (204.6) | 71.3 (97.5) | 50.7 (235.9) | 64.7 (141.7) |
| Non-alcoholic beverages | 785.4 ▪ (522.0) | 862.5 (555.4) | 886.4 (538.0) | 862.5 (477.3) | 844.9 (559.7) | 871.3 (465.7) |
| Meat and meat products | 164.0 (89.9) | 121.3 (69.3) | 164.6 (83.0) | 121.3 (72.8) | 126.7 (91.0) | 131.0 (74.4) |
| Cereals/grains | 165.7 (64.4) | 136.5 (53.8) | 167.7 (70.5) | 136.5 (56.1) | 134.2 (68.4) | 130.7 (56.0) |
| Fruits | 154.1 (176.3) | 162.8 (167.4) | 151.5 (168.9) | 162.8 (180.8) | 162.7 (177.3) | 173.9 (181.8) |
| Eggs | 33.4 (36.9) | 24.8 (24.7) | 33.3 (29.5) | 24.8 (24.3) | 26.2 (31.7) | 26.1 (25.9) |
| Milk and dairy products | 242.3 (176.5) | 255.5 (150.7) | 271.0 (159.4) | 255.5 (144.8) | 269.0 (177.0) | 244.2 (144.5) |
| Pulses | 15.0 # (18.9) | 13.0 (16.9) | 15.3 # (20.4) | 13.0 (15.8) | 12.8 (16.3) | 12.5 (17.6) |
| Fish and shellfish | 59.1 (66.4) | 61.7 (65.7) | 65.0 (72.6) | 61.7 (62.6) | 60.2 (64.9) | 69.7 (84.3) |
| Ready to eat meal | 72.6 (79.7) | 62.6 (65.0) | 81.6 (90.1) | 62.6 (67.0) | 61.3 (88.2) | 58.9 (67.6) |
| Sauces and condiments | 13.6 (15.8) | 11.1 (13.6) | 14.0 (13.7) | 11.1 (12.9) | 12.1 (16.3) | 11.1 (13.9) |
| Supplements and meal replacements | 0.7 (8.1) | 0.1 (0.7) | 0.6 (3.4) | 0.1 (2.2) | 0.3 (0.8) | 0.5 (6.5) |
| Vegetables | 179.3 (121.0) | 178.2 (107.9) | 173.1 (119.6) | 178.2 (106.5) | 176.3 (106.0) | 186.4 (114.2) |
© 2018 by the authors. Licensee MDPI, Basel, Switzerland. This article is an open access article distributed under the terms and conditions of the Creative Commons Attribution (CC BY) license (http://creativecommons.org/licenses/by/4.0/).
Share and Cite
Samaniego-Vaesken, M.D.L.; Partearroyo, T.; Ruiz, E.; Aranceta-Bartrina, J.; Gil, Á.; González-Gross, M.; Ortega, R.M.; Serra-Majem, L.; Varela-Moreiras, G. The Influence of Place of Residence, Gender and Age Influence on Food Group Choices in the Spanish Population: Findings from the ANIBES Study. Nutrients 2018, 10, 392. https://doi.org/10.3390/nu10040392
Samaniego-Vaesken MDL, Partearroyo T, Ruiz E, Aranceta-Bartrina J, Gil Á, González-Gross M, Ortega RM, Serra-Majem L, Varela-Moreiras G. The Influence of Place of Residence, Gender and Age Influence on Food Group Choices in the Spanish Population: Findings from the ANIBES Study. Nutrients. 2018; 10(4):392. https://doi.org/10.3390/nu10040392
Chicago/Turabian StyleSamaniego-Vaesken, María De Lourdes, Teresa Partearroyo, Emma Ruiz, Javier Aranceta-Bartrina, Ángel Gil, Marcela González-Gross, Rosa M. Ortega, Lluis Serra-Majem, and Gregorio Varela-Moreiras. 2018. "The Influence of Place of Residence, Gender and Age Influence on Food Group Choices in the Spanish Population: Findings from the ANIBES Study" Nutrients 10, no. 4: 392. https://doi.org/10.3390/nu10040392
APA StyleSamaniego-Vaesken, M. D. L., Partearroyo, T., Ruiz, E., Aranceta-Bartrina, J., Gil, Á., González-Gross, M., Ortega, R. M., Serra-Majem, L., & Varela-Moreiras, G. (2018). The Influence of Place of Residence, Gender and Age Influence on Food Group Choices in the Spanish Population: Findings from the ANIBES Study. Nutrients, 10(4), 392. https://doi.org/10.3390/nu10040392