Effect of Zinc Supplementation on Growth Outcomes in Children under 5 Years of Age

Abstract
1. Introduction
2. Materials and Methods
2.1. Primary Exposure and Outcomes
2.2. Search Strategy
2.3. Study Selection
2.4. Data Extraction
2.5. Statistical Analysis
3. Results
3.1. Study Characteristics
3.2. Maternal Zinc Supplementation and Birth Growth Outcomes
3.3. Infant and Child Zinc Supplementation and Growth Outcomes
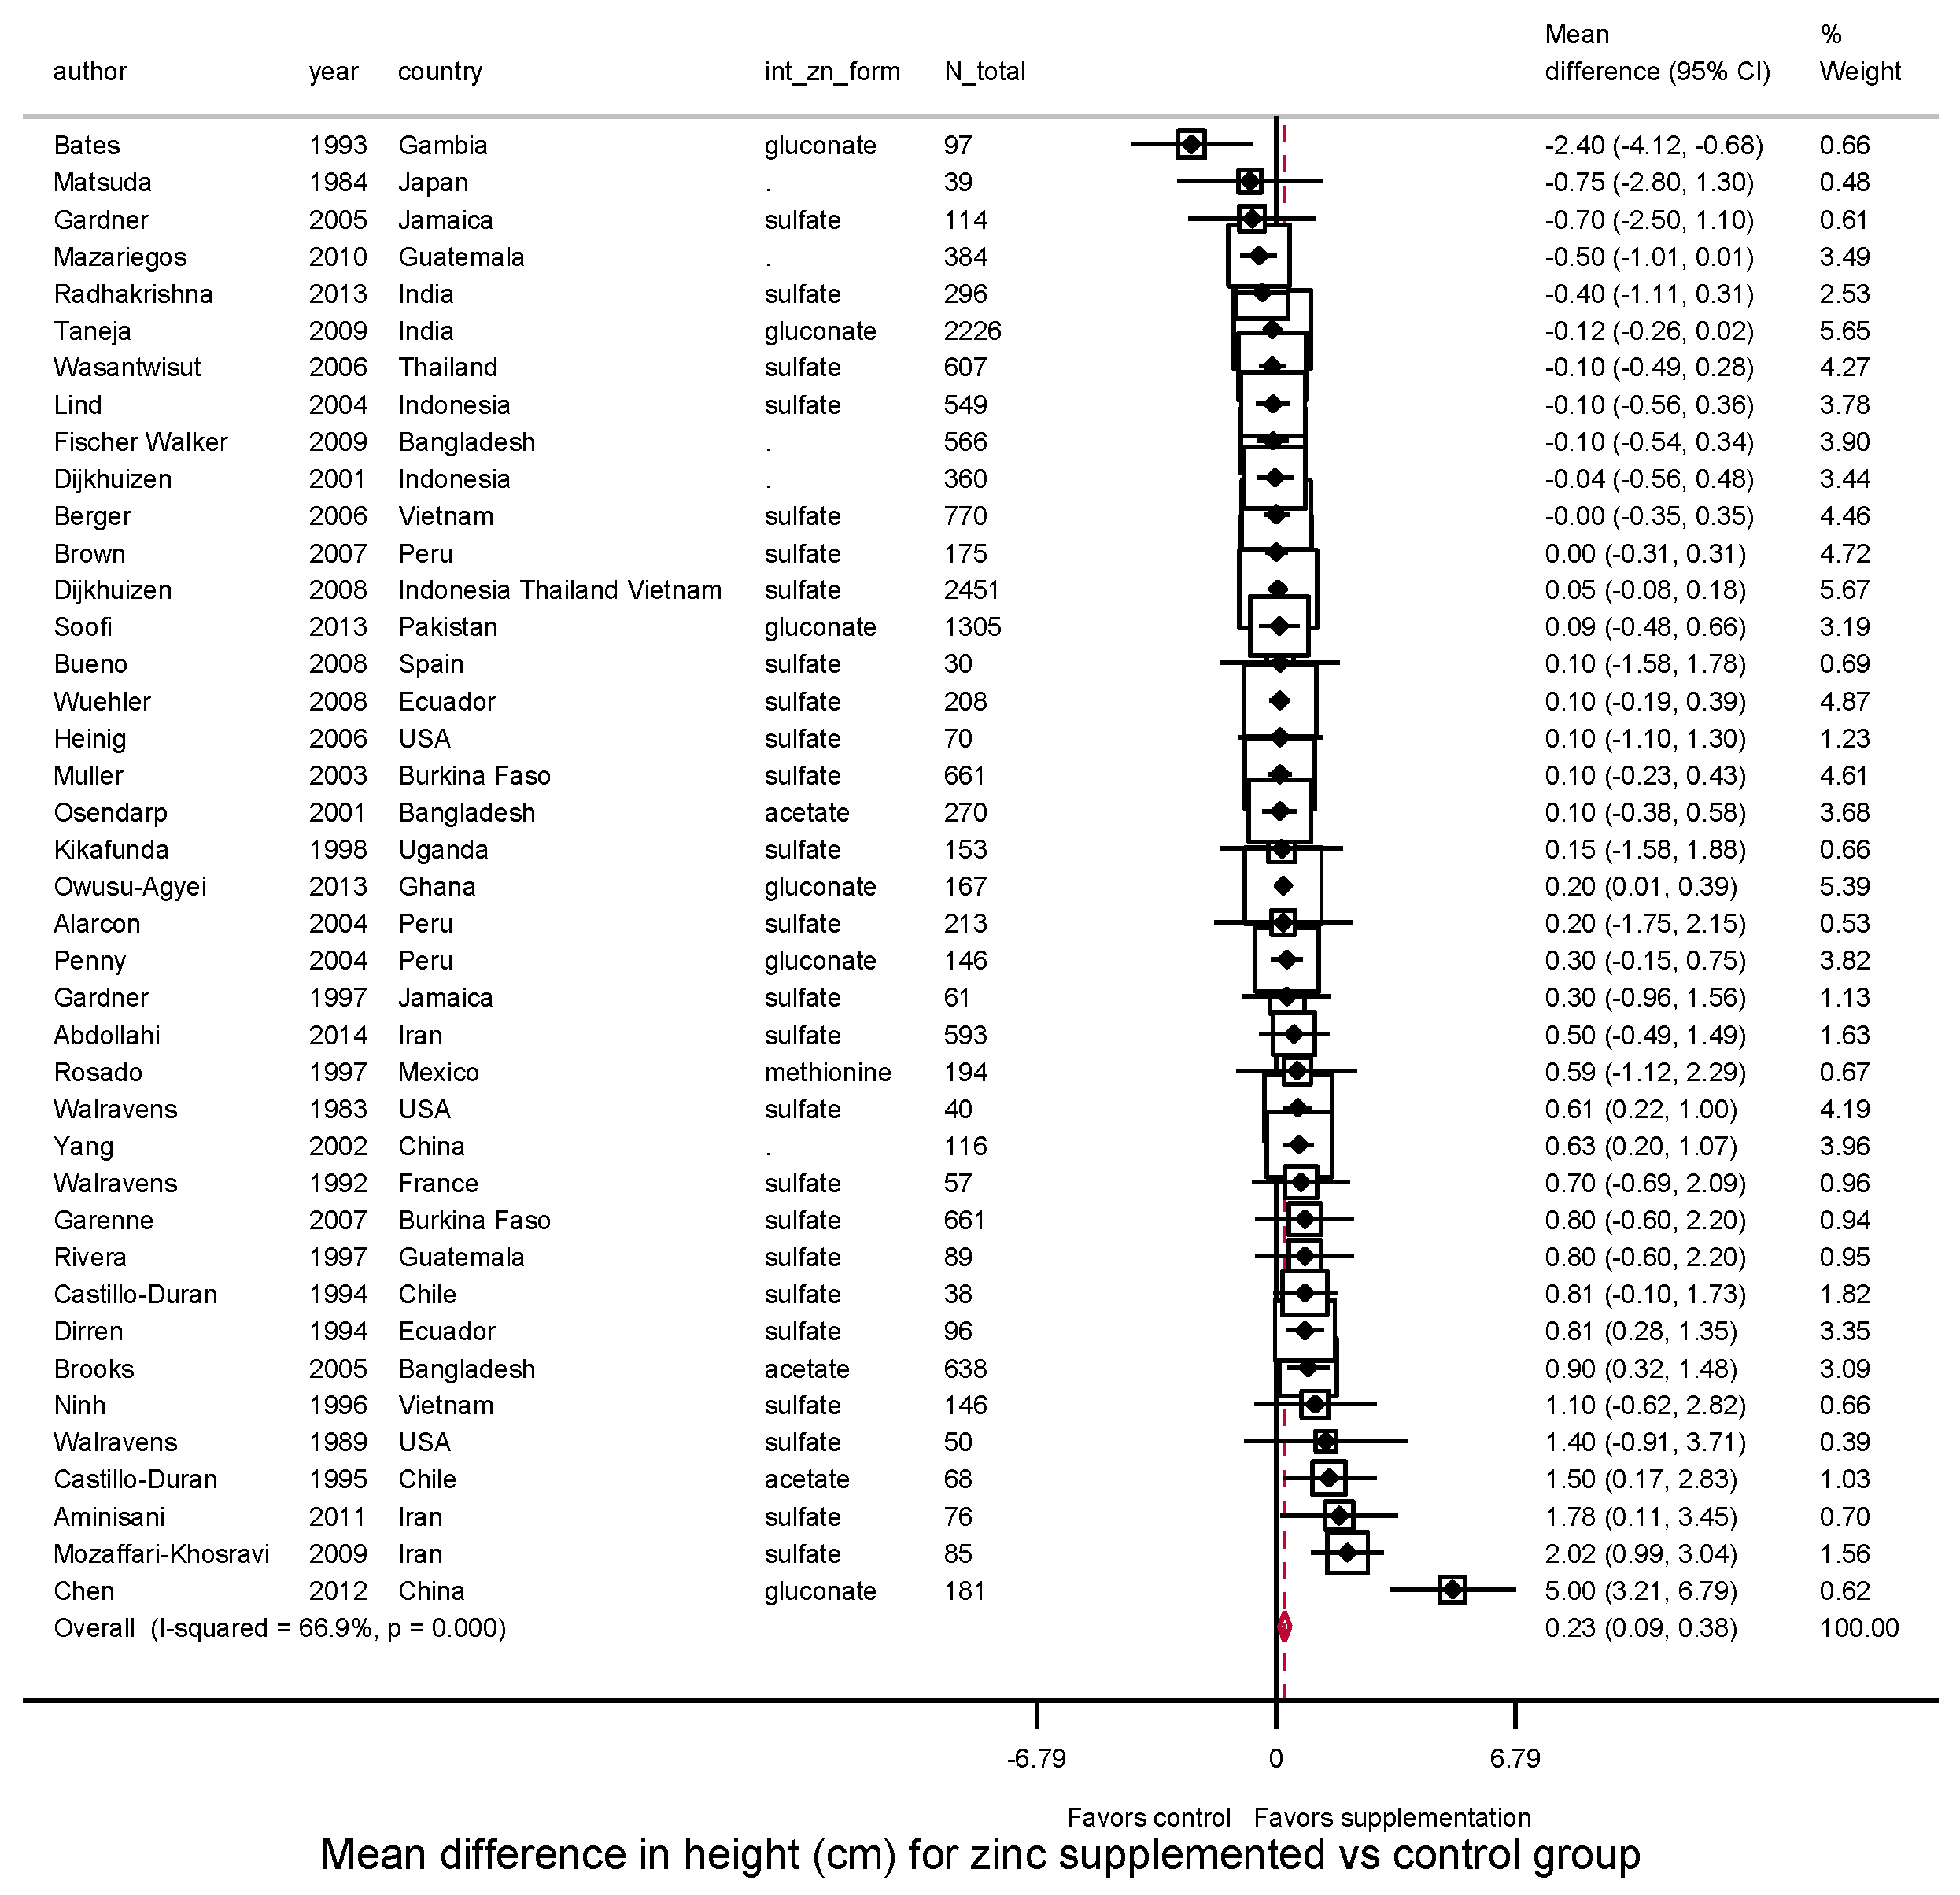
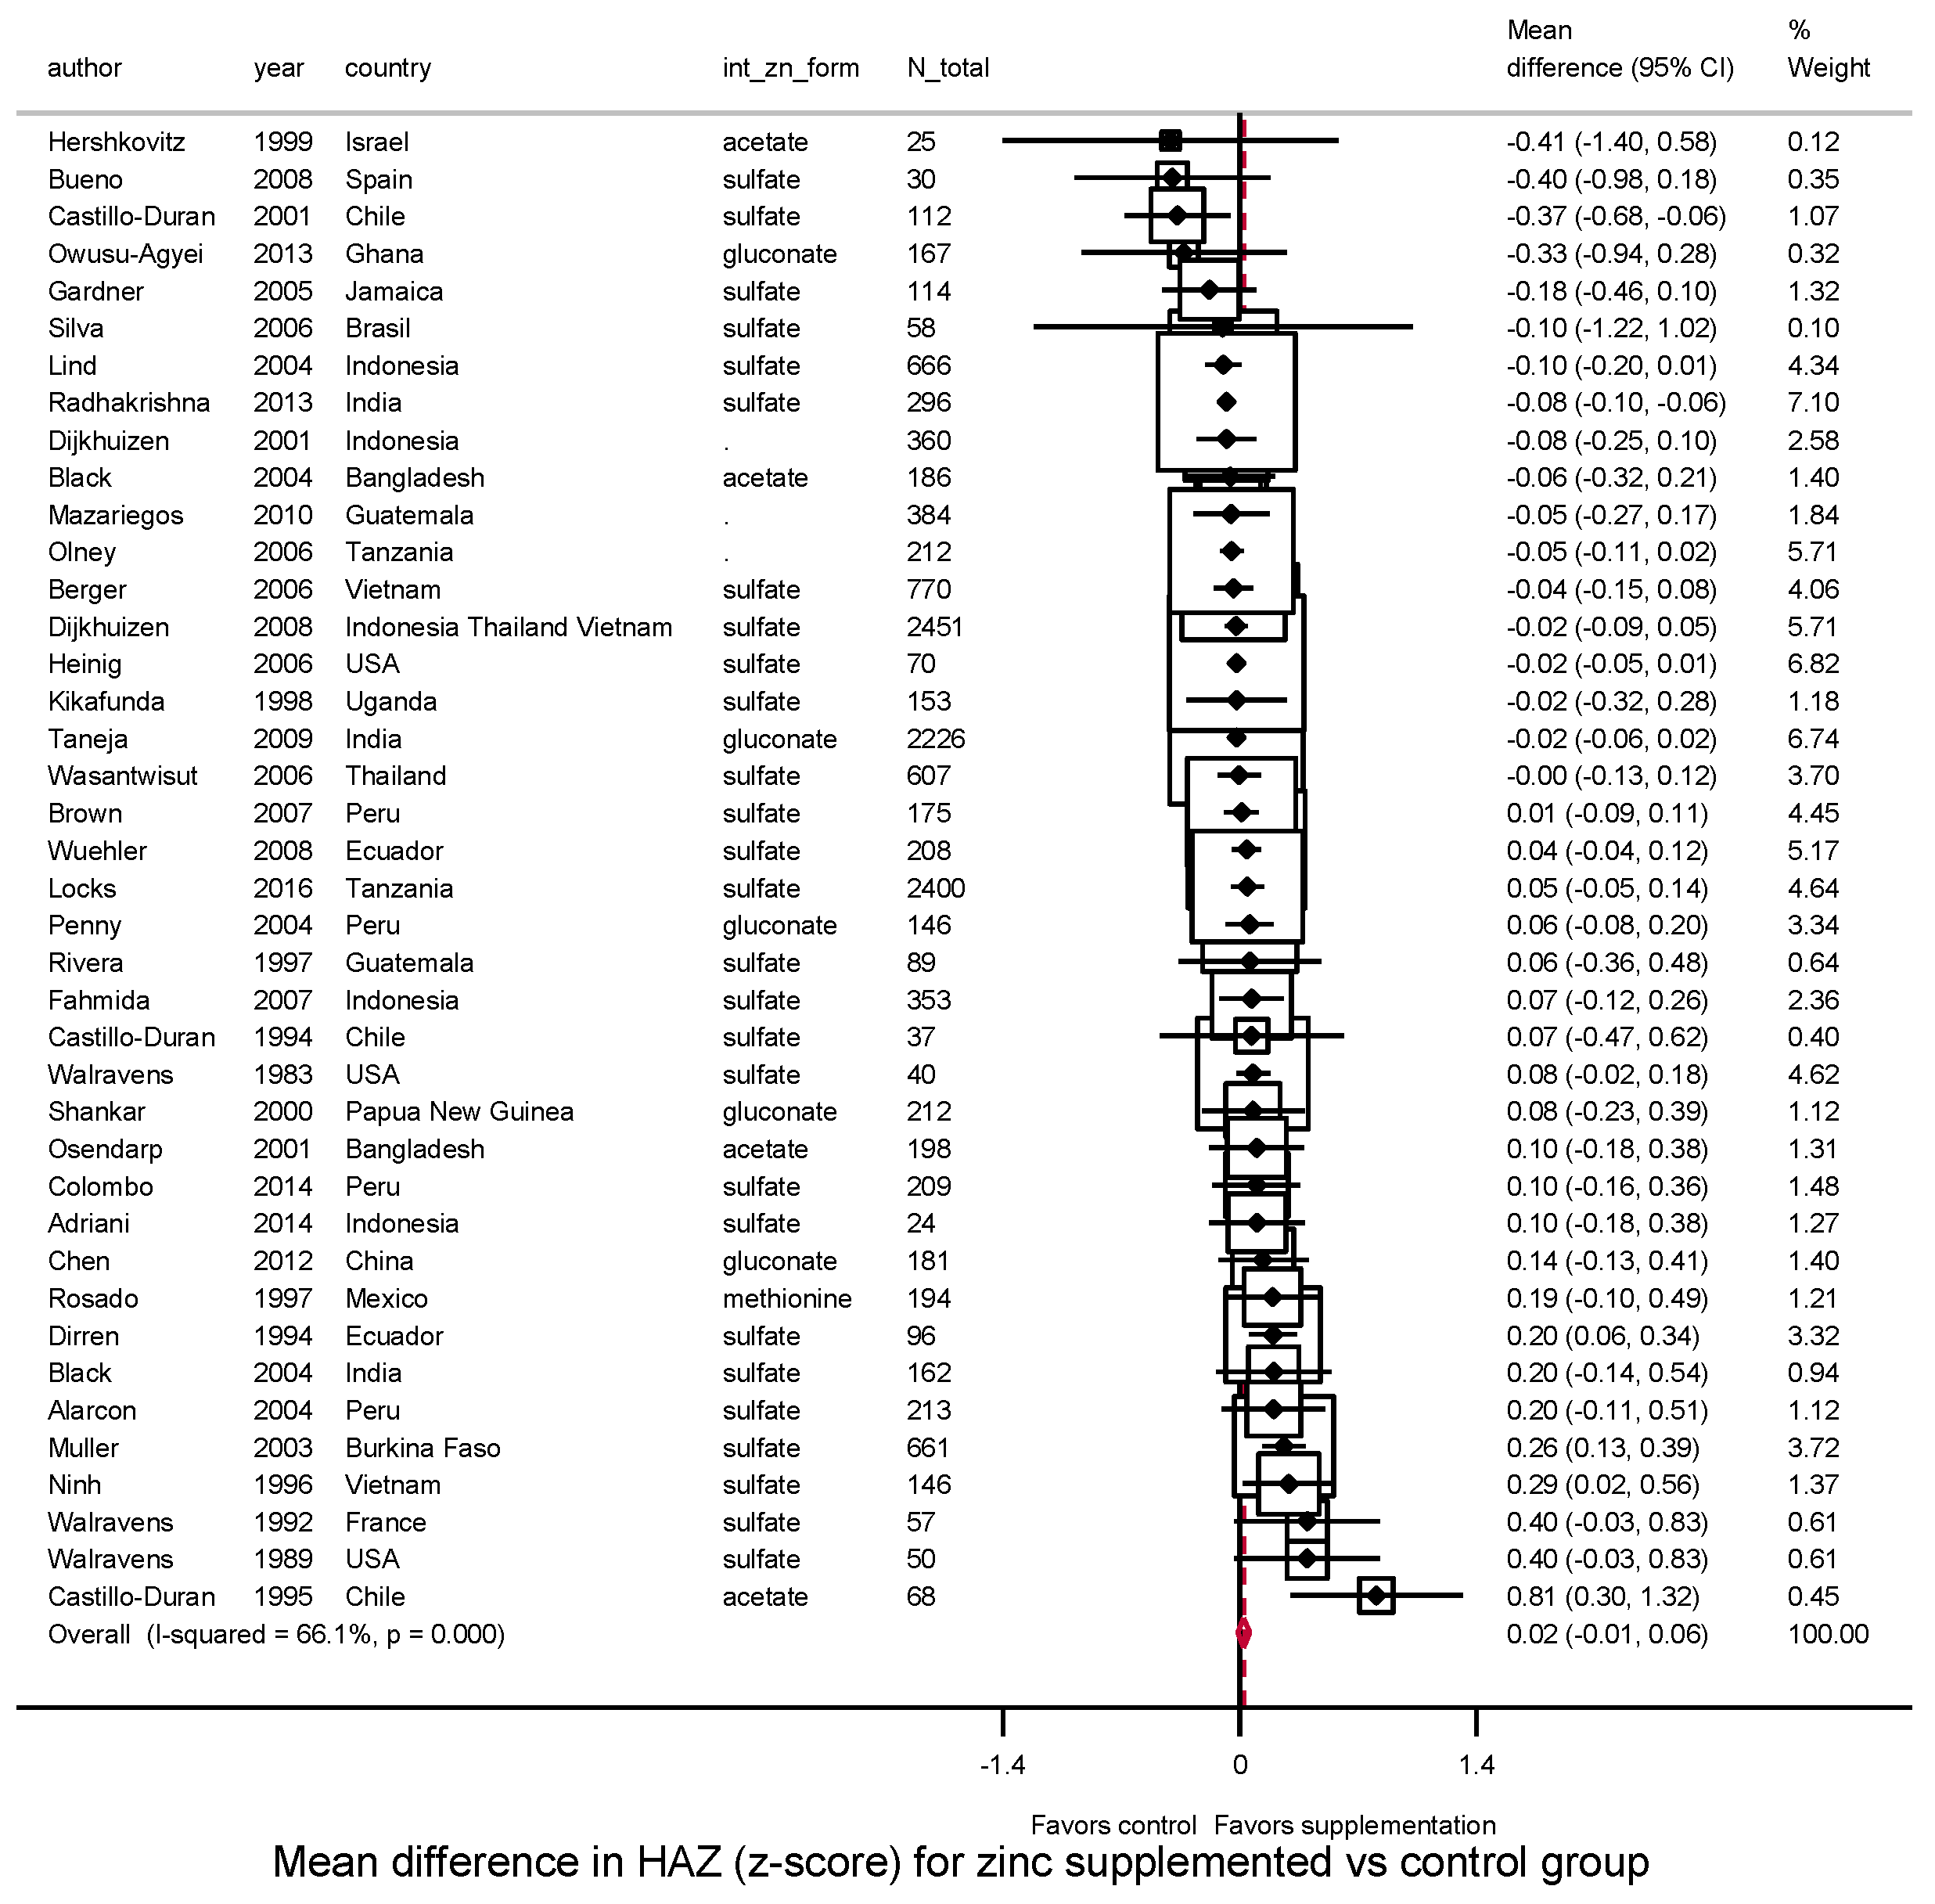
3.3.1. Height, HAZ and Stunting
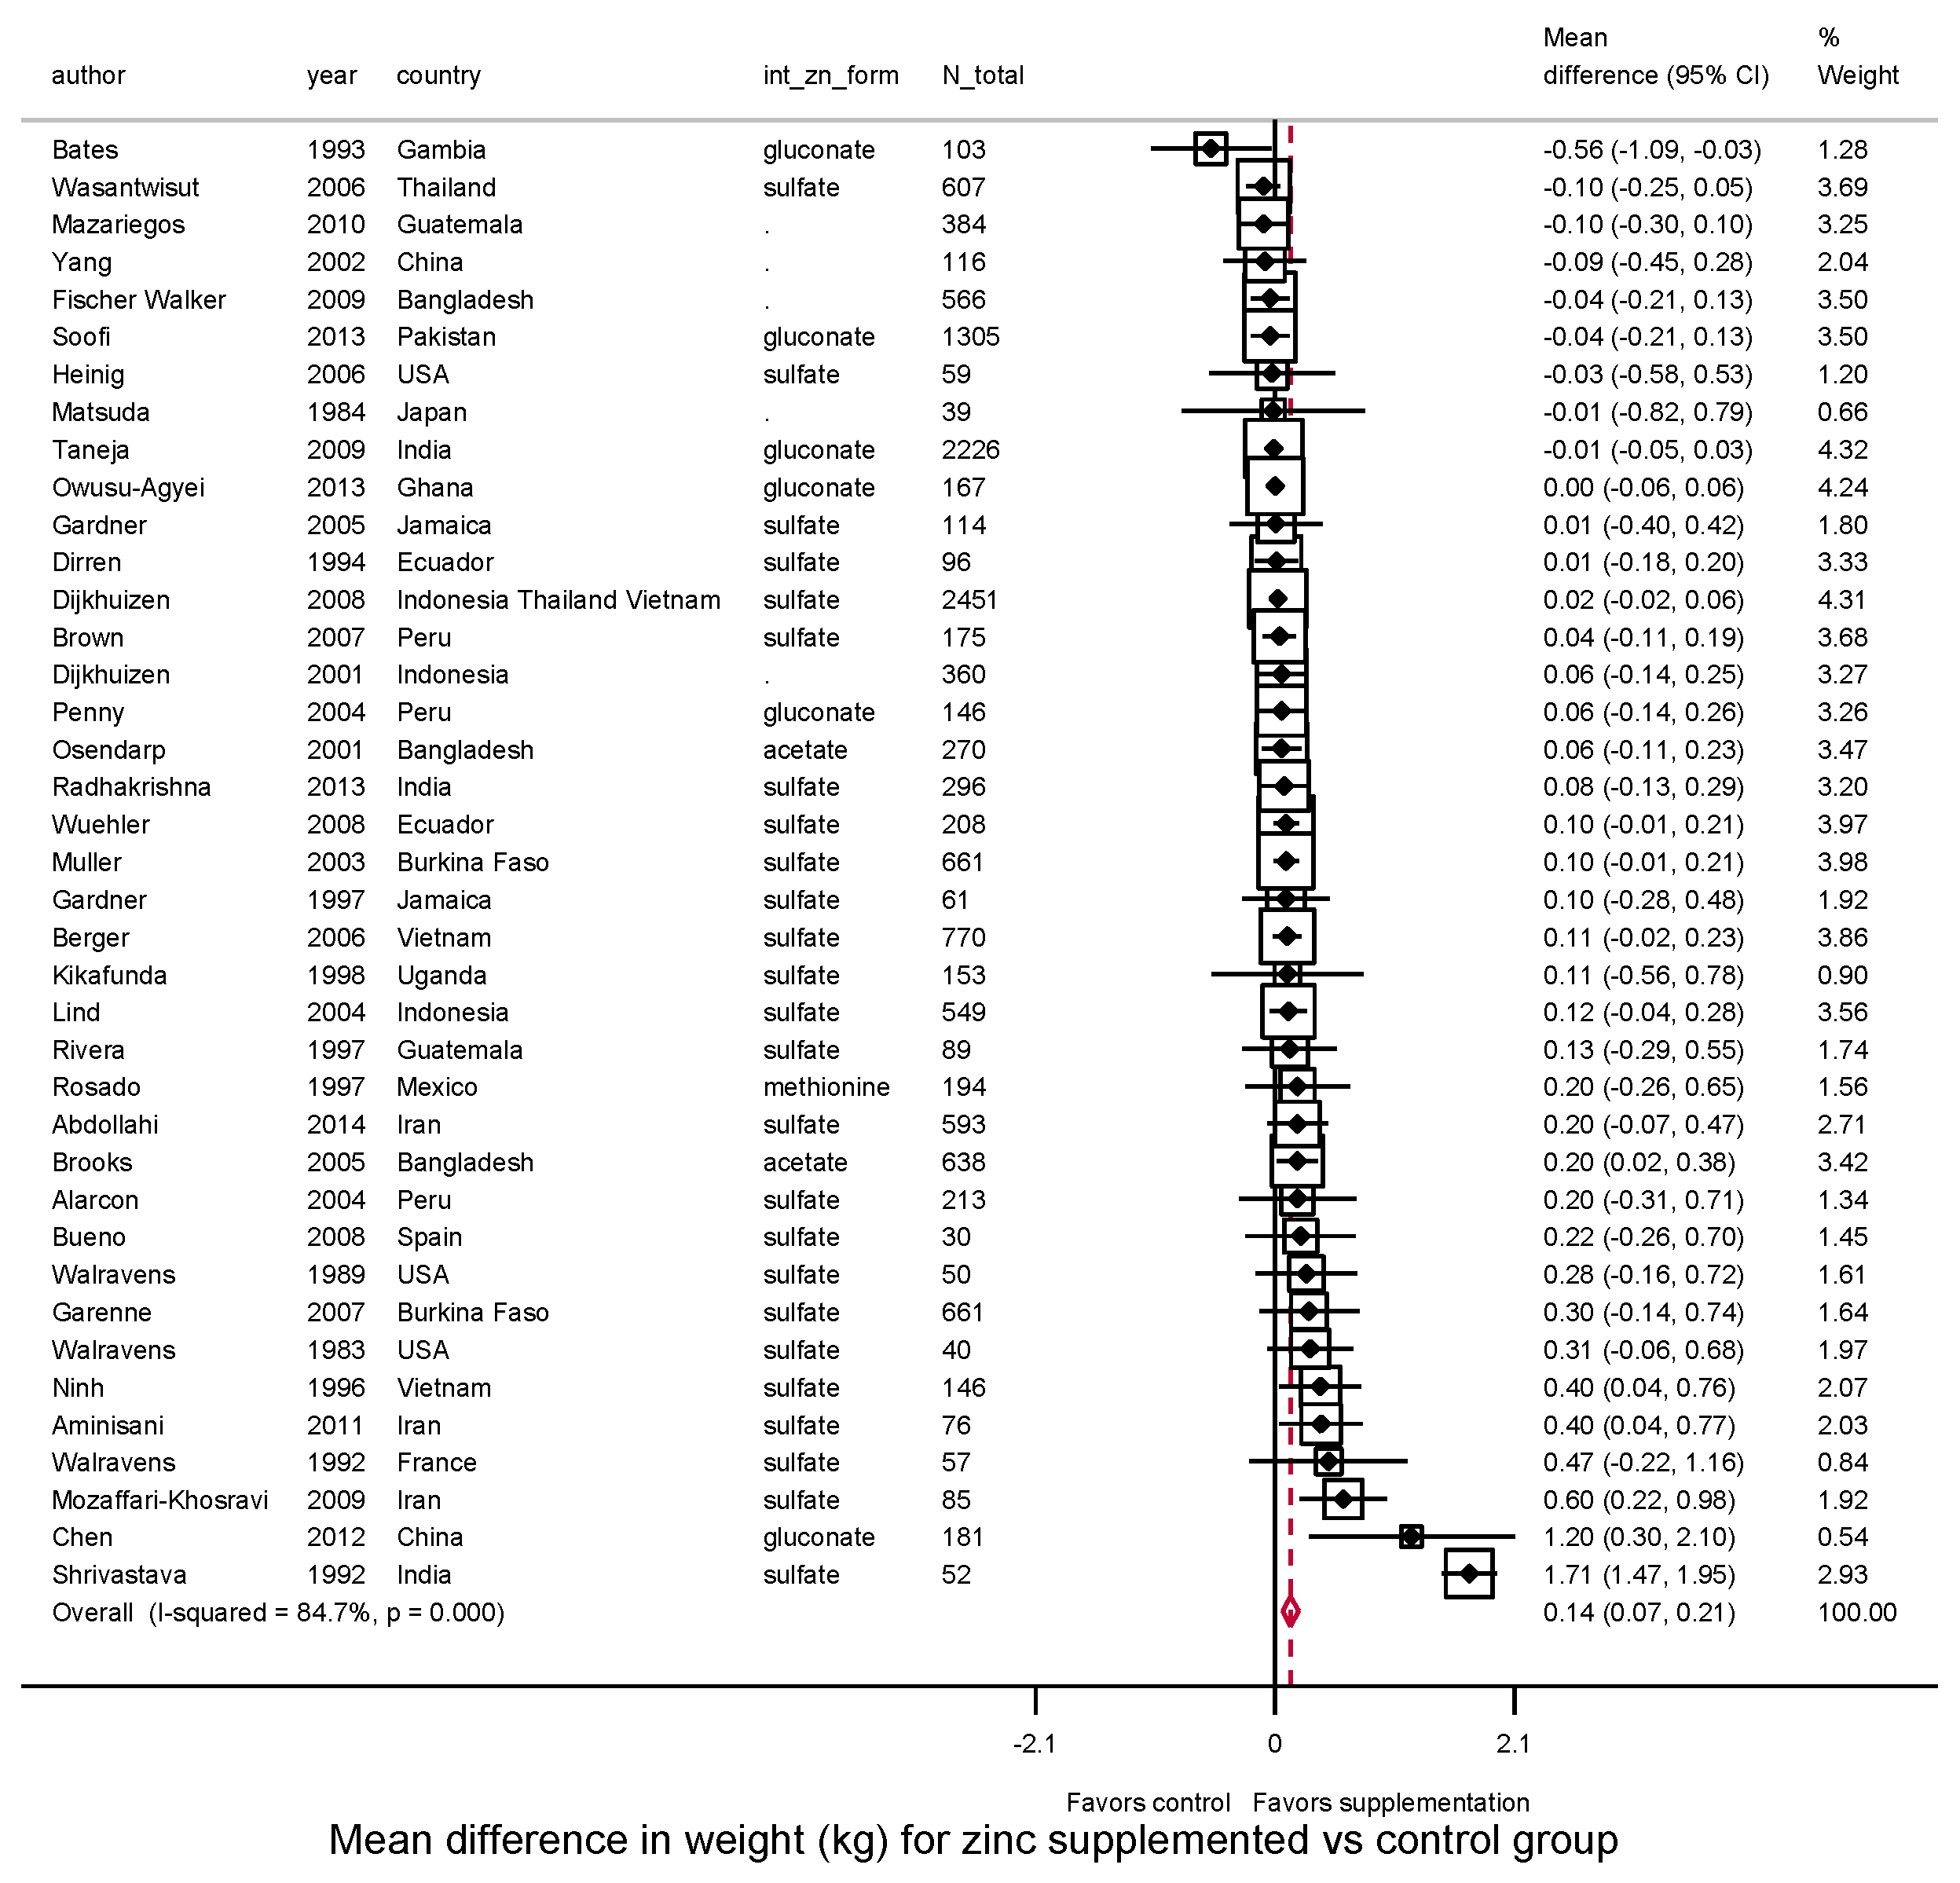
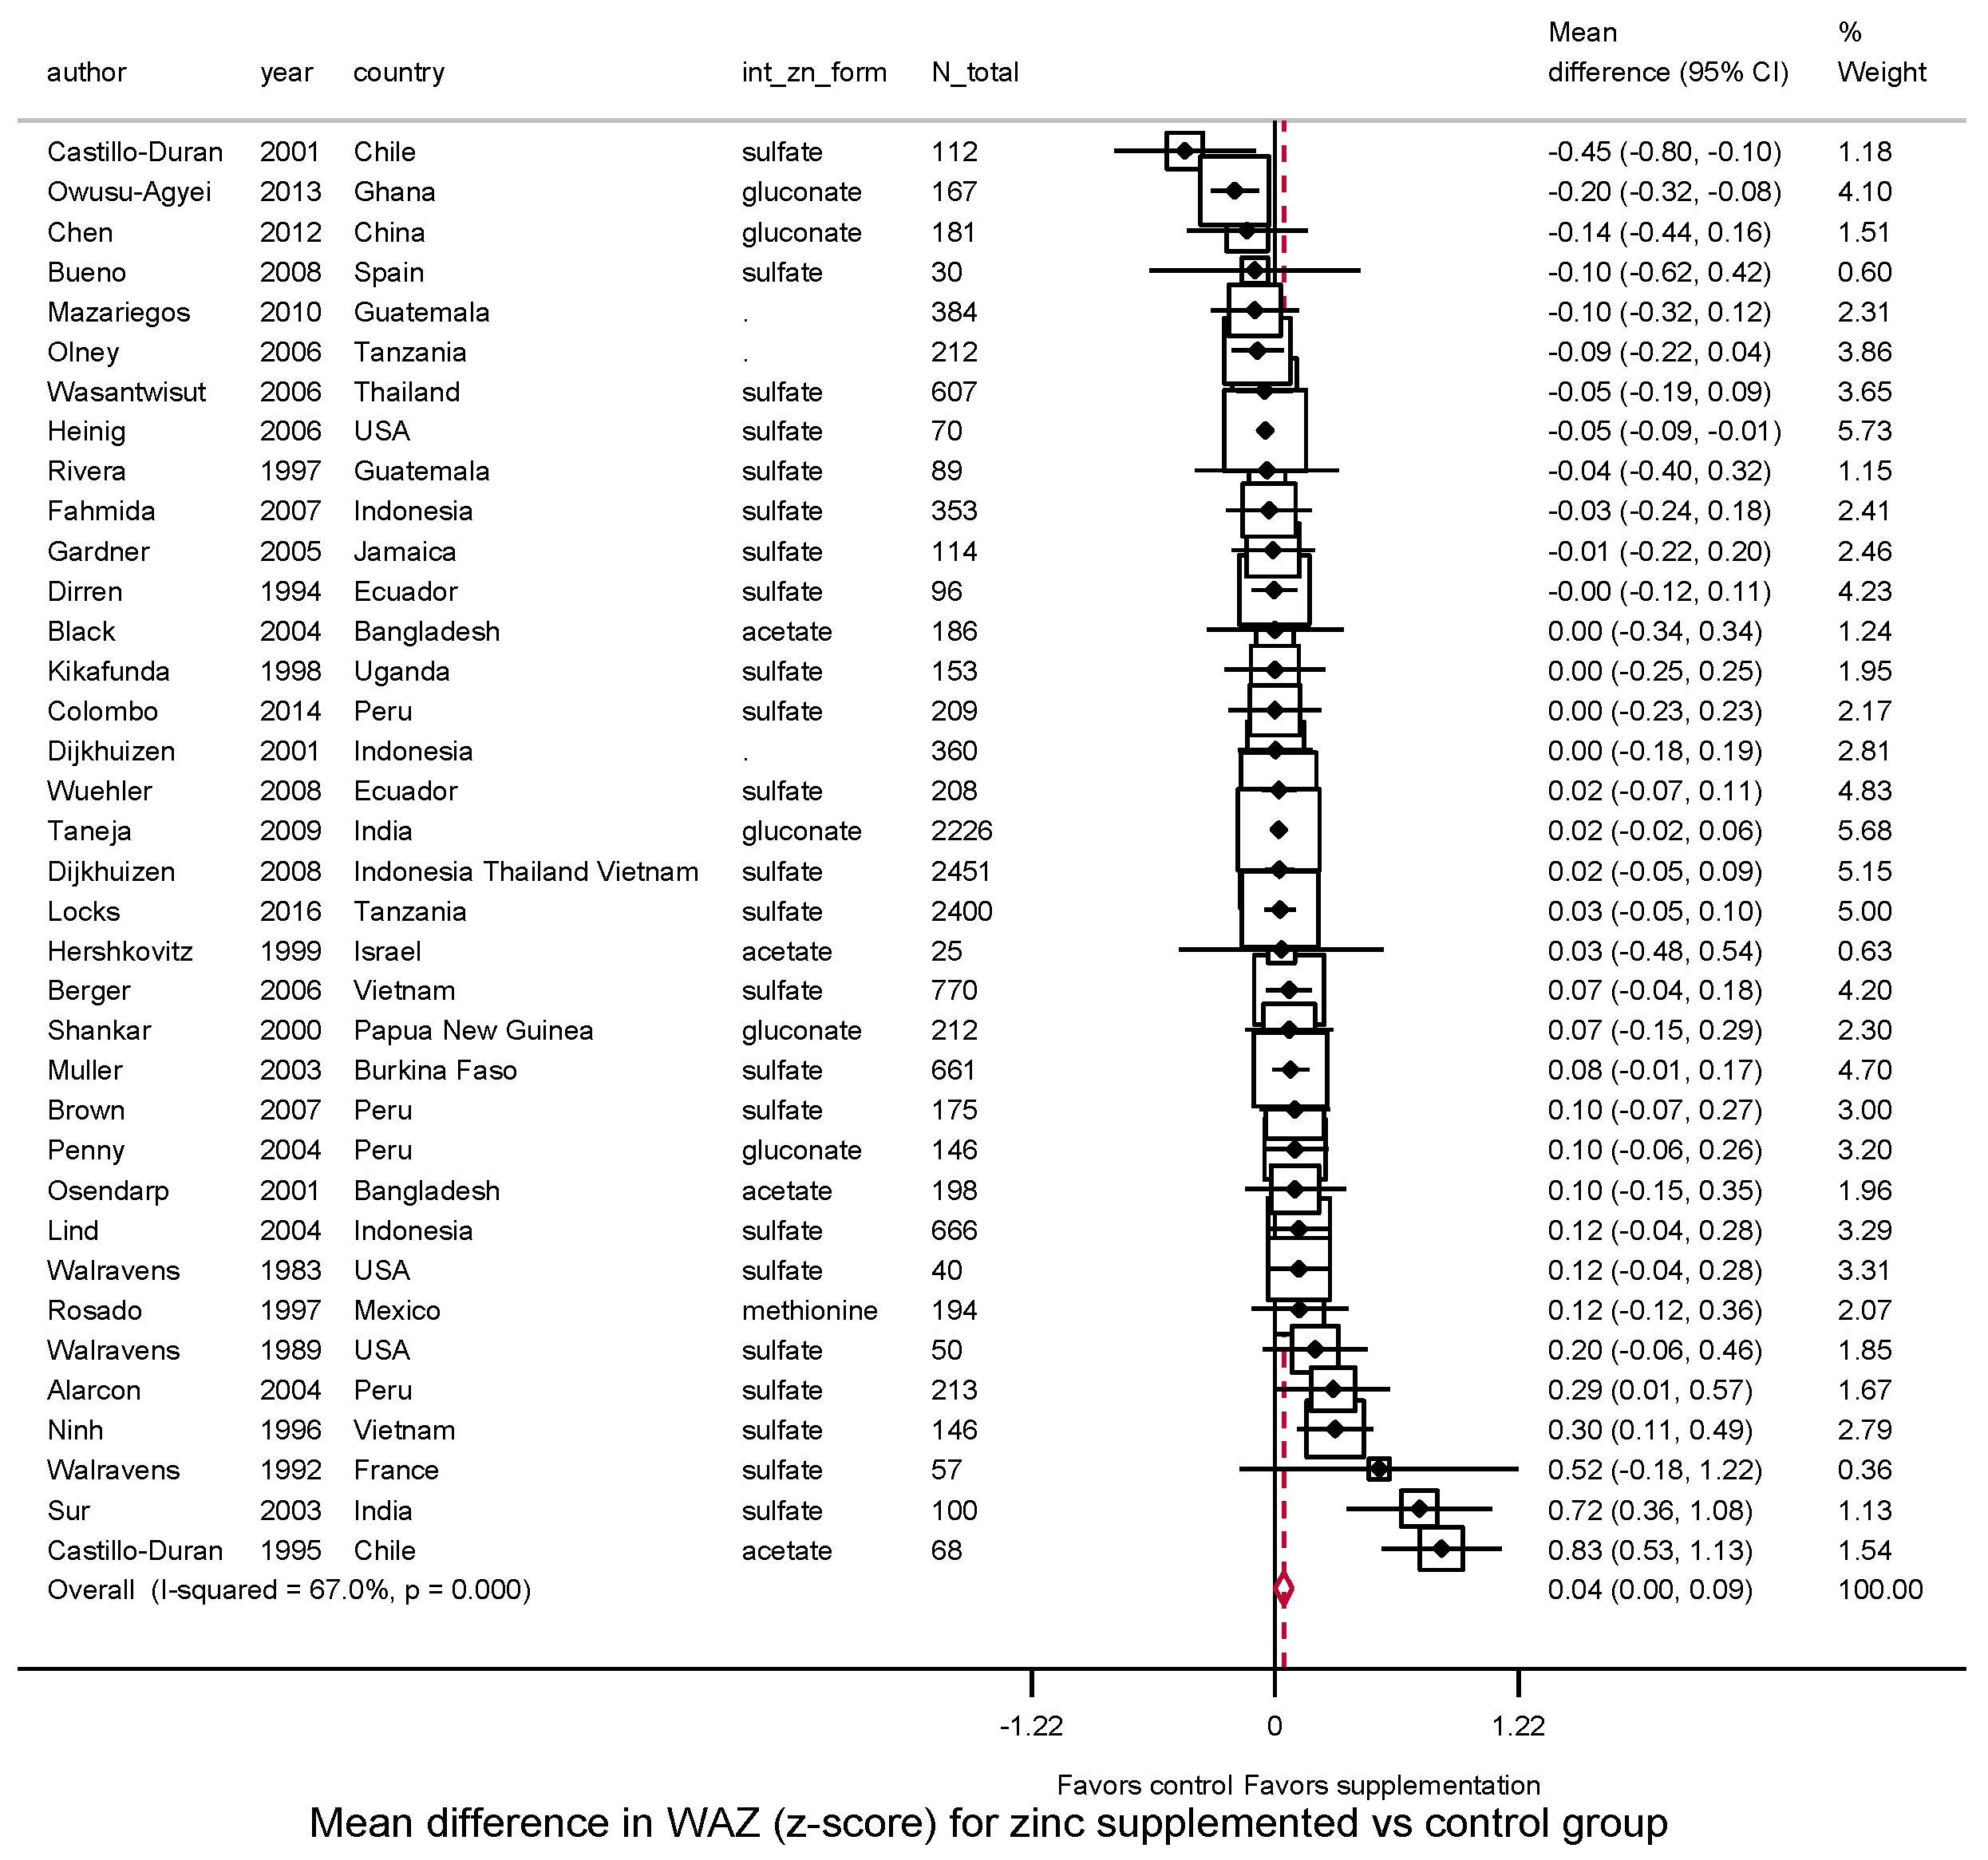
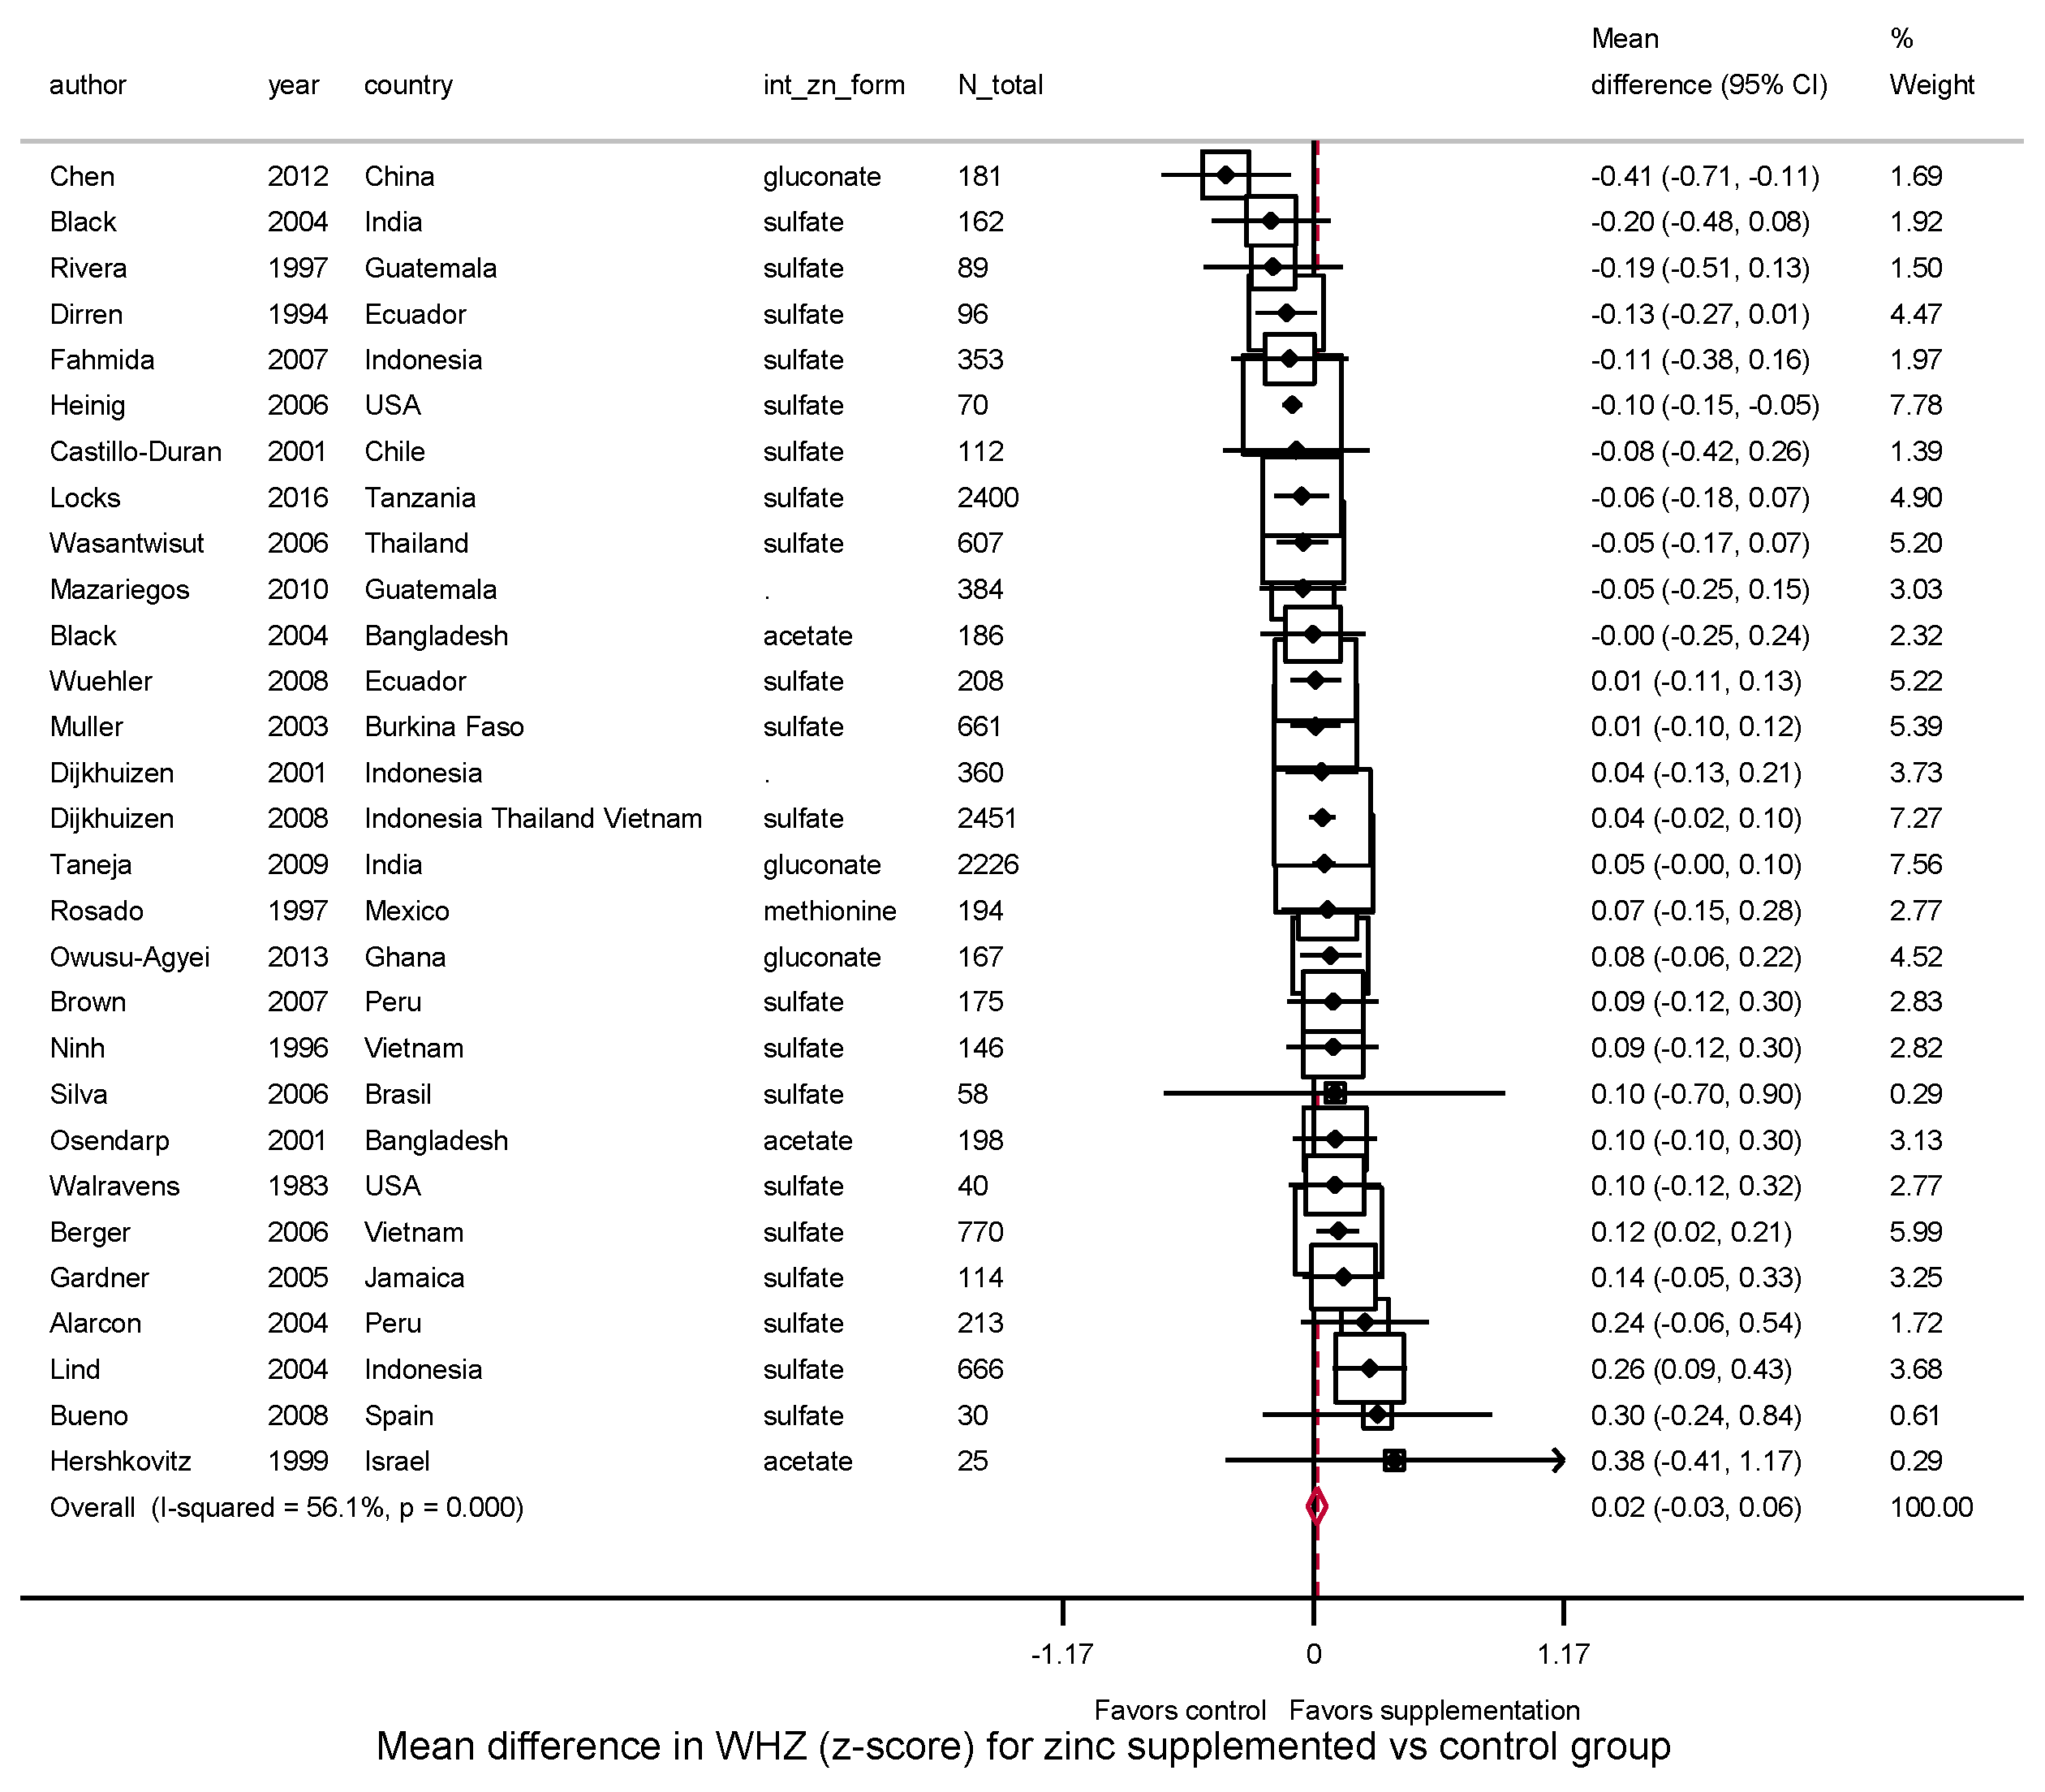
3.3.2. Weight, WAZ, WHZ, Underweight, Wasting
3.4. Influence of Study Quality
3.5. Evaluation of Publication Bias
4. Discussion
5. Conclusions
Supplementary Materials
Acknowledgments
Author Contributions
Conflict of Interest
References
- Victora, C.G.; de Onis, M.; Hallal, P.C.; Blossner, M.; Shrimpton, R. Worldwide timing of growth faltering: Revisiting implications for interventions. Pediatrics 2010, 125, e473–e480. [Google Scholar] [CrossRef] [PubMed]
- Dewey, K.G.; Begum, K. Long-term consequences of stunting in early life. Maternal Child Nutr. 2011, 7 (Suppl. 3), 5–18. [Google Scholar] [CrossRef] [PubMed]
- Black, R.E.; Victora, C.G.; Walker, S.P.; Bhutta, Z.A.; Christian, P.; de Onis, M.; Ezzati, M.; Grantham-McGregor, S.; Katz, J.; Martorell, R.; et al. Maternal and child undernutrition and overweight in low-income and middle-income countries. Lancet 2013, 382, 427–451. [Google Scholar] [CrossRef]
- Casale, D.; Desmond, C.; Richter, L. The association between stunting and psychosocial development among preschool children: A study using the south african birth to twenty cohort data. Child Care Health Dev. 2014, 40, 900–910. [Google Scholar] [CrossRef] [PubMed]
- King, J.C. Zinc: An essential but elusive nutrient. Am. J. Clin. Nutr. 2011, 94, 679S–684S. [Google Scholar] [CrossRef] [PubMed]
- Terrin, G.; Berni Canani, R.; Di Chiara, M.; Pietravalle, A.; Aleandri, V.; Conte, F.; De Curtis, M. Zinc in early life: A key element in the fetus and preterm neonate. Nutrients 2015, 7, 10427–10446. [Google Scholar] [CrossRef] [PubMed]
- Wardlaw, G.M.; Hampl, J.S. Perspectives in Nutrition, 5th ed.; McGraw-Hill: Boston, MA, USA, 2007. [Google Scholar]
- Prasad, A.S. Discovery of human zinc deficiency: Its impact on human health and disease. Adv. Nutr. 2013, 4, 176–190. [Google Scholar] [CrossRef] [PubMed]
- MacDonald, R.S. The role of zinc in growth and cell proliferation. J. Nutr. 2000, 130, 1500S–1508S. [Google Scholar] [CrossRef] [PubMed]
- Clegg, M.S.; Hanna, L.A.; Niles, B.J.; Momma, T.Y.; Keen, C.L. Zinc deficiency-induced cell death. IUBMB Life 2005, 57, 661–669. [Google Scholar] [CrossRef] [PubMed]
- Gibson, R.S. Zinc: The missing link in combating micronutrient malnutrition in developing countries. Proc. Nutr. Soc. 2006, 65, 51–60. [Google Scholar] [CrossRef] [PubMed]
- Ahmed, T.; Hossain, M.; Sanin, K.I. Global burden of maternal and child undernutrition and micronutrient deficiencies. Ann Nutr Metab 2012, 61 (Suppl. 1), 8–17. [Google Scholar]
- Brown, K.H.; Peerson, J.M.; Baker, S.K.; Hess, S.Y. Preventive zinc supplementation among infants, preschoolers, and older prepubertal children. Food Nutr. Bull. 2009, 30, S12–S40. [Google Scholar] [CrossRef] [PubMed]
- Brown, K.H.; Peerson, J.M.; Rivera, J.; Allen, L.H. Effect of supplemental zinc on the growth and serum zinc concentrations of prepubertal children: A meta-analysis of randomized controlled trials. Am. J. Clin. Nutr. 2002, 75, 1062–1071. [Google Scholar] [CrossRef] [PubMed]
- Imdad, A.; Bhutta, Z.A. Effect of preventive zinc supplementation on linear growth in children under 5 years of age in developing countries: A meta-analysis of studies for input to the lives saved tool. BMC Public Health 2011, 11 (Suppl. 3), S22. [Google Scholar] [CrossRef] [PubMed]
- Mayo-Wilson, E. Zinc supplementation for preventing mortality, morbidity, and growth failure in children aged 6 months to 12 years of age. Cochrane Database Syst. Rev. 2014. [Google Scholar] [CrossRef] [PubMed]
- Mayo-Wilson, E.; Imdad, A.; Junior, J.; Dean, S.; Bhutta, Z.A. Preventive zinc supplementation for children, and the effect of additional iron: A systematic review and meta-analysis. BMJ Open 2014, 4, e004647. [Google Scholar] [CrossRef] [PubMed]
- Ramakrishnan, U.; Nguyen, P.; Martorell, R. Effects of micronutrients on growth of children under 5 y of age: Meta-analyses of single and multiple nutrient interventions. Am. J. Clin. Nutr. 2009, 89, 191–203. [Google Scholar] [CrossRef] [PubMed]
- Stammers, A.L.; Lowe, N.M.; Medina, M.W.; Patel, S.; Dykes, F.; Perez-Rodrigo, C.; Serra-Majam, L.; Nissensohn, M.; Moran, V.H. The relationship between zinc intake and growth in children aged 1–8 years: A systematic review and meta-analysis. Eur. J. Clin. Nutr. 2015, 69, 147–153. [Google Scholar] [CrossRef] [PubMed]
- Moher, D.; Liberati, A.; Tetzlaff, J.; Altman, D.G.; Group, P. Preferred reporting items for systematic reviews and meta-analyses: The prisma statement. BMJ 2009, 339, b2535. [Google Scholar] [CrossRef] [PubMed]
- Higgins, J.P.T.; Green, S. (Eds.) Cochrane Handbook for Systematic Reviews of Interventions, version 5.1.0; The Cochrane Collaboration: Oxford, UK, 2011. [Google Scholar]
- DerSimonian, R.; Laird, N. Meta-analysis in clinical trials. Control. Clin. Trials 1986, 7, 177–188. [Google Scholar] [CrossRef]
- Higgins, J.P.; Thompson, S.G. Quantifying heterogeneity in a meta-analysis. Stat. Med. 2002, 21, 1539–1558. [Google Scholar] [CrossRef] [PubMed]
- Egger, M.; Davey Smith, G.; Schneider, M.; Minder, C. Bias in meta-analysis detected by a simple, graphical test. BMJ 1997, 315, 629–634. [Google Scholar] [CrossRef] [PubMed]
- Begg, C.B.; Mazumdar, M. Operating characteristics of a rank correlation test for publication bias. Biometrics 1994, 50, 1088–1101. [Google Scholar] [CrossRef] [PubMed]
- Donangelo, C.M.; King, J.C. Maternal zinc intakes and homeostatic adjustments during pregnancy and lactation. Nutrients 2012, 4, 782–798. [Google Scholar] [CrossRef] [PubMed]
- Islam, M.N.; Chowdhury, A.K.; Siddika, M.; Hossain, M.A.; Hossain, M.K. Effect of zinc on growth of preterm babies. Mymensingh Med. J. 2009, 18, 125–130. [Google Scholar] [PubMed]
- Castillo-Duran, C.; Weisstaub, G. Zinc supplementation and growth of the fetus and low birth weight infant. J. Nutr. 2003, 133, 1494S–1497S. [Google Scholar] [CrossRef] [PubMed]
- Brown, K.H.; Engle-Stone, R.; Krebs, N.F.; Peerson, J.M. Dietary intervention strategies to enhance zinc nutrition: Promotion and support of breastfeeding for infants and young children. Food Nutr. Bull. 2009, 30, S144–S171. [Google Scholar]
- Mwangome, M.K.; Berkley, J.A. The reliability of weight-for-length/height z scores in children. Maternal Child Nutr. 2014, 10, 474–480. [Google Scholar] [CrossRef] [PubMed]
- Underwood, L.E. Special considerations in the design of trials involving children. J. Nutr. 1999, 129, 264S–269S. [Google Scholar] [CrossRef] [PubMed]
- De Brito, N.J.; Rocha, E.D.; de Araujo Silva, A.; Costa, J.B.; Franca, M.C.; das Gracas Almeida, M.; Brandao-Neto, J. Oral zinc supplementation decreases the serum iron concentration in healthy schoolchildren: A pilot study. Nutrients 2014, 6, 3460–3473. [Google Scholar] [CrossRef] [PubMed]
- Rossander-Hulten, L.; Brune, M.; Sandstrom, B.; Lonnerdal, B.; Hallberg, L. Competitive inhibition of iron absorption by manganese and zinc in humans. Am. J. Clin. Nutr. 1991, 54, 152–156. [Google Scholar] [CrossRef] [PubMed]
- Olivares, M.; Pizarro, F.; Ruz, M. Zinc inhibits nonheme iron bioavailability in humans. Biol. Trace Elem. Res. 2007, 117, 7–14. [Google Scholar] [CrossRef] [PubMed]


| Pregnant Mothers | Infants (<2 Years) | Children (2–5 Years) | |
|---|---|---|---|
| Trials 1, n | 24 | 47 | 7 |
| Total participants, n | 13,167 | 20,412 | 773 |
| Subject socioeconomic status 2 | Low, 14; Medium, 8; High, 2; | Low, 37; Medium, 6; High, 3; -, 1 | Low, 5; Medium, 1; High, 0; -, 1 |
| Mean age (range) | 25.1 (15.9–30.4) years | 8.7 (0–23.5) months | 43.4 (28.7–55.8) months |
| Mean gestational age, weeks (range) | 16.0 (9.8–24.0) | ||
| Mean supplement duration, weeks (range) | 22.9 (16.0–29.0) | 30.9 (12.0–78.0) | 38.9 (26.0–64.5) |
| Mean duration to last f/u, weeks (range) | 22.9 (16.0–29.0) | 34.7 (12.0–87.0) | 43.8 (26.0–64.5) |
| Mean zinc dose, mg/day (range) | 26.8 (10.0–50.0) | 7.6 (2.0–20.0) | 8.5 (0.37–20.0) |
| Zinc Formulation | Acetate, 1; Citrate, 1, Gluconate, 2; Lactate, 1; Sulfate 19; | Acetate, 5; Gluconate 6; Sulfate 30, unknown 6 | Gluconate, 1; Methionine, 1; Sulfate, 5 |
| Growth outcomes | BW, LBW | Weight, Height, WAZ, WHZ, HAZ, stunting, wasting, underweight | Weight, Height, WAZ, WHZ, HAZ, stunting, wasting, underweight |
| Quality score 3, n trials | Low, 4; Medium, 3; High, 15 | Low, 6; Medium, 10; High, 31 | Low, 1; Medium, 0; High, 6 |
| Birth Weight(kg) | |||||
|---|---|---|---|---|---|
| n | Mean Difference (95%CI) | I2 | τ2 | P-interaction 1 | |
| Overall | 22 | 0.08 | 98.9% | 0.10 | |
| (−0.05, 0.22) | |||||
| World region | |||||
| Africa | 3 | 0.01 | 0.0% | 0.00 | 0.65 |
| (−0.02, 0.04) | |||||
| Asia | 11 | 0.14 | 99.3% | 0.14 | |
| (−0.08, 0.37) | |||||
| Western | 4 | 0.03 | 0.0% | 0.00 | |
| (−0.00, 0.07) | |||||
| Americas | 4 | 0.02 | 27.1% | 0.00 | |
| (−0.03, 0.07) | |||||
| Rural/urban residence | |||||
| Rural | 3 | 0.01 | 79.7% | 0.00 | 0.60 |
| (−0.07, 0.10) | |||||
| Urban | 14 | 0.12 | 99.1% | 0.13 | |
| (−0.07, 0.31) | |||||
| Both | 1 | −0.04 | NA | 0.00 | |
| (−0.15, 0.08) | |||||
| Unknown | 4 | 0.02 | 16.8% | 0.00 | |
| (−0.01, 0.06) | |||||
| Socioeconomic status | |||||
| Lower | 14 | 0.06 | 99.2% | 0.13 | 0.74 |
| (−0.13, 0.25) | |||||
| Medium | 6 | 0.14 | 97.1% | 0.06 | |
| (−0.07, 0.34) | |||||
| Higher | 2 | 0.04 | 0.0% | 0.00 | |
| (0.01, 0.08) | |||||
| Intervention duration | |||||
| <26 weeks | 13 | 0.09 | 99.2% | 0.13 | 0.78 |
| (−0.11, 0.29) | |||||
| ≥26 weeks | 9 | 0.07 | 95.8% | 0.04 | |
| (−0.06, 0.20) | |||||
| Intervention dose | |||||
| <28.3 mg/day | 13 | 0.07 | 93.3% | 0.02 | 0.67 |
| (−0.02, 0.15) | |||||
| ≥28.3 mg/day | 9 | 0.11 | 99.5% | 0.16 | |
| (−0.16, 0.37) | |||||
| Zinc formulation | |||||
| Acetate | 1 | −0.04 | NA | 0.00 | 0.78 |
| (−0.12, 0.03) | |||||
| Citrate | 1 | 0.17 | NA | 0.00 | |
| (−0.15, 0.49) | |||||
| Gluconate | 2 | 0.2 | 98.6% | 0.09 | |
| (−0.22, 0.62) | |||||
| Lactate | 1 | 0.18 | NA | 0.00 | |
| (0.04, 0.33) | |||||
| Sulfate | 17 | 0.07 | 99.1% | 0.11 | |
| (−0.09, 0.23) | |||||
| Background iron supplementation | |||||
| No | 9 | 0.16 | 99.4% | 0.13 | 0.10 |
| (−0.08, 0.40) | |||||
| Yes | 13 | 0.01 | 49.6% | 0.00 | |
| (−0.02, 0.04) | |||||
| Publication year | |||||
| Before 2000 | 6 | 0.14 | 99.5% | 0.18 | 0.34 |
| (−0.21, 0.49) | |||||
| 2000 and after | 16 | 0.06 | 92.8% | 0.02 | |
| (−0.01, 0.13) | |||||
| Quality score 2 | |||||
| ≤2 | 4 | 0.32 | 99.3% | 0.11 | 0.003 |
| (−0.01, 0.65) | |||||
| 3~4 | 2 | −0.03 | 0.0% | 0.00 | |
| (−0.09, 0.03) | |||||
| ≥5 | 16 | 0.02 | 40.6% | 0.00 | |
| (−0.01, 0.04) | |||||
| Height (cm) | HAZ | |||||||||
|---|---|---|---|---|---|---|---|---|---|---|
| n | MD (95%CI) | I2 | τ2 | P-interaction 1 | n | MD (95%CI) | I2 | τ2 | P-interaction 1 | |
| Overall | 40 | 0.23 | 66.9% | 0.10 | 40 | 0.02 | 66.1% | 0.00 | ||
| (0.09–0.38) | (−0.01, 0.06) | |||||||||
| Child age at intervention | ||||||||||
| 0–<2 years | 33 | 0.10 | 44.7% | 0.03 | 0.002 | 34 | 0.01 | 64.6% | 0.00 | 0.06 |
| (−0.02 0.22) | (−0.03, 0.04) | |||||||||
| 2–5 years | 7 | 1.37 | 82.0% | 0.82 | 6 | 0.12 | 0.0% | 0.00 | ||
| (0.50, 2.25) | (0.05, 0.19) | |||||||||
| World region | ||||||||||
| Africa | 5 | 0.07 | 58.4% | 0.09 | 0.86 | 5 | 0.05 | 78.9% | 0.02 | 0.63 |
| (−0.35, 0.49) | (−0.09, 0.19) | |||||||||
| Asia | 17 | 0.26 | 78.4% | 0.13 | 15 | −0.02 | 49.2% | 0.00 | ||
| (0.03, 0.48) | (−0.06, 0.02) | |||||||||
| Western | 6 | 0.53 | 0.0% | 0.00 | 6 | 0.05 | 61.0% | 0.10 | ||
| (0.19–0.88) | (−0.07, 0.18) | |||||||||
| Americas | 12 | 0.25 | 48.8% | 0.09 | 14 | 0.06 | 49.6% | 0.10 | ||
| (−0.03, 0.53) | (−0.03, 0.14) | |||||||||
| Rural/urban residence | ||||||||||
| Rural | 15 | 0.07 | 51.0% | 0.06 | 0.20 | 15 | 0.05 | 58.4% | 0.01 | 0.79 |
| (−0.13, 0.27) | (−0.03, 0.13) | |||||||||
| Urban | 21 | 0.55 | 77.2% | 0.27 | 20 | 0.02 | 69.9% | 0.00 | ||
| (0.24, 0.86) | (−0.03, 0.07) | |||||||||
| Both | 2 | 0.10 | 0.0% | 0.00 | 2 | −0.01 | 60.5% | 0.00 | ||
| (−0.16, 0.35) | (−0.09, 0.08) | |||||||||
| Unknown | 2 | 0.05 | 100.0% | 1.00 | 3 | −0.03 | 0.0% | 0.00 | ||
| (−0.09, 0.18) | (−0.10, 0.03) | |||||||||
| Socioeconomic status | ||||||||||
| Lower | 31 | 0.18 | 60.6% | 0.07 | 0.43 | 32 | 0.03 | 69.1% | 0.01 | 0.99 |
| (0.03, 0.32) | (−0.02, 0.07) | |||||||||
| Medium | 5 | 0.88 | 89.2% | 0.46 | 4 | 0.03 | 0.0% | 0.00 | ||
| (0.18–1.59) | (−0.03, 0.07) | |||||||||
| Higher | 3 | 0.14 | 0.0% | 0.00 | 2 | 0.13 | 72.3% | 0.06 | ||
| (−0.81, 1.08) | (−0.26, 0.53) | |||||||||
| Unknown | 1 | 0.10 | 0.00 | 2 | 0.13 | 72.3% | 0.07 | |||
| (−1.58, 1.78) | (−0.26, 0.53) | |||||||||
| Intervention Duration | ||||||||||
| <26 weeks | 11 | 0.11 | 36.6% | 0.03 | 0.79 | 9 | 0.05 | 39.4% | 0.01 | 0.78 |
| (−0.10, 0.31) | (−0.06, 0.16) | |||||||||
| ≥26 weeks | 29 | 0.27 | 71.6% | 0.15 | 31 | 0.02 | 69.8% | 0.01 | ||
| (0.08, 0.48) | (−0.02, 0.06) | |||||||||
| Intervention dose | ||||||||||
| <8.4mg/day | 18 | 0.37 | 74.5% | 0.28 | 0.67 | 17 | −0.01 | 67.2% | 0.00 | 0.23 |
| (0.05, 0.70) | (−0.05, 0.04) | |||||||||
| ≥8.4 mg/day | 22 | 0.19 | 58.2% | 0.05 | 23 | 0.05 | 53.4% | 0.01 | ||
| (0.03, 0.35) | (−0.00, 0.10) | |||||||||
| Zinc formulation | ||||||||||
| Acetate | 3 | 0.68 | 69.9% | 0.28 | 0.86 | 4 | −0.05 | 0.0% | 0.09 | 0.58 |
| (−0.06, 1.42) | (−0.11, 0.11) | |||||||||
| (−0.54, 0.34) | . | |||||||||
| Gluconate | 6 | 0.23 | 89.2% | 0.22 | 5 | −0.01 | 69.4% | 0.00 | ||
| (−0.24, 0.70) | (−0.05, 0.02) | |||||||||
| Methionine | 1 | 0.59 | NA | NA | 1 | 0.19 | . | 0.00 | ||
| (−1.12, 2.29) | (−0.10, 0.49) | |||||||||
| Sulfate | 25 | 0.23 | 46.0% | 0.05 | 27 | 0.03 | 72.3% | 0.06 | ||
| (0.06, 0.40) | (−0.01, 0.08) | |||||||||
| Unknown | 4 | −0.01 | 75.2% | 0.27 | 3 | −0.05 | 0.0% | 0.00 | ||
| (−0.64, 0.61) | (−0.11, 0.01) | |||||||||
| Background iron supplementation | ||||||||||
| No | 29 | 0.40 | 74.9% | 0.19 | 0.11 | 27 | 0.05 | 75.1% | 0.01 | 0.21 |
| (0.17, 0.63) | (−0.00, 0.10) | |||||||||
| Yes | 11 | 0.02 | 0.0% | 0.00 | 13 | −0.03 | 0.0% | 0.00 | ||
| (−0.08, 0.12) | (−0.06, 0.01) | |||||||||
| Publication year | ||||||||||
| Before 2000 | 13 | 0.58 | 30.5% | 0.12 | 0.08 | 11 | 0.18 | 34.6% | 0.00 | 0.002 |
| (0.20, 0.95) | (0.08, 2.29) | |||||||||
| 2000 and after | 27 | 0.15 | 68.6% | 0.08 | 29 | −0.01 | 60.3% | |||
| (0.001, 0.30) | (−0.04, 0.03) | |||||||||
| Quality score 2 | ||||||||||
| ≤2 | 6 | 0.80 | 83.4% | 1.45 | 0.23 | 3 | −0.07 | 44.6% | 0.02 | 0.33 |
| (−0.33, 1.92) | (−0.33, 0.20) | |||||||||
| 3~4 | 7 | 0.25 | 60.6% | 0.04 | 9 | −0.02 | 27.7% | 0.00 | ||
| (0.03, 0.48) | (−0.07, 0.04) | 0.01 | ||||||||
| ≥5 | 27 | 0.18 | 60.8% | 0.11 | 28 | 0.04 | 72.7% | 0.00 | ||
| (−0.01, 0.37) | (0.00, 0.09) | |||||||||
| Weight (kg) | WAZ | WHZ | |||||||||||||
|---|---|---|---|---|---|---|---|---|---|---|---|---|---|---|---|
| n | MD (95%CI) | I2 | τ2 | P-interaction 1 | n | MD (95%CI) | I2 | τ2 | P-interaction 1 | n | MD (95%CI) | I2 | τ2 | P-interaction 1 | |
| Overall | 39 | 0.14 | 84.7% | 0.03 | 36 | 0.04 | 67.0% | 0.00 | 29 | 0.02 | 56.1% | 0.01 | |||
| (0.07, 0.21) | (0.001, 0.087) | (−0.03, 0.06) | |||||||||||||
| Child age at intervention | |||||||||||||||
| 0–<2 years | 33 | 0.12 | 86.1% | 0.03 | 0.26 | 31 | 0.05 | 70.7% | 0.01 | 0.80 | 25 | 0.03 | 54.1% | 0.01 | 0.17 |
| (0.05, 0.20) | (−0.00, 0.09) | (−0.02, 0.07) | |||||||||||||
| 2–5 years | 6 | 0.31 | 61.5% | 0.06 | 5 | 0.03 | 0.0% | 0.00 | 4 | −0.08 | 68.2% | 0.02 | |||
| (0.03, 0.59) | (−0.05, 0.11) | (−0.26, 0.11) | |||||||||||||
| World region | |||||||||||||||
| Africa | 5 | 0.03 | 54.9% | 0.01 | 0.50 | 5 | −0.03 | 74.3% | 0.01 | 0.66 | 3 | 0.01 | 0.0% | 0.00 | 0.87 |
| (−0.09, 0.16) | (−0.14, 0.07) | (−0.07, 0.08) | |||||||||||||
| Asia | 18 | 0.21 | 92.6% | 0.05 | 13 | 0.06 | 55.9% | 0.01 | 12 | 0.03 | 54.5% | 0.01 | |||
| (0.09, 0.32) | (−0.00, 0.12) | (−0.03, 0.09) | |||||||||||||
| Western | 6 | 0.23 | 0.0% | 0.00 | 6 | 0.06 | 50.1% | 0.01 | 4 | 0.03 | 53.7% | 0.02 | |||
| (0.03, 0.44) | (−0.08, 0.19) | (−0.16, 0.22) | |||||||||||||
| Americas | 10 | 0.05 | 0.0% | 0.00 | 12 | 0.07 | 73.7% | 0.02 | 10 | 0.01 | 14.5% | 0.00 | |||
| (−0.01, 0.12) | (−0.04, 0.18) | (−0.07, 0.08) | |||||||||||||
| Rural/urban residence | |||||||||||||||
| Rural | 15 | 0.04 | 40.2% | 0.00 | 0.16 | 14 | 0.02 | 55.5% | 0.01 | 0.44 | 13 | 0.03 | 42.1% | 0.01 | 0.80 |
| (−0.02, 0.10) | (−0.04, 0.09) | (−0.04, 0.09) | |||||||||||||
| Urban | 20 | 0.28 | 91.4% | 0.13 | 17 | 0.09 | 78.4% | 0.01 | 12 | −0.01 | 67.1% | 0.01 | |||
| (0.1 0–0.46) | (0.02, 0.17) | (−0.09, 0.07) | |||||||||||||
| Both | 2 | 0.05 | 46.0% | 0.01 | 2 | −0.02 | 45.9% | 0.00 | 1 | 0.01 | NA | 0.00 | |||
| (−0.09, 0.18) | (−0.13, 0.08) | (−0.11, 0.13) | |||||||||||||
| Unknown | 2 | 0.02 | 0.0% | 0.00 | 3 | 0.02 | 0.0% | 0.00 | 3 | 0.05 | 0.0% | 0.00 | |||
| (−0.02, 0.06) | (−0.05, 0.08) | (−0.01, 0.11) | |||||||||||||
| Socioeconomic status | |||||||||||||||
| Lower | 30 | 0.14 | 87.6% | 0.03 | 0.94 | 29 | 0.05 | 68.7% | 0.01 | 0.91 | 23 | 0.03 | 26.5% | 0.00 | 0.13 |
| (0.06, 0.22) | (0.00, 0.10) | (−0.00, 0.07) | |||||||||||||
| Medium | 5 | 0.13 | 60.0% | 0.02 | 4 | 0.02 | 0.0% | 0.00 | 4 | −0.04 | 65.4% | 0.03 | |||
| (−0.04, 0.31) | (−0.05, 0.10) | (−0.26, 0.18) | |||||||||||||
| Higher | 3 | 0.13 | 0.0% | 0.00 | 2 | 0.04 | 70.9% | 0.02 | 1 | −0.1 | NA | 0.00 | |||
| (−0.19, 0.45) | (−0.20, 0.28) | (−0.15, −0.05) | |||||||||||||
| Unknown | 1 | 0.22 | . | 0.00 | 1 | −0.10 | 67.0% | 0.01 | 1 | −0.1 | NA | 0.00 | |||
| (−0.26, 0.71) | (−0.62, 0.42) | (−0.15, −0.05) | |||||||||||||
| Intervention Duration | |||||||||||||||
| <26 weeks | 12 | 0.30 | 94.7% | 0.09 | 0.08 | 8 | 0.07 | 74.8% | 0.02 | 0.78 | 8 | 0.06 | 0.0% | 0.00 | 0.10 |
| (0.10, 0.50) | (−0.06, 0.20) | (0.02, 0.11) | |||||||||||||
| ≥26 weeks | 27 | 0.06 | 36.9% | 0.00 | 28 | 0.04 | 65.4% | 0.01 | 21 | 0 | 61.6% | 0.01 | |||
| (0.01, 0.11) | (−0.01, 0.09) | (−0.06, 0.05) | |||||||||||||
| Intervention dose | |||||||||||||||
| <8.4 mg/day | 18 | 0.25 | 91.3% | 0.15 | 0.15 | 15 | 0.05 | 78.5% | 0.02 | 0.97 | 12 | −0.04 | 38.3% | 0.00 | 0.03 |
| (0.05, 0.45) | (−0.04, 0.14) | (−0.10, 0.03) | |||||||||||||
| ≥8.4 mg/day | 21 | 0.04 | 35.2% | 0.00 | 21 | 0.04 | 43.6% | 0.00 | 17 | 0.05 | 32.6% | 0.00 | |||
| (0.00, 0.08) | (−0.00, 0.08) | (0.01, 0.09) | |||||||||||||
| Zinc formulation | |||||||||||||||
| Acetate | 2 | 0.13 | 17.7% | 0.00 | 0.45 | 4 | 0.25 | 83.9% | 0.15 | 0.19 | 3 | 0.07 | 0.0% | 0.00 | 0.96 |
| (−0.01, 0.27) | (−0.16, 0.67) | (−0.08, 0.22) | |||||||||||||
| (−0.21, 0.13) | |||||||||||||||
| Gluconate | 6 | −0.01 | 57.6% | 0.00 | 5 | −0.03 | 72.4% | 0.01 | 3 | −0.03 | 77.8% | 0.02 | |||
| (−0.08, 0.07) | (−0.14, 0.09) | (−0.20, 0.15) | |||||||||||||
| Methionine | 1 | 0.20 | NA | 0.00 | 1 | 0.12 | NA | 0.00 | 1 | 0.07 | NA | 0.00 | |||
| (−0.26, 0.65) | (−0.12, 0.36) | (−0.15, 0.28) | |||||||||||||
| Sulfate | 25 | 0.23 | 88.7% | 0.01 | 23 | 0.05 | 61.8% | 0.01 | 20 | 0.02 | 61.0% | 0.01 | |||
| (0.11, 0.34) | (0.00, 0.10) | (−0.04, 0.07) | |||||||||||||
| Unknown | 5 | −0.10 | 0.0% | 0.00 | 3 | −0.07 | 0.0% | 0.00 | 2 | 0 | 0.0% | 0.00 | |||
| (−0.30, 0.10) | (−0.16, 0.03) | (−0.13, 0.13) | |||||||||||||
| Background iron supplementation | |||||||||||||||
| No | 29 | 0.18 | 88.2% | 0.05 | 0.33 | 24 | 0.06 | 73.8% | 0.01 | 0.51 | 18 | −0.01 | 56.4% | 0.01 | 0.11 |
| (0.08, 0.29) | (0.00, 0.11) | (−0.07, 0.04) | |||||||||||||
| Yes | 10 | 0.03 | 1.3% | 0.00 | 12 | 0.02 | 38.5% | 0.00 | 11 | 0.06 | 34.3% | 0.00 | |||
| (−0.00, 0.07) | (−0.04, 0.08) | (−0.00, 0.12) | |||||||||||||
| Publication year | |||||||||||||||
| Before 2000 | 12 | 0.28 | 92.7% | 0.93 | 0.16 | 10 | 0.19 | 73.0% | 0.04 | 0.03 | 6 | 0 | 28.9% | 0.01 | 0.72 |
| (−0.14, 0.69) | (0.04, 0.33) | (−0.12, 0.11) | |||||||||||||
| 2000 and after | 27 | 0.05 | 41.4% | 0.41 | 26 | 0.01 | 57.8% | 0.00 | 23 | 0.02 | 61.2% | 0.01 | |||
| (0.01, 0.09) | (−0.03, 0.05) | (−0.03, 0.07) | |||||||||||||
| Quality score 2 | |||||||||||||||
| ≤2 | 7 | 0.48 | 96.9% | 0.58 | 0.04 | 3 | −0.14 | 16.8% | 0.00 | 0.07 | 3 | −0.03 | 79.9% | 0.04 | 1.00 |
| (−0.12, 1.07) | (−0.26, −0.03) | (−0.29, 0.23) | |||||||||||||
| 3~4 | 6 | 0.04 | 0.0% | 0.00 | 6 | −0.01 | 49.7% | 0.00 | 7 | 0.03 | 0.0% | 0.00 | |||
| (−0.00, 0.07) | (−0.10, 0.07) | (−0.02, 0.08) | |||||||||||||
| ≥5 | 25 | 0.06 | 42.8% | 0.01 | 27 | 0.08 | 68.5% | 0.01 | 19 | 0.02 | 62.0% | 0.01 | |||
| (0.01, 0.12) | (0.03, 0.13) | (−0.04, 0.07) | |||||||||||||
© 2018 by the authors. Licensee MDPI, Basel, Switzerland. This article is an open access article distributed under the terms and conditions of the Creative Commons Attribution (CC BY) license (http://creativecommons.org/licenses/by/4.0/).
Share and Cite
Liu, E.; Pimpin, L.; Shulkin, M.; Kranz, S.; Duggan, C.P.; Mozaffarian, D.; Fawzi, W.W. Effect of Zinc Supplementation on Growth Outcomes in Children under 5 Years of Age. Nutrients 2018, 10, 377. https://doi.org/10.3390/nu10030377
Liu E, Pimpin L, Shulkin M, Kranz S, Duggan CP, Mozaffarian D, Fawzi WW. Effect of Zinc Supplementation on Growth Outcomes in Children under 5 Years of Age. Nutrients. 2018; 10(3):377. https://doi.org/10.3390/nu10030377
Chicago/Turabian StyleLiu, Enju, Laura Pimpin, Masha Shulkin, Sarah Kranz, Christopher P. Duggan, Dariush Mozaffarian, and Wafaie W. Fawzi. 2018. "Effect of Zinc Supplementation on Growth Outcomes in Children under 5 Years of Age" Nutrients 10, no. 3: 377. https://doi.org/10.3390/nu10030377
APA StyleLiu, E., Pimpin, L., Shulkin, M., Kranz, S., Duggan, C. P., Mozaffarian, D., & Fawzi, W. W. (2018). Effect of Zinc Supplementation on Growth Outcomes in Children under 5 Years of Age. Nutrients, 10(3), 377. https://doi.org/10.3390/nu10030377