Fruit and Vegetable Consumption and Their Polyphenol Content Are Inversely Associated with Sleep Duration: Prospective Associations from the UK Women’s Cohort Study


Abstract
1. Introduction
2. Materials and Methods
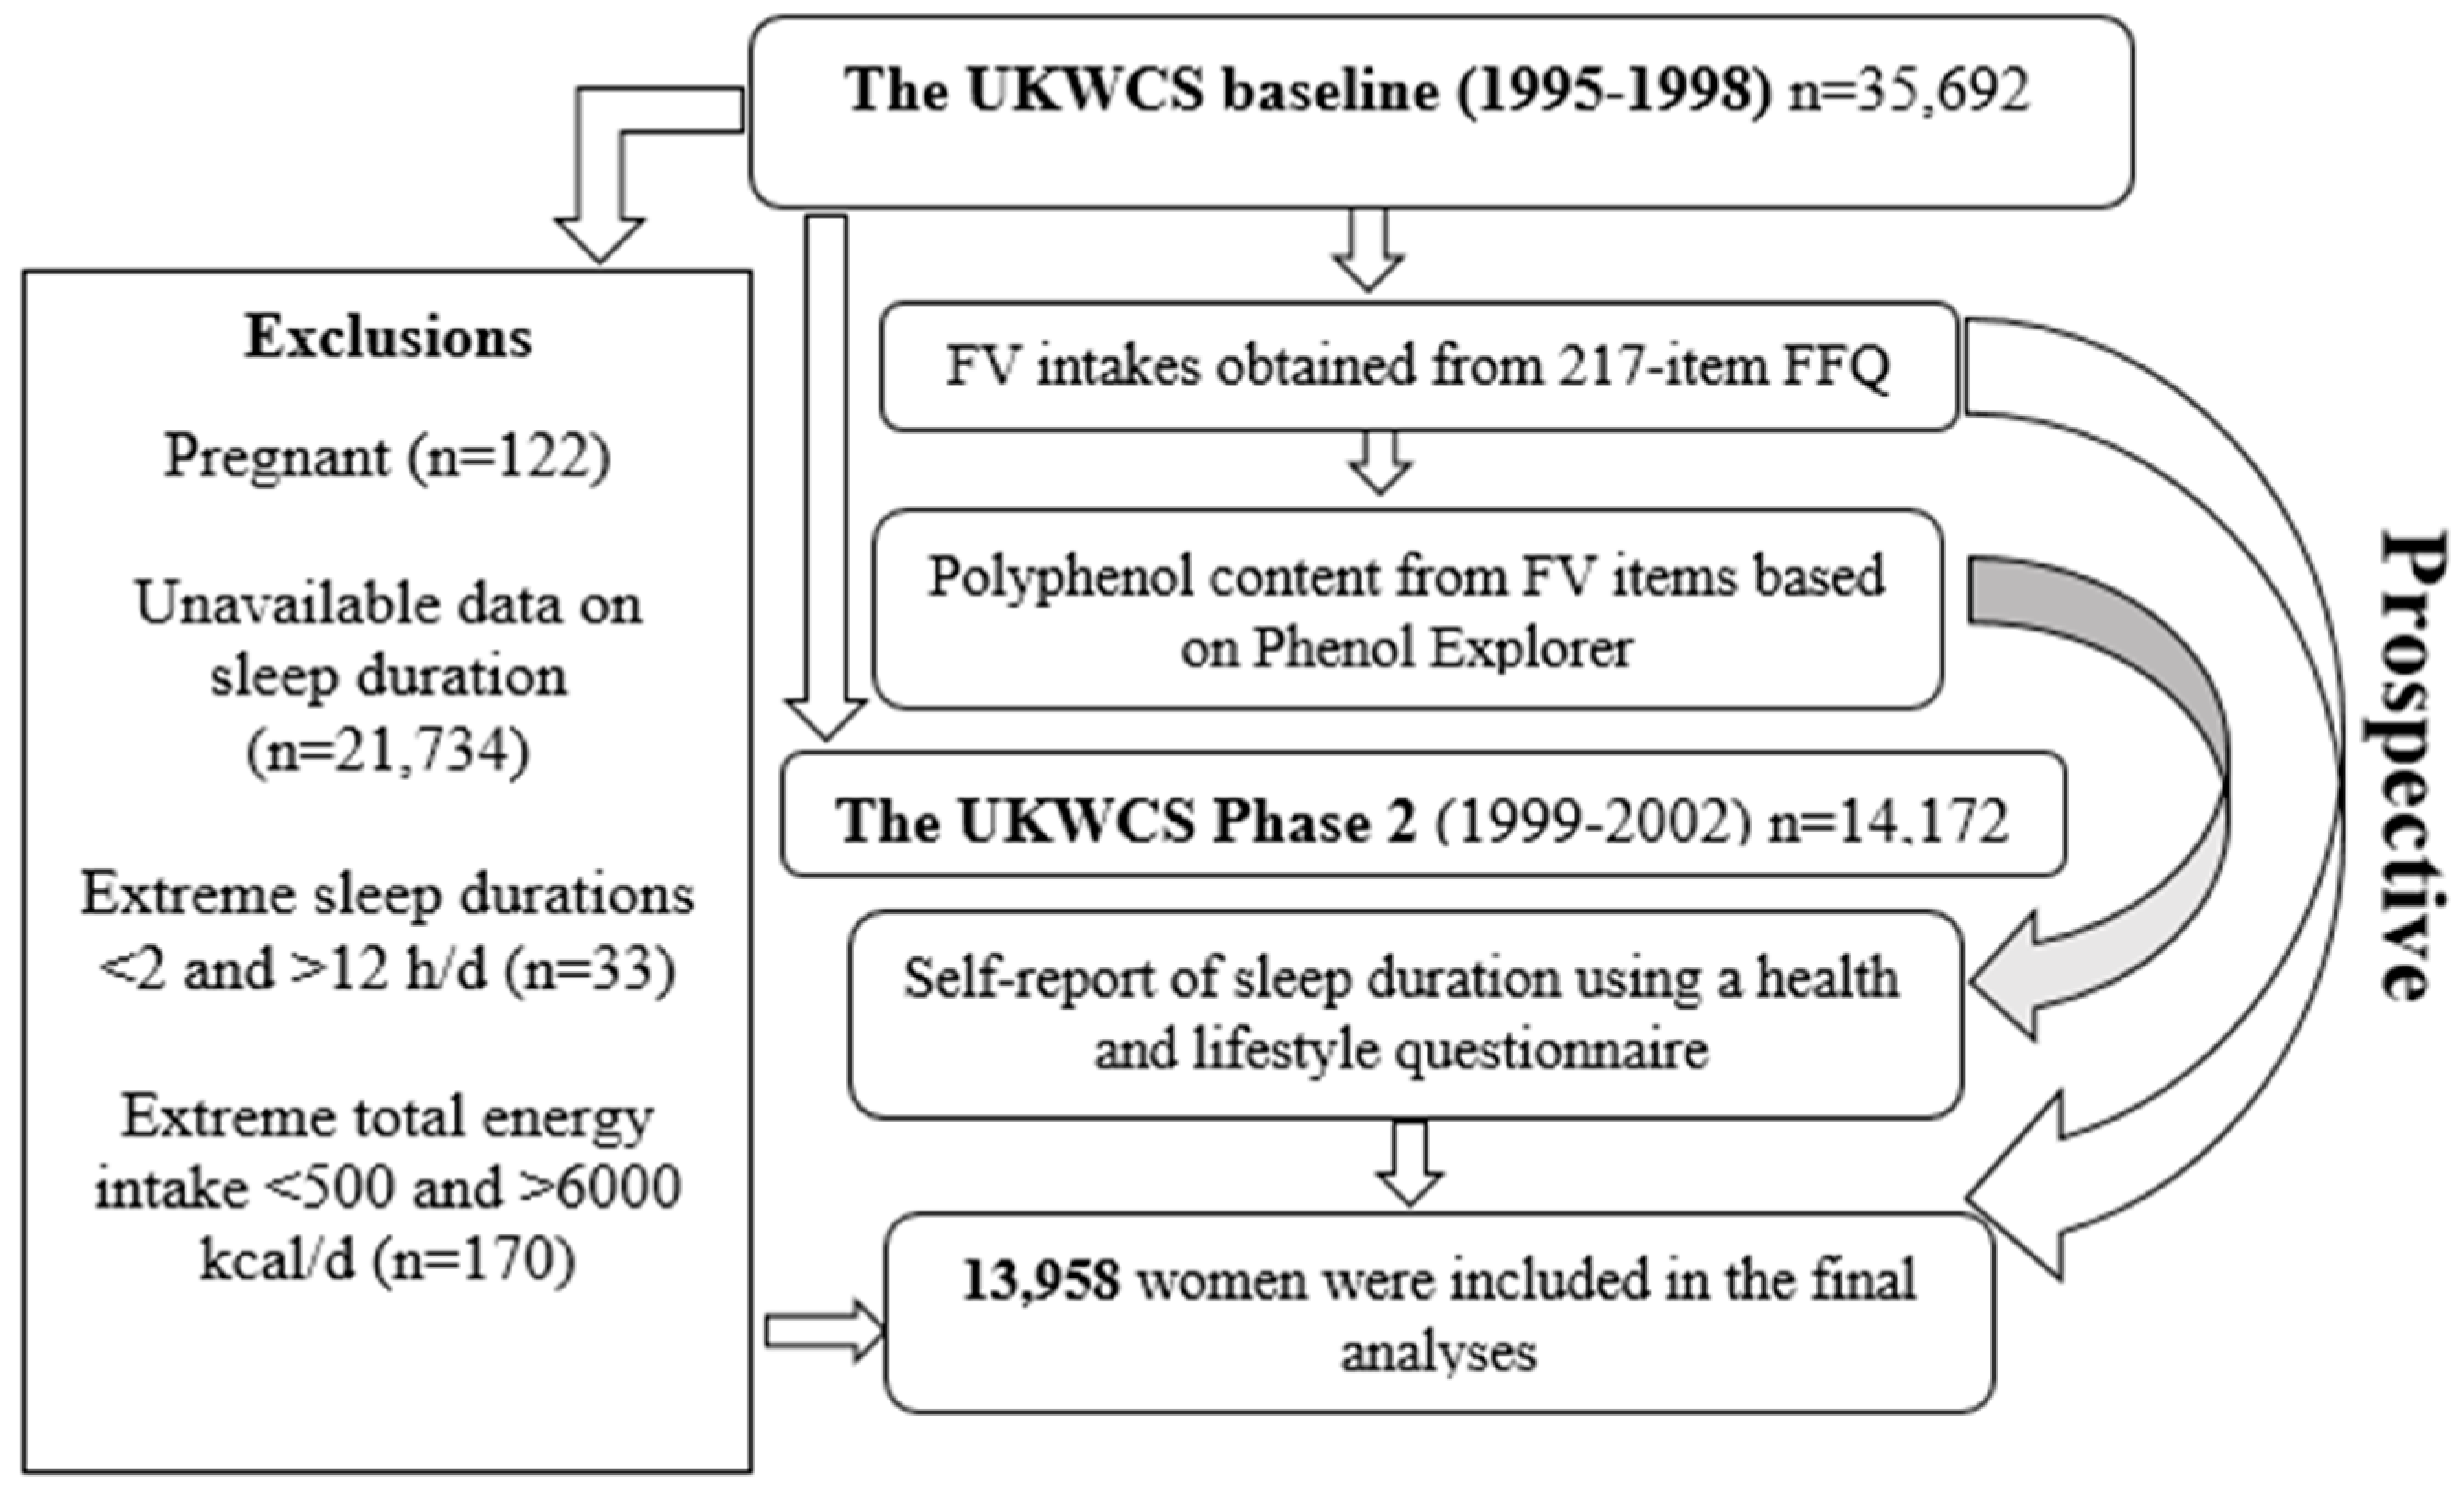
2.1. Participants
2.2. Baseline Characteristics
2.3. Fruit and Vegetable Intakes
2.4. Estimation of Polyphenol Intake from Fruits and Vegetables
2.5. Sleep Duration
- “On an average weekday, how is your day spent?”
- “On an average weekend, how is your day spent?”
2.6. Statistical Analyses
3. Results
3.1. Socio-Demographic Characteristics
3.2. Prospective Associations between Individual FV Items and Sleep Duration
3.3. Prospective Associations between Total Polyphenol Content from FV and Sleep Duration
3.4. Prospective Associations between Polyphenol Classes from FV and Sleep Duration
3.5. Sensitivity Analyses
4. Discussion
Strengths and Limitations
5. Conclusions
Supplementary Materials
Author Contributions
Funding
Acknowledgments
Conflicts of Interest
Appendix A

| Flavonoids |
| Anthocyanins |
| Chalcones |
| Dihydrochalcones |
| Dihydroflavonols |
| Flavanols |
| Flavanones |
| Flavones |
| Flavonols |
| Isoflavonoids |
| Phenolic acids |
| Hydroxybenzoic acids |
| Hydroxycinnamic acids |
| Hydroxyphenylacetic acids |
| Hydroxyphenylpropanoic acids |
| Hydroxyphenylpentanoic acids |
| Stilbenes |
| Stilbenes |
| Lignans |
| Lignans |
| Other polyphenols |
| Alkylmethoxyphenols |
| Alkylphenols |
| Curcuminoids |
| Furanocoumarins |
| Hydroxybenzaldehydes |
| Hydroxybenzoketones Hydroxycinnamaldehydes |
| Hydroxycoumarins |
| Hydroxyphenylpropenes |
| Methoxyphenols |
| Naphtoquinones |
| Phenolic terpenes |
| Tyrosols |
| Other polyphenols |
| Sleep Duration (minutes/day) | ||||||
|---|---|---|---|---|---|---|
| Body Mass Index < 25 kg/m2 (n = 9017) | Body Mass Index ≥ 25 kg/m2 (n = 4908) | |||||
| Polyphenol Class | Coefficient per Additional Gram (99% CI) * | p Value | n | Coefficient per Additional Gram (99% CI) * | p Value | n |
| Total flavonoids | −32 (−70, 4) | 0.02 | 8336 | −23 (−82, 35) | 0.2 | 4480 |
| Total phenolic acids | 30 (−430, 92) | 0.1 | 8336 | 6 (−91, 104) | 0.8 | 4480 |
| Total other polyphenols | −88 (−264, 86) | 0.1 | 8336 | −294 (−681, 93) | 0.05 | 4480 |
| Total stilbenes | −1619 (−8596, 5357) | 0.5 | 8336 | 1435 (−9291, 12,162) | 0.7 | 4480 |
| Total lignans | −21 (−56, 13) | 0.1 | 8336 | 0.3 (−54, 55) | 0.9 | 4480 |
| Total polyphenols ** | −20 (−36, −4) | 0.001 | 8433 | −12 (−38, 12) | 0.1 | 4538 |
| Sleep Duration (minutes/day) | ||||||
|---|---|---|---|---|---|---|
| Vegan or Vegetarian (n = 4469) | Non-Vegan or Non-Vegetarian (n = 9455) | |||||
| Polyphenol Class | Coefficient per Additional Gram (99% CI) * | p Value | n | Coefficient per Additional Gram (99% CI) * | p Value | n |
| Total flavonoids | 9 (−43, 62) | 0.6 | 4148 | −52 (−92, −13) | 0.001 | 8668 |
| Total phenolic acids | −6 (−96, 84) | 0.8 | 4148 | 34 (−30, 99) | 0.1 | 8668 |
| Total other polyphenols | −94 (−315, 125) | 0.2 | 4148 | −138 (−389, 112) | 0.1 | 8668 |
| Total stilbenes | −4589 (−14,484, 5305) | 0.2 | 4148 | 2380 (−4955, 9717) | 0.4 | 8668 |
| Total lignans | −22 (−69, 24) | 0.2 | 4148 | −4 (−43, 33) | 0.7 | 8668 |
| Total polyphenols ** | −14 (−35, 7) | 0.08 | 4200 | −18 (−35, −1) | 0.006 | 8771 |
| Sleep Duration (minutes/day) | ||||||
|---|---|---|---|---|---|---|
| Weekdays | Weekends | |||||
| Polyphenol Class | Coefficient per Additional Gram (99% CI) * | p Value | n | Coefficient per Additional Gram (99% CI) * | p Value | n |
| Total flavonoids | −28 (−58, 1) | 0.02 | 12,769 | −23 (−56, 9) | 0.07 | 12,605 |
| Total phenolic acids | 43 (−6, 93) | 0.02 | 12,769 | −4 (−59, 50) | 0.8 | 12,605 |
| Total other polyphenols | −90 (−247, 66) | 0.1 | 12,769 | −61 (−230, 107) | 0.3 | 12,605 |
| Total stilbenes | −581 (−6164, 5001) | 0.7 | 12,769 | −3688 (−9789, 2412) | 0.1 | 12,605 |
| Total lignans | −19 (−47, 8) | 0.07 | 12,769 | −23 (−54, 6) | 0.04 | 12,605 |
| Total polyphenols ** | −14 (−27, −1) | 0.004 | 12,922 | −25 (−39, −11) | <0.001 | 12,755 |
| Sleep Duration (minutes/day) | |||||||||
|---|---|---|---|---|---|---|---|---|---|
| More Than Once a Week | Once a Week or Less | Never | |||||||
| Polyphenol Class | Coefficient per Additional Gram (99% CI) * | p Value | n | Coefficient per Additional 80 g/day (99% CI) * | p Value | n | Coefficient per Additional Gram (99% CI) * | p Value | n |
| Total flavonoids | −44 (−89, −0.7) | 0.009 | 6633 | −8 (−59, 42) | 0.6 | 4662 | −27 (−133, 78) | 0.5 | 1271 |
| Total phenolic acids | 23 (−49, 96) | 0.4 | 6633 | 43 (−44, 132) | 0.2 | 4662 | −110 (−274, 53) | 0.08 | 1271 |
| Total other polyphenols | −152 (−357, 53) | 0.05 | 6633 | −287 (−648, 73) | 0.04 | 4662 | 140 (−302, 582) | 0.4 | 1271 |
| Total stilbenes | 5000 (−3428, 13,428) | 0.1 | 6633 | −7235 (−16,632, 2161) | 0.04 | 4662 | 4286 (−13,504, 22,076) | 0.5 | 1271 |
| Total lignans | 4 (−40, 49) | 0.7 | 6633 | −33 (−79, 13) | 0.06 | 4662 | −26 (−111, 59) | 0.4 | 1271 |
| Total polyphenols ** | −11 (−31, 8) | 0.1 | 6677 | −23 (−45, −2) | 0.005 | 4712 | −29 (−67, 9) | 0.05 | 1327 |
| Sleep Duration (minutes/day) | |||||||||
|---|---|---|---|---|---|---|---|---|---|
| Excluding Supplement Users (n = 7634) | Excluding Those with Long-Term Illness (n = 3673) | Excluding Those Who Reported Medication Use (n = 4165) | |||||||
| Polyphenol Class | Coefficient per Additional Gram (99% CI) * | p Value | n | Coefficient per Additional Gram (99% CI) * | p Value | n | Coefficient per Additional Gram (99% CI)* | p Value | n |
| Total flavonoids | −36 (−83, 11) | 0.05 | 5786 | −27 (−62, 8) | 0.05 | 9584 | −18 (−54, 17) | 0.1 | 8969 |
| Total phenolic acids | 56 (−23, 136) | 0.07 | 5786 | 41 (−20, 103) | 0.08 | 9473 | 37 (−23, 97) | 0.1 | 8969 |
| Total other polyphenols | −214 (−449, 20) | 0.02 | 5786 | −141 (−324, 42) | 0.04 | 9473 | −239 (−421, −56) | 0.001 | 8969 |
| Total stilbenes | 662 (−7887, 9211) | 0.8 | 5786 | −3358 (−9941, 3223) | 0.1 | 9473 | −1080 (−7762, 5600) | 0.6 | 8969 |
| Total lignans | −14 (−59, 31) | 0.4 | 5786 | −18 (−52, 14) | 0.1 | 9473 | −9 (−43, 25) | 0.4 | 8969 |
| Total polyphenols ** | −15 (−36, 4) | 0.04 | 5845 | −18 (−34, −3) | 0.001 | 9593 | −11 (−27, 3) | 0.04 | 9058 |
| Sleep Duration (minutes/day) | |||
|---|---|---|---|
| Adjusted * (Including BMI and Physical Activity) | |||
| Polyphenol Class | Coefficient per Additional Gram (99% CI) | p Value | n |
| Total flavonoids | −22 (−60, 15) | 0.1 | 7360 |
| Total phenolic acids | 27 (−40, 94) | 0.2 | 7360 |
| Total other polyphenols | −40 (−248, 166) | 0.6 | 7360 |
| Total stilbenes | −1053 (−8105, 5999) | 0.7 | 7360 |
| Total lignans | −13 (−47, 21) | 0.3 | 7360 |
| Total polyphenols ** | −11 (−27, 4) | 0.06 | 7424 |
References
- Stranges, S.; Dorn, J.M.; Cappuccio, F.P.; Donahue, R.P.; Rafalson, L.B.; Hovey, K.M.; Freudenheim, J.L.; Kandala, N.B.; Miller, M.A.; Trevisan, M. A population-based study of reduced sleep duration and hypertension: The strongest association may be in premenopausal women. J. Hypertens. 2010, 28, 896–902. [Google Scholar] [CrossRef] [PubMed]
- Chaput, J.P.; Després, J.P.; Bouchard, C.; Tremblay, A. Association of sleep duration with type 2 diabetes and impaired glucose tolerance. Diabetologia 2007, 50, 2298–2304. [Google Scholar] [CrossRef] [PubMed]
- Cappuccio, F.P.; Cooper, D.; D’Elia, L.; Strazzullo, P.; Miller, M.A. Sleep duration predicts cardiovascular outcomes: A systematic review and meta-analysis of prospective studies. Eur. Heart J. 2011, 32, 1484–1492. [Google Scholar] [CrossRef] [PubMed]
- Cappuccio, F.P.; D’Elia, L.; Strazzullo, P.; Miller, M.A. Sleep duration and all-cause mortality: A systematic review and meta-analysis of prospective studies. Sleep 2010, 33, 585–592. [Google Scholar] [CrossRef] [PubMed]
- Yin, J.; Jin, X.; Shan, Z.; Li, S.; Huang, H.; Li, P.; Peng, Z.; Yu, K.; Bao, W.; Yang, W.; et al. Relationship of sleep duration with all-cause mortality and cardiovascular events: A systematic review and dose-response meta-analysis of prospective cohort studies. J. Am. Heart Assoc. 2017, 6, e005947. [Google Scholar] [CrossRef] [PubMed]
- St-Onge, M.P. Sleep–obesity relation: Underlying mechanisms and consequences for treatment. Obes. Rev. 2017. [Google Scholar] [CrossRef] [PubMed]
- Wu, Y.; Zhai, L.; Zhang, D. Sleep duration and obesity among adults: A meta-analysis of prospective studies. Sleep Med. 2014, 15, 1456–1462. [Google Scholar] [CrossRef] [PubMed]
- Aune, D.; Giovannucci, E.; Boffetta, P.; Fadnes, L.T.; Keum, N.; Norat, T.; Greenwood, D.C.; Riboli, E.; Vatten, L.J.; Tonstad, S. Fruit and vegetable intake and the risk of cardiovascular disease, total cancer and all-cause mortality—A systematic review and dose-response meta-analysis of prospective studies. Int. J. Epidemiol. 2017, 46, 1029–1056. [Google Scholar] [CrossRef] [PubMed]
- Noorwali, E.A.; Cade, J.E.; Burley, V.J.; Hardie, L.J. The relationship between sleep duration and fruit/vegetable intakes in UK adults: A cross-sectional study from the National Diet and Nutrition Survey. BMJ Open 2018, 8, e020810. [Google Scholar] [CrossRef] [PubMed]
- Peuhkuri, K.; Sihvola, N.; Korpela, R. Diet promotes sleep duration and quality. Nutr. Res. 2012, 32, 309–319. [Google Scholar] [CrossRef] [PubMed]
- Frank, S.; Gonzalez, K.; Lee-Ang, L.; Young, M.C.; Tamez, M.; Mattei, J. Diet and sleep physiology: Public health and clinical implications. Front. Neurol. 2017, 8, 393. [Google Scholar] [CrossRef] [PubMed]
- St-Onge, M.P.; Crawford, A.; Aggarwal, B. Plant-based diets: Reducing cardiovascular risk by improving sleep quality? Curr. Sleep Med. Rep. 2018, 4, 74–78. [Google Scholar] [CrossRef] [PubMed]
- Pifferi, F.; Dal-Pan, A.; Menaker, M.; Aujard, F. Resveratrol dietary supplementation shortens the free-running circadian period and decreases body temperature in a prosimian primate. J. Biol. Rhythms 2011, 26, 271–275. [Google Scholar] [CrossRef] [PubMed]
- Pifferi, F.; Rahman, A.; Languille, S.; Auffret, A.; Babiloni, C.; Blin, O.; Lamberty, Y.; Richardson, J.C.; Aujard, F. Effects of dietary resveratrol on the sleep-wake cycle in the non-human primate gray mouse lemur (Microcebus murinus). Chronobiol. Int. 2012, 29, 261–270. [Google Scholar] [CrossRef] [PubMed]
- Lin, H.H.; Tsai, P.S.; Fang, S.C.; Liu, J.F. Effect of kiwifruit consumption on sleep quality in adults with sleep problems. Asia Pac. J. Clin. Nutr. 2011, 20, 169–174. [Google Scholar] [PubMed]
- Pigeon, W.R.; Carr, M.; Gorman, C.; Perlis, M.L. Effects of a tart cherry juice beverage on the sleep of older adults with insomnia: A pilot study. J. Med. Food 2010, 13, 579–583. [Google Scholar] [CrossRef] [PubMed]
- Garrido, M.; Paredes, S.D.; Cubero, J.; Lozano, M.; Toribio-Delgado, A.F.; Muñoz, J.L.; Reiter, R.J.; Barriga, C.; Rodríguez, A.B. Jerte Valley cherry-enriched diets improve nocturnal rest and increase 6-sulfatoxymelatonin and total antioxidant capacity in the urine of middle-aged and elderly humans. J. Gerontol. A Biol. Sci. Med. Sci. 2010, 65, 909–914. [Google Scholar] [CrossRef] [PubMed]
- Cade, J.E.; Burley, V.J.; Alwan, N.A.; Hutchinson, J.; Hancock, N.; Morris, M.A.; Threapleton, D.E.; Greenwood, D.C. Cohort profile: The UK Women’s Cohort Study (UKWCS). Int. J. Epidemiol. 2017, 46, e11. [Google Scholar] [CrossRef] [PubMed]
- The National Statistics Socio-Economic Classification User Manual. Office for National Statistics. 2005. Available online: https://www.ons.gov.uk/ons/guide-method/classifications/archived-standard-classifications/soc-and-sec-archive/the-national-statistics-socio-economic-classification--user-manual.pdf (accessed on 5 February 2018).
- Riboli, E.; Kaaks, R. The EPIC Project: Rationale and study design. European Prospective Investigation into Cancer and Nutrition. Int. J. Epidemiol. 1997, 26, S6–S14. [Google Scholar] [CrossRef] [PubMed]
- Cade, J.E.; Burley, V.J.; Greenwood, D.C. UK Women’s Cohort Study Steering Group. The UK Women’s Cohort Study: Comparison of vegetarians, fish-eaters and meat-eaters. Public Health Nutr. 2004, 7, 871–878. [Google Scholar] [CrossRef] [PubMed]
- Cade, J.E.; Burley, V.J.; Greenwood, D.C. UK Women’s Cohort Study Steering Group Dietary fibre and risk of breast cancer in the UK Women’s Cohort Study. Int. J. Epidemiol. 2007, 36, 431–438. [Google Scholar] [CrossRef] [PubMed]
- Agency, F.S. Food Portion Sizes; The Stationary Office: London, UK, 2002. [Google Scholar]
- Neveu, V.; Perez-Jiménez, J.; Vos, F.; Crespy, V.; du Chaffaut, L.; Mennen, L.; Knox, C.; Eisner, R.; Cruz, J.; Wishart, D.; et al. Phenol-Explorer: An online comprehensive database on polyphenol contents in foods. Database 2010. [Google Scholar] [CrossRef] [PubMed]
- Miranda, A.M.; ASteluti, J.; Fisberg, R.M.; Marchioni, D.M. Dietary intake and food contributors of polyphenolsin adults and elderly adults of Sao Paulo: A population-based study. Br. J. Nutr. 2016, 115, 1061–1070. [Google Scholar] [CrossRef] [PubMed]
- Miranda, A.M.; Steluti, J.; Fisberg, R.M.; Marchioni, D.M. Association between Polyphenol Intake and Hypertension in Adults and Older Adults: A Population-Based Study in Brazil. PLoS ONE 2016, 11, e0165791. [Google Scholar] [CrossRef] [PubMed]
- Lefèvre-Arbogast, S.; Gaudout, D.; Bensalem, J.; Letenneur, L.; Dartigues, J.F.; Hejblum, B.P.; Féart, C.; Delcourt, C.; Samieri, C. Pattern of polyphenol intake and the long-term risk of dementia in older persons. Neurology 2018, 90, e1979–e1988. [Google Scholar] [CrossRef] [PubMed]
- Cleveland, W.S. Robust locally weighted regression and smoothing scatterplots. J. Am. Stat. Assoc. 2012, 74, 829–836. [Google Scholar] [CrossRef]
- Cheynier, V. Polyphenols in foods are more complex than often thought. Am. J. Clin. Nutr. 2005. [Google Scholar] [CrossRef] [PubMed]
- Stata Statistical Software: Release 15; StataCorp LLC: College Station, TX, USA, 2017.
- Romain, C.; Alcaraz, P.E.; Chung, L.H.; Cases, J. Regular consumption of HolisFiit, a polyphenol-rich extract-based food supplement, improves mind and body well-being of overweight and slightly obese volunteers: A randomized, double-blind, parallel trial. Int. J. Food Sci. Nutr. 2017, 68, 840–848. [Google Scholar] [CrossRef] [PubMed]
- Manach, C.; Williamson, G.; Morand, C.; Scalbert, A.; Rémésy, C. Bioavailability and bioefficacy of polyphenols in humans. I. Review of 97 bioavailability studies. Am. J. Clin. Nutr. 2005, 81, S230–S242. [Google Scholar] [CrossRef] [PubMed]
- Martin, K.R.; Appel, C.L. Polyphenols as dietary supplements: A double-edged sword. Nutr. Diet. 2009, 2, 1–12. [Google Scholar] [CrossRef]
- Ribas-Latre, A.; Del Bas, J.M.; Baselga-Escudero, L.; Casanova, E.; Arola-Arnal, A.; Salvadó, M.J.; Arola, L.; Bladé, C. Dietary proanthocyanidins modulate melatonin levels in plasma and the expression pattern of clock genes in the hypothalamus of rats. Mol. Nutr. Food Res. 2015, 59, 865–878. [Google Scholar] [CrossRef] [PubMed]
- Gadacha, W.; Ben-Attia, M.; Bonnefont-Rousselot, D.; Aouani, E.; Ghanem-Boughanmi, N.; Touitou, Y. Resveratrol opposite effects on rat tissue lipoperoxidation: Pro-oxidant during day-time and antioxidant at night. Redox Rep. 2009, 14, 154–158. [Google Scholar] [CrossRef] [PubMed]
- Ribas-Latre, A.; Baselga-Escudero, L.; Casanova, E.; Arola-Arnal, A.; Salvadó, M.J.; Bladé, C.; Arola, L. Dietary proanthocyanidins modulate BMAL1 acetylation, Nampt expression and NAD levels in rat liver. Sci. Rep. 2015, 5, 10954. [Google Scholar] [CrossRef] [PubMed]
- Colwell, C.S. Rhythmic coupling among cells in the suprachiasmatic nucleus. J. Neurobiol. 2000, 43, 379–388. [Google Scholar] [CrossRef]
- Potter, G.D.; Cade, J.E.; Grant, P.J.; Hardie, L.J. Nutrition and the circadian system. Br. J. Nutr. 2016, 116, 434–442. [Google Scholar] [CrossRef] [PubMed]
- Mattson, M.P. Hormesis defined. Ageing Res. Rev. 2008, 7, 1–7. [Google Scholar] [CrossRef] [PubMed]
- Ramis, M.R.; Esteban, S.; Miralles, A.; Tan, D.X.; Reiter, R.J. Caloric restriction, resveratrol and melatonin: Role of SIRT1 and implications for aging and related-diseases. Mech. Ageing Dev. 2015, 146–148, 28–41. [Google Scholar] [CrossRef] [PubMed]
- Lagouge, M.; Argmann, C.; Gerhart-Hines, Z.; Meziane, H.; Lerin, C.; Daussin, F.; Messadeq, N.; Milne, J.; Lambert, P.; Elliott, P.; et al. Resveratrol improves mitochondrial function and protects against metabolic disease by activating SIRT1 and PGC-1α. Cell 2006, 127, 1109–1122. [Google Scholar] [CrossRef] [PubMed]
- Asher, G.; Gatfield, D.; Stratmann, M.; Reinke, H.; Dibner, C.; Kreppel, F.; Mostoslavsky, R.; Alt, F.W.; Schibler, U.; Stratmann, M.; et al. SIRT1 regulates circadian clock gene expression through PER2 deacetylation. Cell 2008, 134, 317–328. [Google Scholar] [CrossRef] [PubMed]
- Orozco-Solis, R.; Ramadori, G.; Coppari, R.; Sassone-Corsi, P. SIRT1 relays nutritional inputs to the circadian clock through the sf1 neurons of the ventromedial hypothalamus. Endocrinology 2015, 156, 2174–2184. [Google Scholar] [CrossRef] [PubMed]
- Mayer, E.A.; Tillisch, K.; Gupta, A. Gut/brain axis and the microbiota. J. Clin. Investig. 2015, 125, 926–938. [Google Scholar] [CrossRef] [PubMed]
- Leone, V.; Gibbons, S.M.; Martinez, K.; Hutchison, A.L.; Huang, E.Y.; Cham, C.M.; Pierre, J.F.; Heneghan, A.F.; Nadimpalli, A.; Hubert, N.; et al. Effects of diurnal variation of gut microbes and high-fat feeding on host circadian clock function and metabolism. Cell Host Microbe 2015, 17, 681–689. [Google Scholar] [CrossRef] [PubMed]
- Liang, X.; Bushman, F.D.; FitzGerald, G.A. Rhythmicity of the intestinal microbiota is regulated by gender and the host circadian clock. Proc. Natl. Acad. Sci. USA 2015, 112, 10479–10484. [Google Scholar] [CrossRef] [PubMed]
- Bladé, C.; Aragonès, G.; Arola-Arnal, A.; Muguerza, B.; Bravo, F.I.; Salvadó, M.J.; Arola, L.; Suárez, M. Proanthocyanidins in health and disease. Biofactors 2016, 42, 5–12. [Google Scholar] [PubMed]
- Selma, M.V.; Espín, J.C.; Tomás-Barberán, F.A. Interaction between phenolics and gut microbiota: Role in human health. J. Agric. Food Chem. 2009, 57, 6485–6501. [Google Scholar] [CrossRef] [PubMed]
- Margalef, M.; Guerrero, L.; Pons, Z.; Bravo, F.I.; Arola, L.; Muguerza, B.; Arola-Arnal, A. A dose–response study of the bioavailability of grape seed proanthocyanidin in rat and lipid-lowering effects of generated metabolites in HepG2 cells. Food Res. Int. 2014, 64, 500–507. [Google Scholar] [CrossRef] [PubMed]
- Wagnerova, A.; Babickova, J.; Liptak, R.; Vlkova, B.; Celec, P.; Gardlik, R. Sex Differences in the Effect of Resveratrol on DSS-Induced Colitis in Mice. Gastroenterol. Res. Pract. 2017, 2017, 8051870. [Google Scholar] [CrossRef] [PubMed]
- Whitton, C.; Nicholson, S.K.; Roberts, C.; Prynne, C.J.; Pot, G.K.; Olson, A.; Fitt, E.; Cole, D.; Teucher, B.; Bates, B.; et al. National diet and nutrition survey: UK food consumption and nutrient intakes from the first year of the rolling programme and comparisons with previous surveys. Br. J. Nutr. 2011, 106, 1899–1914. [Google Scholar] [CrossRef] [PubMed]
- Cade, J.E.; Burley, V.J.; Warm, D.L.; Thompson, R.L.; Margetts, B.M. Food-frequency questionnaires: A review of their design, validation and utilisation. Nutr. Res. Rev. 2004, 17, 5–22. [Google Scholar] [CrossRef] [PubMed]
- Brunner, E.; Stallone, D.; Juneja, M.; Bingham, S.; Marmot, M. Dietary assessment in Whitehall II: Comparison of 7 day diet diary and food-frequency questionnaire and validity against biomarkers. Br. J. Nutr. 2001, 86, 405–414. [Google Scholar] [CrossRef] [PubMed]
- Lauderdale, D.S.; Knutson, K.L.; Yan, L.L.; Liu, K.; Rathouz, P.J. Self-reported and measured sleep duration: How similar are they? Epidemiology 2008, 19, 838–845. [Google Scholar] [CrossRef] [PubMed]
- Pérez-Jiménez, J.; Neveu, V.; Vos, F.; Scalbert, A. Identification of the 100 richest dietary sources of polyphenols: An application of the Phenol-Explorer database. Eur. J. Clin. Nutr. 2010. [Google Scholar] [CrossRef] [PubMed]

| Characteristics | 0–348 | 348–486 | 486–624 | 624–817 | 817–1597 | Total |
|---|---|---|---|---|---|---|
| Number of Women (n) | 2364 | 2710 | 2873 | 2996 | 3015 | 13,958 |
| Mean (95% CI) | Mean (95% CI) | Mean (95% CI) | Mean (95% CI) | Mean (95% CI) | Mean (95% CI) | |
| Age (years) | 51 (50, 51) | 52 (51, 52) | 52 (52, 52) | 52 (52, 52) | 53 (52, 53) | 52 (52, 53) |
| BMI (kg/m2) | 24.4 (24.2, 24.5) | 24.1(24.0, 24.3) | 24.2 (24.0, 24.3) | 24.0 (23.9, 24.2) | 24.1 (23.9, 24.2) | 24.5(24.4, 24.5) |
| Total energy intake (kcal/day) | 2036 (2004, 2069) | 2115 (2092, 2138) | 2272 (2249, 2295) | 2422 (2398, 2446) | 2698 (2672, 2724) | 2307 (2299, 2314) |
| Sleep duration * | 7.5 (7.5, 7.6) | 7.5 (7.5, 7.6) | 7.5 (7.5, 7.5) | 7.5 (7.5, 7.6) | 7.4 (7.4, 7.5) | 7.5 (7.5, 7.6) |
| Weekday sleep duration * | 7.5 (7.4, 7.5) | 7.5 (7.5, 7.5) | 7.5 (7.4, 7.5) | 7.5 (7.4, 7.5) | 7.4 (7.4, 7.4) | 7.5 (7.4, 7.5) |
| Weekend sleep duration * | 7.9 (7.9, 8.0) | 7.9 (7.9, 7.9) | 7.9 (7.8, 7.9) | 7.9 (7.8, 7.9) | 7.7 (7.7, 7.8) | 7.9 (7.8, 7.9) |
| Physical activity (minutes/day) | 27 (24, 29) | 21 (20, 22) | 23 (21, 24) | 23 (22, 24) | 28 (26, 29) | 24 (23, 25) |
| % (95% CI) | % (95% CI) | % (95% CI) | % (95% CI) | % (95% CI) | % (95% CI) | |
| Has longstanding illness (yes) | 25 (23, 27) | 24 (23, 26) | 26 (24, 28) | 27 (25, 28) | 28 (26, 29) | 26 (25, 27) |
| Prescribed medicine (yes) | 31.2 (29, 33) | 32.1 (30, 33) | 30.6 (28, 32) | 31.8 (30, 33) | 31.8 (30, 33) | 31.5 (30, 32) |
| Smoking (yes) | 13 (12, 14) | 9 (8, 10) | 8 (7, 9) | 6 (5, 7) | 6 (5, 7) | 8 (8, 9) |
| Supplement use (yes) | 55 (53, 57) | 56 (54, 57) | 59 (56, 60) | 62 (60, 63) | 67 (65, 69) | 60 (59, 61) |
| Vegetarian or vegan (yes) | 24 (22, 26) | 27 (25, 28) | 30 (28, 31) | 34 (33, 36) | 42 (40, 43) | 32 (31, 32) |
| Ethnicity (white) | 98 (98, 99) | 99 (98, 99) | 99 (98, 99) | 98 (98, 99) | 98 (97, 98) | 98 (98, 99) |
| Employer (employed) | 62 (60, 63) | 60 (58, 62) | 59 (57, 61) | 58 (56, 60) | 56 (54, 57) | 59 (58, 60) |
| SES (professional) | 61 (59, 63) | 63 (61, 65) | 67 (65, 69) | 67 (65, 68) | 70 (68, 71) | 66 (65, 66) |
| Marital status (married) | 73 (71, 75) | 75 (74, 73) | 77 (75, 78) | 77(75, 78) | 77 (75, 78) | 76 (75, 77) |
| Number of children (2 children) | 51 (49, 54) | 52 (50, 54) | 51 (49, 53) | 48 (46, 51) | 49 (47, 51) | 50 (49, 51) |
| Sleep Duration (minutes/day) | ||||||
|---|---|---|---|---|---|---|
| Models | Unadjusted | Adjusted * | ||||
| Fruit | Coefficient per Additional 80 g/day (99% CI) | p Value | n | Coefficient per Additional 80 g/day (99% CI) | p Value | n |
| Apples | −2 (−4, −1) | <0.001 | 13,530 | −2 (−4, −1) | <0.001 | 12,862 |
| Avocados | −8 (−22, 4) | 0.1 | 8468 | −8 (−23, 5) | 0.1 | 8033 |
| Bananas | −0.4 (−2, 1) | 0.5 | 13,092 | −0.6 (−2, 1) | 0.4 | 12,437 |
| Grapes | −1 (−4, 0.5) | 0.05 | 13,312 | −1 (−3, 1) | 0.2 | 12,664 |
| Kiwi | −10 (−19, −2) | 0.001 | 11,709 | −10 (−19, −2) | 0.001 | 11,147 |
| Mangoes | −6 (−16, 4) | 0.1 | 7293 | −6 (−17, 4) | 0.1 | 6930 |
| Oranges, satsumas, grapefruit | −2 (−4, 0.4) | 0.002 | 12,967 | −3 (−5, −0.8) | <0.001 | 12,330 |
| Papaya | −4 (−18, 9) | 0.4 | 3646 | −5 (−20, 9) | 0.3 | 3445 |
| Pears | −0.3 (−3, 2) | 0.7 | 12,177 | −0.1 (−3, 2) | 0.8 | 11,576 |
| Pineapple | −20 (−35, −4) | 0.001 | 11,810 | −17 (−33, −1) | 0.006 | 11,243 |
| Apricots | −44 (−89, 1) | 0.01 | 11,010 | −40 (−88, 6) | 0.02 | 10,456 |
| Melon | −1 (−4, 0.8) | 0.07 | 13,110 | −1 (−4, 1) | 0.2 | 12,478 |
| Nectarines | −3 (−26, 19) | 0.6 | 12,678 | −8 (−32, 14) | 0.3 | 12,062 |
| Peaches | −32 (−71, 6) | 0.03 | 12,945 | −32 (−73, 8) | 0.04 | 12,315 |
| Plums | −29 (−74, 16) | 0.09 | 12,839 | −31 (−77, 15) | 0.08 | 12,217 |
| Raspberries | −4 (−14, 6) | 0.2 | 12,643 | −2 (−13, 7) | 0.4 | 12,040 |
| Redcurrants, blackcurrants | −4 (−12, 2) | 0.09 | 10,426 | −4 (−11, 3) | 0.1 | 9910 |
| Rhubarb | 1 (−2, 4) | 0.3 | 11,359 | 1 (−2, 4) | 0.3 | 10,829 |
| Strawberries | −12 (−31, 6) | 0.09 | 13,321 | −11 (−31, 8) | 0.1 | 12,673 |
| Orange juice-pure fruit per 125 g/day | −1 (−3, 0.5) | 0.06 | 12,224 | −1 (−3, 0.4) | 0.04 | 11,642 |
| 100% pure fruit juice per 125 g/day | −3 (−6, −0.08) | 0.001 | 10,345 | −3 (−6, −0.07) | 0.001 | 9834 |
| Dried fruit per 25 g/day | ||||||
| Dates | −2 (−8, 3) | 0.2 | 9577 | −3 (−9, 3) | 0.1 | 9117 |
| Figs | −0.008 (−3, 3) | 0.9 | 7231 | −0.2 (−3, 3) | 0.8 | 6860 |
| Prunes | −4 (−11, 2) | 0.09 | 9205 | −4 (−11, 2) | 0.1 | 8739 |
| Mixed dried fruit | −0.9 (−6, 4) | 0.6 | 8972 | −0.8 (−6, 4) | 0.6 | 8531 |
| Currants, raisins, sultanas | 0.4 (−6, 7) | 0.8 | 12,605 | 0.8 (−6, 8) | 0.7 | 12,003 |
| Vegetables | ||||||
| Beetroot | −16 (−35, 1) | 0.01 | 11,516 | −12 (−31, 7) | 0.1 | 10,951 |
| Broccoli, spring greens, kale | −2 (−7, 1) | 0.1 | 13,488 | −1 (−6, 3) | 0.5 | 12,822 |
| Brussels | −3 (−9, 2) | 0.1 | 12,783 | −0.6 (−7, 6) | 0.8 | 12,153 |
| Cabbage | −8 (−13, −3) | <0.001 | 13,051 | −6 (−12, −0.4) | 0.006 | 12,425 |
| Carrots | −2 (−7, 2) | 0.1 | 13,713 | −1 (−6, 3) | 0.5 | 13,037 |
| Cauliflower | −0.04 (−0.1, 0.01) | 0.06 | 13,503 | −0.03 (−0.1, 0.03) | 0.2 | 12,842 |
| Celery | −14 (−25, −3) | 0.001 | 12,483 | −12 (−23, −0.5) | 0.007 | 11,865 |
| Coleslaw | −6 (−27, 15) | 0.4 | 10,018 | −4 (−27, 17) | 0.5 | 9546 |
| Courgettes, marrow, squash | −6 (−14, 2) | 0.05 | 11,697 | −7 (−16, 1) | 0.03 | 11,134 |
| Cucumber | −17 (−32, −1) | 0.005 | 12,911 | −15 (−32, 0.8) | 0.01 | 12,293 |
| Green and runner beans | −6 (−11, −1) | 0.001 | 13,344 | −5 (−10, 0.6) | 0.02 | 12,688 |
| Lettuce | −15 (−31, −0.1) | 0.009 | 13,550 | −14 (−30, 2) | 0.02 | 12,885 |
| Aubergine, okra | −25 (−44, −6) | <0.001 | 8258 | −21 (−41, −1) | 0.007 | 7853 |
| Olives | −36 (−69, −3) | 0.005 | 6461 | −37 (−71, −3) | 0.004 | 6129 |
| Parsnips | −0.7 (−12, 10) | 0.8 | 11,704 | 1 (−19, 13)) | 0.6 | 11,137 |
| Peas, mushy peas, mange tout | −5 (−15, 3) | 0.1 | 13,132 | −5 (−15, 4) | 0.1 | 12,510 |
| Peppers | −10 (−20, −1) | 0.004 | 12,371 | −13 (−23, −3) | 0.001 | 11,780 |
| Swedes | −0.07 (−11, 11) | 0.9 | 11,052 | 1 (−10, 13) | 0.7 | 10,512 |
| Tomatoes-raw, canned, sauce | −2 (−5, 0.1) | 0.01 | 13,526 | −2 (−5, 0.1) | 0.01 | 12,872 |
| Turnip | −5 (−20, 9) | 0.3 | 8998 | −5 (−21, 10) | 0.3 | 8568 |
| Mustard, cress, watercress | −21 (−73, 31) | 0.3 | 11,283 | −21 (−75, 32) | 0.3 | 10,736 |
| Boiled/mashed potatoes | 0.3 (−1, 1) | 0.5 | 13,330 | 0.9 (−0.6, 2) | 0.1 | 12,692 |
| Sleep Duration (minutes/day) | ||||||
|---|---|---|---|---|---|---|
| Unadjusted | Adjusted * | |||||
| Polyphenol Class | Coefficient per Additional Gram (99% CI) | p Value | n | Coefficient per Additional Gram (99% CI) | p Value | n |
| Total flavonoids | −30 (−54, −6) | 0.001 | 13,636 | −30 (−61, 1) | 0.01 | 12,816 |
| Total phenolic acids | −22 (−61, 17) | 0.1 | 13,635 | 22 (−30, 74) | 0.2 | 12,816 |
| Total other polyphenols | −180 (−330, −30) | 0.002 | 13,805 | −136 (−299, 27) | 0.03 | 12,816 |
| Total stilbenes | −4011 (−8731, 708) | 0.03 | 13,670 | −538 (−6418, 5341) | 0.08 | 12,816 |
| Total lignans | −28 (−54, −2) | 0.005 | 13,880 | −14 (−43, 15) | 0.2 | 12,816 |
| Total polyphenols from FV ** | −16 (−28, −5) | <0.001 | 13,636 | −18 (−31, −4) | 0.001 | 12,971 |
| Sleep Duration (minutes/day) | ||||||
|---|---|---|---|---|---|---|
| Unadjusted | Adjusted * | |||||
| Polyphenol Classes | Coefficient per Additional mg (99% CI) | p Value | n | Coefficient per Additional mg (99% CI) | p Value | n |
| Flavonoids | ||||||
| Apple | −0.5 (−0.8, −0.2) | <0.001 | 13,530 | −0.5 (−0.8, −0.1) | <0.001 | 12,536 |
| Avocados | −19 (−50, 11) | 0.1 | 8468 | −7 (−41, 26) | 0.5 | 7900 |
| Banana | −0.1 (−0.6, 0.4) | 0.5 | 13,092 | −0.1 (−0.7, 0.4) | 0.5 | 12,115 |
| Grape | −0.3 (−0.8, 0.1) | 0.05 | 13,312 | −0.001 (−0.5, 0.5) | 0.9 | 12,413 |
| Kiwi | −19 (−34, −5) | 0.001 | 11,709 | −15 (−31, 0.8) | 0.02 | 10,939 |
| Mangoes | −4 (−11, 2) | 0.1 | 7293 | −1 (−9, 7) | 0.6 | 6831 |
| Oranges ** | −0.07 (−0.13, 0.01) | 0.002 | 12,967 | −0.08 (−0.1, −0.01) | 0.002 | 12,054 |
| Pears | −0.09 (−0.81, 0.62) | 0.7 | 12,177 | 0.1 (−0.6, 0.9) | 0.5 | 11,352 |
| Apricots | −7 (−14, 0.3) | 0.01 | 11,010 | −4 (−12, 4) | 0.2 | 10,304 |
| Nectarines | −0.3 (−2, 1) | 0.6 | 12,678 | −0.3 (−2, 1) | 0.6 | 11,824 |
| Peaches | −17 (−38, 3) | 0.03 | 12,945 | −13 (−39, 11) | 0.1 | 12,063 |
| Plums | −0.3 (−0.9, 0.2) | 0.09 | 12,839 | −0.3 (−1, 0.2) | 0.1 | 11,981 |
| Raspberries | −0.05 (−0.1, 0.08) | 0.2 | 12,643 | −0.03 (−0.2, 0.1) | 0.6 | 11,815 |
| Redcurrants | −0.1 (−0.3, 0.08) | 0.09 | 10,426 | −0.02 (−0.6, 0.5) | 0.9 | 9784 |
| Rhubarb | 0.4 (−0.81, 1) | 0.3 | 11,359 | 0.9 (−0.4, 2) | 0.09 | 10,620 |
| Strawberries | −0.1 (−0.4, 0.1) | 0.09 | 13,321 | −0.1 (−0.4, 0.2) | 0.4 | 12,433 |
| Orange juice (pure fruit) | −0.02 (−0.06, 0.01) | 0.06 | 12,224 | −0.01 (−0.05, 0.02) | 0.3 | 12,054 |
| Figs | −0.2 (−121, 120) | 0.9 | 7231 | −6 (−141, 127) | 0.8 | 6739 |
| Prunes | −7 (−17, 3) | 0.09 | 9205 | −8 (−21, 4) | 0.08 | 8565 |
| Raisins | 3 (−49, 56) | 0.8 | 12,605 | 6 (−52, 64) | 0.7 | 11,726 |
| Beetroot ** | −42 (−87, 3) | 0.02 | 11,516 | −27 (−77, 22) | 0.1 | 10,681 |
| Broccoli | −0.1 (−0.3, 0.08) | 0.1 | 13,488 | −0.01 (−0.2, 0.2) | 0.8 | 12,490 |
| Brussels ** | −3 (−8, 2) | 0.1 | 12,783 | 0.8 (−5, 7) | 0.7 | 11,846 |
| Cabbage ** | −262 (−431, −93) | <0.001 | 13,051 | −180 (−373, 11) | 0.02 | 12,107 |
| Cucumber ** | −209 (−403, −15) | 0.005 | 12,911 | −165 (−372, 41) | 0.04 | 12,002 |
| Green beans | −1 (−1, −0.2) | 0.001 | 13,344 | −0.4 (−1, 0.4) | 0.1 | 12,363 |
| Lettuce | −4 (−9, −0.03) | 0.009 | 13,550 | −3 (−8, 1) | 0.07 | 12,555 |
| Olives | −0.2 (−0.5, −0.02) | 0.005 | 6461 | 1 (−0.8, 2) | 0.1 | 6049 |
| Parsnips ** | −0.9 (−15, 13) | 0.8 | 11,705 | 4 (−11, 19) | 0.4 | 10,885 |
| Peas | −356 (−939, 226) | 0.1 | 13,132 | −272 (−908, 364) | 0.2 | 12,195 |
| Peppers | −3 (−5, −0.3) | 0.004 | 12,371 | −3 (−6, −0.4) | 0.003 | 11,527 |
| Swedes ** | −0.01 (-2, 2) | 0.9 | 11,052 | 0.4 (−1, 2) | 0.6 | 10,268 |
| Tomatoes | −10 (−22, 0.5) | 0.01 | 13,526 | −8 (−20, 4) | 0.08 | 12,534 |
| Watercress ** | −1 (−6, 2) | 0.3 | 11,283 | −0.6 (−5, 4) | 0.7 | 10,531 |
| Phenolic acids | ||||||
| Bananas | −0.5 (−3, 2) | 0.5 | 13,092 | −0.2 (−3, 2) | 0.8 | 12,115 |
| Grapes (green) | −0.2 (−0.4, 0.06) | 0.05 | 13,312 | −0.008 (−0.3, 0.3) | 0.9 | 12,413 |
| Pears | −0.03 (−0.3, 0.2) | 0.7 | 12,177 | 0.1 (−0.1, 0.4) | 0.3 | 11,352 |
| Apricots | −5 (−11, 0.2) | 0.01 | 11,010 | −2 (−9, 3) | 0.2 | 10,304 |
| Nectarines | −0.4 (−3, 2) | 0.6 | 12,678 | 0.2 (−3, 3) | 0.8 | 11,824 |
| Peaches | −1 (−3, 0.3) | 0.03 | 12,945 | −0.7 (−3, 1) | 0.4 | 12,063 |
| Plums | −0.4 (−1, 0.2) | 0.09 | 12,839 | −0.2 (−0.9, 0.5) | 0.4 | 11,981 |
| Raspberries | −0.04 (−0.1, 0.06) | 0.2 | 12,643 | 0.03 (−0.1, 0.1) | 0.5 | 11,815 |
| Redcurrants | −2 (−5, 1) | 0.09 | 10,426 | −0.2 (−7, 7) | 0.9 | 9784 |
| Strawberries | −1 (−3, 0.6) | 0.09 | 13,321 | −0.1 (−2, 2) | 0.9 | 12,433 |
| Dates | −0.4 (−1, 0.5) | 0.2 | 9577 | −0.3 (−1, 0.7) | 0.4 | 8942 |
| Prunes | −0.09 (−0.2, 0.04) | 0.09 | 9205 | −0.07 (−0.2, 0.07) | 0.2 | 8565 |
| Raisins | 0.1 (−1, 2) | 0.8 | 12,605 | 0.3 (−1, 2) | 0.6 | 11,726 |
| Broccoli | −0.1 (−0.5, 0.1) | 0.1 | 13,488 | 0.05 (−0.3, 0.4) | 0.6 | 12,490 |
| Carrots | −0.1 (−0.4, 0.1) | 0.1 | 13,713 | −0.03 (−0.3, 0.3) | 0.7 | 12,679 |
| Cauliflower | −0.6 (−1, 0.2) | 0.06 | 13,503 | −0.2 (−1, 0.8) | 0.5 | 12,509 |
| Lettuce | −5 (−10, −0.03) | 0.009 | 13,550 | −3 (−9, 2) | 0.1 | 12,555 |
| Aubergine | −21 (−36, −5) | <0.001 | 8258 | −14 (−31, 2) | 0.03 | 7735 |
| Olives | −0.3 (−0.6, −0.02) | 0.005 | 6461 | −0.5 (−3, 2) | 0.6 | 6049 |
| Peppers | −29 (−55, −3) | 0.004 | 12,371 | −31 (−60, −2) | 0.005 | 11,527 |
| Tomatoes | −0.8 (−1, 0.04) | 0.01 | 13,526 | −0.4 (−1, 0.4) | 0.2 | 12,534 |
| Boiled/mashed potatoes | 0.01 (−0.04, 0.07) | 0.5 | 13,330 | 0.04 (−0.02, 0.1) | 0.1 | 12,346 |
| Other polyphenols | ||||||
| Pears | −9 (−78, 60) | 0.7 | 12,177 | 28 (−47, 103) | 0.3 | 11,352 |
| Orange juice (pure fruit) | −0.5 (−1, 0.2) | 0.06 | 12,224 | 1 (−0.02, 2) | 0.01 | 11,418 |
| Celery | −6 (−12, −1) | 0.001 | 12,483 | −4 (−10, 0.8) | 0.02 | 11,623 |
| Olives | −0.1 (−0.3, −0.01) | 0.005 | 6461 | −0.1 (−0.3, 0.02) | 0.03 | 6049 |
| Stilbenes | ||||||
| Grapes | −7 (−17, 2) | 0.05 | 13,312 | −1 (−13, 10) | 0.7 | 12,413 |
| Redcurrants | −3 (−9, 2) | 0.09 | 10,426 | −0.1 (−7, 6) | 0.9 | 9784 |
| Strawberries | −44 (−114, 24) | 0.09 | 13,321 | −15 (−98, 67) | 0.6 | 12,433 |
| Lignans | ||||||
| Oranges ** | −0.2 (−0.4, −0.03) | 0.002 | 12,967 | −0.2 (−0.4, 0.05) | 0.03 | 12,054 |
| Pineapple ** | −0.1 (−0.2, −0.02) | 0.001 | 11,810 | −0.09 (−0.2, 0.004) | 0.01 | 11,027 |
| Melon * | −0.02 (−0.05, 0.009) | 0.07 | 13,110 | −0.005 (−0.04, 0.02) | 0.6 | 12,195 |
| Brussels ** | −0.06 (−0.1, 0.04) | 0.1 | 12,783 | 0.006 (−0.1, 0.1) | 0.9 | 11,846 |
| Cabbage ** | −132 (−218, −47) | <0.001 | 13,051 | −89 (−185, 6.8) | 0.01 | 12,107 |
| Squash ** | −862 (−2011, 287) | 0.05 | 11,697 | −874 (−2124, 375) | 0.07 | 10,914 |
| Cucumber ** | −5 (−10, −0.4) | 0.005 | 12,911 | −4 (−9, 0.9) | 0.03 | 12,002 |
| Parsnips ** | −19 (−303, 264) | 0.8 | 11,705 | 70 (−233, 374) | 0.5 | 10,885 |
| Swedes ** | −19 (−2822, 2783) | 0.9 | 11,052 | 434 (−2671, 3539) | 0.7 | 10,268 |
| Turnip ** | −45 (−173, 83) | 0.3 | 8998 | −57 (−194, 80) | 0.2 | 8381 |
© 2018 by the authors. Licensee MDPI, Basel, Switzerland. This article is an open access article distributed under the terms and conditions of the Creative Commons Attribution (CC BY) license (http://creativecommons.org/licenses/by/4.0/).
Share and Cite
Noorwali, E.; Hardie, L.; Cade, J. Fruit and Vegetable Consumption and Their Polyphenol Content Are Inversely Associated with Sleep Duration: Prospective Associations from the UK Women’s Cohort Study. Nutrients 2018, 10, 1803. https://doi.org/10.3390/nu10111803
Noorwali E, Hardie L, Cade J. Fruit and Vegetable Consumption and Their Polyphenol Content Are Inversely Associated with Sleep Duration: Prospective Associations from the UK Women’s Cohort Study. Nutrients. 2018; 10(11):1803. https://doi.org/10.3390/nu10111803
Chicago/Turabian StyleNoorwali, Essra, Laura Hardie, and Janet Cade. 2018. "Fruit and Vegetable Consumption and Their Polyphenol Content Are Inversely Associated with Sleep Duration: Prospective Associations from the UK Women’s Cohort Study" Nutrients 10, no. 11: 1803. https://doi.org/10.3390/nu10111803
APA StyleNoorwali, E., Hardie, L., & Cade, J. (2018). Fruit and Vegetable Consumption and Their Polyphenol Content Are Inversely Associated with Sleep Duration: Prospective Associations from the UK Women’s Cohort Study. Nutrients, 10(11), 1803. https://doi.org/10.3390/nu10111803