Depressive Symptoms and Vegetarian Diets: Results from the Constances Cohort

 , , ,
, , ,
Abstract
1. Introduction
2. Methods
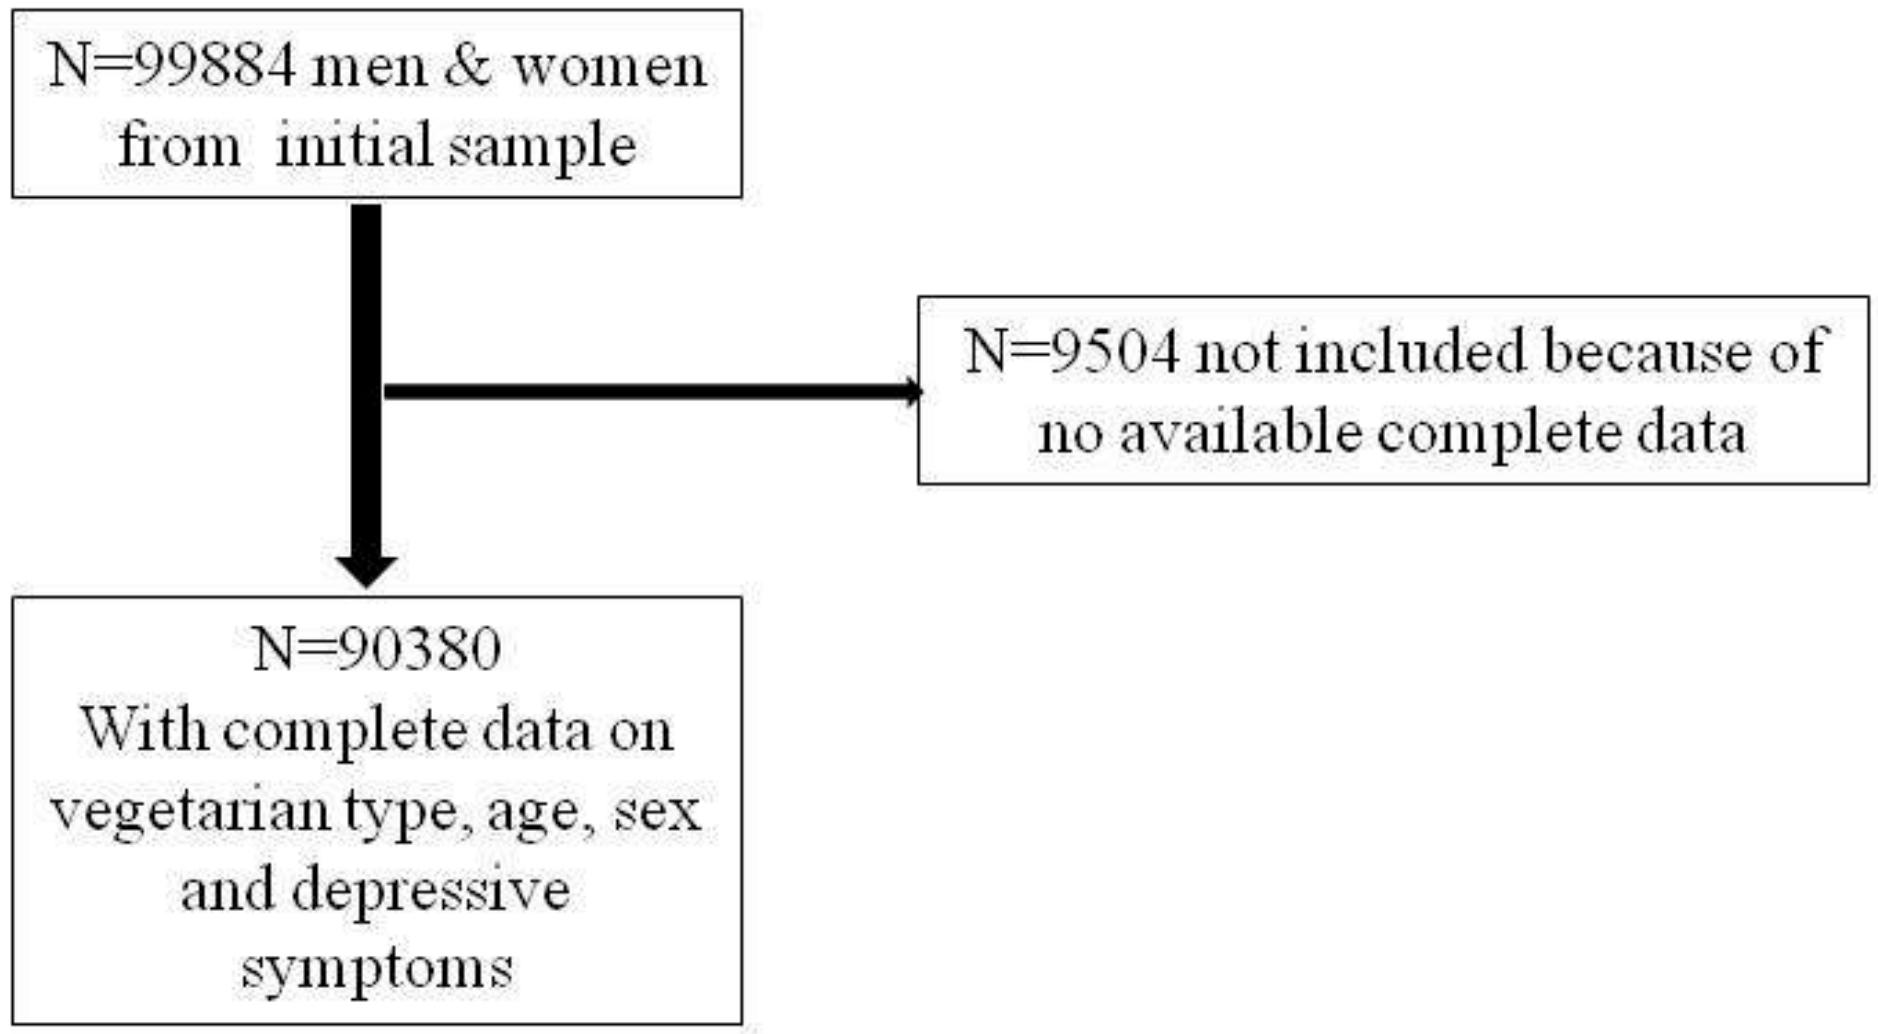
2.1. Population
2.2. Variables
2.2.1. Depressive Symptoms
2.2.2. Diet Type
2.2.3. Cardio-Metabolic Variables
2.2.4. Other Conditions
2.2.5. Physical Activity
2.2.6. Other Variables
2.2.7. Statistical Analyses
3. Results
4. Discussion
4.1. Main Findings
4.2. Strengths and Limitations
4.3. Explanatory Hypotheses
5. Conclusions
Supplementary Materials
Author Contributions
Funding
Acknowledgments
Conflicts of Interest
References
- Le, L.T.; Sabaté, J. Beyond meatless, the health effects of vegan diets: findings from the Adventist cohorts. Nutrients 2014, 6, 2131–2147. [Google Scholar] [CrossRef] [PubMed]
- Van’t Veer, P.; Kampman, E. Food, Nutrition, Physical Activity, and the Prevention of Cancer: A Global Perspective; World Cancer Research Fund/American Institute for Cancer Research: Washington, DC, USA, 2007; Volume 1. [Google Scholar]
- Hibbeln, J.R.; Northstone, K.; Evans, J.; Golding, J. Vegetarian diets and depressive symptoms among men. J. Affect. Disord. 2018, 225, 13–17. [Google Scholar] [CrossRef] [PubMed]
- Larsson, C.L.; Klock, K.S.; Åstrøm, A.N.; Haugejorden, O.; Johansson, G. Lifestyle-related characteristics of young low-meat consumers and omnivores in Sweden and Norway. J. Adolesc. Health 2002, 31, 190–198. [Google Scholar] [CrossRef]
- Goldberg, M.; Carton, M.; Descatha, A.; Leclerc, A.; Roquelaure, Y.; Santin, G.; Zins, M.; CONSTANCES Team. CONSTANCES: A general prospective population-based cohort for occupational and environmental epidemiology: Cohort profile. Occup. Environ. Med. 2016, 74, 66–71. [Google Scholar] [CrossRef] [PubMed]
- Beezhold, B.L.; Johnston, C.S.; Daigle, D.R. Vegetarian diets are associated with healthy mood states: A cross-sectional study in seventh day adventist adults. Nutr. J. 2010, 9. [Google Scholar] [CrossRef] [PubMed]
- Beezhold, B.; Radnitz, C.; Rinne, A.; DiMatteo, J. Vegans report less stress and anxiety than omnivores. Nutr. Neurosci. 2015, 18, 289–296. [Google Scholar] [CrossRef] [PubMed]
- Mathieu, S.; Dorard, G. Végétarisme, végétalisme, véganisme: Aspects motivationnels et psychologiques associés à l’alimentation sélective. La Presse Médicale 2016, 45, 726–733. [Google Scholar] [CrossRef] [PubMed]
- Zins, M.; Goldberg, M. The French CONSTANCES population-based cohort: Design, inclusion and follow-up. Eur. J. Epidemiol. 2015, 30, 1317–1328. [Google Scholar] [CrossRef] [PubMed]
- Morin, A.; Moullec, G.; Maiano, C.; Layet, L.; Just, J.-L.; Ninot, G. Psychometric properties of the Center for Epidemiologic Studies Depression Scale (CES-D) in French clinical and nonclinical adults. Revue D’épidémiologie et de Santé Publique 2011, 59, 327–340. [Google Scholar] [CrossRef] [PubMed]
- Ferrieres, J.; Ruidavets, J.; Perret, B.; Dallongeville, J.; Arveiler, D.; Bingham, A.; Amouyel, P.; Haas, B. Prévalence des dyslipidémies dans un échantillon représentatif de la population française. Archives des Maladies du Coeur et des Vaisseaux 2005, 98, 127–132. [Google Scholar] [PubMed]
- Bilan de Santé et Questionnaires | L’espace Scientifique | Cohorte Constances. Available online: http://www.constances.fr/espace-scientifique/pos.php (accessed on 3 September 2018).
- Ruiz, F.; Goldberg, M.; Lemonnier, S.; Ozguler, A.; Boos, E.; Brigand, A.; Giraud, V.; Perez, T.; Roche, N.; Zins, M. High quality standards for a large-scale prospective population-based observational cohort: Constances. BMC Public Health 2016, 16, 877. [Google Scholar] [CrossRef] [PubMed]
- Michalak, J.; Zhang, X.C.; Jacobi, F. Vegetarian diet and mental disorders: Results from a representative community survey. Int. J. Behav. Nutr. Phys. Act. 2012, 9. [Google Scholar] [CrossRef] [PubMed]
- Juan, W.; Yamini, S.; Britten, P. Food intake patterns of self-identified vegetarians among the US population, 2007–2010. Procedia Food Sci. 2015, 4, 86–93. [Google Scholar] [CrossRef]
- Zuromski, K.L.; Witte, T.K.; Smith, A.R.; Goodwin, N.; Bodell, L.P.; Bartlett, M.; Siegfried, N. Increased prevalence of vegetarianism among women with eating pathology. Eating Behav. 2015, 19, 24–27. [Google Scholar] [CrossRef] [PubMed]
- Egan, S.J.; Wade, T.D.; Shafran, R. Perfectionism as a transdiagnostic process: A clinical review. Clin. Psychol. Rev. 2011, 31, 203–212. [Google Scholar] [CrossRef] [PubMed]
- Wolfe, A.R.; Ogbonna, E.M.; Lim, S.; Li, Y.; Zhang, J. Dietary linoleic and oleic fatty acids in relation to severe depressed mood: 10 years follow-up of a national cohort. Prog. Neuro-Psychopharmacol. Biol. Psychiatry 2009, 33, 972–977. [Google Scholar] [CrossRef] [PubMed]
- Craig, W.J. Health effects of vegan diets. Am. J. Clin. Nutr. 2009, 89, 1627S–1633S. [Google Scholar] [CrossRef] [PubMed]
- Allès, B.; Baudry, J.; Méjean, C.; Touvier, M.; Péneau, S.; Hercberg, S.; Kesse-Guyot, E. Comparison of sociodemographic and nutritional characteristics between self-reported vegetarians, vegans, and meat-eaters from the Nutrinet-Sante study. Nutrients 2017, 9, 1023. [Google Scholar] [CrossRef] [PubMed]
- Craig, W.J.; Mangels, A.R. Position of the American Dietetic Association: Vegetarian diets. J. Am. Dietet. Assoc. 2009, 109, 1266–1282. [Google Scholar]
- Vulser, H.; Wiernik, E.; Hoertel, N.; Thomas, F.; Pannier, B.; Czernichow, S.; Hanon, O.; Simon, T.; Simon, J.M.; Danchin, N. Association between depression and anemia in otherwise healthy adults. Acta Psychiatr. Scand. 2016, 134, 150–160. [Google Scholar] [CrossRef] [PubMed]
- Collin, C.; Assmann, K.E.; Deschasaux, M.; Andreeva, V.A.; Lemogne, C.; Charnaux, N.; Sutton, A.; Hercberg, S.; Galan, P.; Touvier, M. Plasma vitamin D status and recurrent depressive symptoms in the French SU. VI. MAX cohort. Eur. J. Nutr. 2017, 56, 2289–2298. [Google Scholar] [CrossRef] [PubMed]
- Quirk, S.E.; Williams, L.J.; O’Neil, A.; Pasco, J.A.; Jacka, F.N.; Housden, S.; Berk, M.; Brennan, S.L. The association between diet quality, dietary patterns and depression in adults: A systematic review. BMC Psychiatry 2013, 13, 175. [Google Scholar] [CrossRef] [PubMed]
- Simmons, W.K.; Burrows, K.; Avery, J.A.; Kerr, K.L.; Bodurka, J.; Savage, C.R.; Drevets, W.C. Depression-related increases and decreases in appetite: Dissociable patterns of aberrant activity in reward and interoceptive neurocircuitry. Am. J. Psychiatry 2016, 173, 418–428. [Google Scholar] [CrossRef] [PubMed]
- Rahe, C.; Baune, B.T.; Unrath, M.; Arolt, V.; Wellmann, J.; Wersching, H.; Berger, K. Associations between depression subtypes, depression severity and diet quality: Cross-sectional findings from the BiDirect Study. BMC Psychiatry 2015, 15, 38. [Google Scholar] [CrossRef] [PubMed]
- Yackobovitch-Gavan, M.; Golan, M.; Valevski, A.; Kreitler, S.; Bachar, E.; Lieblich, A.; Mitrani, E.; Weizman, A.; Stein, D. An integrative quantitative model of factors influencing the course of anorexia nervosa over time. Int. J. Eat. Disord. 2009, 42, 306–317. [Google Scholar] [CrossRef] [PubMed]
- Hansson, L.; Björck, C.; Birgegård, A.; Clinton, D. How do eating disorder patients eat after treatment? Dietary habits and eating behaviour three years after entering treatment. Eat. Weight Disord. Stud. Anorex. Bulim. Obes. 2011, 16, 1–8. [Google Scholar] [CrossRef]
- Bardone-Cone, A.M.; Fitzsimmons-Craft, E.E.; Harney, M.B.; Maldonado, C.R.; Lawson, M.A.; Smith, R.; Robinson, D.P. The inter-relationships between vegetarianism and eating disorders among females. J. Acad. Nutr. Diet. 2012, 112, 1247–1252. [Google Scholar] [CrossRef] [PubMed]
- Gonyea, J.G.; Curley, A.; Melekis, K.; Lee, Y. Perceptions of neighborhood safety and depressive symptoms among older minority urban subsidized housing residents: The mediating effect of sense of community belonging. Aging Ment. Health 2017, 10, 1–6. [Google Scholar] [CrossRef] [PubMed]
- Molendijk, M.; Molero, P.; Sánchez-Pedreño, F.O.; Van der Does, W.; Martínez-González, M.A. Diet quality and depression risk: A systematic review and dose-response meta-analysis of prospective studies. J. Affect. Disord. 2017, 226, 346–354. [Google Scholar] [CrossRef] [PubMed]


| Diet Type | Omnivorous (n = 88,905) | Pesco-vegetarian † (n = 832) | Lacto-ovo-vegetarian ‡ (n = 562) | Vegan § (n = 81) | p |
|---|---|---|---|---|---|
| Age | 47.40 ± 13.66 | 44.97 ± 13.67 | 41.48 ± 13.78 | 37.27 ± 12.70 | <0.001 |
| Sex | <0.001 | ||||
| Men | 41,941 (47.18) | 196 (23.56) | 179 (31.85) | 29 (35.80) | |
| Women | 46,964 (52.82) | 636 (76.44) | 383 (68.15) | 52 (64.20) | |
| Depressive symptoms | <0.001 | ||||
| CES-D score ≥ 19 | 14,391 (16.19) | 212 (25.48) | 158 (28.11) | 23 (28.40) | |
| Marital status | <0.001 | ||||
| (n missing = 1250) | |||||
| Married | 52,026 (59.34) | 297 (36.22) | 183 (32.97) | 24 (29.63) | |
| Single | 35,648 (40.66) | 523 (63.78) | 372 (67.03) | 57 (70.37) | |
| Household income | <0.001 | ||||
| (n missing = 1437) | |||||
| <1500 euros or does not want to answer | 14,594 (16.68) | 227 (27.96) | 194 (35.14) | 35 (43.21) | |
| 1500 to less than 2800 euros | 22,992 (26.28) | 256 (31.53) | 172 (31.16) | 29 (35.80) | |
| ≥2800 euros | 49,912 (57.04) | 329 (40.52) | 186 (33.70) | 17 (20.99) | |
| Education level | <0.001 | ||||
| (n missing = 761) | |||||
| ≤high school diploma or other diploma | 38,174 (43.30) | 275 (33.33) | 207 (37.16) | 38 (46.91) | |
| Undergraduate degree | 29,945 (33.97) | 306 (37.09) | 205 (36.80) | 19 (23.46) | |
| Postgraduate degree | 20,037 (22.73) | 244 (29.58) | 145 (26.03) | 24 (29.63) | |
| Other foods consumption | |||||
| No fruit consumption | 3280 (3.71) | 25 (3.02) | 26 (4.68) | 11 (13.75) | <0.0001 |
| (n missing = 540) | |||||
| No vegetable consumption | 1401 (1.59) | 16 (1.93) | 32 (5.71) | 15 (18.52) | <0.0001 |
| (n missing = 563) | |||||
| No legume consumption | 15637 (17.74) | 125 (15.15) | 106 (18.96) | 18 (22.22) | 0.140 |
| (n missing = 773) | |||||
| No grain consumption | 602 (0.68) | 37 (4.49) | 21 (3.76) | 9 (11.11) | <0.0001 |
| (n missing = 571) | |||||
| Physical activity | <0.001 | ||||
| (n missing = 2470) | |||||
| Low | 24,142 (27.92) | 156 (19.24) | 134 (24.50) | 20 (25.32) | |
| Moderate | 36,690 (45.90) | 392 (48.34) | 259 (47.35) | 35 (44.30) | |
| High | 22,641 (26.18) | 263 (32.43) | 154 (28.15) | 24 (30.38) | |
| Smoking | 0.058 | ||||
| (n missing = 3479) | |||||
| Non-Smokers | 39,929 (46.70) | 365 (46.09) | 241 (44.80) | 42 (55.26) | |
| Smokers | 16,600 (19.42) | 136 (17.17) | 120 (22.30) | 21 (27.63) | |
| Ex-smokers | 28,966 (33.88) | 291 (36.74) | 177 (32.90) | 13 (17.11) | |
| Alcohol intake | <0.001 | ||||
| (n missing = 5197) | |||||
| 1/week or more | 52,165 (62.22) | 384 (50.66) | 213 (41.85) | 28 (37.33) | |
| 2–3/months | 16,968 (20.24) | 158 (20.84) | 102 (20.04) | 19 (25.33) | |
| 1/month or less | 11,222 (13.38) | 142 (18.73) | 117 (22.99) | 16 (21.33) | |
| Never | 3486 (4.16) | 74 (9.76) | 77 (15.13) | 12 (16) | |
| Anaemia | 2718 (3.07) | 64 (7.71) | 34 (6.09) | 7 (8.64) | <0.001 |
| (n missing = 455) | |||||
| Chronic kidney disease | 316 (0.36) | 3 (0.37) | 1 (0.18) | 1 (1.25) | 0.523 |
| (n missing = 1819) | |||||
| Diabetes | 3036 (3.49) | 11 (1.36) | 7 (1.26) | 2 (2.47) | 0.0002 |
| (n missing = 2057) | |||||
| Dyslipidaemia | 27,691 (31.93) | 181 (22.35) | 103 (18.90) | 11 (13.58) | <0.0001 |
| (n missing = 2013) | |||||
| Cancer (all types) | 4534 (5.21) | 42 (5.16) | 13 (2.36) | 0 | 0.0036 |
| (n missing = 1992) | |||||
| Obesity | 10,639 (12.10) | 42 (5.08) | 37 (6.62) | 5 (6.33) | <0.0001 |
| (n missing = 1015) | |||||
| Hypertension | 25,039 (28.57) | 134 (16.40) | 86 (15.50) | 15 (18.52) | <0.0001 |
| (n missing = 1297) | |||||
| Eating to stay healthy | 42,342 (47.63) | 469 (56.37) | 309 (54.98) | 47 (58.02) | <0.0001 |
| Self-rated health | 2.79 ± 1.21 | 2.75 ± 1.26 | 2.75 ± 1.34 | 2.82 ± 1.43 | 0.809 |
| (n missing = 3326) |
| Type of Diet | Model 1 | Model 2 | Model 3 | Model 4 | Model 4’ |
|---|---|---|---|---|---|
| Omnivorous | 1 | 1 | 1 | 1 | 1 |
| Pesco-vegetarian † | 1.71 (1.43–2.04) * | 1.37 (1.15–1.64) * | 1.42 (1.18–1.71) * | 1.43 (1.19–1.72) * | 1.55 (1.22–1.98) * |
| Lacto-ovo-vegetarian ‡ | 1.85 (1.50–2.28) * | 1.34 (1.08–1.66) * | 1.40(1.12–1.75) * | 1.36 (1.09–1.70) * | 1.44 (1.08–1.92) * |
| Vegan § | 1.75 (1.01–3.03) * | 1.16 (0.66–2.01) | 1.24 (0.70–2.20) | 1.23 (0.69–2.17) | 1.18 (0.56–2.47) |
| Crude OR (95% CI) | Adjusted OR (95% CI) † | |
|---|---|---|
| Meat | 1.78 (1.62–1.96) | 1.37 (1.24–1.52) |
| Poultry | 1.83 (1.64–2.04) | 1.50 (1.34–1.68) |
| Fish | 1.82 (1.71–1.94) | 1.40 (1.31–1.50) |
| Eggs | 1.43 (1.34-1.54) | 1.22 (1.13–1.31) |
| Milk and dairies | 1.32 (1.23–1.42) | 1.24 (1.16–1.34) |
| Fruits | 1.99 (1.82–2.18) | 1.62 (1.48–1.78) |
| Vegetables | 2.30 (2.02–2.63) | 1.71 (1.49–1.97) |
| Legumes | 1.42 (1.35–1.49) | 1.22 (1.16–1.29) |
| Grains | 1.96 (1.61–2.39) | 1.61 (1.31–1.97) |
| Crude OR (95% CI) | Adjusted OR (95% CI) † | |
|---|---|---|
| No exclusion | 1 | 1 |
| Exclusion of 1 food item | 1.34 (1.27–1.40) | 1.20 (1.14–1.26) |
| Exclusion of 2 food items | 1.74 (1.62–1.87) | 1.40 (1.30–1.50) |
| Exclusion of more than 3 food items | 3.32 (2.89–3.81) | 2.25 (1.95–2.60) |
© 2018 by the authors. Licensee MDPI, Basel, Switzerland. This article is an open access article distributed under the terms and conditions of the Creative Commons Attribution (CC BY) license (http://creativecommons.org/licenses/by/4.0/).
Share and Cite
Matta, J.; Czernichow, S.; Kesse-Guyot, E.; Hoertel, N.; Limosin, F.; Goldberg, M.; Zins, M.; Lemogne, C. Depressive Symptoms and Vegetarian Diets: Results from the Constances Cohort. Nutrients 2018, 10, 1695. https://doi.org/10.3390/nu10111695
Matta J, Czernichow S, Kesse-Guyot E, Hoertel N, Limosin F, Goldberg M, Zins M, Lemogne C. Depressive Symptoms and Vegetarian Diets: Results from the Constances Cohort. Nutrients. 2018; 10(11):1695. https://doi.org/10.3390/nu10111695
Chicago/Turabian StyleMatta, Joane, Sébastien Czernichow, Emmanuelle Kesse-Guyot, Nicolas Hoertel, Frédéric Limosin, Marcel Goldberg, Marie Zins, and Cedric Lemogne. 2018. "Depressive Symptoms and Vegetarian Diets: Results from the Constances Cohort" Nutrients 10, no. 11: 1695. https://doi.org/10.3390/nu10111695
APA StyleMatta, J., Czernichow, S., Kesse-Guyot, E., Hoertel, N., Limosin, F., Goldberg, M., Zins, M., & Lemogne, C. (2018). Depressive Symptoms and Vegetarian Diets: Results from the Constances Cohort. Nutrients, 10(11), 1695. https://doi.org/10.3390/nu10111695