Acute Effects of Substitution, and Addition, of Carbohydrates and Fat to Protein on Gastric Emptying, Blood Glucose, Gut Hormones, Appetite, and Energy Intake

 , , ,
, , ,
Abstract
:1. Introduction
2. Materials and Methods
2.1. Subjects
2.2. Protocol
2.3. Measurements
2.3.1. Gastric Emptying by 3D Ultrasonography
2.3.2. Blood Glucose and Plasma Insulin, Ghrelin, CCK, and GLP-1 Concentrations
2.3.3. Perceptions of Appetite and Gastrointestinal Symptoms
2.3.4. Energy Intake
2.4. Data and Statistical Analyses
3. Results
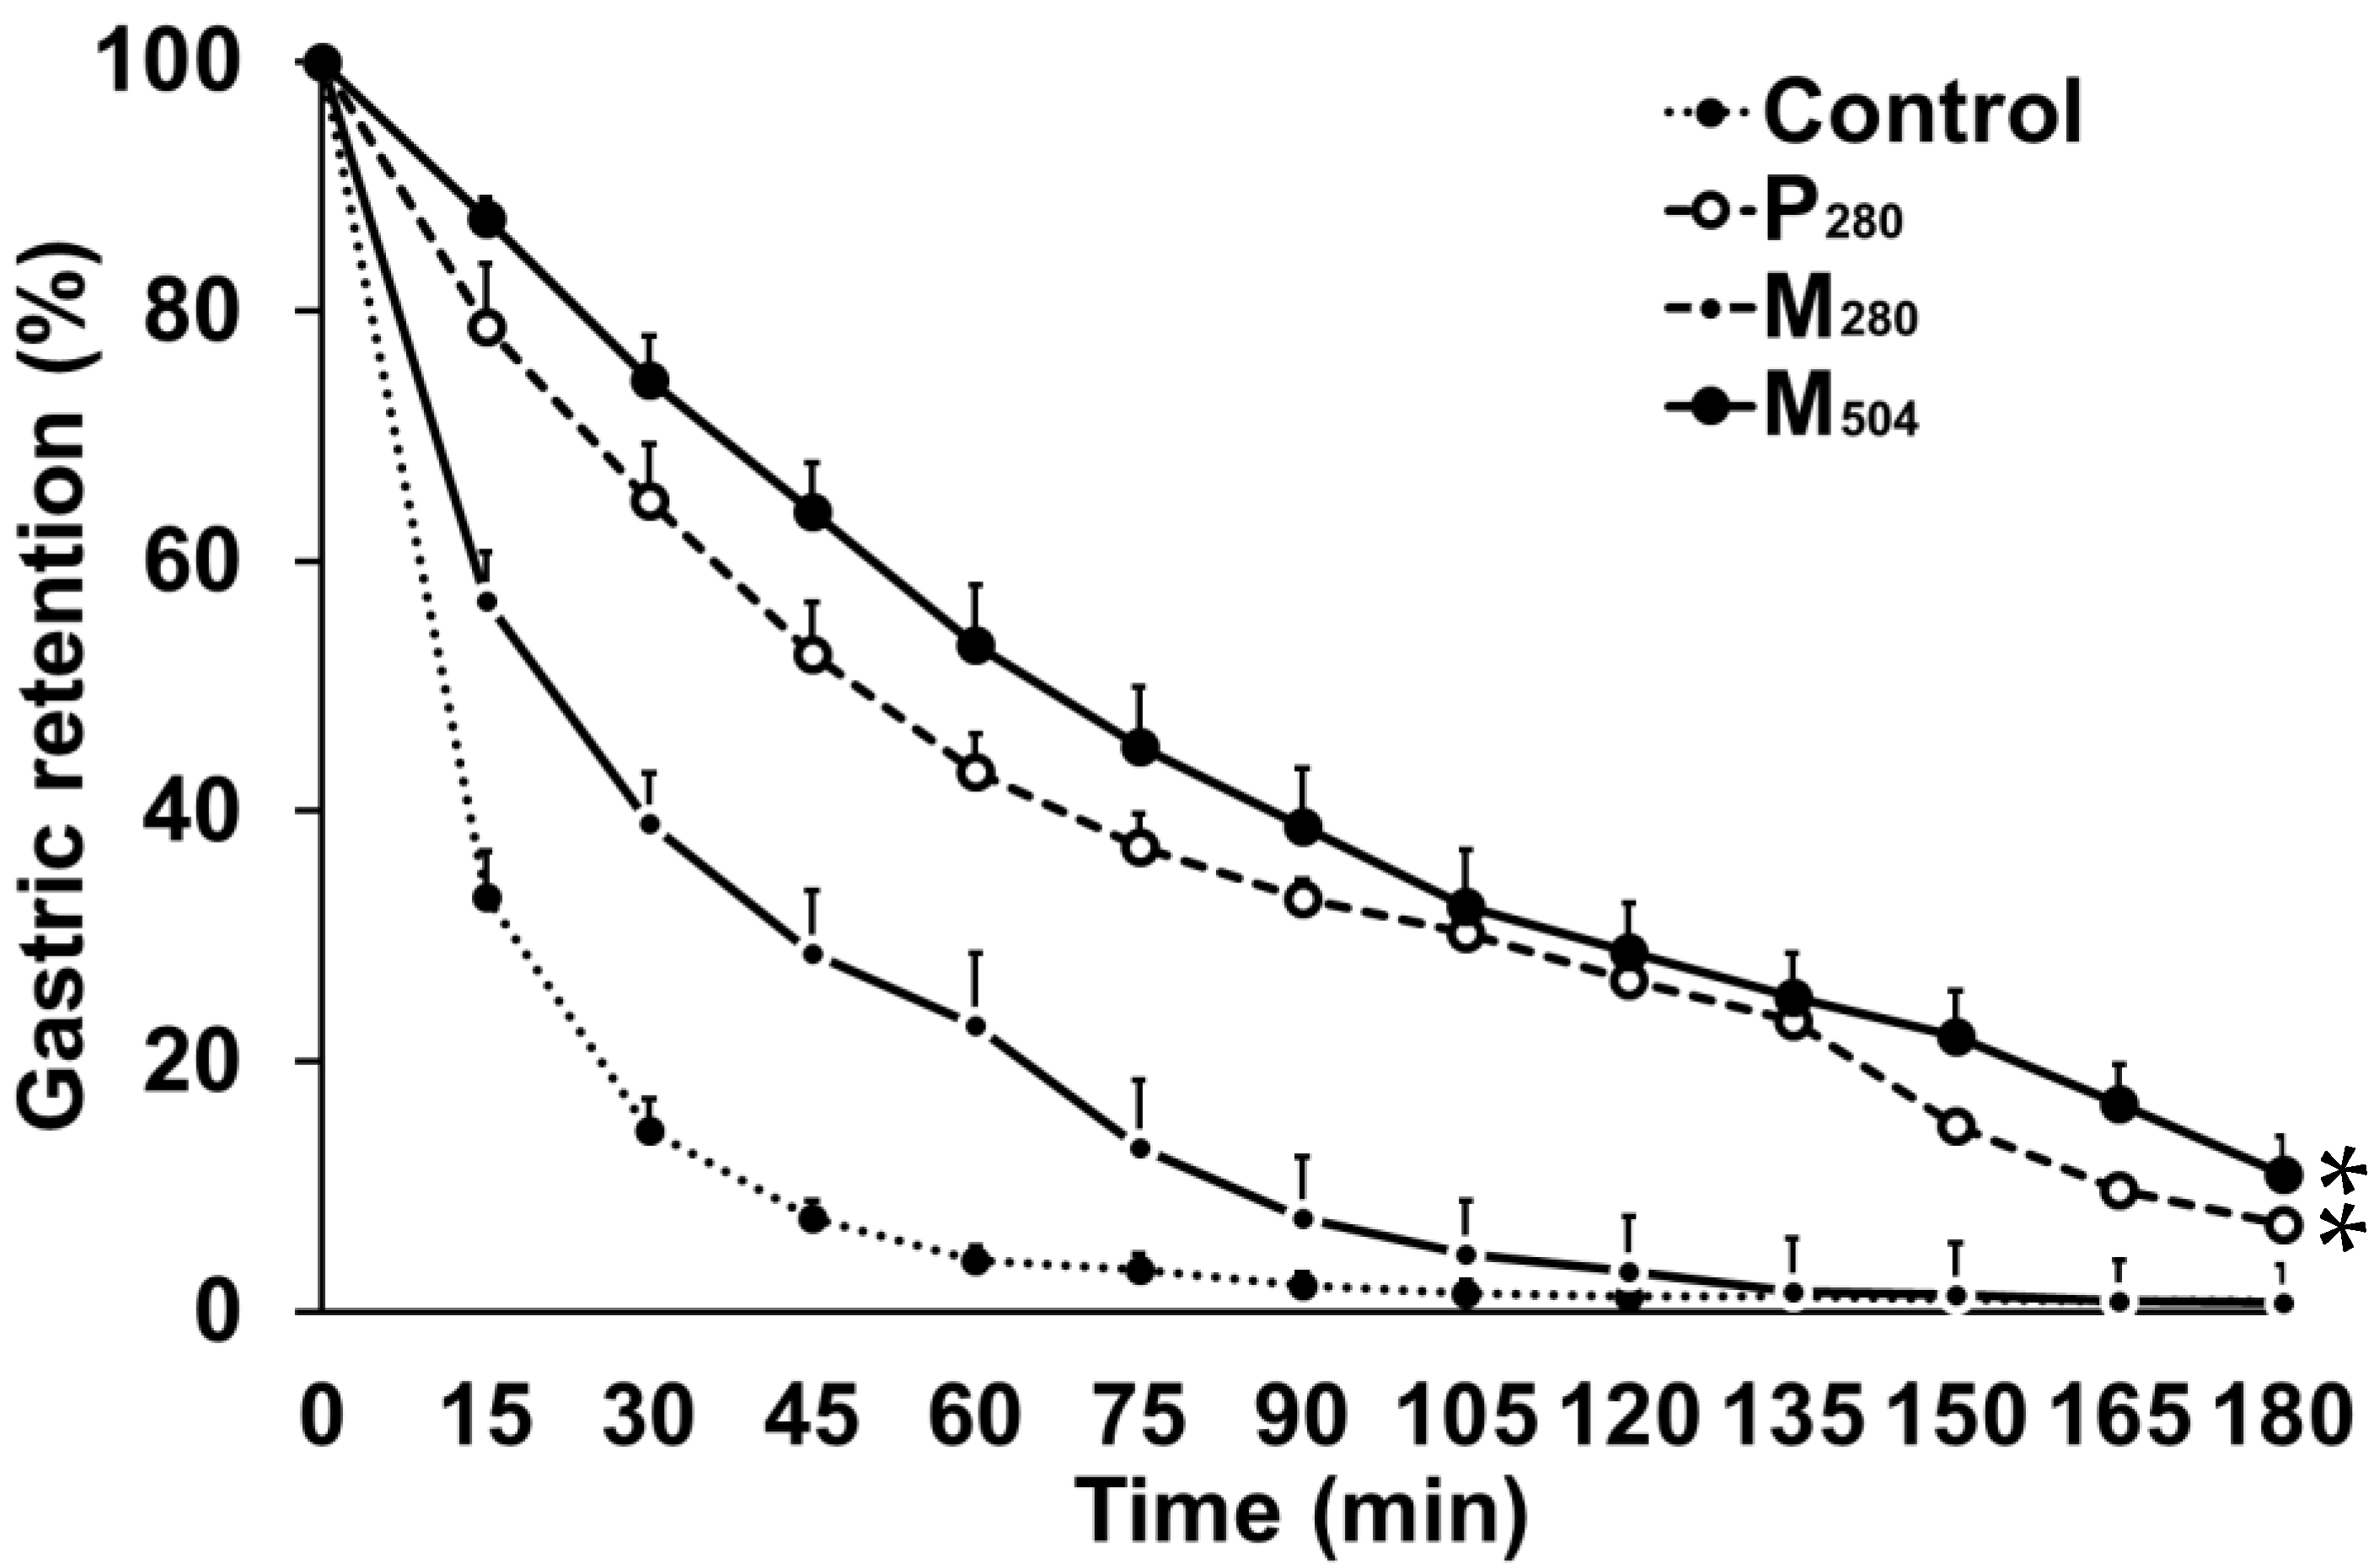
3.1. Gastric Emptying
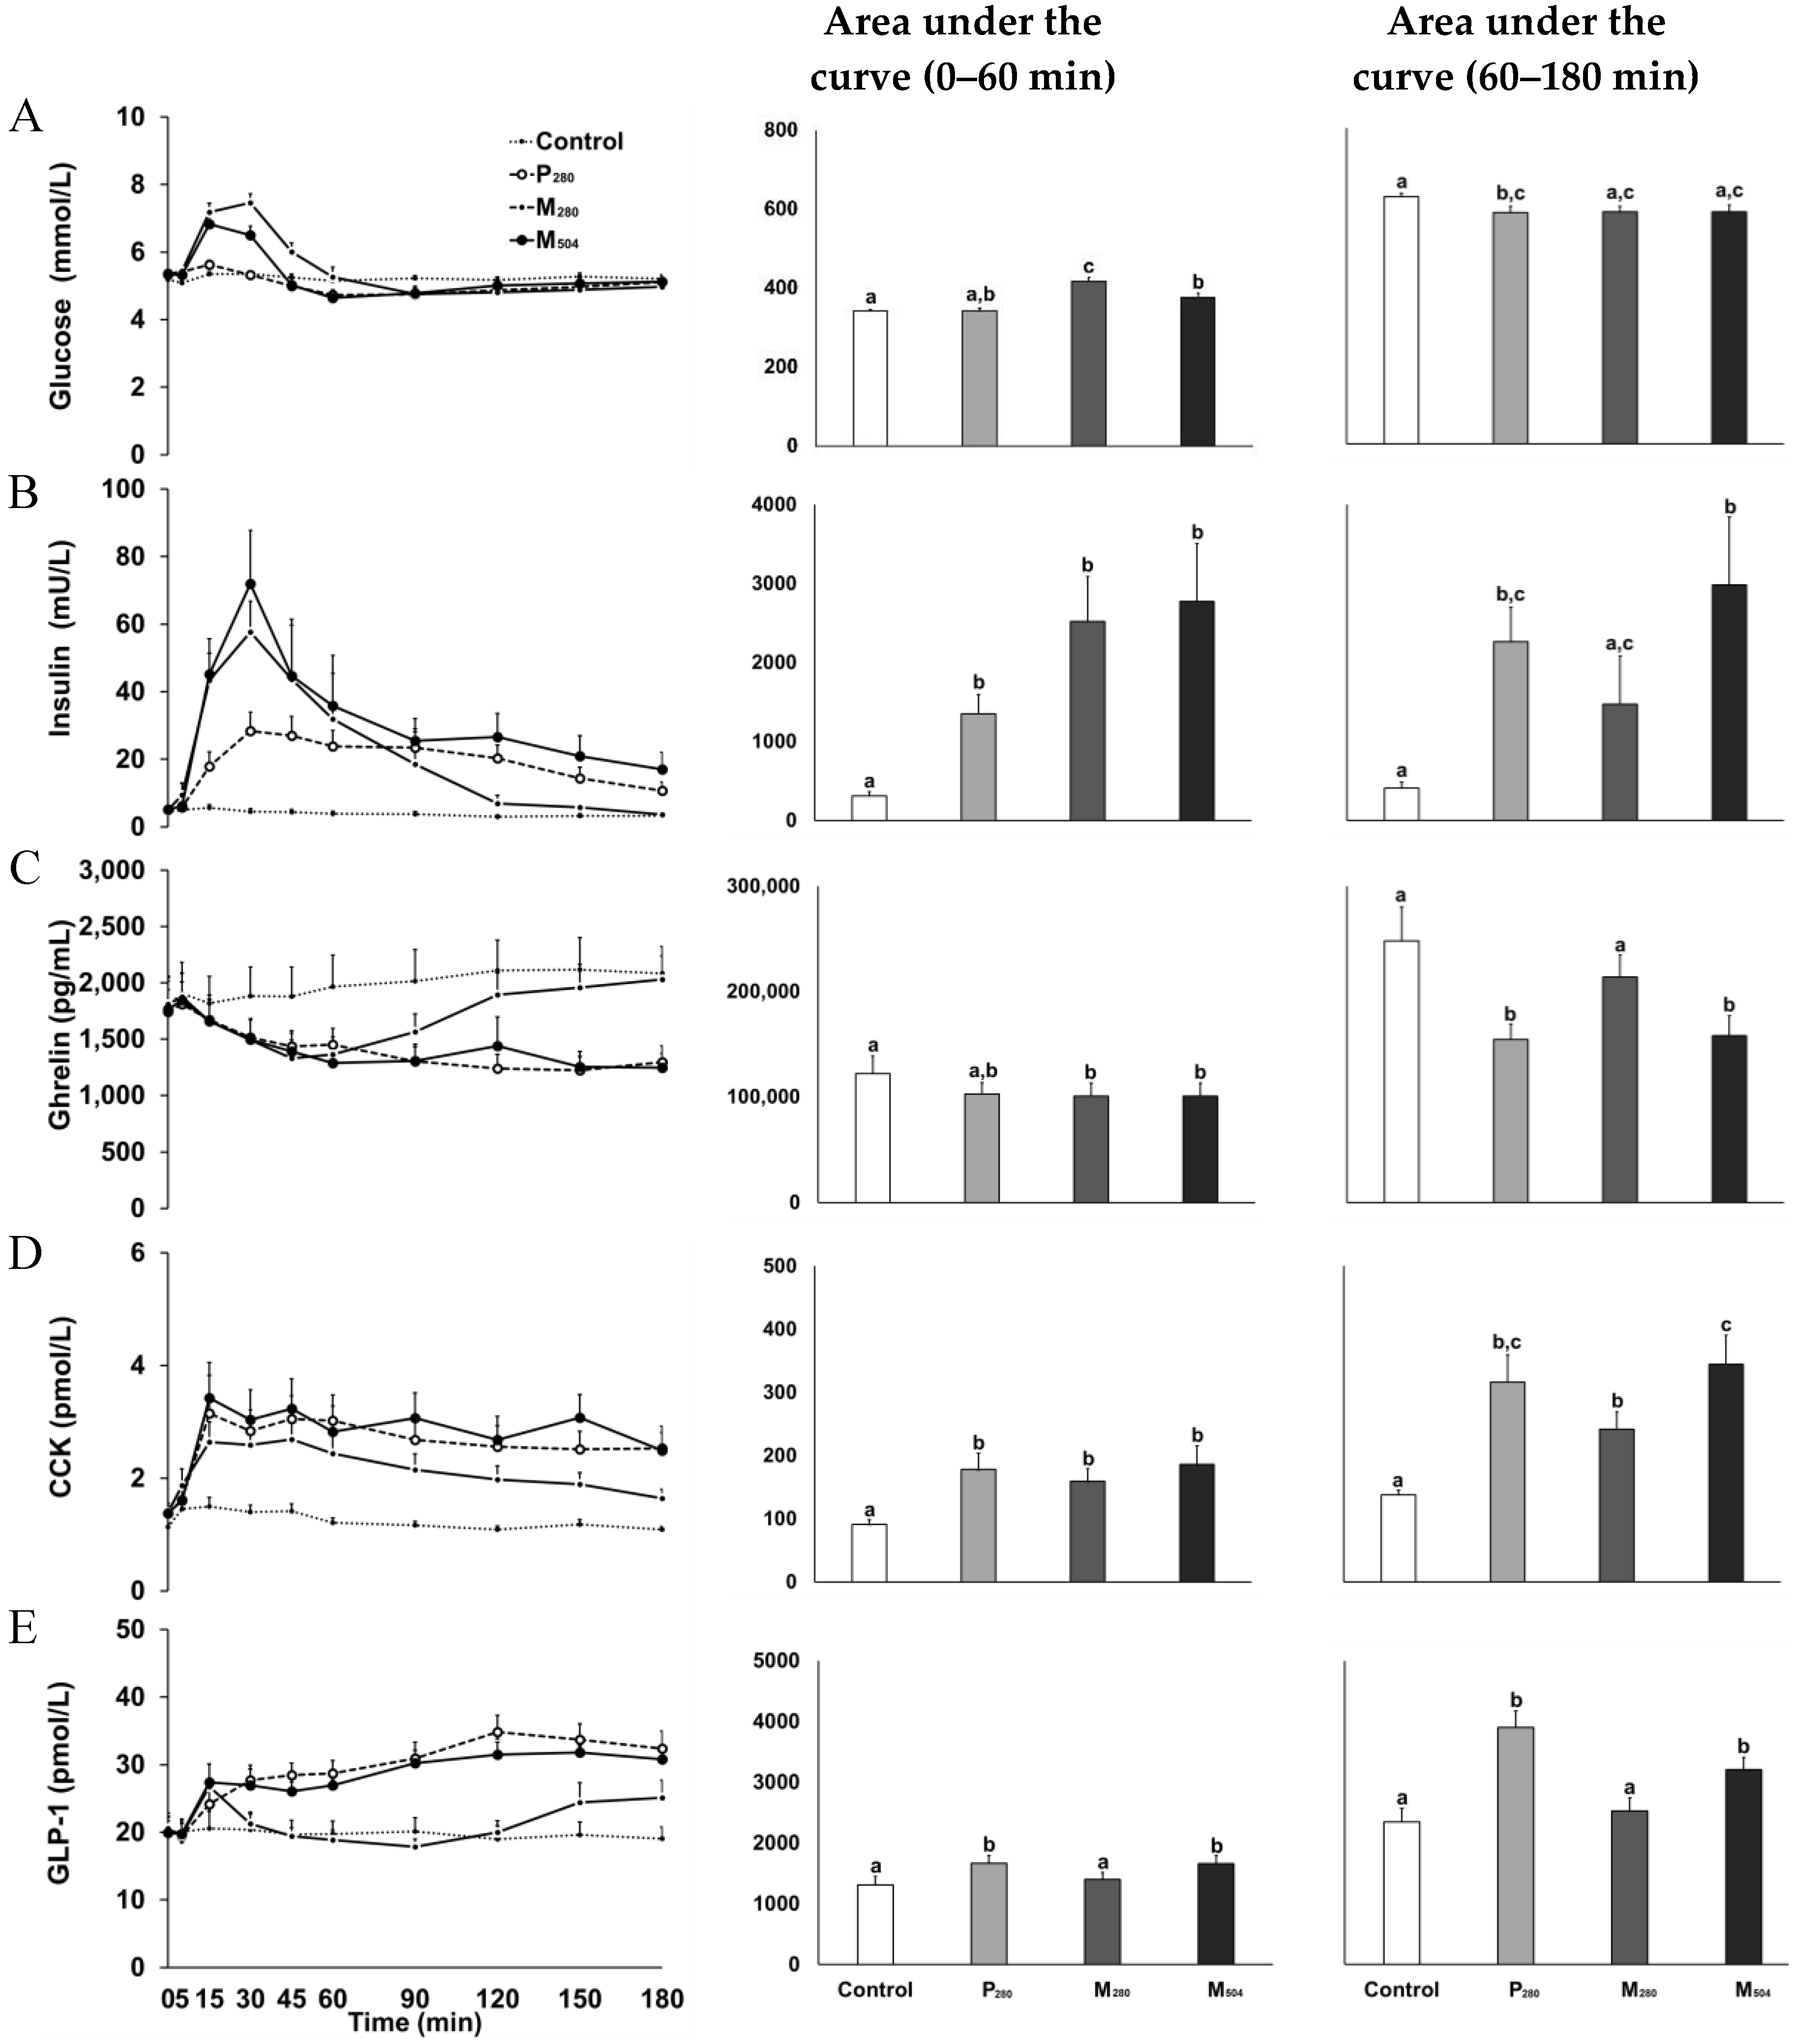
3.2. Blood Glucose and Plasma Gut Hormone Concentrations
3.2.1. Glucose
3.2.2. Insulin
3.2.3. Ghrelin
3.2.4. CCK
3.2.5. GLP-1
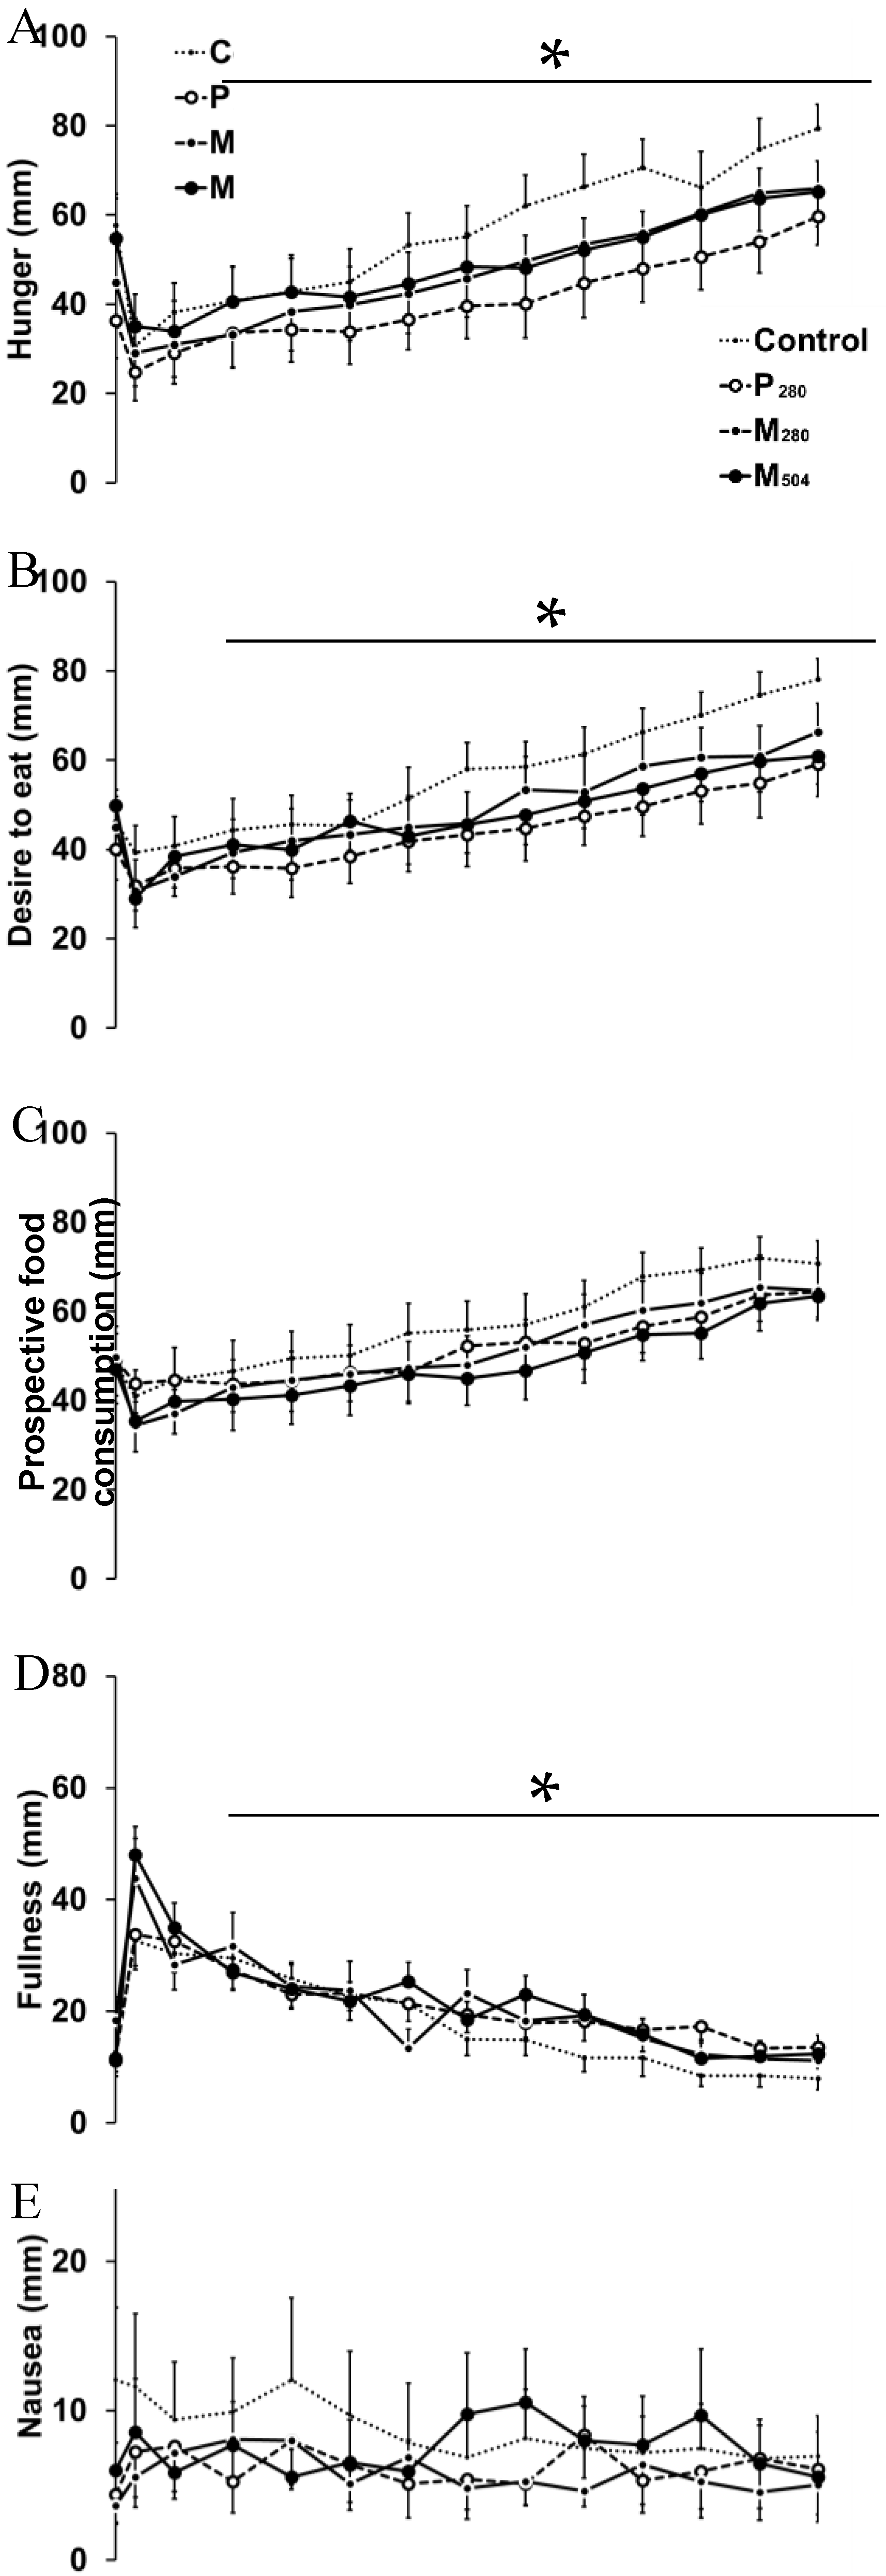
3.3. Perceptions of Appetite and Gastrointestinal Symptoms
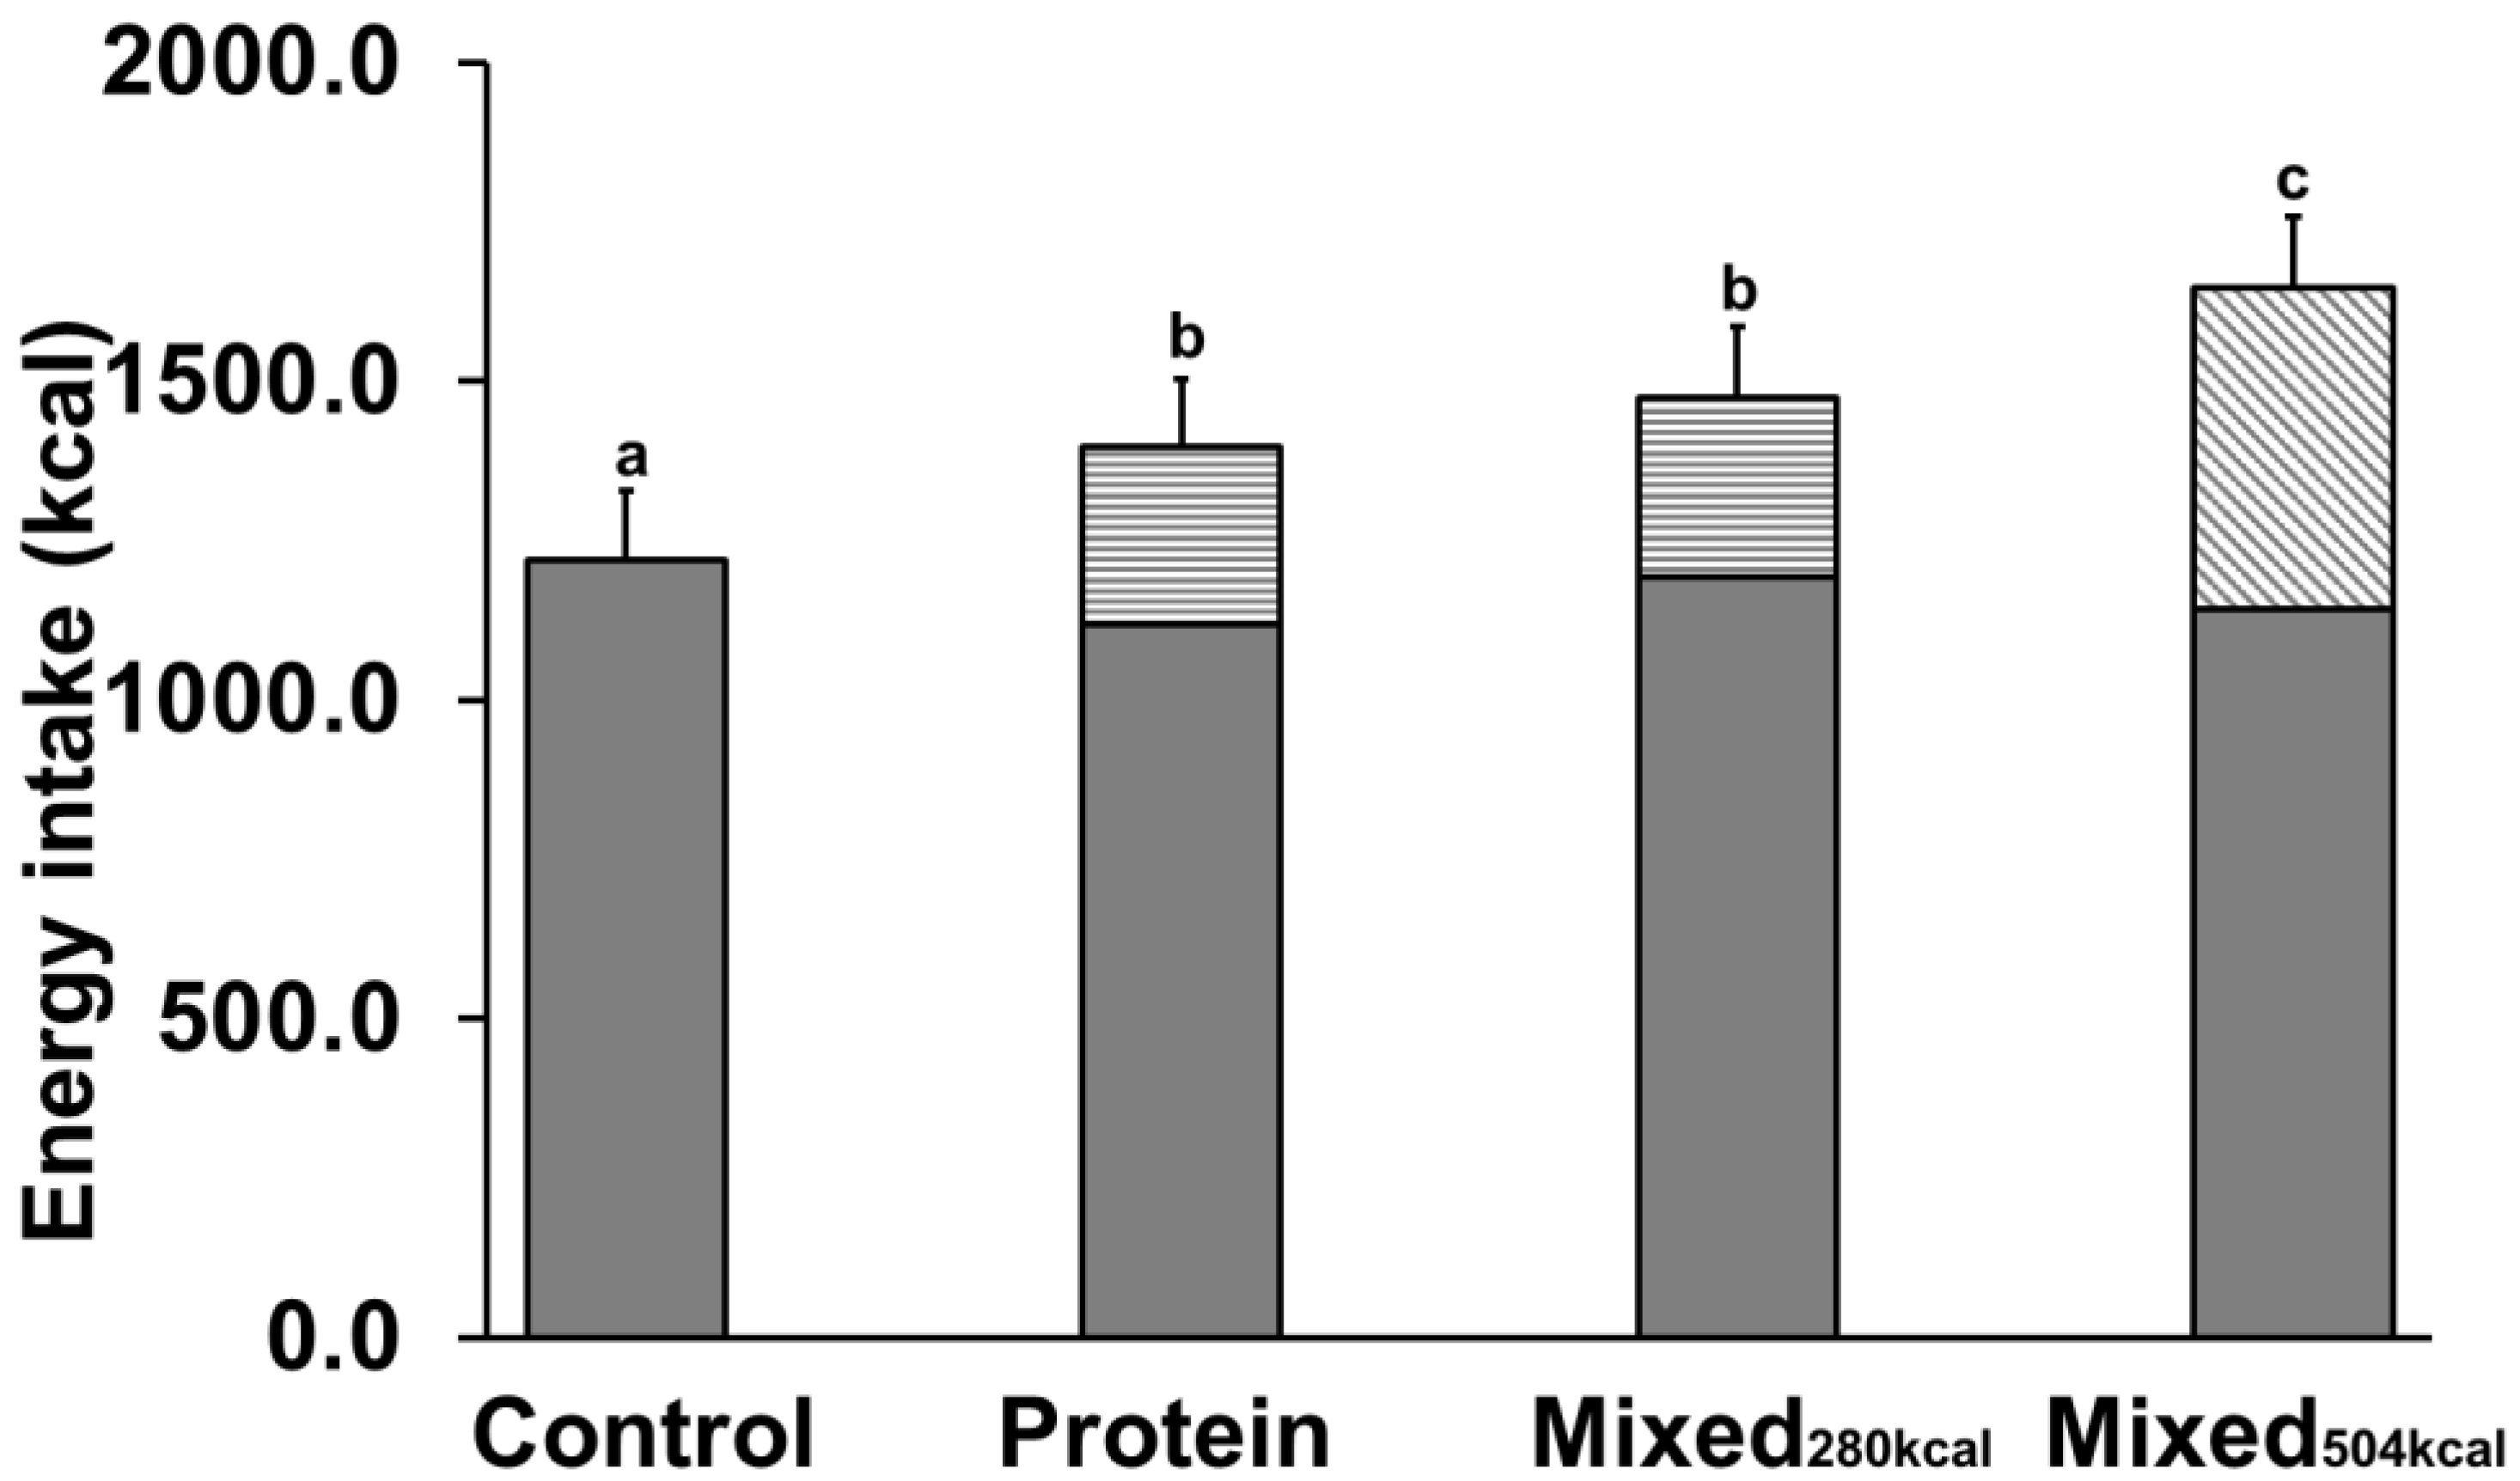
3.4. Energy Intake
3.5. Correlations between Gastric Retention, Hormones, and Energy Intake
4. Discussion
5. Conclusions
Author Contributions
Funding
Acknowledgments
Conflicts of Interest
References
- Rayner, C.K.; Samsom, M.; Jones, K.L.; Horowitz, M. Relationships of upper gastrointestinal motor and sensory function with glycemic control. Diabetes Care 2001, 24, 371–381. [Google Scholar] [CrossRef] [PubMed]
- Steinert, R.E.; Feinle-Bisset, C.; Asarian, L.; Horowitz, M.; Beglinger, C.; Geary, N.; Ghrelin, N. CCK, GLP-1, and PYY(3–36): Secretory controls and physiological roles in eating and glycemia in health, obesity, and after RYGB. Physiol. Rev. 2017, 97, 411–463. [Google Scholar] [CrossRef] [PubMed]
- Linnebjerg, H.; Park, S.; Kothare, P.A.; Trautmann, M.E.; Mace, K.; Fineman, M.; Wilding, I.; Nauck, M.; Horowitz, M. Effect of exenatide on gastric emptying and relationship to postprandial glycemia in type 2 diabetes. Regul. Pept. 2008, 151, 123–129. [Google Scholar] [CrossRef] [PubMed]
- Soenen, S.; Westerterp-Plantenga, M.S. Proteins and satiety: Implications for weight management. Curr. Opin. Clin. Nutr. Metab. Care 2008, 11, 747–751. [Google Scholar] [CrossRef] [PubMed]
- Soenen, S.; Hochstenbach-Waelen, A.; Westerterp-Plantenga, M.S. Efficacy of alpha-lactalbumin and milk protein on weight loss and body composition during energy restriction. Obesity 2011, 19, 370–379. [Google Scholar] [CrossRef] [PubMed]
- Ryan, A.T.; Feinle-Bisset, C.; Kallas, A.; Wishart, J.M.; Clifton, P.M.; Horowitz, M.; Luscombe-Marsh, N.D. Intraduodenal protein modulates antropyloroduodenal motility, hormone release, glycemia, appetite, and energy intake in lean men. Am. J. Clin. Nutr. 2012, 96, 474–482. [Google Scholar] [CrossRef] [PubMed] [Green Version]
- Hutchison, A.T.; Piscitelli, D.; Horowitz, M.; Jones, K.L.; Clifton, P.M.; Standfield, S.; Hausken, T.; Feinle-Bisset, C.; Luscombe-Marsh, N.D. Acute load-dependent effects of oral whey protein on gastric emptying, gut hormone release, glycemia, appetite, and energy intake in healthy men. Am. J. Clin. Nutr. 2015, 102, 1574–1584. [Google Scholar] [CrossRef] [PubMed] [Green Version]
- Goetze, O.; Steingoetter, A.; Menne, D.; van der Voort, I.R.; Kwiatek, M.A.; Boesiger, P.; Weishaupt, D.; Thumshirn, M.; Fried, M.; Schwizer, W. The effect of macronutrients on gastric volume responses and gastric emptying in humans: A magnetic resonance imaging study. Am. J. Physiol. Gastrointest. Liver Physiol. 2007, 292, G11–G17. [Google Scholar] [CrossRef] [PubMed]
- Blom, W.A.; Lluch, A.; Stafleu, A.; Vinoy, S.; Holst, J.J.; Schaafsma, G.; Hendriks, H.F. Effect of a high-protein breakfast on the postprandial ghrelin response. Am. J. Clin. Nutr. 2006, 83, 211–220. [Google Scholar] [CrossRef] [PubMed]
- Ma, J.; Stevens, J.E.; Cukier, K.; Maddox, A.F.; Wishart, J.M.; Jones, K.L.; Clifton, P.M.; Horowitz, M.; Rayner, C.K. Effects of a Protein Preload on Gastric Emptying, Glycemia, and Gut Hormones After a Carbohydrate Meal in Diet-Controlled Type 2 Diabetes. Diabetes Care 2009, 32, 1600–1602. [Google Scholar] [CrossRef] [PubMed] [Green Version]
- Clegg, M.; Shafat, A. Energy and macronutrient composition of breakfast affect gastric emptying of lunch and subsequent food intake, satiety and satiation. Appetite 2010, 54, 517–523. [Google Scholar] [CrossRef] [PubMed]
- Gentilcore, D.; Hausken, T.; Horowitz, M.; Jones, K.L. Measurements of gastric emptying of low- and high-nutrient liquids using 3D ultrasonography and scintigraphy. Neurogastroenterol. Motil. 2006, 18, 1062–1068. [Google Scholar] [CrossRef] [PubMed]
- Giezenaar, C.; Trahair, L.G.; Rigda, R.; Hutchison, A.T.; Feinle-Bisset, C.; Luscombe-Marsh, N.D.; Hausken, T.; Jones, K.L.; Horowitz, M.; Chapman, I.; et al. Lesser suppression of energy intake by orally ingested whey protein in healthy older men compared with young controls. Am. J. Physiol. Regul. Integr. Comp. Physiol. 2015, 309, R845–R854. [Google Scholar] [CrossRef] [PubMed] [Green Version]
- Perano, S.J.; Couper, J.J.; Horowitz, M.; Martin, A.J.; Kritas, S.; Sullivan, T.; Rayner, C.K. Pancreatic enzyme supplementation improves the incretin hormone response and attenuates postprandial glycemia in adolescents with cystic fibrosis: A randomized crossover trial. J. Clin. Endocrinol. Metab. 2014, 99, 2486–2493. [Google Scholar] [CrossRef] [PubMed]
- Giezenaar, C.; Hutchison, A.T.; Luscombe-Marsh, N.D.; Chapman, I.; Horowitz, M.; Soenen, S. Effect of age on blood glucose and plasma insulin, glucagon, ghrelin, CCK, GIP, and GLP-1 responses to whey protein ingestion. Nutrients 2017, 10, 2. [Google Scholar] [CrossRef] [PubMed]
- Parker, B.A.; Sturm, K.; MacIntosh, C.G.; Feinle, C.; Horowitz, M.; Chapman, I.M. Relation between food intake and visual analogue scale ratings of appetite and other sensations in healthy older and young subjects. Eur. J. Clin. Nutr. 2004, 58, 212–218. [Google Scholar] [CrossRef] [PubMed] [Green Version]
- Bland, J.M.; Altman, D.G. Calculating correlation coefficients with repeated observations: Part 1-correlation within subjects. Br. Med. J. 1995, 310, 446. [Google Scholar] [CrossRef]
- Liddle, R.A.; Rushakoff, R.J.; Morita, E.T.; Beccaria, L.; Carter, J.D.; Goldfine, I.D. Physiological role for cholecystokinin in reducing postprandial hyperglycemia in humans. J. Clin. Investig. 1988, 81, 1675–1681. [Google Scholar] [CrossRef] [PubMed]
- Kleibeuker, J.H.; Beekhuis, H.; Jansen, J.B.; Piers, D.A.; Lamers, C.B. Cholecystokinin is a physiological hormonal mediator of fat-induced inhibition of gastric emptying in man. J. Clin. Investig. 1988, 18, 173–177. [Google Scholar] [CrossRef]
- Little, T.J.; Pilichiewicz, A.N.; Russo, A.; Phillips, L.; Jones, K.L.; Nauck, M.A.; Wishart, J.; Horowitz, M.; Feinle-Bisset, C. Effects of intravenous glucagon-like peptide-1 on gastric emptying and intragastric distribution in healthy subjects: Relationships with postprandial glycemic and insulinemic responses. J. Clin. Endocrinol. Metab. 2006, 91, 1916–1923. [Google Scholar] [CrossRef] [PubMed]
- Nauck, M.A.; Niedereichholz, U.; Ettler, R.; Holst, J.J.; Orskov, C.; Ritzel, R.; Schmiegel, W.H. Glucagon-like peptide 1 inhibition of gastric emptying outweighs its insulinotropic effects in healthy humans. Am. J. Physiol. 1997, 273, E981–E988. [Google Scholar] [CrossRef] [PubMed]
- Horowitz, M.; Jones, K.; Edelbroek, M.A.L.; Smout, A.J.P.M.; Read, N.W. The effect of posture on gastric emptying and intragastric distribution of oil and aqueous meal components and appetite. Gastroenterology 1993, 105, 382–390. [Google Scholar] [CrossRef]
- Bowen, J.; Noakes, M.; Clifton, P.M. Appetite hormones and energy intake in obese men after consumption of fructose, glucose and whey protein beverages. Int. J. Obes. 2007, 31, 1696–1703. [Google Scholar] [CrossRef] [PubMed]
- Karamanlis, A.; Chaikomin, R.; Doran, S.; Bellon, M.; Bartholomeusz, F.D.; Wishart, J.M.; Jones, K.L.; Horowitz, M.; Rayner, C.K. Effects of protein on glycemic and incretin responses and gastric emptying after oral glucose in healthy subjects. Am. J. Clin. Nutr. 2007, 86, 1364–1368. [Google Scholar] [CrossRef] [PubMed] [Green Version]
- El Khoury, D.; Brown, P.; Smith, G.; Berengut, S.; Panahi, S.; Kubant, R.; Anderson, G.H. Increasing the protein to carbohydrate ratio in yogurts consumed as a snack reduces post-consumption glycemia independent of insulin. Clin. Nutr. 2014, 33, 29–38. [Google Scholar] [CrossRef] [PubMed]
- Siddhu, A.; Sud, S.; Bijlani, R.L.; Karmarkar, M.G.; Nayar, U. Nutrient interaction in relation to glycaemic response in isocarbohydrate and isocaloric meals. Indian J. Physiol. Pharmacol. 1990, 34, 171–178. [Google Scholar] [PubMed]
- Simpson, R.W.; McDonald, J.; Wahlqvist, M.L.; Atley, L.; Outch, K. Macronutrients have different metabolic effects in nondiabetics and diabetics. Am. J. Clin. Nutr. 1985, 42, 449–453. [Google Scholar] [CrossRef] [PubMed] [Green Version]
- Nilsson, M.; Holst, J.J.; Björck, I.M. Metabolic effects of amino acid mixtures and whey protein in healthy subjects: Studies using glucose-equivalent drinks. Am. J. Clin. Nutr. 2007, 85, 996–1004. [Google Scholar] [CrossRef] [PubMed]
- Dangin, M.; Boirie, Y.; Garcia-Rodenas, C.; Gachon, P.; Fauquant, J.; Callier, P.; Ballèvre, O.; Beaufrère, B. The digestion rate of protein is an independent regulating factor of postprandial protein retention. Am. J. Physiol. Endocrinol. Metab. 2001, 280, E340–E348. [Google Scholar] [CrossRef] [PubMed]
- Monnier, L.; Colette, C.; Dunseath, G.J.; Owens, D.R. The loss of postprandial glycemic control precedes stepwise deterioration of fasting with worsening diabetes. Diabetes Care 2007, 30, 263–269. [Google Scholar] [CrossRef] [PubMed]
- Bowen, J.; Noakes, M.; Trenerry, C.; Clifton, P.M. Energy intake, ghrelin, and cholecystokinin after different carbohydrate and protein preloads in overweight men. J. Clin. Endocrinol. Metab. 2006, 91, 1477–1483. [Google Scholar] [CrossRef] [PubMed]
- Foster-Schubert, K.E.; Overduin, J.; Prudom, C.E.; Liu, J.; Callahan, H.S.; Gaylinn, B.D.; Thorner, M.O.; Cummings, D.E. Acyl and total ghrelin are suppressed strongly by ingested proteins, weakly by lipids, and biphasically by carbohydrates. J. Clin. Endocrinol. Metab. 2008, 93, 1971–1979. [Google Scholar] [CrossRef] [PubMed]
- Tannous dit El Khoury, D.; Obeid, O.; Azar, S.T.; Hwalla, N. Variations in postprandial ghrelin status following ingestion of high-carbohydrate, high-fat, and high-protein meals in males. Ann. Nutr. Metab. 2006, 50, 260–269. [Google Scholar] [CrossRef] [PubMed]
- Al Awar, R.; Obeid, O.; Hwalla, N.; Azar, S. Postprandial acylated ghrelin status following fat and protein manipulation of meals in healthy young women. Clin. Sci. 2005, 109, 405–411. [Google Scholar] [CrossRef] [PubMed]
- Hopman, W.P.M.; Jansen, J.B.M.J.; Lamers, C.B.H.W. Comparative study of the effects of equal amounts of fat, protein, and starch on plasma cholecystokinin in man. Scand. J. Gastroenterol. 1985, 20, 843–847. [Google Scholar] [CrossRef] [PubMed]
- Van der Klaauw, A.A.; Keogh, J.M.; Henning, E.; Trowse, V.M.; Dhillo, W.S.; Ghatei, M.A.; Farooqi, I.S. High protein intake stimulates postprandial GLP1 and PYY release. Obesity 2013, 21, 1602–1607. [Google Scholar] [CrossRef] [PubMed] [Green Version]
- Bowen, J.; Noakes, M.; Clifton, P.M. Appetite regulatory hormone responses to various dietary proteins differ by body mass index status despite similar reductions in ad libitum energy intake. J. Clin. Endocrinol. Metab. 2006, 91, 2913–2919. [Google Scholar] [CrossRef] [PubMed]
- Raben, A.; Agerholm-Larsen, L.; Flint, A.; Holst, J.J.; Astrup, A. Meals with similar energy densities but rich in protein, fat, carbohydrate, or alcohol have different effects on energy expenditure and substrate metabolism but not on appetite and energy intake. Am. J. Clin. Nutr. 2003, 77, 91–100. [Google Scholar] [CrossRef] [PubMed] [Green Version]
- Wikarek, T.; Chudek, J.; Owczarek, A.; Olszanecka-Glinianowicz, M. Effect of dietary macronutrients on postprandial incretin hormone release and satiety in obese and normal-weight women. Br. J. Nutr. 2013, 111, 236–246. [Google Scholar] [CrossRef] [PubMed] [Green Version]
- Carr, R.D.; Larsen, M.O.; Winzell, M.S.; Jelic, K.; Lindgren, O.; Deacon, C.F.; Ahrén, B. Incretin and islet hormonal responses to fat and protein ingestion in healthy men. Am. J. Physiol. Endocrinol. Metab. 2008, 295, E779–E784. [Google Scholar] [CrossRef] [PubMed]
- Elliott, R.M.; Morgan, L.M.; Tredger, J.A.; Deacon, S.; Wright, J.; Marks, V. Glucagon-like peptide-1(7–36)amide and glucose-dependent insulinotropic polypeptide secretion in response to nutrient ingestion in man: Acute post-prandial and 24-h secretion patterns. J. Endocrinol. 1993, 138, 159–166. [Google Scholar] [CrossRef] [PubMed]
- Almiron-Roig, E.; Palla, L.; Guest, K.; Ricchiuti, C.; Vint, N.; Jebb, S.A.; Drewnowski, A. Factors that determine energy compensation: A systematic review of preload studies. Nutr. Rev. 2013, 71, 458–473. [Google Scholar] [CrossRef] [PubMed]


| Control | P280 | M280 | M504 | |
|---|---|---|---|---|
| Energy content (kcal) | 2 | 280 | 280 | 504 |
| Whey protein (g, %) | 0, 0 | 70, 100 | 14, 20 | 70, 56 |
| Dextrose (g, %) | 0, 0 | 0, 0 | 28, 40 | 28, 22 |
| Olive oil (g, %) | 0, 0 | 0, 0 | 12.4, 40 | 12.4, 22 |
| Control | P280 | M280 | M504 | |
|---|---|---|---|---|
| 50% emptying time (T50; min) | 12 ± 3 a | 58 ± 31 b | 23 ± 8 c | 70 ± 29 b |
| 100% emptying time (T100; min) | 82 ± 47 a | 169 ± 17 b | 116 ± 28 c | 176 ± 14 b |
| Gastric retention (AUC) | ||||
| Early phase (0–60 min, % × 60 min−1) | 27 ± 6 a | 67 ± 12 b | 47 ± 10 c | 76 ± 10 b |
| Late phase (60–180 min, % × 120 min−1) | 2 ± 3 a | 25 ± 3 b | 6 ± 3 a | 30 ± 13 b |
| Rate of gastric emptying (kcal/min) 1 | ||||
| Early phase (0–60 min) | 2.7 ± 0.9 a | 3.9 ± 1.4 b | 3.5 ± 2.1 b | |
| Late phase (60–180 min) | 0.7 ± 0.3 a | 1.2 ± 0.7 b | 1.8 ± 0.4 c | |
| Amount emptied (%) | ||||
| Early phase (0–60 min) | 96 ± 4 a | 57 ± 19 b | 77 ± 9 c | 47 ± 16 b |
| Late phase (60–180 min) | 99 ± 2 a | 93 ± 10 b | 99 ± 2 a | 89 ± 10 b |
| Control | P280 | M280 | M504 | |
|---|---|---|---|---|
| Peak/nadir concentration | ||||
| Glucose | 5.6 ± 0.2 a | 5.7 ± 0.4 a | 7.9 ± 0.6 b | 7.0 ± 0.7 b |
| Insulin | 6 ± 3 a | 35 ± 22 b | 66 ± 54 b | 74 ± 58 b |
| Ghrelin | 1653 ± 837 a | 1109 ± 366 b | 1269 ± 538 a,b | 1110 ± 365 b |
| CCK | 1.7 ± 0.6 a | 3.8 ± 2.2 b | 3.0 ± 1.3 b | 4.0 ± 2.2 b |
| GLP-1 | 23 ± 8 a | 36 ± 9 b | 29 ± 12 a,b | 34 ± 8 b |
| 180-min concentration | ||||
| Glucose | 5.2 ± 0.4 a | 5.1 ± 0.4 a | 5.0 ± 0.4 a | 5.1 ± 0.7 a |
| Insulin | 3.2 ± 2.3 a | 11 ± 9 b | 3.7 ± 2.7 a | 17 ± 18 a,b |
| Ghrelin | 2081 ± 871 a | 1295 ± 523 b | 2029 ± 754 a | 1245 ± 459 b |
| CCK | 1.1 ± 0.2 a | 2.5 ± 1.4 b,c | 1.6 ± 0.6 c | 2.5 ± 1.1 b |
| GLP-1 | 19 ± 6 a | 32 ± 9 b | 25 ± 9 a,c | 31 ± 7 b,c |
| Time to peak/nadir | ||||
| Glucose | 59 ± 56 a | 18 ± 31 a | 25 ± 7 a | 23 ± 10 a |
| Insulin | 17 ± 12 a | 71 ± 39 b | 28 ± 8 a,c | 31 ± 7 c |
| Ghrelin | 55 ± 64 a | 128 ± 38 b | 44 ± 13 a | 116 ± 53 b |
| CCK | 13 ± 17 a | 68 ± 51 b | 32 ± 28 a,b | 68 ± 61 b |
| GLP-1 | 65 ± 61 a | 124 ± 32 b | 87 ± 78 a,b | 115 ± 61 a,b |
© 2018 by the authors. Licensee MDPI, Basel, Switzerland. This article is an open access article distributed under the terms and conditions of the Creative Commons Attribution (CC BY) license (http://creativecommons.org/licenses/by/4.0/).
Share and Cite
Giezenaar, C.; Lange, K.; Hausken, T.; Jones, K.L.; Horowitz, M.; Chapman, I.; Soenen, S. Acute Effects of Substitution, and Addition, of Carbohydrates and Fat to Protein on Gastric Emptying, Blood Glucose, Gut Hormones, Appetite, and Energy Intake. Nutrients 2018, 10, 1451. https://doi.org/10.3390/nu10101451
Giezenaar C, Lange K, Hausken T, Jones KL, Horowitz M, Chapman I, Soenen S. Acute Effects of Substitution, and Addition, of Carbohydrates and Fat to Protein on Gastric Emptying, Blood Glucose, Gut Hormones, Appetite, and Energy Intake. Nutrients. 2018; 10(10):1451. https://doi.org/10.3390/nu10101451
Chicago/Turabian StyleGiezenaar, Caroline, Kylie Lange, Trygve Hausken, Karen L. Jones, Michael Horowitz, Ian Chapman, and Stijn Soenen. 2018. "Acute Effects of Substitution, and Addition, of Carbohydrates and Fat to Protein on Gastric Emptying, Blood Glucose, Gut Hormones, Appetite, and Energy Intake" Nutrients 10, no. 10: 1451. https://doi.org/10.3390/nu10101451