Fish Intake, Circulating Mercury and Mortality in Renal Transplant Recipients

 ,
,  ,
,
Abstract
:1. Introduction
2. Methods
2.1. Design and Study Population
2.2. Assessment of Dietary Intake
2.3. Clinical Parameters
2.4. Laboratory Methods and Circulating Mercury Measurement
2.5. Calculations and Definitions
2.6. Statistical Analyses
3. Results
3.1. Baseline Characteristics
3.2. Prospective Analyses of Cardiovascular and All-Cause Mortality
4. Discussion
5. Conclusions
Supplementary Materials
Author Contributions
Funding
Conflicts of Interest
References
- Wolfe, R.A.; Ashby, V.B.; Milford, E.L.; Ojo, A.O.; Ettenger, R.E.; Agodoa, L.Y.C.; Held, P.J.; Port, F.K. Comparison of mortality in all patients on dialysis, patients on dialysis awaiting transplantation, and recipients of a first cadaveric transplant. N. Engl. J. Med. 1999, 341, 1725–1730. [Google Scholar] [CrossRef] [PubMed]
- Oterdoom, L.H.; de Vries, A.P.J.; van Ree, R.M.; Gansevoort, R.T.; van Son, W.J.; van der Heide, J.J.H.; Navis, G.; de Jong, P.E.; Gans, R.O.B.; Bakker, S.J.L. N-terminal pro-B-type natriuretic peptide and mortality in renal transplant recipients versus the general population. Transplantation 2009, 87, 1562–1570. [Google Scholar] [CrossRef] [PubMed]
- Ojo, A.O. Cardiovascular complications after renal transplantation and their prevention. Transplantation 2006, 82, 603–611. [Google Scholar] [CrossRef] [PubMed]
- Eide, I.A.; Jenssen, T.; Hartmann, A.; Diep, L.M.; Dahle, D.O.; Reisæter, A.V.; Bjerve, K.S.; Christensen, J.H.; Schmidt, E.B.; Svensson, M. The association between marine n-3 polyunsaturated fatty acid levels and survival after renal transplantation. Clin. J. Am. Soc. Nephrol. 2015, 10, 1246–1256. [Google Scholar] [CrossRef] [PubMed]
- Gomes Neto, A.; Sotomayor, C.G.; Pranger, I.; van den Berg, E.; Gans, R.; Soedamah-Muthu, S.; Navis, G.; Bakker, S.J.L. Intake of marine-derived omega-3 polyunsaturated fatty acids and mortality in renal transplant recipients. Nutrients 2017, 9, e363. [Google Scholar] [CrossRef] [PubMed]
- Calder, P.C. n-3 polyunsaturated fatty acids, inflammation, and inflammatory diseases. Am. J. Clin. Nutr. 2006, 83, 1505S–1519S. [Google Scholar] [CrossRef] [PubMed]
- Calder, P.C. Omega-3 fatty acids and inflammatory processes. Nutrients 2010, 2, 355–374. [Google Scholar] [CrossRef] [PubMed]
- Saravanan, P.; Davidson, N.C.; Schmidt, E.B.; Calder, P.C. Cardiovascular effects of marine omega-3 fatty acids. Lancet 2010, 376, 540–550. [Google Scholar] [CrossRef]
- De Caterina, R. n-3 Fatty Acids in Cardiovascular Disease. N. Engl. J. Med. 2011, 364, 2439–2540. [Google Scholar] [CrossRef] [PubMed]
- Wang, Q.; Liang, X.; Wang, L.; Lu, X.; Huang, J.; Cao, J.; Li, H.; Gu, D. Effect of omega-3 fatty acids supplementation on endothelial function: A meta-analysis of randomized controlled trials. Atherosclerosis 2012, 221, 536–543. [Google Scholar] [CrossRef] [PubMed]
- Priante, G.; Musacchio, E.; Valvason, C.; Clari, G.; Bordin, L.; Sartori, L.; Baggio, B. Further insights about the beneficial effects of n-3 fatty acids in the early molecular events of renal fibrosis in vitro. J. Nephrol. 2013, 26, 652–659. [Google Scholar] [CrossRef] [PubMed]
- Serhan, C.N. Pro-resolving lipid mediators are leads for resolution physiology. Nature 2014, 510, 92–101. [Google Scholar] [CrossRef] [PubMed] [Green Version]
- Siscovick, D.S.; Barringer, T.A.; Fretts, A.M.; Wu, J.H.Y.; Lichtenstein, A.H.; Costello, R.B.; Kris-Etherton, P.M.; Jacobson, T.A.; Engler, M.B.; Alger, H.M.; et al. Mozaffarian, D. Omega-3 polyunsaturated fatty acid (fish oil) supplementation and the prevention of clinical cardiovascular disease. Circulation 2017, 135, e867–e884. [Google Scholar] [CrossRef] [PubMed]
- Stone, N.J. Fish consumption, fish oil, lipids, and coronary heart disease. Circulation 1996, 94, 2337–2340. [Google Scholar] [CrossRef] [PubMed]
- Krauss, R.M.; Eckel, R.H.; Howard, B.; Appel, L.J.; Daniels, S.R.; Deckelbaum, R.J.; Erdman, J.W.; Kris-Etherton, P.; Goldberg, I.J.; Kotchen, T.A.; et al. AHA Dietary Guidelines: Revision 2000: A statement for healthcare professionals from the Nutrition Committee of the American Heart Association. Circulation 2000, 102, 2284–2299. [Google Scholar] [CrossRef] [PubMed]
- Kris-Etherton, P.M.; Harris, W.S.; Appel, L.J. Fish consumption, fish oil, omega-3 fatty acids, and cardiovascular disease. Circulation 2002, 106, 2747–2757. [Google Scholar] [CrossRef] [PubMed]
- Lichtenstein, A.H.; Lichtenstein, A.H.; Appel, L.J.; Brands, M.; Carnethon, M.; Daniels, S.; Franch, H.A.; Franklin, B.; Kris-Etherton, P.; Harris, W.S.; et al. Diet and lifestyle recommendations revision 2006: A scientific statement from the American Heart Association Nutrition Committee. Circulation 2006, 114, 82–96. [Google Scholar] [CrossRef] [PubMed]
- Eilat-Adar, S.; Sinai, T.; Yosefy, C.; Henkin, Y. Nutritional recommendations for cardiovascular disease prevention. Nutrients 2013, 5, 3646–3683. [Google Scholar] [CrossRef] [PubMed]
- U.S. Department of Health and Human Services and U.S. Department of Agriculture. 2015–2020 Dietary Guidelines for Americans, 8th ed.; December 2015. Available online: http://health.gov/dietaryguidelines/2015/guidelines/ (accessed on 28 September 2018).
- WHO. Preventing Disease through Healthy Environments-Exposure to Mercury: A Major Public Health Concern. 2007. Available online: http://www.who.int/phe/news/Mercury-flyer.pdf (accessed on 1 August 2018).
- WHO. Water, Sanitation and Health Team. Mercury in Health Care: Policy Paper. 2005. Available online: http://www.who.int/iris/handle/10665/69129 (accessed on 1 August 2018).
- National Research Council (US) Committee on the Toxicological Effects of Methylmercury. Toxicological Effects of Methylmercury, 1st ed.; National Academies Press: Washington, DC, USA, 2000; ISBN 0-309-07140-2. [Google Scholar]
- US EPA. Mercury Study Report to Congress. Volume IV: An Assessment of Exposure to Mercury in the United States; EPA/452/R-97-003; US Environmental Protection Agency, Office of Air Quality Planning and Standards, and Office of Research and Development: Washington, DC, USA, 1997.
- Chan, H.M.; Egeland, G.M. Fish consumption, mercury exposure, and heart diseases. Nutr. Rev. 2004, 62, 68–72. [Google Scholar] [PubMed]
- Mozaffarian, D.; Rimm, E.B. Fish intake, contaminants, and human health: Evaluating the risks and the benefits. JAMA 2006, 296, 1885–1899. [Google Scholar] [CrossRef] [PubMed]
- Raatz, S.K.; Silverstein, J.T.; Jahns, L.; Picklo, M.J., Sr. Issues of fish consumption for cardiovascular disease risk reduction. Nutrients 2013, 5, 1081–1097. [Google Scholar] [CrossRef] [PubMed]
- Wakita, Y. Hypertension induced by methyl mercury in rats. Toxicol. Appl. Pharmacol. 1987, 89, 144–147. [Google Scholar] [CrossRef]
- Halbach, S. Mercury compounds: Lipophilicity and toxic effects on isolated myocardial tissue. Arch. Toxicol. 1990, 64, 315–319. [Google Scholar] [CrossRef] [PubMed]
- Salonen, J.T.; Seppänen, K.; Nyyssönen, K.; Korpela, H.; Kauhanen, J.; Kantola, M.; Tuomilehto, J.; Esterbauer, H.; Tatzber, F.; Salonen, R. Intake of mercury from fish, lipid peroxidation, and the risk of myocardial infarction and coronary, cardiovascular, and any death in eastern Finnish men. Circulation 1995, 91, 645–655. [Google Scholar] [CrossRef] [PubMed]
- Rissanen, T.; Voutilainen, S.; Nyyssönen, K.; Lakka, T.A.; Salonen, J.T. Fish oil-derived fatty acids, docosahexaenoic acid and docosapentaenoic acid, and the risk of acute coronary events the kuopio ischaemic heart disease risk factor study. Circulation 2000, 102, 2677–2679. [Google Scholar] [CrossRef] [PubMed]
- de Assis, G.P.S.; Silva, C.E.C.; Stefanon, I.; Vassallo, D.V. Effects of small concentrations of mercury on the contractile activity of the rat ventricular myocardium. Comp. Biochem. Physiol. C Toxicol. Pharmacol. 2003, 134, 375–383. [Google Scholar] [CrossRef]
- Moreira, C.M.; Oliveira, E.M.; Bonan, C.D.; Sarkis, J.J.; Vassallo, D.V. Effects of mercury on myosin ATPase in the ventricular myocardium of the rat. Comp. Biochem. Physiol. C Toxicol. Pharmacol. 2003, 135C, 269–275. [Google Scholar] [CrossRef]
- Fillion, M.; Mergler, D.; Sousa Passos, C.J.; Larribe, F.; Lemire, M.; Guimarães, J.R.D. A preliminary study of mercury exposure and blood pressure in the Brazilian Amazon. Environ. Health 2006, 5, 29. [Google Scholar] [CrossRef] [PubMed]
- Valera, B.; Dewailly, E.; Poirier, P. Cardiac autonomic activity and blood pressure among Nunavik Inuit adults exposed to environmental mercury: A cross-sectional study. Environ. Health 2008, 7, 29. [Google Scholar] [CrossRef] [PubMed]
- Choi, A.L.; Weihe, P.; Budtz-Jørgensen, E.; Jørgensen, P.J.; Salonen, J.T.; Tuomainen, T.P.; Murata, K.; Nielsen, H.P.; Petersen, M.S.; Askham, J.; et al. Methylmercury exposure and adverse cardiovascular effects in Faroese whaling men. Environ. Health Perspect. 2009, 117, 367–372. [Google Scholar] [CrossRef] [PubMed] [Green Version]
- Minovic, I.; Van Der Veen, A.; Van Faassen, M.; Riphagen, I.J.; Van Den Berg, E.; Van Der Ley, C.; António, A.A.; Gomes-Neto, W.; Geleijnse, J.M.; Eggersdorfer, M.; et al. Functional vitamin B-6 status and long-term mortality in renal transplant recipients. Am. J. Clin. Nutr. 2017, 106, 1366–1374. [Google Scholar] [CrossRef] [PubMed] [Green Version]
- Keyzer, C.A.; de Borst, M.H.; van den Berg, E.; Jahnen-Dechent, W.; Arampatzis, S.; Farese, S.; Bergmann, I.P.; Floege, J.; Navis, G.; Bakker, S.J.L.; et al. Calcification Propensity and Survival among Renal Transplant Recipients. J. Am. Soc. Nephrol. 2016, 27, 239–248. [Google Scholar] [CrossRef] [PubMed]
- Feunekes, G.I.; Van Staveren, W.A.; De Vries, J.H.; Burema, J.; Hautvast, J.G. Relative and biomarker-based validity of a food-frequency questionnaire estimating intake of fats and cholesterol. Am. J. Clin. Nutr. 1993, 58, 489–496. [Google Scholar] [CrossRef] [PubMed]
- Stichting, N. Nederlands Voedingsstoffen Bestand: NEVO Tabel 2006, Dutch Nutrient Database; Voorlichtingsbureau voor de voeding: The Hague, The Netherlands, 2006. [Google Scholar]
- van den Berg, E.; Geleijnse, J.M.; Brink, E.J.; van Baak, M.A.; Homan van der Heide, J.J.; Gans, R.O.B.; Navis, G.; Bakker, S.J.L. Sodium intake and blood pressure in renal transplant recipients. Nephrol. Dial. Transplant. 2012, 27, 3352–3359. [Google Scholar] [CrossRef] [PubMed] [Green Version]
- Du Bois, D.; Du Bois, E.F. A formula to estimate the approximate surface area if height and weight be known. 1916. Nutrition 1989, 5, 303–313. [Google Scholar] [PubMed]
- Shabir, S.; Jham, S.; Harper, L.; Ball, S.; Borrows, R.; Sharif, A. Validity of glycated haemoglobin to diagnose new onset diabetes after transplantation. Transpl. Int. 2013, 26, 315–321. [Google Scholar] [CrossRef] [PubMed] [Green Version]
- Terpos, E.; Christoulas, D.; Kastritis, E.; Katodritou, E.; Pouli, A.; Michalis, E.; Papassotiriou, I.; Dimopoulos, M.A.; Greek Myeloma Study Group. The Chronic Kidney Disease Epidemiology Collaboration cystatin C (CKD-EPI-CysC) equation has an independent prognostic value for overall survival in newly diagnosed patients with symptomatic multiple myeloma; is it time to change from MDRD to CKD-EPI-CysC equations. Eur. J. Haematol. 2013, 347–355. [Google Scholar] [CrossRef]
- Willett, W.C.; Howe, G.R.; Kushi, L.H. Adjustmentfor total energy intake in epidemiologic studies. Am. J. Clin. Nutr. 1997, 65, 1220S–1228S. [Google Scholar] [CrossRef] [PubMed]
- Lund, B.O.; Miller, D.M.; Woods, J.S. Studies on Hg(II)-induced H2O2 formation and oxidative stress in vivo and in vitro in rat kidney mitochondria. Biochem. Pharmacol. 1993, 45, 2017–2024. [Google Scholar] [CrossRef]
- Steinberg, D. Antioxidants and atherosclerosis. A current assessment. Circulation 1991, 84, 1420–1425. [Google Scholar] [CrossRef] [PubMed]
- Witztum, J.L. The oxidation hypothesis of atherosclerosis. Lancet 1994, 344, 793–795. [Google Scholar] [CrossRef]
- Steinberg, D. Antioxidants in the prevention of human atherosclerosis. Summary of the proceedings of a National Heart, Lung, and Blood Institute Workshop: September 5–6, 1991, Bethesda, Maryland. Circulation 1992, 85, 2337–2344. [Google Scholar] [CrossRef] [PubMed]
- Mozaffarian, D. Fish, mercury, selenium and cardiovascular risk: Current evidence and unanswered questions. Int. J. Environ. Res. Public Health 2009, 6, 1894–1916. [Google Scholar] [CrossRef] [PubMed]
- Mozaffarian, D.; Shi, P.; Steven Morris, J.; Spiegelman, D.; Grandjean, P.; Siscovick, D.S.; Willett, W.C.; Rimm, E.B. Mercury exposure and risk of cardiovascular disease in two U.S. cohorts. N. Engl. J. Med. 2011, 364, 1116–1125. [Google Scholar] [CrossRef] [PubMed] [Green Version]
- Nichols, P.D.; Petrie, J.; Singh, S. Long-chain omega-3 oils-an update on sustainable sources. Nutrients 2010, 2, 572–585. [Google Scholar] [CrossRef] [PubMed]
- Yoshizawa, K.; Rimm, E.B.; Morris, S.; Orris, M.; Spate, V.L.; Hsieg, C.; Spiegelman, D.; Stampfer, M.J.; Willett, W.C. Mercury and the risk of coronary heart disease in men. N. Engl. J. Med. 2002, 347, 1755–1760. [Google Scholar] [CrossRef] [PubMed]
- Ahlqwist, M.; Bengtsson, C.; Lapidus, L.; Bergdahl, I.A.; Schütz, A. Serum mercury concentration in relation to survival, symptoms, and diseases: Results from the prospective population study of women in Gothenburg, Sweden. Acta Odontol. Scand. 1999, 57, 168–174. [Google Scholar] [CrossRef] [PubMed]
- Hallgren, C.G.; Hallmans, G.; Jansson, J.-H.; Marklund, S.L.; Huhtasaari, F.; Schütz, A.; Strömberg, U.; Vessby, B.; Skerfving, S. Markers of high fish intake are associated with decreased risk of a first myocardial infarction. Br. J. Nutr. 2001, 86, 397–404. [Google Scholar] [CrossRef] [PubMed] [Green Version]
- Laguna-Fernandez, A.; Checa, A.; Carracedo, M.; Artiach, G.; Petri, M.H.; Baumgartner, R.; Forteza, M.J.; Jiang, X.; Andonova, T.; Walker, M.E.; et al. ERV1/ChemR23 signaling protects from atherosclerosis by modifying oxLDL uptake and phagocytosis in macrophages. Circulation 2018. [Google Scholar] [CrossRef] [PubMed]


| Baseline Characteristics | Overall RTRs (n = 604) | Categories of Amount of Fish Intake | |||
|---|---|---|---|---|---|
| 0 g/day (n = 118) | 0–15 g/day (n = 241) | ≥15 g/day (n = 245) | p | ||
| Fish and marine-derived n-3 PUFAs intake, and circulating mercury | |||||
| Fish intake, g/day | 10.7 (3.9–18.3) † | 0.0 (0.0–0.0) | 7.8 (4.7–10.6) | 21.0 (17.0–31.9) | – |
| EPA-DHA intake, mg/day | 103 (41–219) | 20 (11–36) | 70 (42–121) | 240 (170–334) | <0.001 |
| Circulating mercury concentration, µg/L | 0.30 (0.14–0.63) | 0.22 (0.09–0.53) | 0.26 (0.13–0.62) | 0.37 (0.21–0.68) | <0.001 |
| Demographics | |||||
| Age, years | 53 ± 13 ‡ | 51 ± 13 | 52 ± 13 | 55 ± 12 | 0.02 |
| Sex (male), n (%) | 346 (57) § | 70 (59) | 139 (58) | 137 (56) | 0.82 |
| Caucasian ethnicity, n (%) | 602 (100) | 118 (100) | 239 (99) | 245 (100) | 0.22 |
| Body composition | |||||
| Body surface area, m2 | 1.94 ± 0.22 | 1.96 ± 0.22 | 1.94 ± 0.23 | 1.94 ± 0.20 | 0.81 |
| Body mass index, kg/m2 | 26.1 (23.2–29.3) | 25.8 (23.0–29.3) | 26.1 (23.14–29.4) | 26.2 (23.6–29.3) | 0.22 |
| Waist circumference, cms a | 99 ± 14 | 97 ± 14 | 99 ± 15 | 99 ± 14 | 0.32 |
| Cardiovascular history | |||||
| History of cardiovascular disease, n (%) b | 295 (49) | 55 (47) | 117 (49) | 123 (50) | 0.77 |
| Heart rate, beats per minute c | 69 ± 12 | 68 ± 12 | 70 ± 12 | 68 ± 12 | 0.24 |
| Arterial pressure d | |||||
| Systolic blood pressure, mmHg | 136 ± 17 | 136 ± 15 | 135 ± 16 | 137 ± 18 | 0.72 |
| Mean arterial pressure, mmHg | 101 ± 12 | 101 ± 11 | 100 ± 11 | 101 ± 13 | 0.60 |
| Antihypertensive treatment | |||||
| Use of antihypertensives, n (%) | 532 (88) | 104 (88) | 215 (89) | 213 (87) | 0.74 |
| Number of antihypertensives | 1.8 ± 1.1 | 2.0 ± 1.2 | 1.8 ± 1.1 | 1.7 ± 1.0 | 0.15 |
| Use of ACE-inhibitors or ARBs, n (%) | 198 (33) | 46 (39) | 73 (30) | 79 (32) | 0.25 |
| Use of β-blockers, n (%) | 383 (63) | 79 (67) | 153 (64) | 151 (62) | 0.62 |
| Use of calcium-antagonists, n (%) | 148 (25) | 30 (25) | 60 (25) | 58 (24) | 0.92 |
| Lifestyle | |||||
| Current smoker, n (%) a | 73 (12) | 15 (13) | 30 (12) | 28 (11) | 0.92 |
| Alcohol consumption | <0.001 | ||||
| None, n (%) | 24 (4) | 6 (5) | 8 (3) | 10 (4) | – |
| ≤10 g/day, n (%) | 420 (70) | 91 (77) | 187 (78) | 142 (58) | – |
| >10 g/day, n (%) | 160 (27) | 21 (18) | 46 (19) | 93 (38) | – |
| Total energy intake, kCal/day | 2170 ± 619 | 2227 ± 691 | 2147 ± 564 | 2165 ± 636 | 0.51 |
| Renal allograft function | |||||
| Creatinine, umol/L e | 123 (100–158) | 122 (98–166) | 125 (101–157) | 123 (101–156) | 0.97 |
| Cystatine-C, mg/L f | 1.66 (1.32–2.20) | 1.70 (1.31–2.17) | 1.73 (1.36–2.33) | 1.60 (1.30–2.17) | 0.58 |
| eGFR, mL/min/1.73 m2 f | 45 ± 18 | 46 ± 20 | 45 ± 18 | 45 ± 18 | 0.92 |
| Proteinuria ≥ 0.5 g/24 h, n (%) d | 131 (22) | 28 (24) | 52 (22) | 51 (21) | 0.82 |
| Lipids | |||||
| Total cholesterol, mmol/L | 5.12 ± 1.11 | 5.12 ± 1.07 | 5.03 ± 1.07 | 5.20 ± 1.17 | 0.27 |
| High-density lipoprotein-cholesterol, mmol/L d | 1.3 (1.1–1.6) | 1.3 (1.0–1.6) | 1.3 (1.0–1.6) | 1.3 (1.1–1.7) | 0.13 |
| Low-density lipoprotein-cholesterol, mmol/L d | 2.98 ± 0.93 | 2.99 ± 0.86 | 2.94 ± 0.89 | 3.00 ± 1.01 | 0.73 |
| Triglycerides, mmol/L | 1.68 (1.24–2.30) | 1.62 (1.19–2.28) | 1.71 (1.27–2.37) | 1.67 (1.23–2.25) | 0.71 |
| Use of statins, n (%) | 318 (53) | 59 (50) | 119 (49) | 140 (57) | 0.19 |
| Diabetes and glucose homeostasis | |||||
| Diabetes mellitus, n (%) | 144 (24) | 23 (20) | 64 (27) | 57 (23) | 0.32 |
| Plasma glucose, mmol/L e | 5.2 (4.8–6.0) | 5.3 (4.8–5.9) | 5.2 (4.7–6.0) | 5.3 (4.9–6.1) | 0.68 |
| HbA1C, % g | 5.8 (5.5–6.2) | 5.8 (5.5–6.2) | 5.8 (5.4–6.3) | 5.8 (5.5–6.2) | 0.62 |
| Insulin use, n (%) | 53 (9) | 6 (5) | 26 (11) | 21 (9) | 0.20 |
| Inflammation and oxidative stress | |||||
| Leukocyte count, per 109/L d | 8.1 ± 2.6 | 7.8 ± 2.3 | 8.4 ± 2.9 | 7.9 ± 2.5 | 0.02 |
| High-sensitivity C-reactive protein, mg/L h | 1.6 (0.7–4.6) | 1.3 (0.5–3.6) | 1.6 (0.7–4.9) | 1.6 (0.8–4.7) | 0.17 |
| Malondialdehyde, µmol/L f | 2.62 (1.99–3.86) | 2.50 (1.81–3.51) | 2.44 (1.99–3.79) | 2.77 (2.06–4.09) | 0.10 |
| Renal transplantation characteristics | |||||
| Time since transplantation, years | 5.7 (1.8–12.0) | 5.0 (1.7–10.6) | 5.6 (2.3–11.9) | 6.0 (1.4–12.2) | 0.65 |
| Immunosuppressive therapy | |||||
| Prednisolone dose, grams | 10.0 (7.5–10.0) | 10.0 (7.5–10.0) | 10.0 (7.5–10.0) | 10.0 (7.5–10.0) | 0.62 |
| Sirolimus or rapamune use, n (%) | 9 (2) | 3 (3) | 2 (1) | 4 (2) | 0.42 |
| Type of calcineurin inhibitor | 0.78 | ||||
| None, n (%) | 260 (43) | 45 (38) | 104 (43) | 111 (45) | – |
| Cyclosporine, n (%) | 242 (40) | 52 (44) | 95 (39) | 95 (39) | – |
| Tacrolimus, n (%) | 102 (17) | 21 (18) | 42 (17) | 39 (16) | – |
| Type of proliferation inhibitor | 0.13 | ||||
| None, n (%) | 97 (16) | 22 (19) | 44 (18) | 31 (13) | – |
| Azathioprine, n (%) | 101 (17) | 17 (14) | 33 (14) | 51 (21) | – |
| Mycophenolic acid, n (%) | 406 (67) | 79 (67) | 164 (68) | 163 (67) | – |
| Acute rejection treatment, n (%) | 156 (26) | 31 (26) | 57 (24) | 68 (28) | 0.58 |
| Baseline Characteristics | Circulating Mercury Concentration, µg/L | |
|---|---|---|
| Std. β | p | |
| Fish and marine-derived n-3 PUFAs intake, and circulating mercury | ||
| Fish intake, g/day | 0.21 | <0.001 |
| EPA-DHA intake, mg/day | 0.21 | <0.001 |
| Circulating mercury concentration, µg/L | – | – |
| Demographics | ||
| Age, years | –0.04 | 0.31 |
| Sex (male), n (%) | –0.05 | 0.19 |
| Caucasian ethnicity, n (%) | 0.03 | 0.42 |
| Body composition | ||
| Body surface area, m2 | 0.06 | 0.14 |
| Body mass index, kg/m2 | –0.01 | 0.85 |
| Waist circumference, cms a | 0.01 | 0.82 |
| Cardiovascular history | ||
| History of cardiovascular disease, n (%) b | –0.05 | 0.22 |
| Heart rate, beats per minute c | –0.03 | 0.51 |
| Arterial pressure d | ||
| Systolic blood pressure, mmHg | –0.01 | 0.72 |
| Mean arterial pressure, mmHg | 0.04 | 0.33 |
| Antihypertensive treatment | ||
| Use of antihypertensives, n (%) | 0.02 | 0.67 |
| Number of antihypertensives | <0.001 | 0.99 |
| Use of ACE-inhibitors or ARBs, n (%) | –0.003 | 0.95 |
| Use of β-blockers, n (%) | 0.01 | 0.85 |
| Use of calcium-antagonists, n (%) | –0.02 | 0.65 |
| Lifestyle | ||
| Current smoker, n (%) a | 0.02 | 0.57 |
| Alcohol consumption | 0.16 | <0.001 |
| None, n (%) | – | – |
| <10 g/day, n (%) | – | – |
| >10 g/day, n (%) | – | – |
| Total energy intake, kCal/day | 0.02 | 0.64 |
| Renal allograft function | ||
| Creatinine, umol/L e | 0.05 | 0.21 |
| Cystatine-C, mg/L f | 0.02 | 0.59 |
| eGFR, mL/min/1.73 m2 f | –0.06 | 0.16 |
| Proteinuria ≥0.5 g/24 h, n (%) d | –0.04 | 0.39 |
| Lipids | ||
| Total cholesterol, mmol/L | 0.08 | 0.05 |
| High-density lipoprotein-cholesterol, mmol/L d | 0.05 | 0.23 |
| Low-density lipoprotein-cholesterol, mmol/L d | 0.04 | 0.33 |
| Triglycerides, mmol/L | 0.02 | 0.62 |
| Use of statins, n (%) | –0.01 | 0.90 |
| Diabetes and glucose homeostasis | ||
| Diabetes mellitus, n (%) | –0.05 | 0.24 |
| Plasma glucose, mmol/L e | 0.001 | 0.98 |
| HbA1C, % g | –0.05 | 0.21 |
| Insulin use, n (%) | –0.02 | 0.59 |
| Inflammation and oxidative stress | ||
| Leukocyte count, per 109/L d | –0.01 | 0.81 |
| High-sensitivity C-reactive protein, mg/L h | –0.01 | 0.78 |
| Malondialdehyde, µmol/L f | 0.004 | 0.93 |
| Renal transplantation characteristics | ||
| Time since transplantation, years | –0.05 | 0.26 |
| Immunosuppressive therapy | ||
| Prednisolone dose, grams | –0.06 | 0.14 |
| Sirolimus or rapamune use, n (%) | –0.03 | 0.53 |
| Type of calcineurin inhibitor | 0.06 | 0.14 |
| None, n (%) | – | – |
| Cyclosporine, n (%) | – | – |
| Tacrolimus, n (%) | – | – |
| Type of proliferation inhibitor | 0.03 | 0.52 |
| None, n (%) | – | – |
| Azathioprine, n (%) | – | – |
| Mycophenolic acid, n (%) | – | – |
| Acute rejection treatment, n (%) | 0.07 | 0.11 |
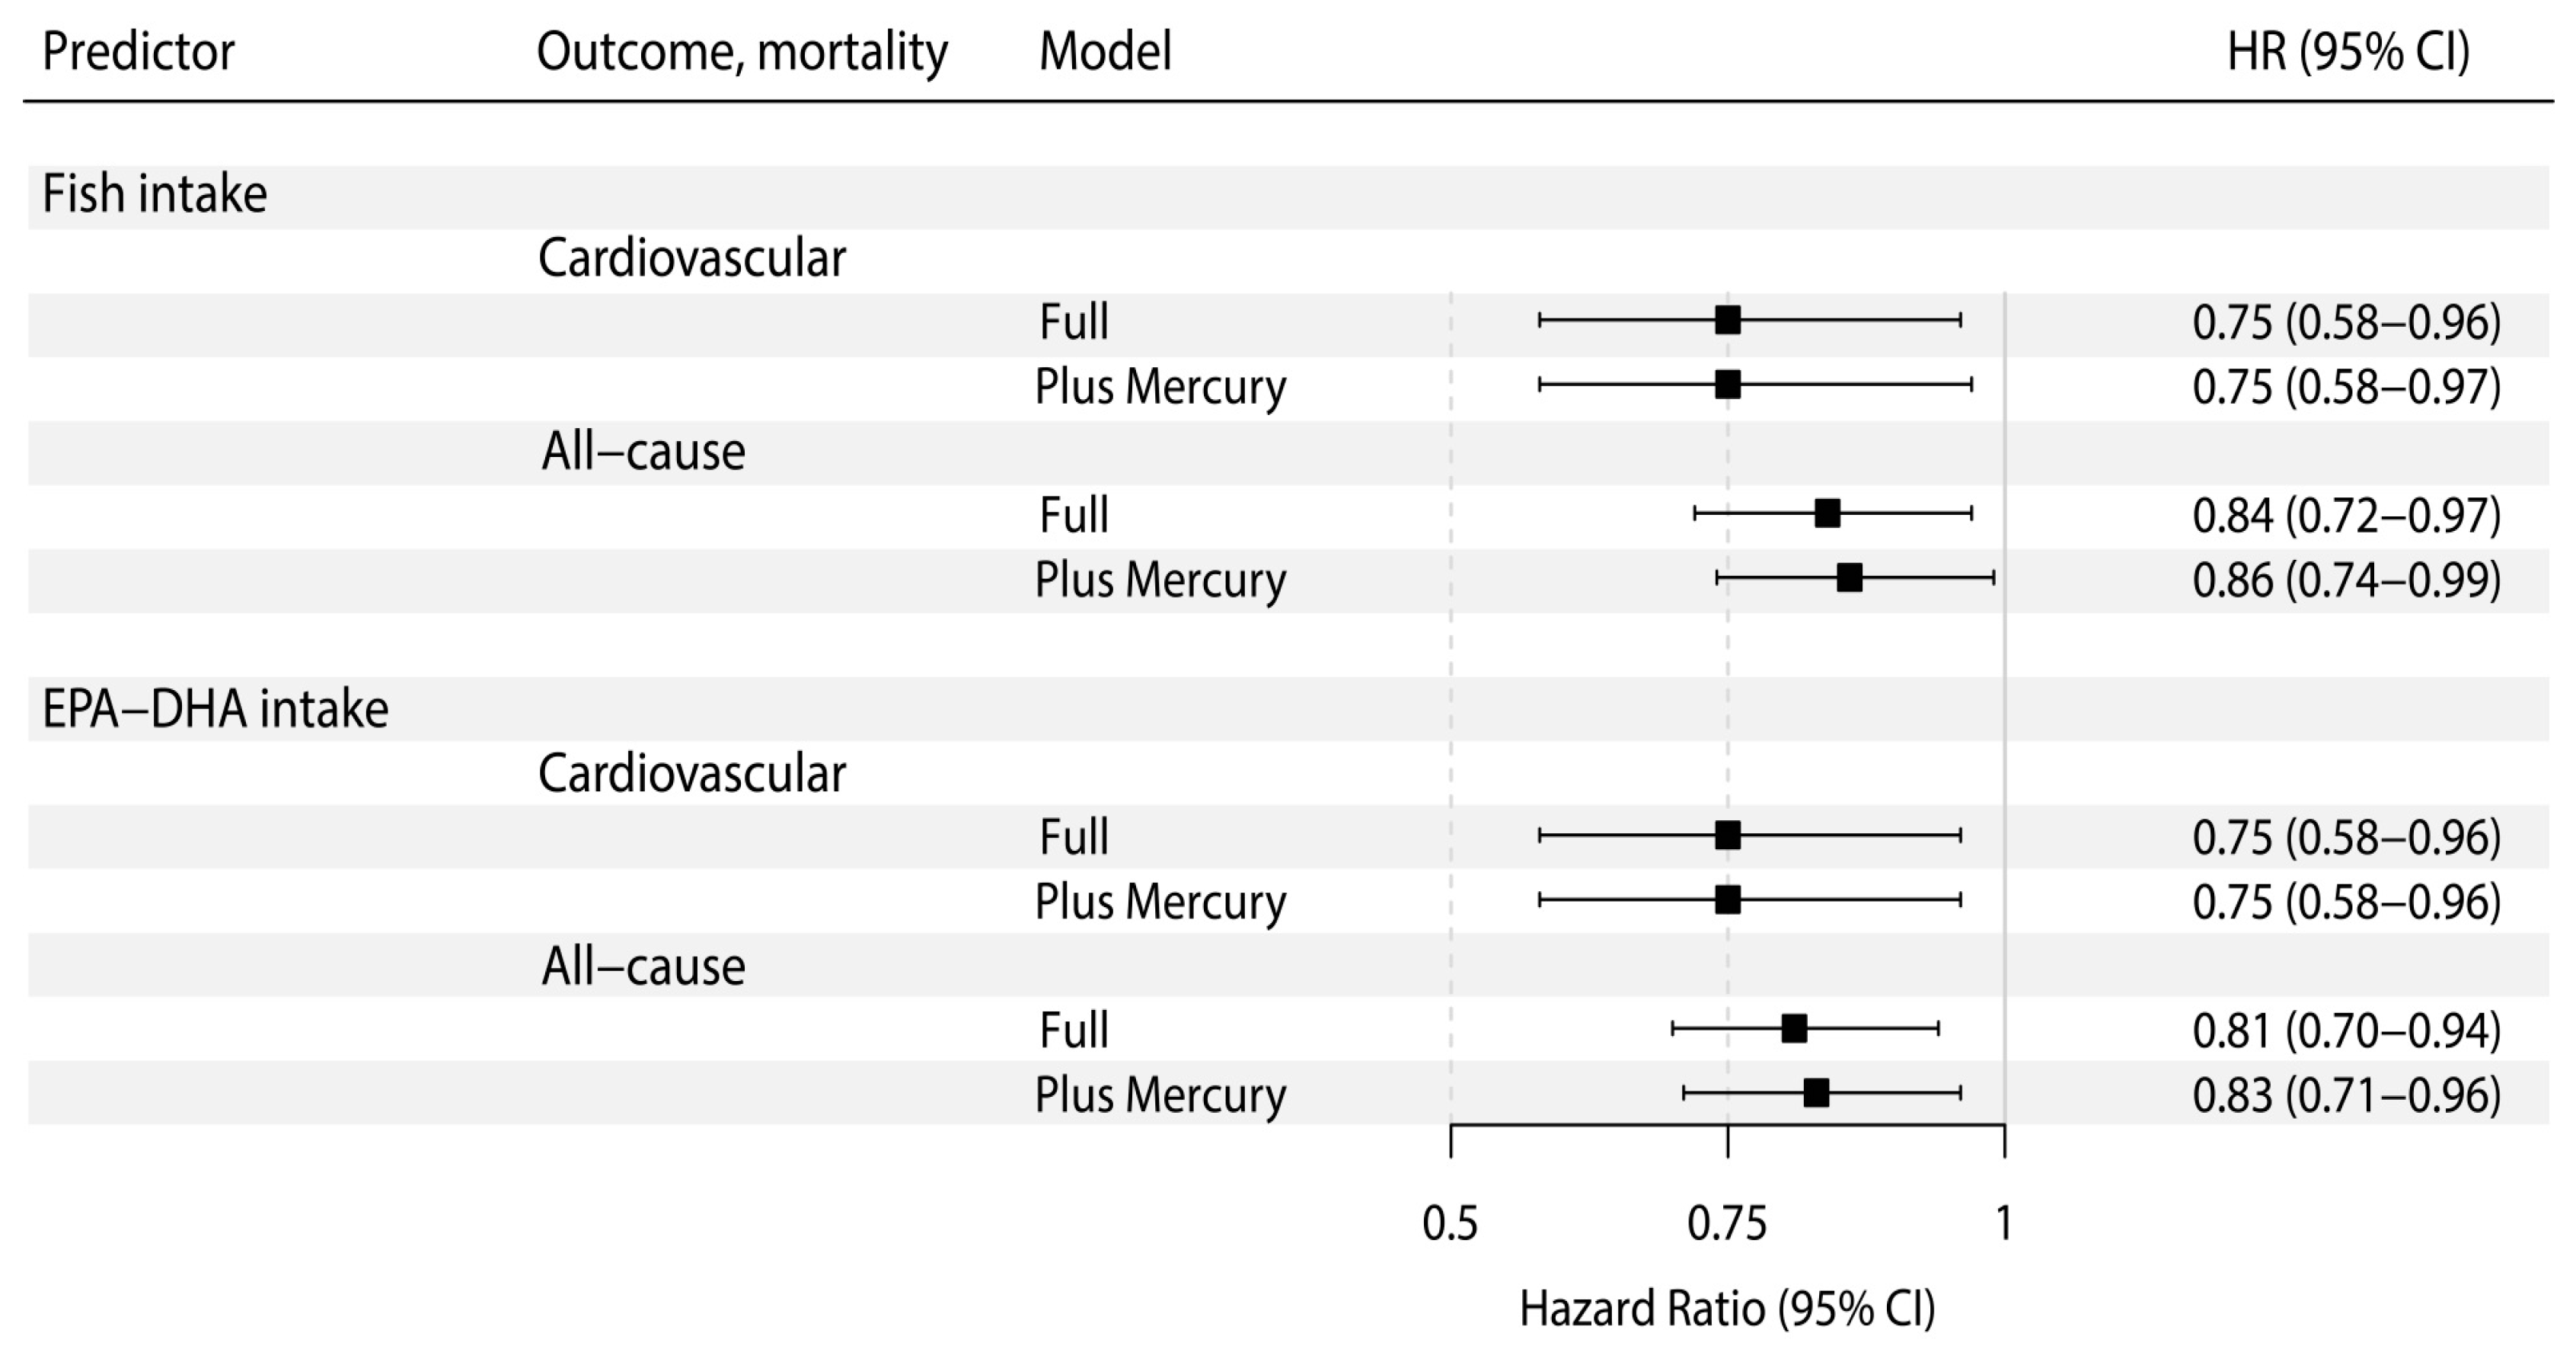
| Fish Intake, 10 g per day | Fish Intake, 10 g per day * | |||||
|---|---|---|---|---|---|---|
| HR | 95% CI | p | HR | 95% CI | p | |
| Cardiovascular mortality | ||||||
| Model 1 | 0.82 | 0.64–1.03 | 0.09 | 0.82 | 0.65–1.04 | 0.10 |
| Model 2 | 0.80 | 0.62–1.03 | 0.08 | 0.80 | 0.62–1.04 | 0.09 |
| Model 3 | 0.75 | 0.58–0.96 | 0.03 | 0.75 | 0.58–0.97 | 0.03 |
| Model 4 | 0.76 | 0.60–0.98 | 0.04 | 0.77 | 0.59–0.99 | 0.04 |
| Model 5 | 0.76 | 0.58–0.98 | 0.04 | 0.76 | 0.58–0.99 | 0.04 |
| All-cause mortality | ||||||
| Model 1 | 0.88 | 0.76–1.01 | 0.06 | 0.90 | 0.78–1.03 | 0.12 |
| Model 2 | 0.87 | 0.75–1.00 | 0.05 | 0.89 | 0.77–1.03 | 0.11 |
| Model 3 | 0.84 | 0.72–0.97 | 0.02 | 0.86 | 0.74–0.99 | 0.04 |
| Model 4 | 0.84 | 0.73–0.98 | 0.02 | 0.87 | 0.75–1.00 | 0.05 |
| Model 5 | 0.84 | 0.73–0.98 | 0.02 | 0.86 | 0.74–1.00 | 0.05 |
| Marine-Derived n-3 PUFAs Intake, 100 mg per day | Marine-Derived n-3 PUFAs Intake, 100 mg per day * | |||||
|---|---|---|---|---|---|---|
| HR | 95% CI | p | HR | 95% CI | p | |
| Cardiovascular mortality | ||||||
| Model 1 | 0.83 | 0.66–1.03 | 0.09 | 0.83 | 0.66–1.04 | 0.10 |
| Model 2 | 0.80 | 0.63–1.02 | 0.07 | 0.80 | 0.62–1.02 | 0.08 |
| Model 3 | 0.75 | 0.58–0.96 | 0.02 | 0.75 | 0.58–0.96 | 0.02 |
| Model 4 | 0.76 | 0.59–0.97 | 0.03 | 0.76 | 0.59–0.98 | 0.03 |
| Model 5 | 0.77 | 0.60–0.99 | 0.04 | 0.78 | 0.60–1.00 | 0.05 |
| All-cause mortality | ||||||
| Model 1 | 0.87 | 0.76–0.99 | 0.03 | 0.88 | 0.77–1.01 | 0.06 |
| Model 2 | 0.84 | 0.73–0.97 | 0.02 | 0.86 | 0.74–0.99 | 0.04 |
| Model 3 | 0.81 | 0.70–0.94 | 0.01 | 0.83 | 0.71–0.96 | 0.01 |
| Model 4 | 0.82 | 0.70–0.95 | 0.01 | 0.83 | 0.72–0.97 | 0.02 |
| Model 5 | 0.83 | 0.72–0.96 | 0.01 | 0.85 | 0.73–0.98 | 0.03 |
© 2018 by the authors. Licensee MDPI, Basel, Switzerland. This article is an open access article distributed under the terms and conditions of the Creative Commons Attribution (CC BY) license (http://creativecommons.org/licenses/by/4.0/).
Share and Cite
Sotomayor, C.G.; Gomes-Neto, A.W.; Gans, R.O.B.; De Borst, M.H.; Berger, S.P.; Rodrigo, R.; Navis, G.J.; Touw, D.J.; Bakker, S.J.L. Fish Intake, Circulating Mercury and Mortality in Renal Transplant Recipients. Nutrients 2018, 10, 1419. https://doi.org/10.3390/nu10101419
Sotomayor CG, Gomes-Neto AW, Gans ROB, De Borst MH, Berger SP, Rodrigo R, Navis GJ, Touw DJ, Bakker SJL. Fish Intake, Circulating Mercury and Mortality in Renal Transplant Recipients. Nutrients. 2018; 10(10):1419. https://doi.org/10.3390/nu10101419
Chicago/Turabian StyleSotomayor, Camilo G., António W. Gomes-Neto, Rijk O. B. Gans, Martin H. De Borst, Stefan P. Berger, Ramón Rodrigo, Gerjan J. Navis, Daan J. Touw, and Stephan J. L. Bakker. 2018. "Fish Intake, Circulating Mercury and Mortality in Renal Transplant Recipients" Nutrients 10, no. 10: 1419. https://doi.org/10.3390/nu10101419