Magnesium Intake and Sleep Disorder Symptoms: Findings from the Jiangsu Nutrition Study of Chinese Adults at Five-Year Follow-Up

 ,
,  , and
, and 
Abstract
1. Introduction
2. Materials and Methods
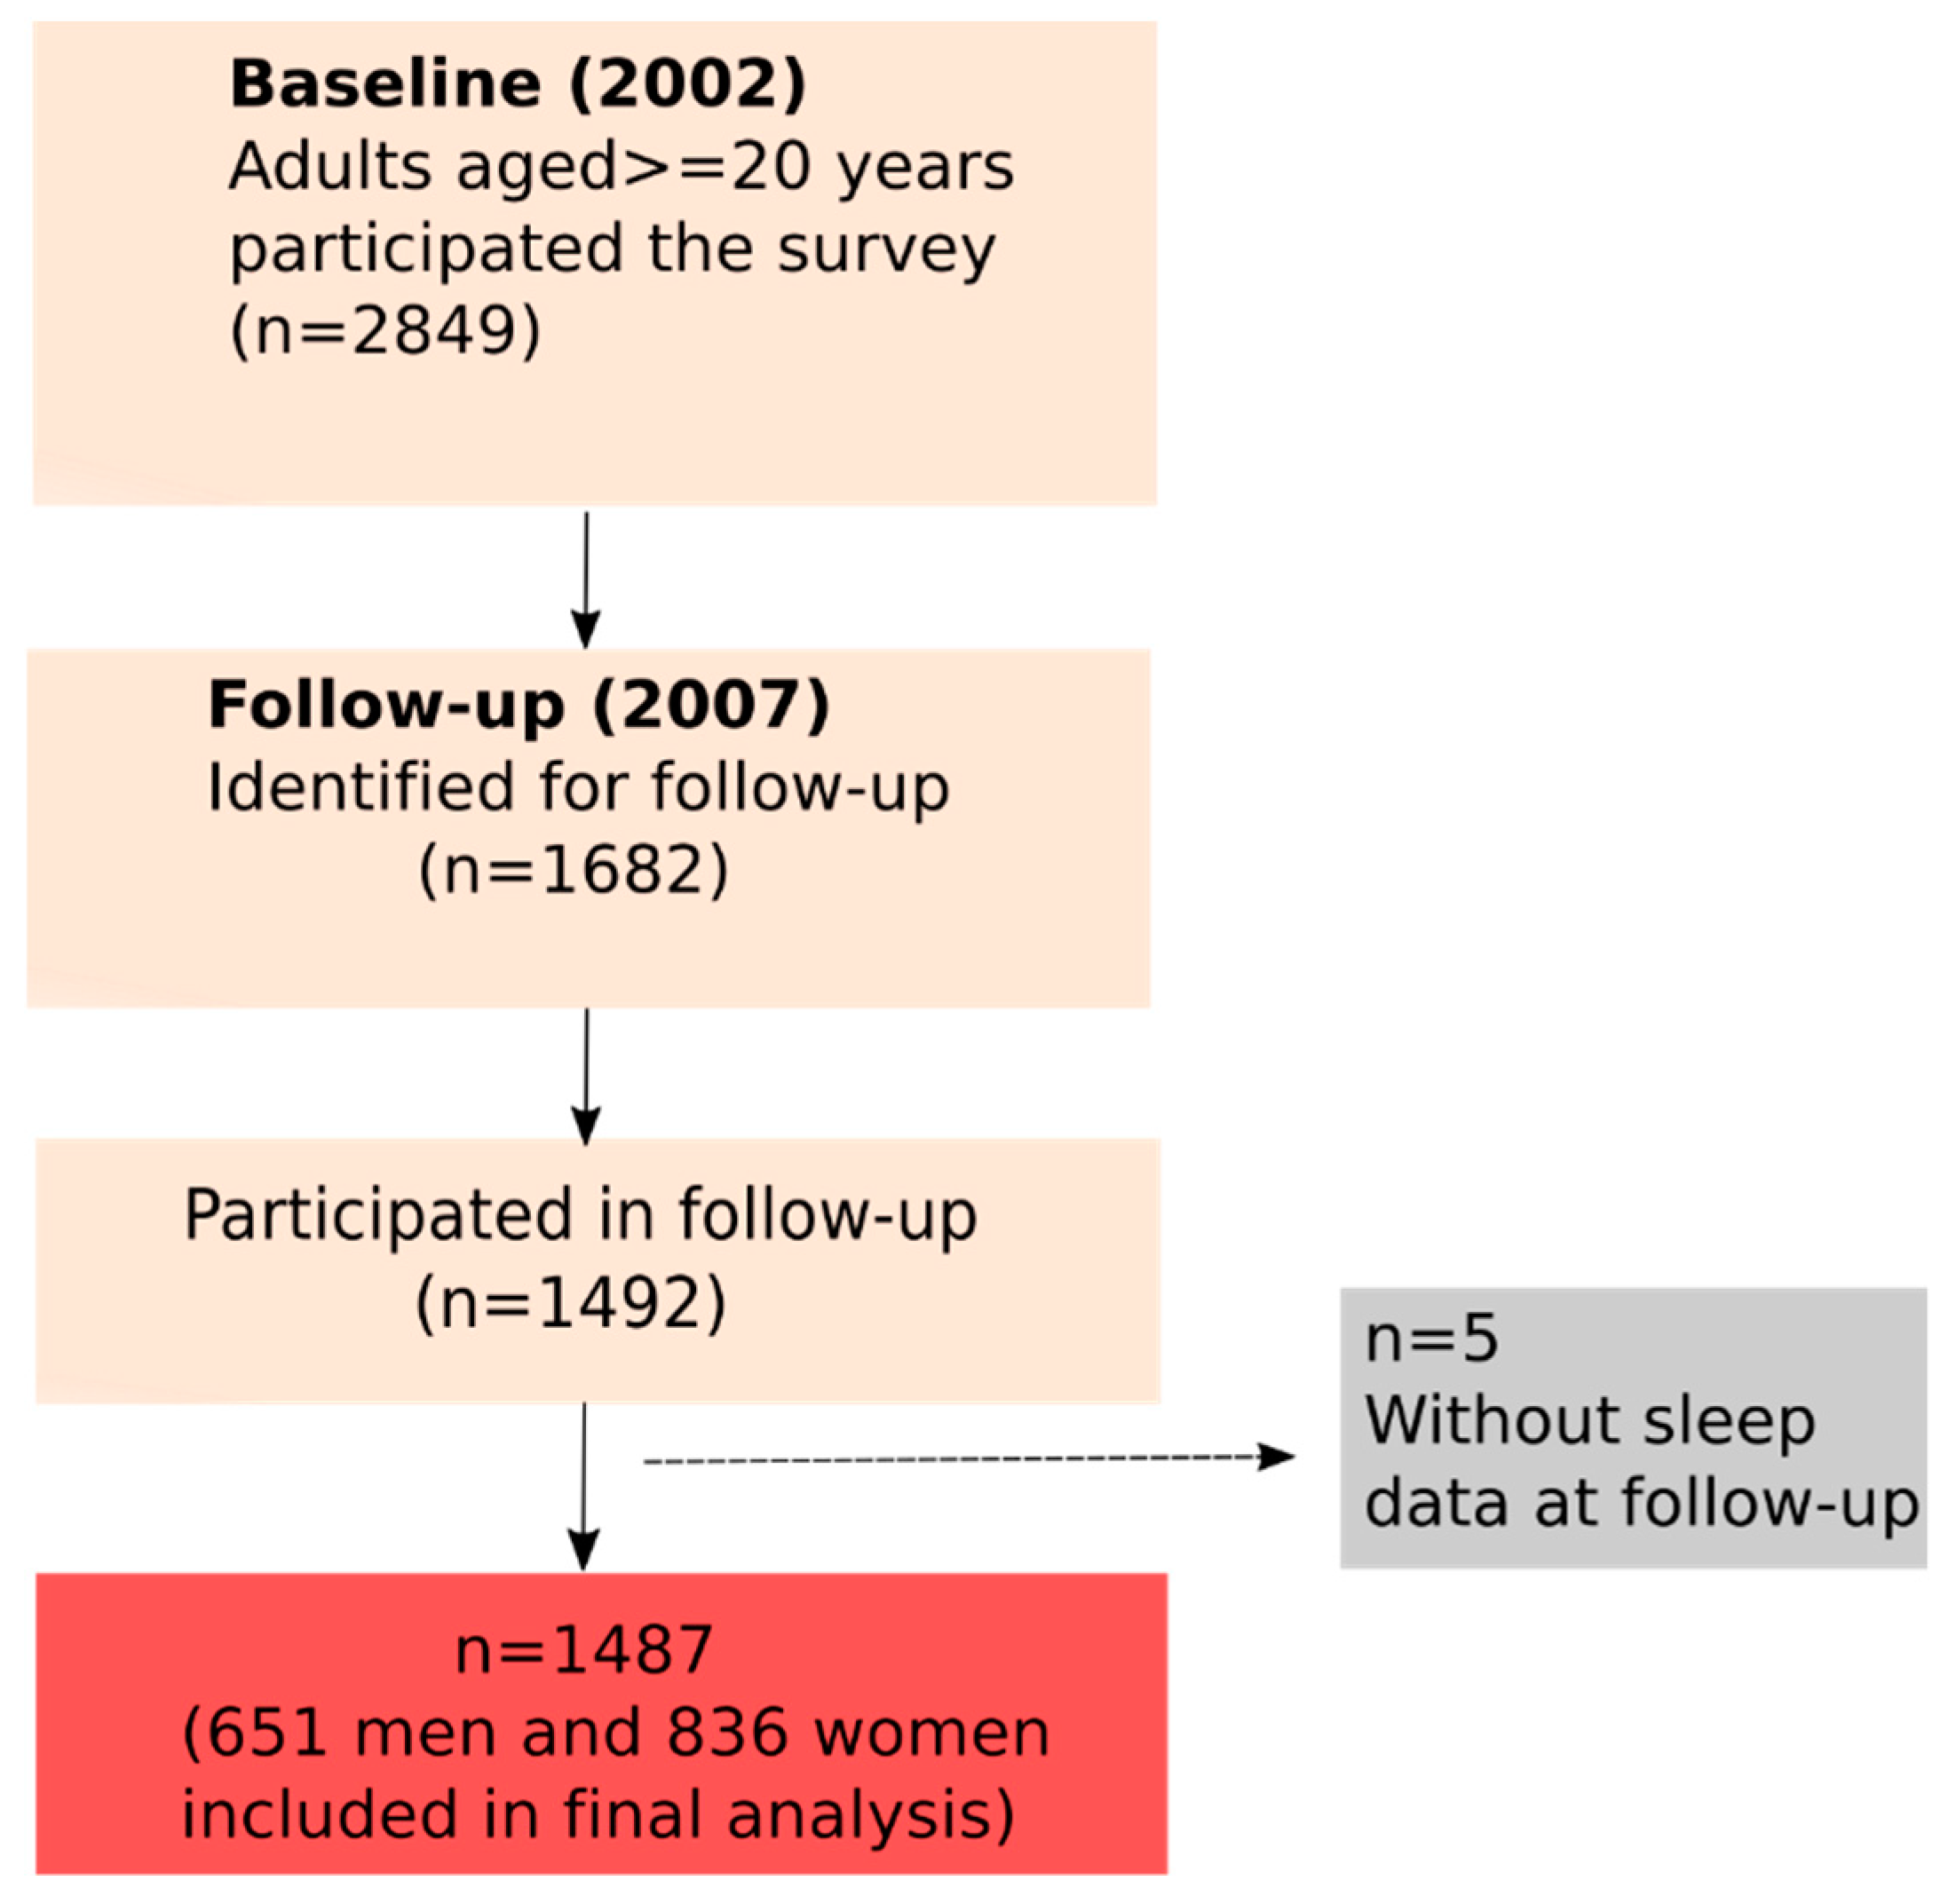
2.1. Subjects
2.2. Data Collection and Measurements
2.3. Dietary Measurements
2.4. Sleep Measurement
2.5. Anthropometric Measurement and Other Variables
2.6. Covariates
2.7. Statistical Analysis
3. Results
4. Discussion
5. Conclusions
Author Contributions
Funding
Acknowledgments
Conflicts of Interest
References
- Moore, R.Y. Suprachiasmatic nucleus in sleep-wake regulation. Sleep Med. 2007, 8 (Suppl. 3), 27–33. [Google Scholar] [CrossRef] [PubMed]
- Cappuccio, F.P.; D’elia, L.; Strazzullo, P.; Miller, M.A. Quantity and quality of sleep and incidence of type 2 diabetes: A systematic review and meta-analysis. Diabetes Care 2010, 33, 414–420. [Google Scholar] [CrossRef] [PubMed]
- Reimer, M.A.; Flemons, W.W. Quality of life in sleep disorders. Sleep Med. Rev. 2003, 7, 335–349. [Google Scholar] [CrossRef] [PubMed]
- St-Onge, M.P.; Roberts, A.; Shechter, A.; Choudhury, A.R. Fiber and Saturated Fat Are Associated with Sleep Arousals and Slow Wave Sleep. J. Clin. Sleep Med. 2016, 12, 19–24. [Google Scholar] [CrossRef] [PubMed]
- Cao, Y.; Wittert, G.; Taylor, A.W.; Adams, R.; Shi, Z. Associations between Macronutrient Intake and Obstructive Sleep Apnoea as Well as Self-Reported Sleep Symptoms: Results from a Cohort of Community Dwelling Australian Men. Nutrients 2016, 8, 207. [Google Scholar] [CrossRef] [PubMed]
- Afaghi, A.; O’connor, H.; Chow, C.M. High-glycemic-index carbohydrate meals shorten sleep onset. Am. J. Clin. Nutr. 2007, 85, 426–430. [Google Scholar] [CrossRef] [PubMed]
- Ji, X. The relationship between micronutrient status and sleep patterns: A systematic review. Public Health Nutr. 2017, 20, 687–701. [Google Scholar] [CrossRef] [PubMed]
- Wacker, W.E.; Parisi, A.F. Magnesium metabolism. N. Engl. J. Med. 1968, 278, 658–663. [Google Scholar] [CrossRef] [PubMed]
- Feeney, K.A.; Hansen, L.L.; Putker, M.; Olivares-Yañez, C.; Day, J.; Eades, L.J.; Larrondo, L.F.; Hoyle, N.P.; O’Neill, J.S.; van Ooijen, G. Daily magnesium fluxes regulate cellular timekeeping and energy balance. Nature 2016, 532, 375–379. [Google Scholar] [CrossRef] [PubMed]
- Abbasi, B.; Kimiagar, M.; Sadeghniiat, K.; Shirazi, M.M.; Hedayati, M.; Rashidkhani, B. The effect of magnesium supplementation on primary insomnia in elderly: A double-blind placebo-controlled clinical trial. J. Res. Med. Sci. 2012, 17, 1161–1169. [Google Scholar] [PubMed]
- Tarleton, E.K.; Littenberg, B. Magnesium intake and depression in adults. J. Am. Board Fam. Med. 2015, 28, 249–256. [Google Scholar] [CrossRef] [PubMed]
- Shi, Z.; Luscombe-Marsh, N.D.; Wittert, G.A.; Yuan, B.; Dai, Y.; Pan, X.; Taylor, A.W. Monosodium glutamate is not associated with obesity or a greater prevalence of weight gain over 5 years: Findings from the Jiangsu Nutrition Study of Chinese adults. Br. J. Nutr. 2010, 104, 457–463. [Google Scholar] [CrossRef] [PubMed]
- Shi, Z.; McEvoy, M.; Luu, J.; Attia, J. Dietary fat and sleep duration in Chinese men and women. Int. J. Obes. 2008, 32, 1835–1840. [Google Scholar] [CrossRef] [PubMed]
- Yang, Y.; He, M.; Pan, X. China Food Composition Table; China Institute of Nutrition and Food Safety, China CDC: Beijing, China, 2002. [Google Scholar]
- Chen, C.M.; Lu, F.C. Department of Disease Control Ministry of Health, The guidelines for prevention and control of overweight and obesity in Chinese adults. Biomed. Environ. Sci. 2004, 17, 1–36. [Google Scholar] [PubMed]
- Shi, Z.; Zhen, S.; Wittert, G.A.; Yuan, B.; Zuo, H.; Taylor, A.W. Inadequate riboflavin intake and anemia risk in a Chinese population: Five-year follow up of the Jiangsu Nutrition Study. PLoS ONE 2014, 9, e88862. [Google Scholar] [CrossRef] [PubMed]
- Villegas, R.; Gao, Y.T.; Dai, Q.; Yang, G.; Cai, H.; Li, H.; Zheng, W.; Shu, X.O. Dietary calcium and magnesium intakes and the risk of type 2 diabetes: The Shanghai Women’s Health Study. Am. J. Clin. Nutr. 2009, 89, 1059–1067. [Google Scholar] [CrossRef] [PubMed]
- China Light Industry Publishing House. China Nutrition Society. Chinese Dietary Reference Intakes; China Light Industry Publishing House: Beijing, China, 2000. [Google Scholar]
- Zhang, R.; Wang, Z.; Fei, Y.; Zhou, B.; Zheng, S.; Wang, L.; Huang, L.; Jiang, S.; Liu, Z.; Jiang, J.; et al. The Difference in Nutrient Intakes between Chinese and Mediterranean, Japanese and American Diets. Nutrients 2015, 7, 4661–4688. [Google Scholar] [CrossRef] [PubMed]
- Li, Y.; Ma, A.; Sun, Y.; Liang, H.; Wang, Q.; Yi, X.; Han, X. Magnesium status and dietary intake of mid-old people in a rural area of China. Magnes Res. 2009, 22, 66–71. [Google Scholar] [PubMed]
- Grandner, M.A.; Jackson, N.; Gerstner, J.R.; Knutson, K.L. Dietary nutrients associated with short and long sleep duration. Data from a nationally representative sample. Appetite 2013, 64, 71–80. [Google Scholar] [CrossRef] [PubMed]
- Depoortere, H.; Francon, D.; Llopis, J. Effects of a magnesium-deficient diet on sleep organization in rats. Neuropsychobiology 1993, 27, 237–245. [Google Scholar] [CrossRef] [PubMed]
- Yary, T.; Lehto, S.M.; Tolmunen, T.; Tuomainen, T.P.; Kauhanen, J.; Voutilainen, S.; Ruusunen, A. Dietary magnesium intake and the incidence of depression: A 20-year follow-up study. J. Affect. Disord. 2016, 193, 94–98. [Google Scholar] [CrossRef] [PubMed]
- Singewald, N.; Sinner, C.; Hetzenauer, A.; Sartori, S.B.; Murck, H. Magnesium-deficient diet alters depression- and anxiety-related behavior in mice—Influence of desipramine and Hypericum perforatum extract. Neuropharmacology 2004, 47, 1189–1197. [Google Scholar] [CrossRef] [PubMed]
- Mallampalli, M.P.; Carter, C.L. Exploring sex and gender differences in sleep health: A Society for Women’s Health Research Report. J. Womens Health (Larchmt) 2014, 23, 553–562. [Google Scholar] [CrossRef] [PubMed]
- Tarnopolsky, M.A. Gender differences in metabolism; nutrition and supplements. J. Sci. Med. Sport 2000, 3, 287–298. [Google Scholar] [CrossRef]
- Leblanc, V.; Bégin, C.; Corneau, L.; Dodin, S.; Lemieux, S. Gender differences in dietary intakes: What is the contribution of motivational variables? J. Hum. Nutr. Diet. 2015, 28, 37–46. [Google Scholar] [CrossRef] [PubMed]
- Leblanc, V.; Bégin, C.; Hudon, A.M.; Royer, M.M.; Corneau, L.; Dodin, S.; Lemieux, S. Gender differences in the long-term effects of a nutritional intervention program promoting the Mediterranean diet: Changes in dietary intakes, eating behaviors, anthropometric and metabolic variables. Nutr. J. 2014, 13, 107. [Google Scholar] [CrossRef] [PubMed]
- Kessler, R.C.; McGonagle, K.A.; Swartz, M.; Blazer, D.G.; Nelson, C.B. Sex and depression in the National Comorbidity Survey. I: Lifetime prevalence, chronicity and recurrence. J. Affect. Disord. 1993, 29, 85–96. [Google Scholar] [CrossRef]
- Silverstein, B. Gender difference in the prevalence of clinical depression: The role played by depression associated with somatic symptoms. Am. J. Psychiatry 1999, 156, 480–482. [Google Scholar] [PubMed]
- Guo, L.; Deng, J.; He, Y.; Deng, X.; Huang, J.; Huang, G.; Gao, X.; Lu, C. Prevalence and correlates of sleep disturbance and depressive symptoms among Chinese adolescents: A cross-sectional survey study. BMJ Open 2014, 4, e005517. [Google Scholar] [CrossRef] [PubMed]
- Tarleton, E.K.; Littenberg, B.; MacLean, C.D.; Kennedy, A.G.; Daley, C. Role of magnesium supplementation in the treatment of depression: A randomized clinical trial. PLoS ONE 2017, 12, e0180067. [Google Scholar] [CrossRef] [PubMed]
- Shi, Z.; Hu, X.; He, K.; Yuan, B.; Garg, M. Joint association of magnesium and iron intake with anemia among Chinese adults. Nutrition 2008, 24, 977–984. [Google Scholar] [CrossRef] [PubMed]
- Semiz, M.; Uslu, A.; Korkmaz, S.; Demir, S.; Parlak, I.; Sencan, M.; Aydin, B.; Uncu, T. Assessment of subjective sleep quality in iron deficiency anaemia. Afr. Health Sci. 2015, 15, 621–627. [Google Scholar] [CrossRef] [PubMed]


| Quartiles of Magnesium Consumption (mg/day) | ||||||||||
|---|---|---|---|---|---|---|---|---|---|---|
| Men | Women | |||||||||
| Factors | Q1 (n = 163) | Q2 (n = 163) | Q3 (n = 163) | Q4 (n = 162) | p-Value | Q1 (n = 209) | Q2 (n = 209) | Q3 (n = 209) | Q4 (n = 209) | p-Value |
| Nutrients consumption | ||||||||||
| * Magnesium consumption (mg/day) | 219 (30.3) | 288 (16.4) | 350 (20.6) | 505 (122) | <0.001 | 186 (27.7) | 244 (13.1) | 301 (21.4) | 462 (132) | <0.001 |
| (124–259) | (259–315) | (315–392) | (392–1015) | (79–222) | (222–267) | (267–339) | (339–1157) | |||
| Carbohydrate (g/day) | 259 (62.1) | 317 (63.0) | 353 (86.3) | 427 (101) | <0.001 | 219 (56.5) | 277 (60.7) | 318 (65.9) | 392 (102) | <0.001 |
| Protein (g/d) | 61.3 (13.9) | 73.5 (14.9) | 84.3 (15.6) | 101.0 (23.5) | <0.001 | 51.5 (14.5) | 60.9 (13.5) | 69.1 (11.2) | 85.5 (23.7) | <0.001 |
| Fat (g/day) | 73.5 (26.7) | 84.7 (32.1) | 97.3 (36.4) | 104.6 (43.6) | <0.001 | 63.1 (23.3) | 70.6 (26.9) | 74.9 (28.1) | 88.6 (42.5) | <0.001 |
| Energy consumption (kcal) | 1968 (408) | 2389 (437) | 2700 (469) | 3195 (599) | <0.001 | 1639 (367) | 1976 (342) | 2211 (344) | 2707 (596) | <0.001 |
| Age (years) | 51.6 (14.1) | 49.6 (13.7) | 48.4 (13.0) | 48.8 (13.0) | 0.13 | 50.2 (14.8) | 48.3 (13.9) | 47.0 (12.1) | 46.9 (12.2) | 0.042 |
| BMI (kg/m2) | 23.8 (2.9) | 23.6 (3.6) | 23.1 (3.0) | 22.7 (3.1) | 0.013 | 23.5 (3.6) | 23.3 (3.9) | 23.9 (3.6) | 23.7 (3.3) | 0.29 |
| Income (%) | <0.001 | <0.001 | ||||||||
| Low | 20.4 | 15.5 | 18.9 | 37.9 | 14.9 | 21.7 | 20.3 | 46.6 | ||
| Medium | 32.7 | 39.8 | 32.1 | 27.3 | 38.0 | 38.2 | 38.6 | 24.8 | ||
| High | 46.9 | 44.7 | 49.1 | 34.8 | 47.1 | 40.1 | 41.1 | 28.6 | ||
| Education (%) | 0.19 | 0.004 | ||||||||
| Primary school | 44.2 | 35.6 | 33.7 | 45.1 | 55.0 | 52.6 | 61.7 | 71.6 | ||
| Junior middle school | 38.7 | 47.2 | 45.4 | 40.1 | 31.1 | 36.4 | 27.8 | 23.1 | ||
| Senior middle school | 11.7 | 14.7 | 17.8 | 13.0 | 12.9 | 10.0 | 10.5 | 4.8 | ||
| University | 5.5 | 2.5 | 3.1 | 1.9 | 1.0 | 1.0 | 0.0 | 0.5 | ||
| Smoking (%) | 58.9 | 61.3 | 55.8 | 64.8 | 0.40 | 2.9 | 3.8 | 1.0 | 4.3 | 0.19 |
| Alcohol consumption (%) | 0.002 | 0.17 | ||||||||
| Never | 62.0 | 50.3 | 43.8 | 40.4 | 95.7 | 97.1 | 94.7 | 91.9 | ||
| 1–2/week | 11.7 | 14.1 | 8.0 | 12.4 | 1.4 | 1.9 | 1.4 | 1.9 | ||
| 3–4/week | 7.4 | 7.4 | 8.6 | 8.7 | 1.0 | 1.0 | 1.9 | 1.4 | ||
| Daily | 19.0 | 28.2 | 39.5 | 38.5 | 1.9 | 0.0 | 1.9 | 4.8 | ||
| Sedentary activity (%) | 0.057 | 0.23 | ||||||||
| <1 h | 11.0 | 6.7 | 8.6 | 16.7 | 14.4 | 19.6 | 19.1 | 23.0 | ||
| 1–2 h | 23.9 | 30.1 | 24.5 | 32.1 | 27.8 | 30.1 | 33.5 | 34.0 | ||
| 2–3 h/day | 48.5 | 47.9 | 47.2 | 39.5 | 43.1 | 39.7 | 36.8 | 33.5 | ||
| ≥3 h/day | 16.6 | 15.3 | 19.6 | 11.7 | 14.8 | 10.5 | 10.5 | 9.6 | ||
| Manual occupation (%) | 34.0 | 50.3 | 52.8 | 63.0 | <0.001 | 28.2 | 50.7 | 54.1 | 66.0 | <0.001 |
| Region (%) | <0.001 | <0.001 | ||||||||
| Urban | 36.2 | 18.4 | 12.3 | 9.3 | 34.4 | 17.2 | 9.1 | 8.1 | ||
| Rural | 63.8 | 81.6 | 87.7 | 90.7 | 65.6 | 82.8 | 90.9 | 91.9 | ||
| Quartiles of Magnesium Consumption (mg/day) | ||||||||||
|---|---|---|---|---|---|---|---|---|---|---|
| Men | Women | |||||||||
| Sleep variables | Q1 (n = 163) | Q2 (n = 163) | Q3 (n = 163) | Q4 (n = 162) | p-Value | Q1 (n = 209) | Q2 (n = 209) | Q3 (n = 209) | Q4 (n = 209) | p-Value |
| Sleep duration (%), (baseline) | ||||||||||
| 7–8 h/day | 64.2 | 77.0 | 68.3 | 64.2 | 0.19 | 71.2 | 69.9 | 66.7 | 67.0 | 0.11 |
| <7 h/day | 16.7 | 11.2 | 13.0 | 16.0 | 13.5 | 13.1 | 9.7 | 8.6 | ||
| ≥9 h/day | 19.1 | 11.8 | 18.6 | 19.8 | 15.4 | 17.0 | 23.7 | 24.4 | ||
| Sleep duration (%), (follow-up) | 0.27 | 0.039 | ||||||||
| 7–8 h/day | 74.2 | 65.4 | 70.6 | 73.5 | 65.1 | 63.5 | 65.6 | 72.2 | ||
| <7 h/day | 17.8 | 21.0 | 16.0 | 19.1 | 25.4 | 20.7 | 18.7 | 13.4 | ||
| 9–13 h/day | 8.0 | 13.6 | 13.5 | 7.4 | 9.6 | 15.9 | 15.8 | 14.4 | ||
| Falling sleep (%) | 4.9 | 8.6 | 5.0 | 3.7 | 0.24 | 8.7 | 4.4 | 5.3 | 1.9 | 0.018 |
| Daytime sleepiness (%) | 12.3 | 14.7 | 14.3 | 13.6 | 0.92 | 15.9 | 13.0 | 9.6 | 12.9 | 0.29 |
| Snore (%) | 47.5 | 51.5 | 49.7 | 46.3 | 0.79 | 26.8 | 26.6 | 26.3 | 22.5 | 0.71 |
| Magnesium Consumption (mg/day) | |||||
|---|---|---|---|---|---|
| Sleep disorder symptoms | Men | ||||
| Falling asleep | n | Q1 (n = 163) | Q2 (n = 163) | Q3 (n = 163) | Q4 (n = 162) |
| Model 1 | 645 | 1.00 | 1.89 (0.73, 4.86) | 1.07 (0.35, 3.34) | 0.80 (0.20, 3.22) |
| Model 2 | 635 | 1.00 | 2.32 (0.86, 6.27) | 1.32 (0.40, 4.34) | 1.38 (0.33, 5.73) |
| Model 3 | 607 | 1.00 | 2.53 (0.93, 6.90) | 1.32 (0.40, 4.34) | 1.44 (0.34, 6.04) |
| Model 4 | 606 | 1.00 | 2.51 (0.91, 6.91) | 1.20 (0.36, 4.06) | 1.36 (0.31, 5.98) |
| Women | |||||
| Q1 (n = 209) | Q2 (n = 209) | Q3 (n = 209) | Q4 (n = 209) | ||
| Model 1 | 831 | 1.00 | 0.40 (0.17, 0.94) * | 0.43 (0.18, 1.05) | 0.10 (0.02, 0.43) ** |
| Model 2 | 795 | 1.00 | 0.35 (0.14, 0.87) * | 0.41 (0.16, 1.04) | 0.10 (0.02, 0.47) ** |
| Model 3 | 795 | 1.00 | 0.32 (0.13, 0.81) * | 0.37 (0.14, 0.97) * | 0.09 (0.02, 0.43) ** |
| Model 4 | 792 | 1.00 | 0.34 (0.14, 0.87) * | 0.42 (0.16, 1.09) | 0.11 (0.02, 0.57) ** |
| Men | |||||
| Daytime sleepiness | n | Q1 (n = 163) | Q2 (n = 163) | Q3 (n = 163) | Q4 (n = 162) |
| Model 1 | 649 | 1.00 | 1.30 (0.70, 2.42) | 1.34 (0.68, 2.63) | 1.36 (0.61, 3.03) |
| Model 2 | 639 | 1.00 | 1.33 (0.71, 2.49) | 1.38 (0.69, 2.78) | 1.54 (0.68, 3.49) |
| Model 3 | 638 | 1.00 | 1.33 (0.70, 2.50) | 1.41 (0.70, 2.83) | 1.64 (0.72, 3.70) |
| Model 4 | 637 | 1.00 | 1.32 (0.69, 2.50) | 1.39 (0.68, 2.83) | 1.62 (0.69, 3.80) |
| Women | |||||
| Q1 (n = 209) | Q2 (n = 209) | Q3 (n = 209) | Q4 (n = 209) | ||
| Model 1 | 834 | 1.00 | 0.84 (0.50, 1.43) | 0.64 (0.34, 1.17) | 0.87 (0.43, 1.73) |
| Model 2 | 825 | 1.00 | 0.83 (0.49, 1.42) | 0.63 (0.34, 1.17) | 0.98 (0.47, 2.02) |
| Model 3 | 825 | 1.00 | 0.83 (0.48, 1.42) | 0.62 (0.33, 1.16) | 0.99 (0.48, 2.05) |
| Model 4 | 821 | 1.00 | 0.84 (0.49, 1.44) | 0.61 (0.33, 1.14) | 1.00 (0.47, 2.08) |
| Men | |||||
| Snoring | n | Q1 (n = 163) | Q2 (n = 163) | Q3 (n = 163) | Q4 (n = 162) |
| Model 1 | 645 | 1.00 | 1.12 (0.81, 1.55) | 1.11 (0.78, 1.58) | 1.06 (0.69, 1.61) |
| Model 2 | 635 | 1.00 | 1.06 (0.76, 1.47) | 1.07 (0.74, 1.55) | 1.11 (0.72, 1.71) |
| Model 3 | 607 | 1.00 | 1.05 (0.75, 1.47) | 1.10 (0.76, 1.59) | 1.15 (0.74, 1.80) |
| Model 4 | 607 | 1.00 | 1.04 (0.75, 1.46) | 1.08 (0.74, 1.56) | 1.10 (0.70, 1.75) |
| Women | |||||
| Q1 (n = 209) | Q2 (n = 209) | Q3 (n = 209) | Q4 (n = 209) | ||
| Model 1 | 834 | 1.00 | 0.95 (0.65, 1.40) | 0.93 (0.61, 1.40) | 0.71 (0.42, 1.20) |
| Model 2 | 825 | 1.00 | 0.97 (0.65, 1.43) | 0.94 (0.62, 1.44) | 0.80 (0.46, 1.37) |
| Model 3 | 825 | 1.00 | 1.00 (0.68, 1.49) | 0.91 (0.59, 1.39) | 0.85 (0.50, 1.46) |
| Model 4 | 821 | 1.00 | 1.01 (0.68, 1.49) | 0.91 (0.60, 1.39) | 0.89 (0.52, 1.55) |
© 2018 by the authors. Licensee MDPI, Basel, Switzerland. This article is an open access article distributed under the terms and conditions of the Creative Commons Attribution (CC BY) license (http://creativecommons.org/licenses/by/4.0/).
Share and Cite
Cao, Y.; Zhen, S.; Taylor, A.W.; Appleton, S.; Atlantis, E.; Shi, Z. Magnesium Intake and Sleep Disorder Symptoms: Findings from the Jiangsu Nutrition Study of Chinese Adults at Five-Year Follow-Up. Nutrients 2018, 10, 1354. https://doi.org/10.3390/nu10101354
Cao Y, Zhen S, Taylor AW, Appleton S, Atlantis E, Shi Z. Magnesium Intake and Sleep Disorder Symptoms: Findings from the Jiangsu Nutrition Study of Chinese Adults at Five-Year Follow-Up. Nutrients. 2018; 10(10):1354. https://doi.org/10.3390/nu10101354
Chicago/Turabian StyleCao, Yingting, Shiqi Zhen, Anne W. Taylor, Sarah Appleton, Evan Atlantis, and Zumin Shi. 2018. "Magnesium Intake and Sleep Disorder Symptoms: Findings from the Jiangsu Nutrition Study of Chinese Adults at Five-Year Follow-Up" Nutrients 10, no. 10: 1354. https://doi.org/10.3390/nu10101354
APA StyleCao, Y., Zhen, S., Taylor, A. W., Appleton, S., Atlantis, E., & Shi, Z. (2018). Magnesium Intake and Sleep Disorder Symptoms: Findings from the Jiangsu Nutrition Study of Chinese Adults at Five-Year Follow-Up. Nutrients, 10(10), 1354. https://doi.org/10.3390/nu10101354