Attributing Accelerated Summertime Warming in the Southeast United States to Recent Reductions in Aerosol Burden: Indications from Vertically-Resolved Observations
Abstract
:1. Introduction
2. Materials and Methods
2.1. Surface Temperature Trend Calculation
2.2. CALIOP Aerosol Retrievals for 2006–2014
2.3. Fu–Liou–Gu Radiative Transfer Model
3. Results and Discussion
3.1. Summertime Warmth Linked to Improved Air Quality
3.2. Modeling Results Corroborate Observations
4. Conclusions
Acknowledgments
Author Contributions
Conflicts of Interest
References
- Hansen, J.; Ruedy, R.; Sato, M.; Lo, K. Global surface temperature change. Rev. Geophys. 2010, 48, RG4004. [Google Scholar] [CrossRef]
- Portmann, R.W.; Solomon, S.; Hegerl, G.C. Spatial and seasonal patterns in climate change, temperatures, and precipitation across the United States. Proc. Natl. Acad. Sci. USA 2009, 106, 7324–7329. [Google Scholar] [CrossRef] [PubMed]
- Capparelli, V.; Franzke, C.; Vecchio, A.; Freeman, M.P.; Watkins, N.W.; Carbone, V. A spatiotemporal analysis of U.S. station temperature trends over the last century. J. Geophys. Res. 2013, 118, 7427–7434. [Google Scholar] [CrossRef]
- Melillo, J.M.; Richmond, T.C.; Yohe, G.W. Climate Change Impacts in the United States: The Third National Climate Assessment; Technical Report; U.S. Global Change Research Program: Washington, DC, USA, 2014.
- Liang, X.Z.; Pan, J.; Zhu, J.; Kunkel, K.E.; Wang, J.X.L.; Dai, A. Regional climate model downscaling of the U.S. summer climate and future change. J. Geophys. Res. 2006, 111, D10108. [Google Scholar] [CrossRef]
- Pan, Z.; Arritt, R.W.; Takle, E.S.; Gutowski, W.J., Jr.; Anderson, C.J.; Segal, M. Altered hydrologic feedback in a warming climate introduces a “warming hole”. Geophs. Res. Lett. 2004, 31, L17109. [Google Scholar] [CrossRef]
- Meehl, G.A.; Arblaster, J.M.; Branstator, G. Mechanisms contributing to the warming hole and the consequent U.S. East-West differential of heat extremes. J. Climate 2012, 25, 6394–6408. [Google Scholar] [CrossRef]
- Robinson, W.A.; Reudy, R.; Hansen, J.E. General circulation model simulations of recent cooling in the east-central United States. J. Geophys. Res. 2002, 107, 4748. [Google Scholar] [CrossRef]
- Yu, S.; Saxena, V.K.; Zhao, Z. A comparison of signals of regional aerosol-induced forcing in eastern China and the southeastern United States. Geophs. Res. Lett. 2001, 28. [Google Scholar] [CrossRef]
- Shindell, D.; Faluvegi, G. Climate respnose to regional radiative forcing during the twentieth century. Nature Geosci. 2009, 2, 294–300. [Google Scholar] [CrossRef]
- Leibensperger, E.M.; Mickley, L.J.; Jacob, D.J.; Chen, W.T.; Seinfeld, J.H.; Nenes, A.; Adams, P.J.; Streets, D.G.; Kumar, N.; Rind, D. Climatic effects of 1950–2050 changes in US anthropogenic aerosols—Part 2: Climate response. Atmos. Chem. Phys. 2012, 12, 3349–3362. [Google Scholar] [CrossRef]
- Mickley, L.J.; Leibensperger, E.M.; Jacob, D.J.; Rind, D. Regional warming from aerosol removal over the United States: Results from a transient 2010–2050 climate simulation. Atmos. Environ. 2012, 46, 545–553. [Google Scholar] [CrossRef]
- Yu, S.; Alapaty, K.; Mathur, R.; Pleim, J.; Zhang, Y.; Nolte, C.; Eder, B.; Foley, K.; Nagashima, T. Attribution of the United States “warming hole”: Aerosol indirect effect and precipitable water vapor. Sci. Rep. 2014, 4, 6929. [Google Scholar] [CrossRef] [PubMed]
- Leibensperger, E.M.; Mickley, L.J.; Jacob, D.J.; Chen, W.T.; Seinfeld, J.H.; Nenes, A.; Adams, P.J.; Streets, D.G.; Kumar, N.; Rind, D. Climatic effects of 1950–2050 changes in US anthropogenic aerosols—Part 1: Aerosol trends and radiative forcing. Atmos. Chem. Phys. 2012, 12, 3333–3348. [Google Scholar] [CrossRef]
- Liepert, B.G. Observed reductions of surface solar radiation at sites in the United States and worldwide from 1961 to 1990. Geophys. Res. Lett. 2002, 29, 1421. [Google Scholar] [CrossRef]
- Charlson, R.J.; Schwartz, S.E.; Hales, J.M.; Cess, R.D.; Coakley, J.A., Jr.; Hansen, J.E.; Hofman, D.J. Climate forcing by anthropogenic aerosols. Science 1992, 255, 423–430. [Google Scholar] [CrossRef] [PubMed]
- Hansen, J.; Sato, M.; Ruedy, R. Radiative forcing and climate response. J. Geophys. Res. 1997, 102, 6831–6864. [Google Scholar] [CrossRef]
- Ramanathan, V.; Crutzen, P.J.; Kiehl, J.T.; Rosenfeld, D. Aerosols, climate, and the hydrological cycle. Science 2001, 294, 2119–2124. [Google Scholar] [CrossRef] [PubMed]
- Lohmann, U.; Lesins, G. Stronger constraints on the anthropogenic indirect aerosol effect. Science 2002, 298, 1012–1015. [Google Scholar] [CrossRef] [PubMed]
- Rosenfeld, D. Aerosols, clouds, and climate. Science 2006, 312, 1323–1324. [Google Scholar] [CrossRef] [PubMed]
- Albrecht, B.A. Aerosols, cloud microphysics, and fractional cloudiness. Science 1989, 245, 1227–1230. [Google Scholar] [CrossRef] [PubMed]
- Rotstayn, L.D. Indirect forcing by anthropogenic aerosols: A global climate model calculation of the effective-radius and cloud-lifetime effects. J. Geophys. Res. 1999, 104, 9369–9380. [Google Scholar] [CrossRef]
- Storelvmo, T.; Leirvik, T.; Lohmann, U.; Phillips, P.; Wild, M. Disentangling greenhouse warming and aerosol cooling to reveal Earth’s climate sensitivity. Nature Geoscience 2016, 9, 206–289. [Google Scholar] [CrossRef]
- Mitchell, J.F.B.; Johns, T.C. On modification of global warming by sulfate aerosols. J. Climate 1997, 10, 245–267. [Google Scholar] [CrossRef]
- Andreae, M.O.; Jones, C.D.; Cox, p.m. Strong present-day aerosol cooling implies a hot future. Nature 2001, 435, 1187–1190. [Google Scholar] [CrossRef] [PubMed]
- Levy, H.; Schwarzkopf, M.D.; Horowitz, L.; Ramaswamy, V.; Findell, K.L. Strong sensitivity of late 21st century climate to projected changes in short-lived air pollutants. J. Geophys. Res. 2008, 113, D06102. [Google Scholar] [CrossRef]
- Ming, Y.; Ramaswamy, V. Nonlinear climate and hydrological responses to aerosol effects. J. Clim. 2009, 22, 1329–1339. [Google Scholar] [CrossRef]
- Rotstayn, L.D.; Cai, W.; Dix, M.R.; Farquhar, G.D.; Feng, Y.; Ginoux, P.; Herzog, M.; Ito, A.; Penner, J.E.; Roderick, M.L.; et al. Have Australian rainfall and cloudiness increased due to the remote effects of Asian anthropogenic aerosols? J. Geophys. Res. 2007, 112, D09202. [Google Scholar] [CrossRef]
- Shindell, D.T.; Faluvegi, G.; Rotstayn, L.; Milly, G. Spatial patterns of radiative forcing and surface temperature response. J. Geophys. Res. 2015, 120, 5385–5403. [Google Scholar] [CrossRef]
- Paasonen, P.; Asmi, A.; Petaja, T.; Kajos, M.K.; Aijala, M.; Junninen, H.; Holst, T.; Abbatt, J.P.D.; Arneth, A.; Birmili, W.; et al. Warning-induced increase in aerosol number concentration likely to moderate climate change. Nat. Geosci. 2013, 6, 438–442. [Google Scholar] [CrossRef]
- Attwood, A.R.; Washenfelder, R.A.; Brock, C.A.; Hu, W.; Baumann, K.; Campuzano-Jost, P.; Day, D.A.; Edgerton, E.S.; Murphy, D.M.; Palm, B.B.; et al. Trends in sulfate and organic aerosol mass in the Southeast US: Impact on aerosol optical depth and radiative forcing. Geophys. Res. Lett. 2014, 41, 7701–7709. [Google Scholar] [CrossRef]
- Kim, P.S.; Jacob, D.J.; Fisher, J.A.; Travis, K.; Yu, K.; Zhu, L.; Yantosca, R.M.; Sulprizio, M.P.; Jimenez, J.L.; Campuzano-Jost, P.; et al. Sources, seasonality, and trends of southeast US aerosol: an integrated analysis of surface, aircraft, and satellite observations with the GEOS-Chem chemical transport model. Atmos. Chem. Phys. 2015, 15, 10411–10433. [Google Scholar] [CrossRef]
- Augustine, J.A.; Dutton, E.G. Variability of the surface radiation budget over the United States from 1996 through 2011 from high-quality measurements. J. Geophys. Res. 2013, 118, 43–53. [Google Scholar] [CrossRef]
- Tang, Q.; Leng, G. Changes in cloud cover, precipitation, and summer temperature in North America from 1982 to 2009. J. Clim. 2013, 26, 1733–1744. [Google Scholar] [CrossRef]
- Zhang, L.; Henze, D.K.; Grell, G.A.; Torres, O.; Jethva, H.; Lamsal, L.K. What factors control the trend of increasing AAOD over the United States in the last decade? J. Geophys. Res. 2017, 122, 1797–1810. [Google Scholar] [CrossRef]
- Fan, Y.; van den Dool, H. A global monthly land surface air temperature analysis for 1948-present. J. Geophys. Res. 2008, 113, D01103. [Google Scholar] [CrossRef]
- Levi, B.G. Earth’s land surface temperature trends: A new approach confirms previous results. Phys. Today 2013, 66. [Google Scholar] [CrossRef]
- Campbell, J.R.; Tackett, J.L.; Reid, J.S.; Zhang, J.; Curtis, C.A.; Hyer, E.J.; Sessions, W.R.; Wetphal, D.L.; Prospero, J.M.; Welton, E.J.; et al. Evaluating nighttime CALIOP 0.532 um aerosol optical depth and extinction coefficient retrievals. Atmos. Meas. Tech. 2012, 5, 2143–2160. [Google Scholar] [CrossRef]
- Winker, D.M.; Tackett, J.L.; Getzewich, B.J.; Liu, Z.; Vaughan, M.A.; Rogers, R.R. The global 3-D distribution of tropospheric aerosols as characterized by CALIOP. Atmos. Chem. Phys. 2013, 13, 3345–3361. [Google Scholar] [CrossRef]
- Dee, D.P.; Uppala, S.M.; Simmons, A.J.; Berrisford, P.; Poli, P.; Kobayashi, S.; Andrae, U.; Balmaseda, M.A.; Balsamo, G.; Bauer, P.; et al. The ERA-Interim reanalysis: configuration and performance of the data assimilation system. Q. J. R. Meteorol. Soc. 2011, 137, 553–597. [Google Scholar] [CrossRef]
- Martonchik, J.V.; Diner, D.J.; Crean, K.A.; Bull, M.A. Regional aerosol retrieval results from MISR. IEEE Trans. Geosci. Remote Sens. 2002, 40, 1520–1531. [Google Scholar] [CrossRef]
- Fu, Q.; Liou, K.N. On the correlated k-distribution method for radiative transfer in nonhomogeneous atmospheres. J. Atmos. Sci. 1992, 49, 2139–2156. [Google Scholar] [CrossRef]
- Fu, Q.; Liou, K.N. Parametrization of the radiative properties of cirrus clouds. J. Atmos. Sci. 1993, 50, 2008–2025. [Google Scholar] [CrossRef]
- Gu, Y.; Farrara, J.; Liou, K.N.; Mechoso, C.R. Parametrization of cloud-radiative processes in the UCLA general circulation model. J. Climate 2003, 16, 3357–3370. [Google Scholar] [CrossRef]
- Gu, Y.; Liou, K.N.; Ou, S.C.; Fovell, R. Cirrus cloud simulations using WRF with improved radiation parametrization and increased vertical resolution. J. Geophys. Res. 2011, 116, D06119. [Google Scholar] [CrossRef]
- Gu, Y.; Liou, K.N.; Jiang, J.H.; Su, H.; Liu, X. Dust aerosol impact on North African climate: A GCM investigation of aerosol-cloud-radiation interactions using A-Train satellite data. Atmos. Chem. Phys. 2012, 12, 1667–1679. [Google Scholar] [CrossRef]
- Hess, M.; Koepke, P.; Schult, I. Optical properties of aerosols and clouds: The software package OPAC. Bull. Am. Meteor. Soc. 1998, 79, 831–844. [Google Scholar] [CrossRef]
- Burton, S.P.; Ferrare, M.A.; Vaughan, A.H.; Omar, A.H.; Rogers, R.R.; Hostetler, C.A.; Hair, J.W. Aerosol classification from airborne HSRL and comparisons with the CALIPSO vertical feature mask. Atmos. Meas. Tech. 2013, 6, 1397–1412. [Google Scholar] [CrossRef]
- Ford, B.; Heald, C.L. Aerosol loading in the Southeastern United States: Reconciling surface and satellite observations. Atmos. Chem. Phys. 2013, 13, 9269–9283. [Google Scholar] [CrossRef]
- Theil, H. A rank-invariant method of linear and polynomial regression analysis. I. Nederl. Akad. Wetensch. Proc. 1950, 53, 386–392. [Google Scholar]
- Hand, J.L.; Schichtel, B.A.; Malm, W.C.; Pitchford, M.L. Particulate sulfate ion concentration and SO2 emissions trends in the United States from the early 1990s through 2010. Atmos. Chem. Phys. 2012, 12, 10353–10365. [Google Scholar] [CrossRef]
- Gregg, W.W.; Carder, K.L. A simple spectral solar irradiance model for cloudless maritime atmospheres. Limnol. Oceanog. 1990, 35, 1657–1675. [Google Scholar] [CrossRef]
- Ruckstuhl, C.; Philipona, R.; Behrens, K.; Coen, M.C.; Durr, B.; Heimo, A.; Matzler, C.; Nyeki, S.; Ohmura, A.; Vuilleumier, L.; et al. Aerosol and cloud effects on solar brightening and the recent rapid warming. Geophys. Res. Lett. 2008, 35, L12708. [Google Scholar] [CrossRef]
- Philipona, R.; Behrens, K.; Ruckstuhl, C. How declining aerosols and rising greenhouse gases forced rapid warming in Europe since the 1980s. Geophys. Res. Lett. 2009, 36, L02806. [Google Scholar] [CrossRef]
- Meehl, G.A.; Arblaster, J.M.; Chung, C.T.Y. Disappearance of the southeast U.S. “warming hole” with the late 1990s transition of the Interdecadal Pacific Oscillation. Geophys. Res. Lett. 2015, 42, 5564–5570. [Google Scholar] [CrossRef]
- Che, H.; Xia, X.; Zhu, J.; Dubovnik, O.; Holben, B.; Goloub, P.; Chen, H.; Estelles, V.; Cueas-Agullo, E.; Blarel, L.; et al. Column aerosol optical properties and aerosol radiative forcing during a serious haze-fog month over North China Plain in 2013 based on ground-based sunphotometer measurements. Atmos. Chem. Phys. 2014, 14, 2125–2138. [Google Scholar] [CrossRef]
- Prats, N.; Cachorro, V.E.; Berjon, A.; Toledano, C.; De Frutos, A.M. Column-integrated aerosol microphysical properties from AERONET Sun photometer over southwestern Spain. Atmos. Chem. Phys. 2011, 11, 12535–12547. [Google Scholar] [CrossRef]
- Holben, B.N.; Eck, T.F.; Slutsker, I.; Tanre, D.; Buis, J.P.; Setzer, A.; Vermote, E.; Reagan, J.A.; Kaufman, Y.; Nakajima, T.; et al. AERONET-A federated instrument network and data archive for aerosol characterization. Remote Sens. Environ. 1998, 66, 1–16. [Google Scholar] [CrossRef]
- Donkelaar, A.V.; Martin, R.V.; Brauer, M.; Kahn, R.; Levy, R.; Verduzco, C.; Villeneuve, P.K. Global estimates of ambient fine particulate matter concentrations from satellite-based aerosol optical depth: Development and application. Environ. Health. Perspect. 2010, 118, 847–855. [Google Scholar] [CrossRef] [PubMed]
- Li, P.; Yan, R.; Yu, S.; Wang, S.; Liu, W.; Bao, H. Reinstate regional transport of PM2.5 as a major cause of severe haze in Beijing. Proc. Natl. Acad. Sci. USA 2015, 112, E2739–E2740. [Google Scholar] [CrossRef] [PubMed]
- Yan, R.; Yu, S.; Zhang, Q.; Li, P.; Wang, S.; Chen, B.; Liu, W. A heavy haze episode in Beijing in February of 2014: Characteristics, origins and implications. Atmos. Pollut. Res. 2015, 6, 867–876. [Google Scholar] [CrossRef]
- Yu, S.; Li, P.; Wang, L.; Wang, P.; Wang, S.; Chang, S.; Liu, W.; Alapaty, K. Anthropogenic aerosols are a potential cause for migration of the summer monsoon rain belt in China. Proc. Natl. Acad. Sci. USA 2016, 11, E2209–E2210. [Google Scholar] [CrossRef] [PubMed]
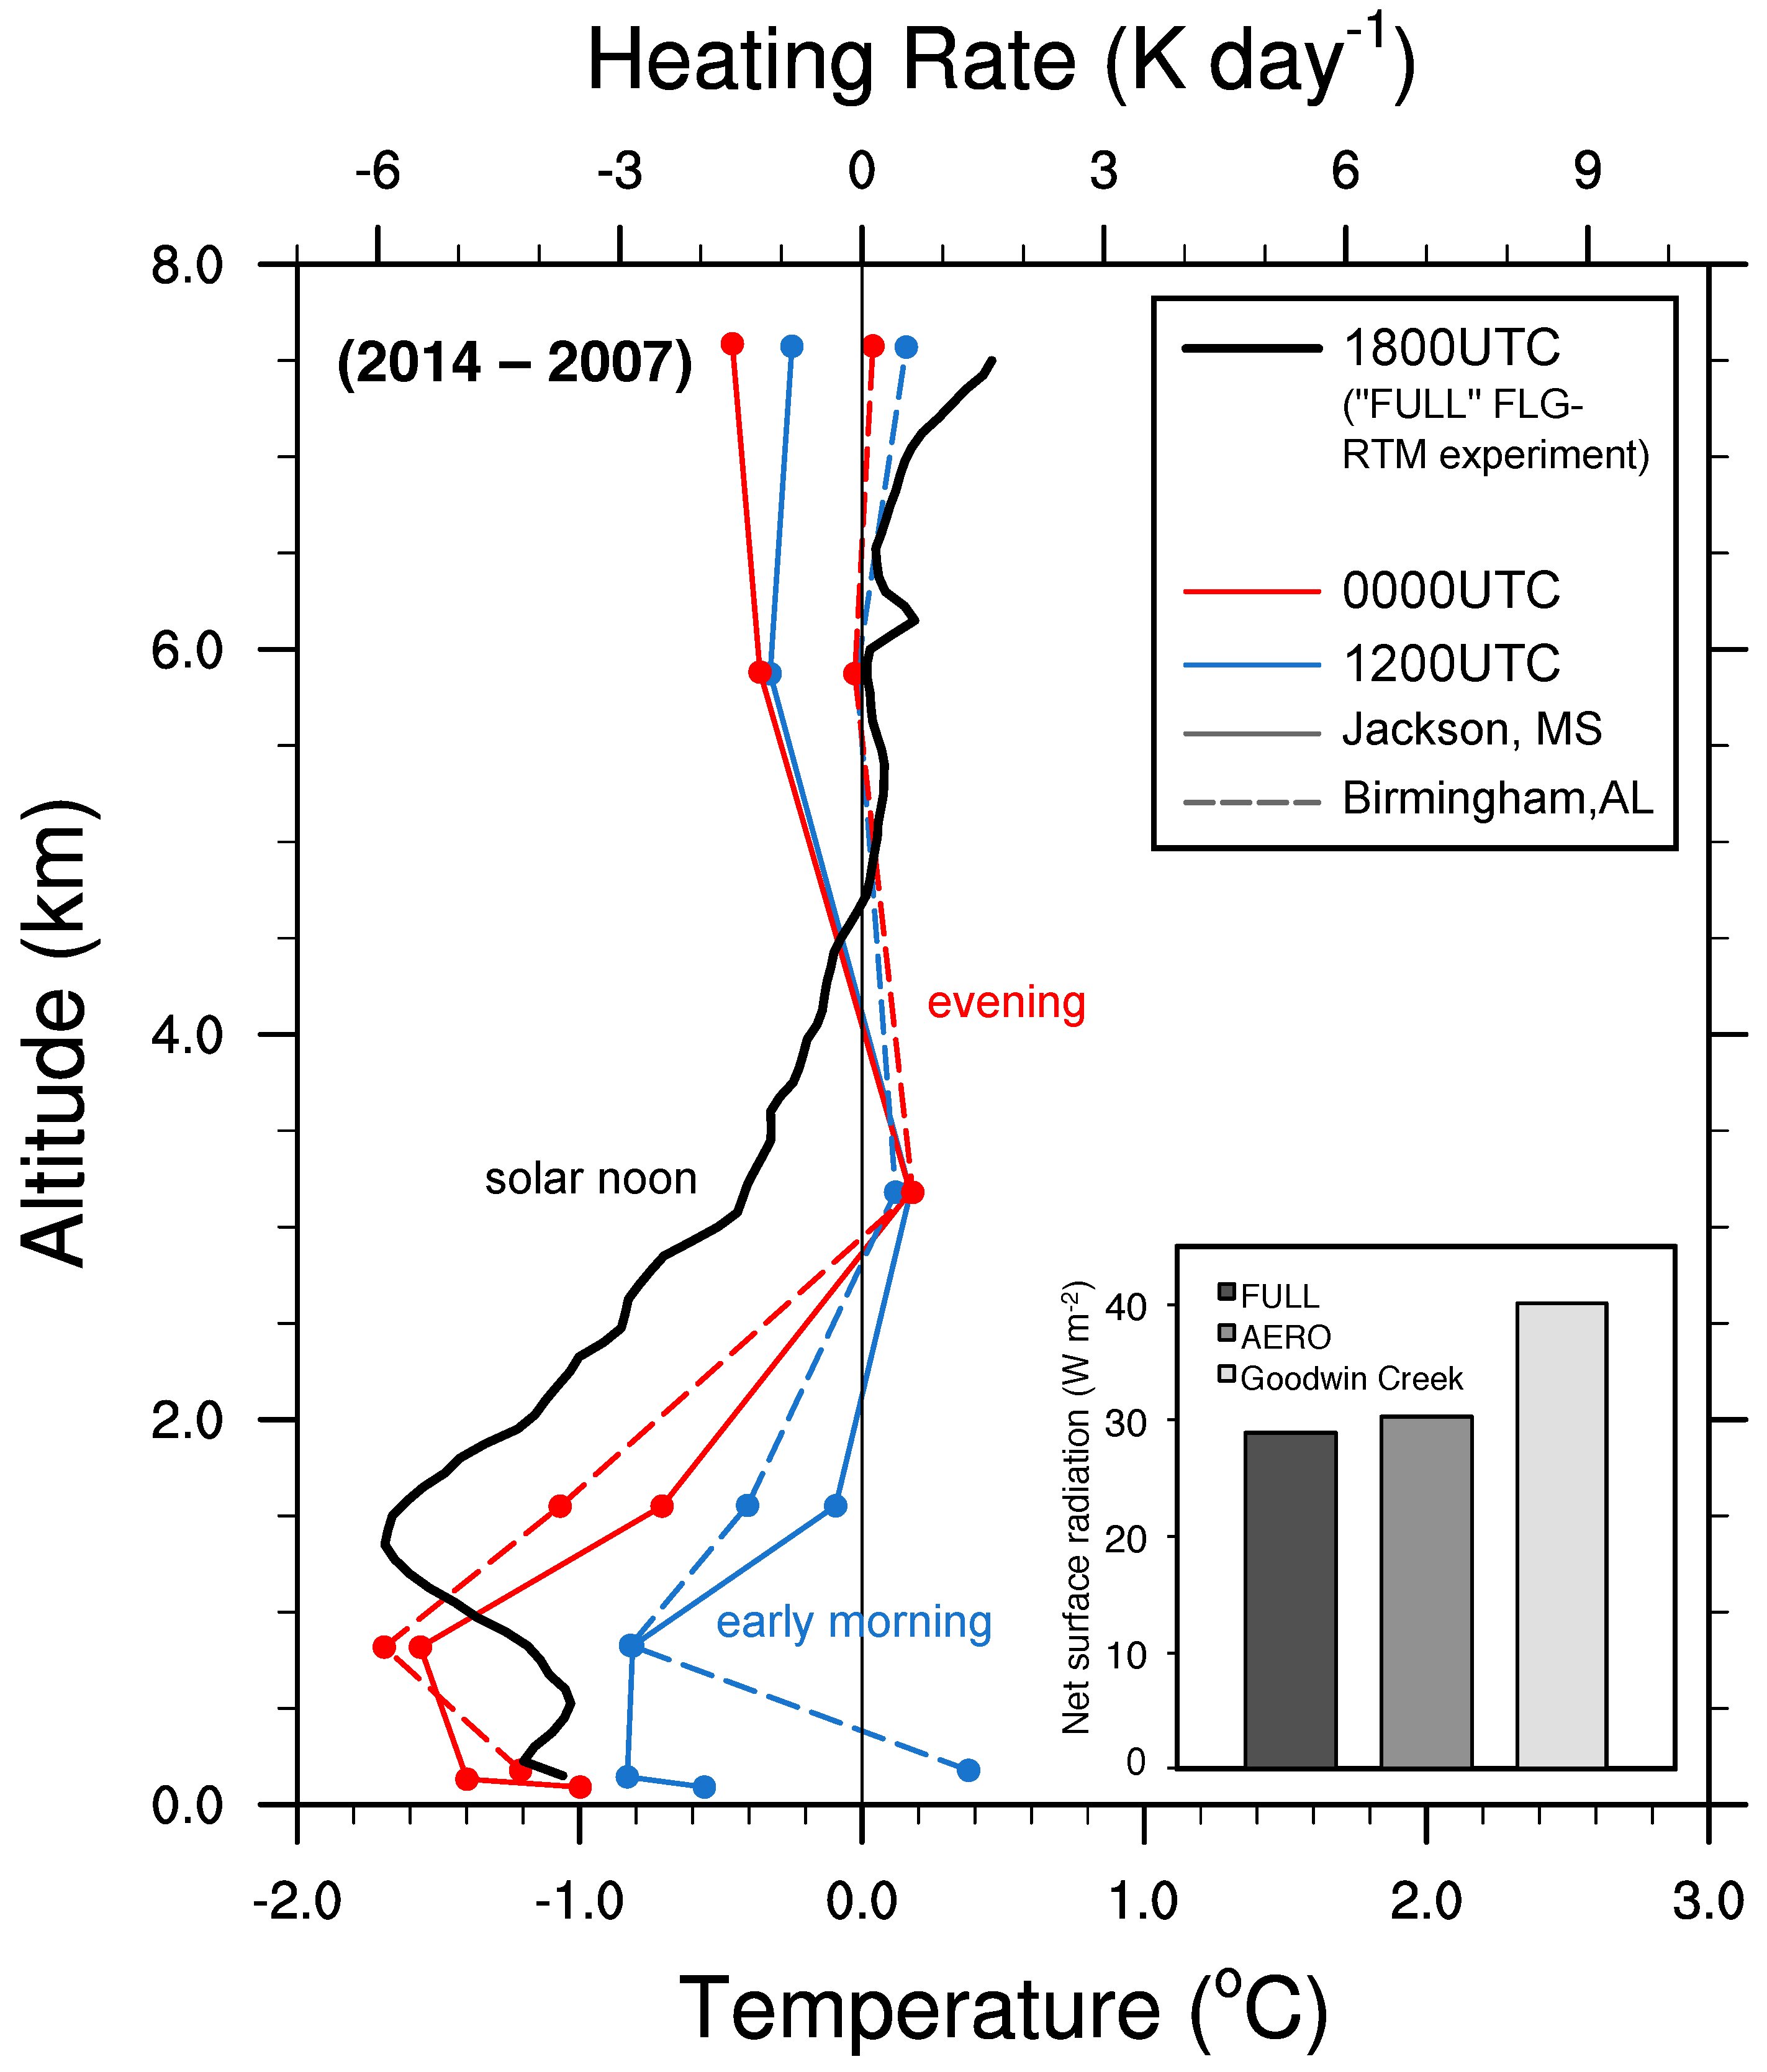
| Year | Net, Noontime Forcing (W m) | |
|---|---|---|
| FULL | AERO | |
| 2007 | −50.3 | 460.1 |
| 2008 | −29.4 | 480.9 |
| 2009 | −29.0 | 483.9 |
| 2010 | −35.4 | 477.3 |
| 2011 | −30.2 | 483.7 |
| 2012 | −28.1 | 484.2 |
| 2013 | −32.8 | 478.1 |
| 2014 | −21.3 | 490.4 |
| Trend (year) | +2.30 | +2.45 |
© 2017 by the authors. Licensee MDPI, Basel, Switzerland. This article is an open access article distributed under the terms and conditions of the Creative Commons Attribution (CC BY) license (http://creativecommons.org/licenses/by/4.0/).
Share and Cite
Tosca, M.G.; Campbell, J.; Garay, M.; Lolli, S.; Seidel, F.C.; Marquis, J.; Kalashnikova, O. Attributing Accelerated Summertime Warming in the Southeast United States to Recent Reductions in Aerosol Burden: Indications from Vertically-Resolved Observations. Remote Sens. 2017, 9, 674. https://doi.org/10.3390/rs9070674
Tosca MG, Campbell J, Garay M, Lolli S, Seidel FC, Marquis J, Kalashnikova O. Attributing Accelerated Summertime Warming in the Southeast United States to Recent Reductions in Aerosol Burden: Indications from Vertically-Resolved Observations. Remote Sensing. 2017; 9(7):674. https://doi.org/10.3390/rs9070674
Chicago/Turabian StyleTosca, Mika G., James Campbell, Michael Garay, Simone Lolli, Felix C. Seidel, Jared Marquis, and Olga Kalashnikova. 2017. "Attributing Accelerated Summertime Warming in the Southeast United States to Recent Reductions in Aerosol Burden: Indications from Vertically-Resolved Observations" Remote Sensing 9, no. 7: 674. https://doi.org/10.3390/rs9070674
APA StyleTosca, M. G., Campbell, J., Garay, M., Lolli, S., Seidel, F. C., Marquis, J., & Kalashnikova, O. (2017). Attributing Accelerated Summertime Warming in the Southeast United States to Recent Reductions in Aerosol Burden: Indications from Vertically-Resolved Observations. Remote Sensing, 9(7), 674. https://doi.org/10.3390/rs9070674


