Article

Cross-Comparison of Albedo Products for Glacier Surfaces Derived from Airborne and Satellite (Sentinel-2 and Landsat 8) Optical Data

1
Department of Geosciences, University of Fribourg, 1700 Fribourg, Switzerland
2
Remote Sensing Laboratories, University of Zurich, 8057 Zurich, Switzerland
3
Laboratory of Hydraulics, Hydrology and Glaciology (VAW), ETH Zurich, 8093 Zurich, Switzerland
*
Author to whom correspondence should be addressed.
Remote Sens. 2017, 9(2), 110; https://doi.org/10.3390/rs9020110
Submission received: 21 October 2016 / Accepted: 19 January 2017 / Published: 27 January 2017
(This article belongs to the Special Issue Remote Sensing of Glaciers)

Abstract

:
Surface albedo partitions the amount of energy received by glacier surfaces from shortwave fluxes and modulates the energy available for melt processes. The ice-albedo feedback, influenced by the contamination of bare-ice surfaces with light-absorbing impurities, plays a major role in the melting of mountain glaciers in a warming climate. However, little is known about the spatial and temporal distribution and variability of bare-ice glacier surface albedo under changing conditions. In this study, we focus on two mountain glaciers located in the western Swiss Alps and perform a cross-comparison of different albedo products. We take advantage of high spectral and spatial resolution (284 bands, 2 m) imaging spectrometer data from the Airborne Prism Experiment (APEX) and investigate the applicability and potential of Sentinel-2 and Landsat 8 data to derive broadband albedo products. The performance of shortwave broadband albedo retrievals is tested and we assess the reliability of published narrow-to-broadband conversion algorithms. The resulting albedo products from the three sensors and different algorithms are further cross-compared. Moreover, the impact of the anisotropy correction is analysed depending on different surface types. While degradation of the spectral resolution impacted glacier-wide mean albedo by about 5%, reducing the spatial resolution resulted in changes of less than 1%. However, in any case, coarser spatial resolution was no longer able to represent small-scale variability of albedo on glacier surfaces. We discuss the implications when using Sentinel-2 and Landsat 8 to map dynamic glaciological processes and to monitor glacier surface albedo on larger spatial and more frequent temporal scales.

Graphical Abstract

1. Introduction

Glacier surface albedo crucially determines the amount of energy absorbed by snow/ice surfaces throughout the year. Especially in summer, when large parts of the glaciers are snow-free, the albedo of heterogeneous bare-ice surfaces has a substantial impact on glacier melt rates and is thus highly relevant regarding the climate change response of mountain glaciers and ice caps [1,2,3,4]. Albedo of ice and snow is influenced by surface properties such as grain size, presence of water, impurity content, surface roughness, crystal orientation and structure (e.g., [5]). In particular, there is a contrast and wavelength dependency of broadband spectral albedo between 400–2500 nm for different glacier facies and surface materials [6,7,8]. An operational broadband albedo product tailored for mountain glaciers is, however, still lacking. Hence, current glacier mass balance models rely mostly on simplified homogeneous ice albedo parameters in their energy balance functions, neglecting the diversity of glacier surfaces and their changes over time [9]. Furthermore, a widespread darkening of glacier surfaces during recent decades justifies the increasing importance and need of actual glacier albedo data. Glacier darkening was, for example, reported for the European Alps [10], the Himalayas [11], and on the Greenland ice sheet and surrounding glaciers [1,12], and related processes are studied in great detail [13]. Compared to snow albedo, ice albedo has received relatively little interest thus far. Most studies focus on glacier-wide (mean) albedo [14,15,16], and ice albedo is often approximated as temporarily and spatially constant, except for some case studies that included spatially distributed bare-ice albedo in their mass balance schemes [17,18,19]. This shortcoming underlines the need to develop strategies and observational approaches to provide estimates of glacier albedo at temporal and spatial scales relevant to glacier melt processes.
While in situ measurements from weather stations provide valuable point data, indicating substantial temporal variations in glacier albedo, airborne- and/or satellite-based sensors offer the possibility to attribute glacier surface albedo to large areas with reasonable spatial resolution (<30 m) but at lower temporal resolution. Several studies have used Landsat or MODIS data to derive glacier surface albedo distribution [20,21,22] and compared their results with local automated weather stations [23] or linked them to glacier mass balance estimates [2,24]. In particular, the 500 m MODIS albedo product was used in several studies [2,3,4,25].
In the frame of glacier mass balance modelling, albedo is defined as “the ratio of the reflected flux density to the incident flux density, usually referring either to the entire spectrum of solar radiation (broadband albedo) or just to the visible part of the spectrum. (…) Spectral albedo is the albedo at single wavelengths or, more loosely, over a narrow range of wavelengths” [26]. The application of optical remote sensing data to derive glacier albedo requires a slight adaptation of the above definition. The term shortwave broadband albedo (SBA) referring to the wavelength range of 0.4 to 2.4 µm typically covered by optical remote sensing instruments is more appropriate. This shortwave broadband albedo definition is almost numerically equivalent to broadband albedo covering the entire solar spectrum, due to the very small values of solar irradiance at wavelengths larger than 2.4 µm [27].
However, the use of multispectral Landsat or MODIS data implies the application of a so-called narrow-to-broadband conversion to obtain broadband albedo from the spectral albedo given by the individual bands of the satellites. Several narrow-to-broadband formulae to retrieve albedo are mentioned in the literature [28], but solely the method by Knap et al. [29] is frequently used in glaciological studies (e.g., [20,21,22]). An alternative approach by Liang [30] was never validated for snow and ice surfaces. Whereas Liang [30] based his empirical relationships on model simulations, Knap et al. [29] conducted field measurements with modified albedometers that mimicked Landsat 5 Thematic Mapper (TM) bands 2 and 4 to obtain a calibration dataset. Since both formulae were established for Landsat 5 and 7, ensuring data continuity with new Landsat 8 or Sentinel-2 data, using these approaches of data requires critical judgement and likely some adjustments.
Imaging spectroscopy provides a quasi-continuous spectral and high spatial sampling that is optimal to improve the knowledge of processes acting at the ice-atmosphere interface and to derive glacier surface albedo [31]. This data is usually only available on-demand and thus rather cost- and time-expensive. The use of multispectral remote sensing data overcomes limitations of temporal sampling and facilitates an operational glacier monitoring. Coarse spatial and spectral resolution, however, limits the capability of multispectral data to estimate glacier surface albedo. Further surface anisotropy, commonly referred to as BRDF effect (bidirectional reflectance distribution function), impacts the reliability of retrieved glacier albedo. Anisotropy describes an angular variation of retrieved surface reflectance. Since the retrieval of albedo requires an aggregation of surface reflectance over the upper hemisphere, anisotropy effects cause sun and view angle, as well as topography-dependent over- or underestimations of retrieved albedo [32,33,34,35,36]. Reliable albedo monitoring using optical satellite data thus should rely on a compensation of such material-specific reflectance anisotropy effects.
This study aims to provide insights into the uncertainty of glacier albedo estimates using the newest optical satellite systems depending on spatial and spectral resolution. Furthermore, we evaluate the implications for an operational glacier albedo product based on Sentinel-2 and Landsat 8 data. Both sensors provide data in an intermediate spatial resolution ranging between 10 and 60 m, which is suitable for glaciological studies in complex mountainous terrain. Whereas the Landsat program offers already a longstanding time series dating back to 1972, Sentinel-2 also aims for long-term data continuity but is only operational since 2015. We deliberately excluded the MODIS glacier albedo products because of their coarse ground-sampling distance of 500 m, which is not suitable for mountain glaciers in steep terrain. We apply the albedo retrieval approach as developed for the Airborne Prism EXperiment (APEX) imaging spectrometer, including a Bidirectional Reflectance Distribution Function (BRDF) correction scheme for material-specific anisotropy characteristics, as benchmark algorithm to the aforementioned satellite data [31]. Our particular research objectives are fourfold: (i) assessing the impact of spectral and spatial sampling resolution with use of systematically resampled Landsat 8 and Sentinel-2 data based on APEX; (ii) evaluating the impact of environmental factors (snow fall, temperature) on albedo products; (iii) comparing albedo maps derived from the benchmark APEX algorithm with products derived from published narrow-to-broadband conversion formulae by Knap et al. [29] and Liang [30]; and (iv) quantifying anisotropy effects on glacier surface albedo estimates. Our results contribute to a better understanding of spatio-temporal variations in bare-ice albedo of glacier surfaces and provide valuable insights to advance and facilitate modelling approaches to study future glacier evolution.

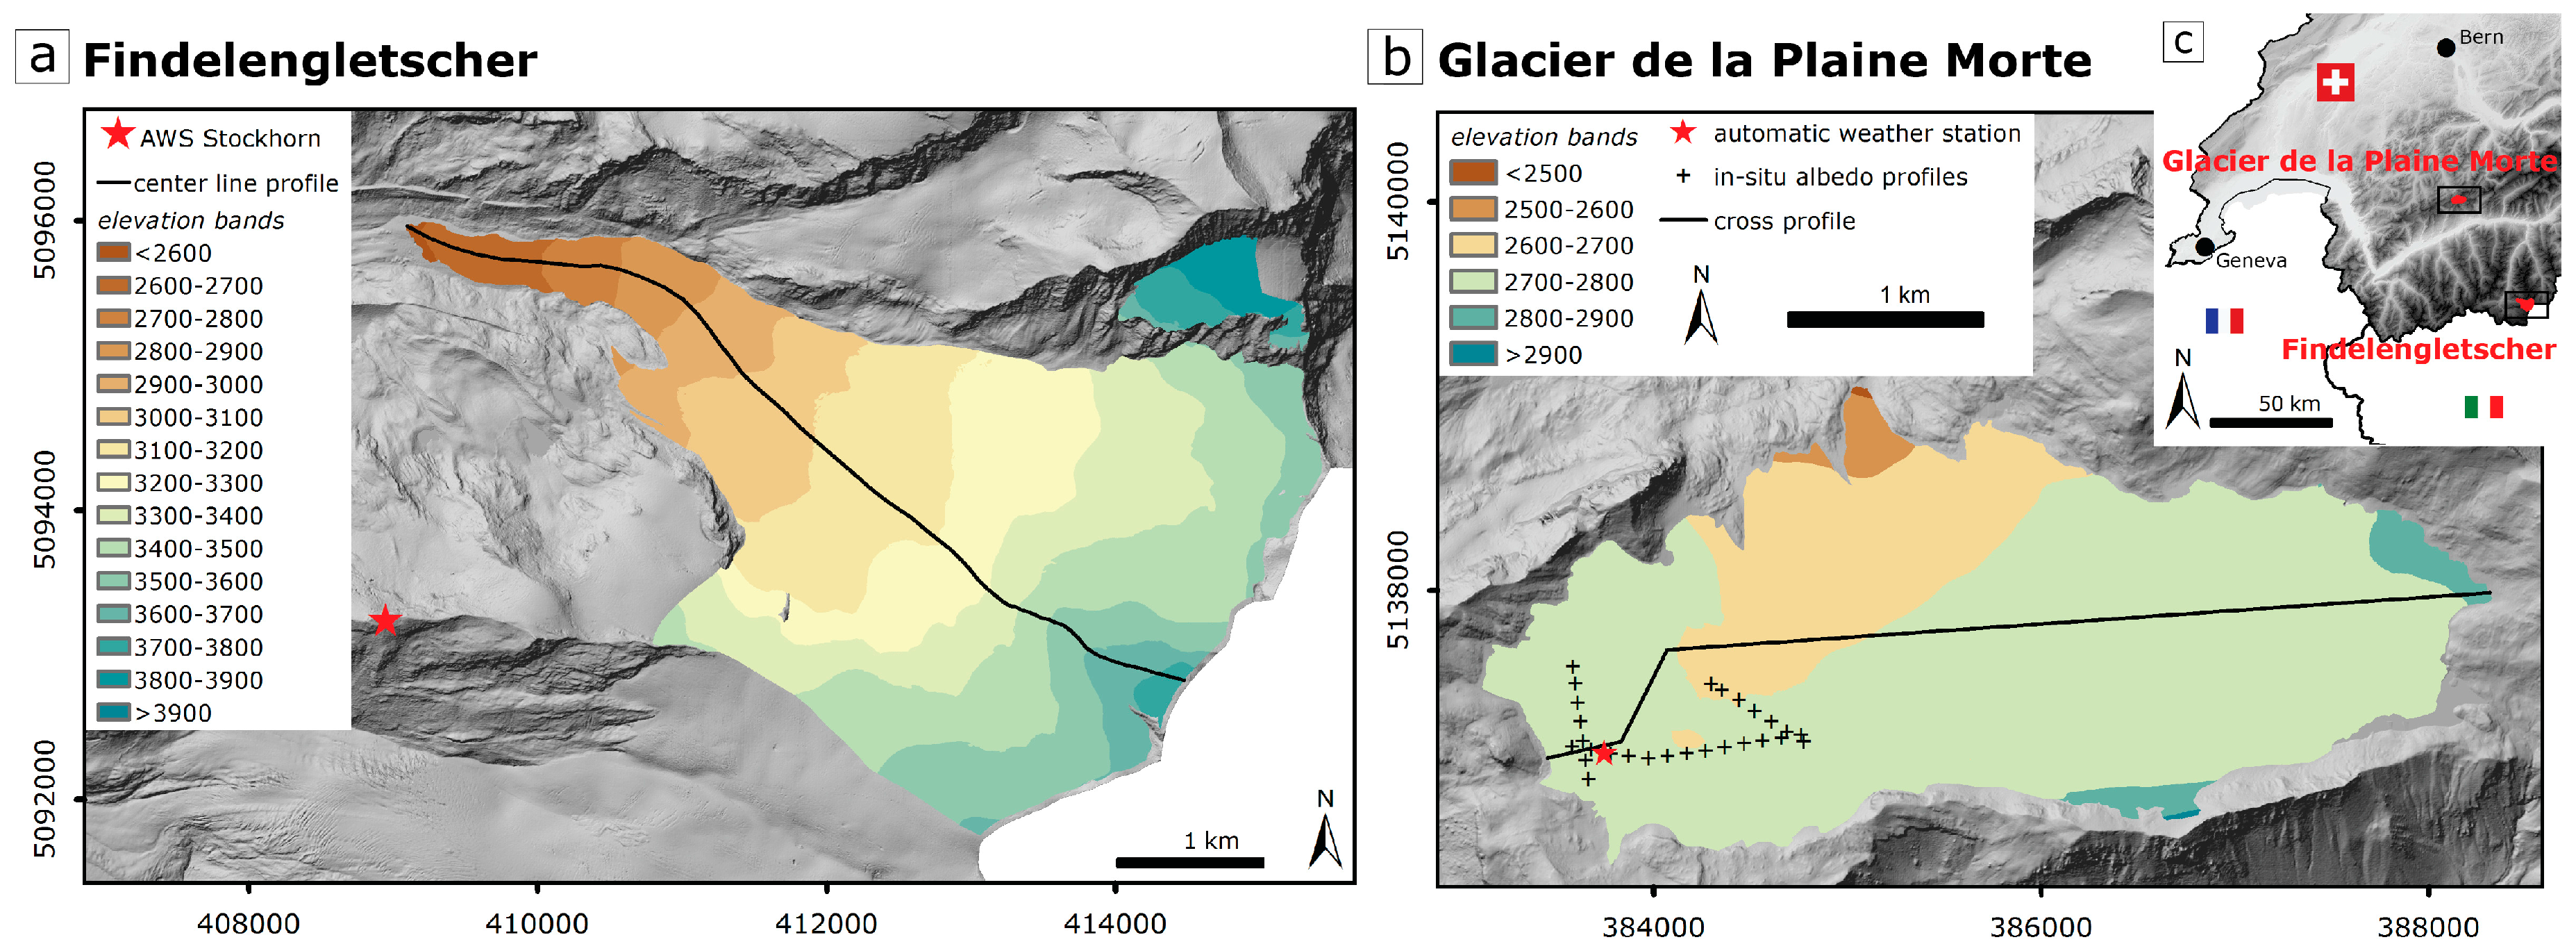
2. Study Site and Data

Findelengletscher (FG) and Glacier de la Plaine Morte (PM) are both located in the western Swiss Alps close to the villages Zermatt and Crans-Montana, respectively. Whereas Findelengletscher is a typical alpine valley glacier covering an area of about 13 km2 ranging in elevation from 2600 to 3900 m a.s.l., Glacier de la Plaine Morte is a plateau glacier covering about 7.3 km2 with an elevation ranging from 2500 to 2900 m a.s.l.) (Figure 1). Both glaciers are well-studied and are part of the Swiss Glacier Monitoring Network [37]. Findelengletscher exhibits a distinct separation of ablation and accumulation area and, during the last ten years, a mean mass balance of −0.5 m w.e. a−1 was observed [38]. In contrast, Glacier de la Plaine Morte was almost entirely snow-free by the beginning of August over the last five years, resulting in a strongly negative mean mass balance of −1.4 m w.e. a−1 on average [39]. In the following, we use FG and PM as abbreviations for Findelengletscher and Glacier de la Plaine Morte, respectively.
We cross-compared different datasets and approaches to retrieve glacier surface albedo. In particular, APEX airborne imaging spectroscopy data [40], satellite data from Sentinel-2 (S2) and Landsat 8 (L8), and in situ data from a CM7B albedometer, a CNR4 net radiometer mounted on an automatic weather station (AWS), and an ASD field spectrometer were used. An overview of these datasets and their specific characteristics is given in Table 1 and details are described below.

2.1. Airborne Prism EXperiment (APEX)

Several flight lines of spectroscopy data were collected under almost cloud-free conditions with the dispersive pushbroom imaging spectrometer APEX (Table 1). The APEX Processing and Archiving Facility (PAF) was used to convert measured raw data streams into calibrated Level 1 at-sensor radiances [41,42]. Orthorectified, atmospherically and topographically corrected Hemispherical-Conical-Reflectance-Factor (HCRF) data were obtained from the at-sensor radiances using the PARGE (Parametric Geocorrection) [43] and the ATCOR-4 software [44]. For more information about the processing of the APEX datasets used in this study, refer to [31].

2.2. Sentinel-2 (S2)

We used a Sentinel-2 scene acquired closest in time to APEX measurements and taken only one day earlier than the Landsat 8 scene (Table 1). The atmospheric correction software ATCOR 2/3 was employed to obtain surface reflectance data from the Level 1C top-of-atmosphere reflectance data that covered the two study sites. Resulting surface reflectance data exhibit a ground-sampling distance of 20 m, i.e., some of the individual bands were up- and others were down-sampled. For all analyses, this surface reflectance dataset was cropped to rectangular subsets comprising the entire glacier surfaces of both glaciers including their surrounding area. In the following, we use S2 as an abbreviation for Sentinel-2 for better readability.

2.3. Landsat 8 (L8)

A Landsat 8 scene (path 195, row 28) acquired one week after the APEX overflight and only one day apart from the S2 overpass was chosen, covering the entire western Swiss Alps and hence both study sites. We used the Landsat Surface Reflectance High Level Data Products distributed by and courtesy of the U.S. Geological Survey (USGS) [45]. Similar to the S2 data, the Landsat 8 scene was cropped to two individual rectangular subsets comprising the entire glacier surface and some of the surrounding area of both study sites. From here on, we use L8 as an abbreviation for Landsat 8.

2.4. ASD Field Spectrometer

ASD FieldSpec Pro (ASD Inc., Boulder, CO, USA) field spectroscopy data were collected on both glaciers in 2013 and 2014 (Table 1). Various areas comprising pure surface materials were chosen for spectroscopic measurements based on expert knowledge. All measurements were taken with a bare fibre optic approximately one meter above the surface under clear-sky conditions. Irradiance reference measurements were taken before and after target measurements using a Spectralon reference panel. Both nadir and directional (at 0°, 30°, 60°, −30° and −60°) in situ radiometric measurements were obtained in the solar principal plane and perpendicular to it. The resulting set of data allows deriving surface-specific reflectance anisotropy characteristics [31].

2.5. CM7B Albedometer/CNR4 Net Radiometer

For validation purposes, we collected field albedo data with a Kipp & Zonen CM7B (Kipp&Zonen B.V., Delft, The Netherlands) albedometer mounted on a tripod to ensure surface parallel readings. The measurement setup comprised 27 individual points along three profiles in the western half of PM (Figure 1b). All readings were taken about one meter above the glacier surface during cloud-free days in summer 2014 [31]. During the summer months in 2015, an AWS was mounted on PM (Figure 1b). Besides various other variables, the station measured all four radiation components (incoming and outgoing longwave and shortwave radiation) continuously and hence provided albedo data in a 10 min interval for one single point on the glacier.

2.6. Digital Elevation Models

The swissalti3d Digital Elevation Model (DEM) with a spatial resolution of 2 m was used for all analyses that involve a DEM. Terrain elevation data covering the PM site originates from 2010 and data covering the FG site originates from 2009 [46].

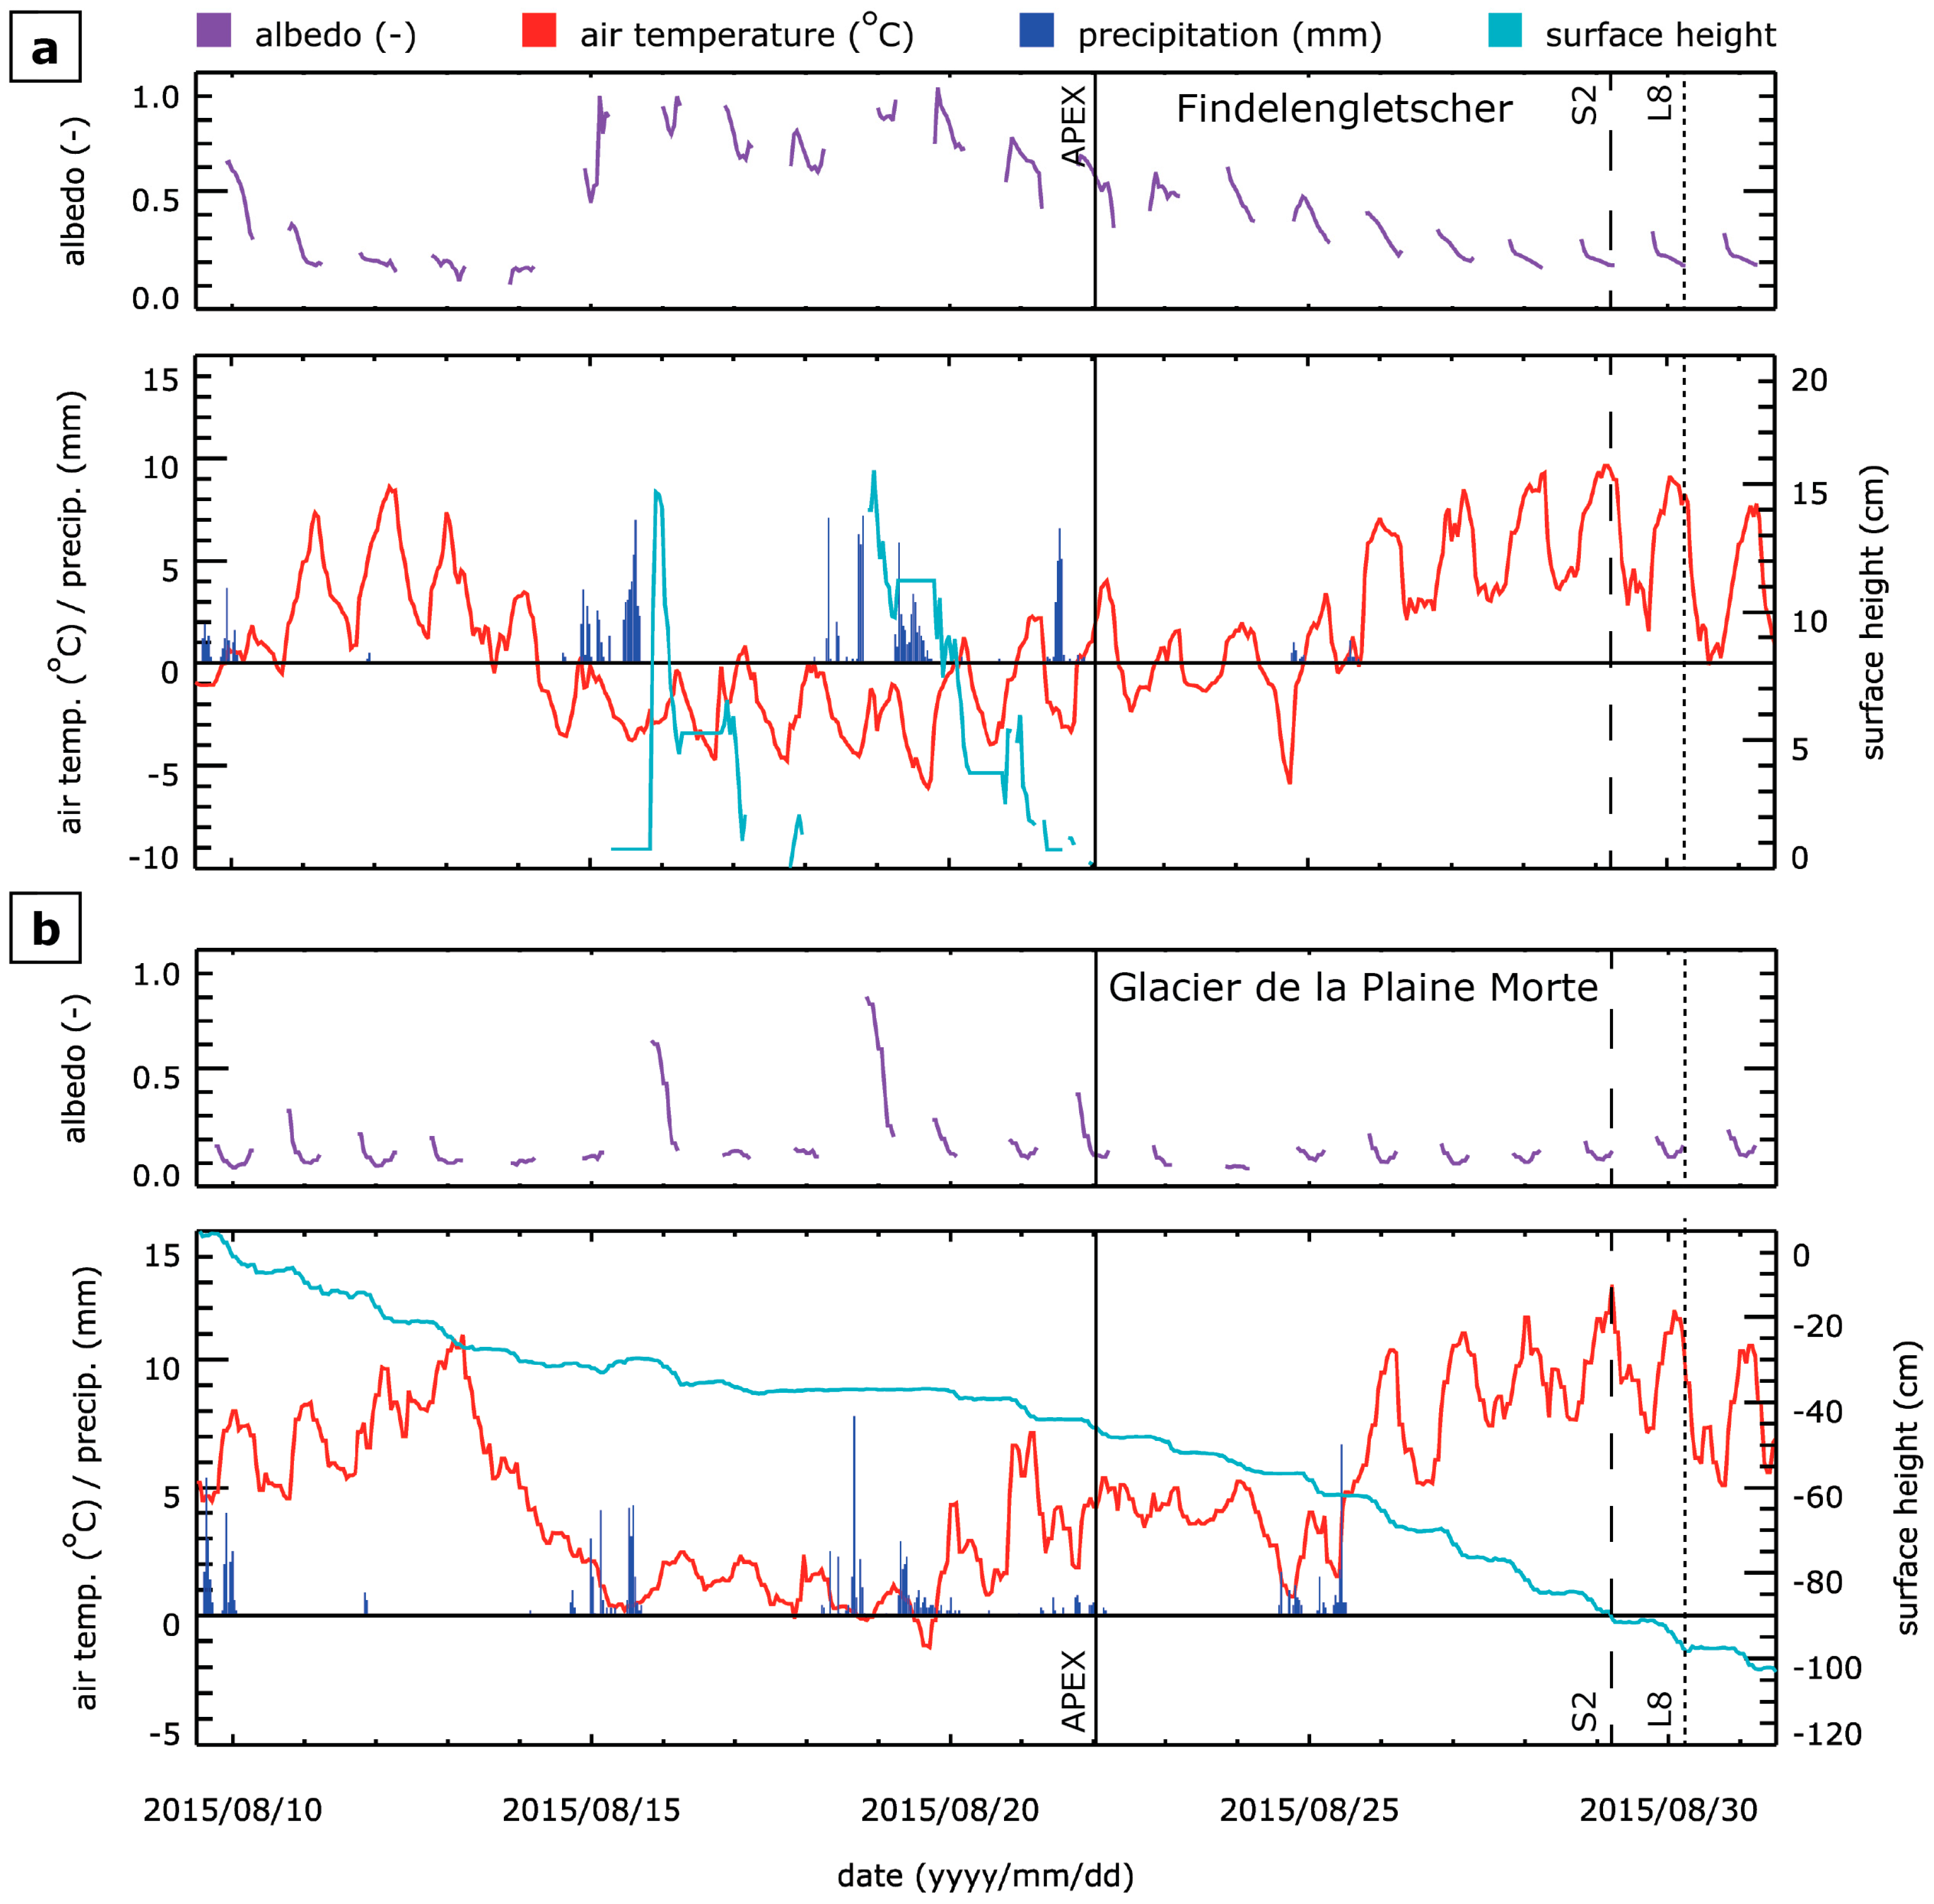
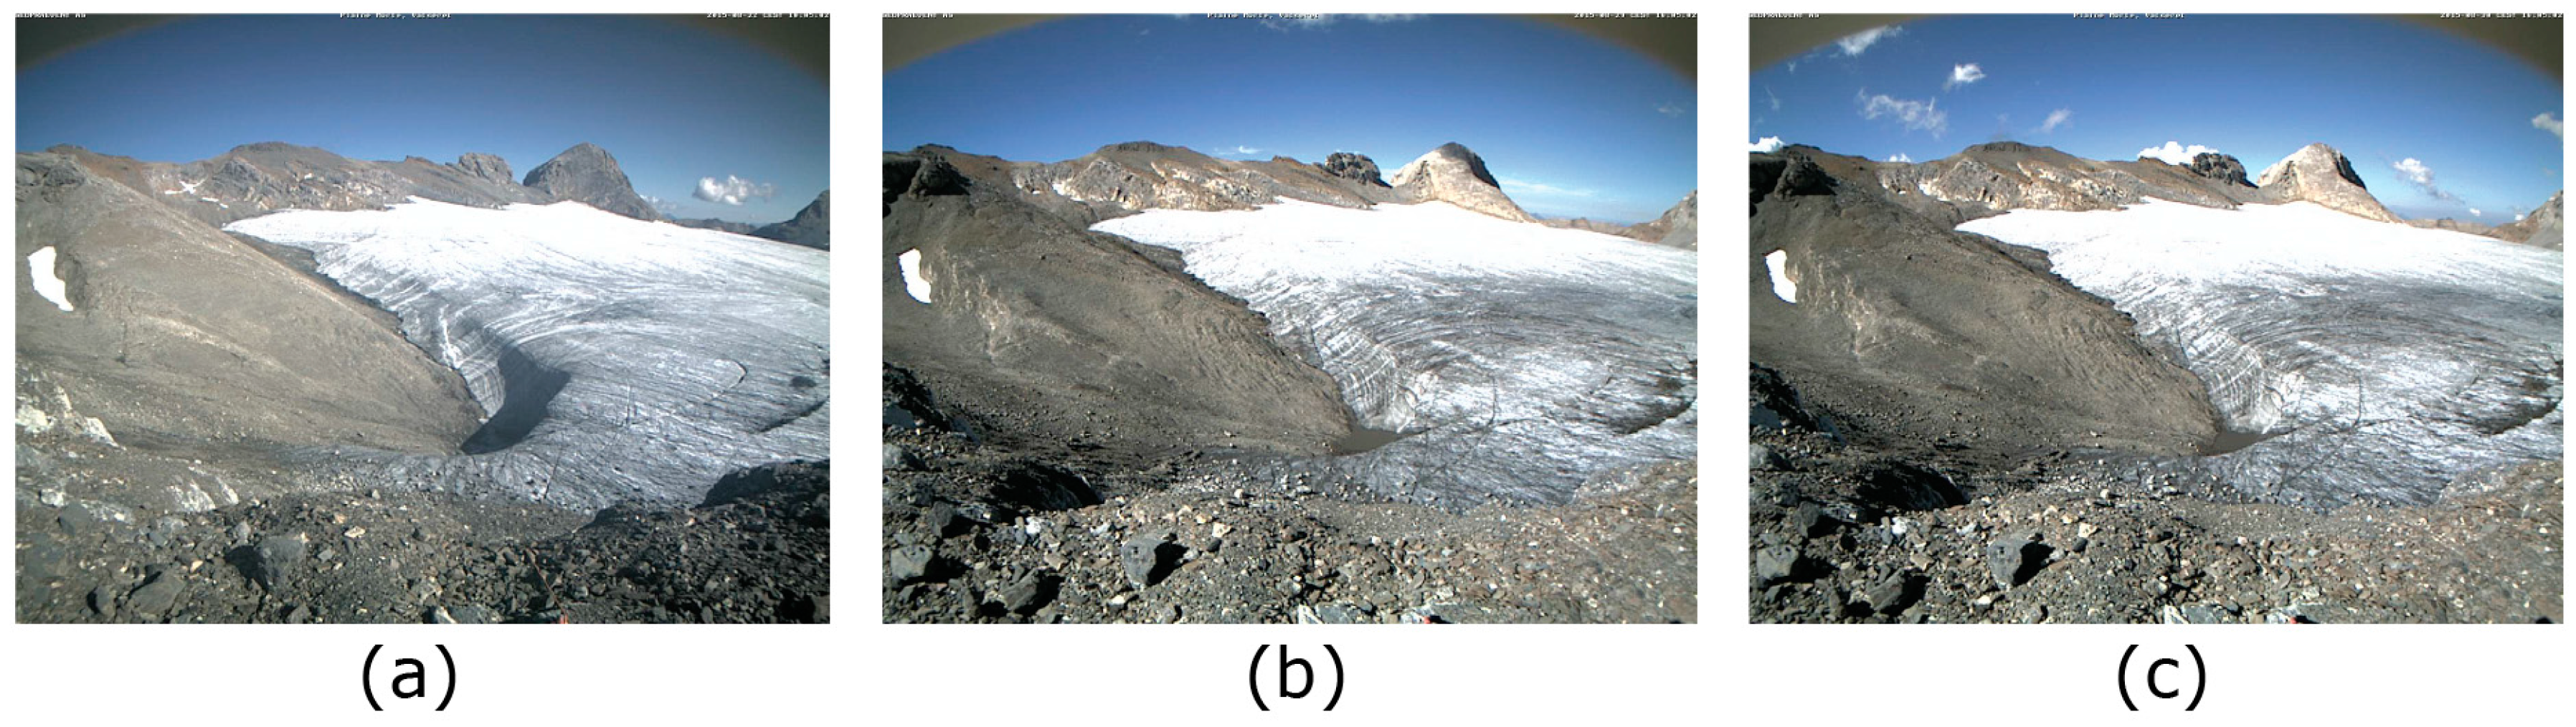
2.7. Weather Situation between Acquisition Times of Datasets

A thorough analysis of the weather situation prior and between the acquisition times is necessary to preclude misinterpretation of the results due to changes in environmental conditions during image acquisition. We investigated air temperature, precipitation, changes in surface height approximated by snow depth and ice melt (measured by SR50 sonic ranger instruments, Campbell Scientific, Logan, UT, USA), as well as albedo data from weather stations located either on or in close vicinity of the two glaciers (Figure 2). For FG, we had access to two off-glacier AWS located at Stockhorn (3415 m a.s.l.) at roughly 3 km from the glacier terminus, maintained by Swiss Permafrost Monitoring Network, providing air temperature, snow height and albedo data, as well as to the precipitation data collected at a MeteoSwiss station located above Zermatt 2170 m a.s.l., approximately 4 km down-valley from FG. For PM, we used the precipitation data collected at the MeteoSwiss station Tsanfleuron 2050 m a.s.l. approximately 25 km west of the glacier and air temperature, ice melt and albedo data from the local on-glacier AWS. Although not all of these stations are directly located on the glaciers, they provide valuable information about the weather situation between the acquisition dates of the air- and space-borne datasets. Furthermore, we had access to hourly and half-daily repeated camera images of both glaciers (see Appendix A).
On both glaciers, a significant drop in air temperature was recorded on the 13 August, resulting in a cold spell between 14 and 20 August. Around 16 August, the albedo increased to about 0.8 on both glaciers, which can be clearly associated with snowfall. Furthermore, the surface height measurements at Stockhorn and PM support the fact that there were two snowfall events on the 15–16 and 19–20 August. These observations indicate the presence of fresh snow on FG above 3400 m a.s.l. during the overflight of APEX. However, a recession of the snowline and an ageing of the snowpack clearly took place until the data acquisition of Sentinel-2 and Landsat 8. We observe a drop in albedo to around 0.3 on 27 August and the air temperature was relatively stable at around 4–10 °C after 26 August. For PM, the snow disappeared already around 20 August (albedo dropped to around 0.2). The relatively stable air temperature (7–11 °C) after 25 August led to significant ice melt (more than 0.4 m between 25 and 30 August).

3. Methods

3.1. Anisotropy-Corrected Shortwave Broadband Albedo

We implemented an algorithm that employs the full information content of available airborne and satellite spectroscopy data to derive shortwave broadband albedo (SBA). The algorithm integrates the surface HCRF signal of the sensor, weighted by spectral surface irradiance distribution, and applies a surface-specific compensation of reflectance anisotropy effects [31]. Hereafter, SBAani is used to refer to anisotropy-corrected shortwave broadband albedo. For the purpose of testing the impact of the anisotropy correction, we calculated another albedo product without such a correction and assuming Lambertian surface reflectance, hereafter termed SBAiso. The distinction of different surface materials present on the glacier surface is based on a semi-automatic classification using the Spectral Angle Mapper algorithm implemented in ENVI [31]. Therefore, expert knowledge about predominant surface classes (e.g., snow, ice, water, and debris) as well as about surface-specific anisotropy characteristic is needed to facilitate the anisotropy correction. However, at a minimum, one should distinguish between snow and ice to account for the anisotropy. If the input data is of multispectral nature, the algorithm assumes a linear trend between the individual spectral bands, imitating the spectral resolution of APEX (Figure 3).

Reflectance Anisotropy Correction

As snow and ice are non-lambertian but forward-scattering surfaces [47], albedo values are typically underestimated if observed from nadir [34]. We therefore implemented a scheme to correct reflectance anisotropy effects that includes both the effects of local topography and viewing geometry by taking into account slope, aspect, viewing angle, and the solar zenith angle for each individual pixel. Considering surface topography allows calculating the effective viewing angle that can significantly exceed the sensor viewing angle (e.g., APEX scan angle: ±14°) if the pixel is located on a steep slope. Since anisotropy effects can be substantially greater for such large viewing angles, it is essential to account for local topography as well. Furthermore, the correction scheme allows distinguishing different materials (i.e., snow, ice, water and debris, and different sub-types of ice) due to their different reflectance anisotropy characteristics. It must be noted that proposed correction scheme is still a simplification and does not account for changing reflectance anisotropy patterns as a function of surface exposition. However, the scheme is a best-effort approximation of these processes and it is based on reliable field measurements by an ASD field spectrometer corresponding to real surface characteristics. For details on the method please refer to [31].

3.2. Resampling of APEX Data to Simulate Sentinel-2 and Landsat 8

Operational optical satellites sensors such as S2 and L8 provide surface reflectance data at distinct spectral bands. The retrieval of spectral albedo depends on assumptions on the reflectance behaviour between sampled wavelength regions and may additionally vary due to changing wavelength ranges considered. We used the APEX data to simulate S2 and L8 data by convolving the spectral resolution considering the specification of S2 and L8 (APEXconv S2, APEXconv L8). Moreover, original APEX data and simulated S2 and L8 data were spatially resampled to 20 m (APEXconv S220 m) and 30 m (APEXconv L830 m) ground-sampling distances, i.e., the spatial resolutions of both satellites, using an aggregated average interpolation approach. The simulation approaches resulted in nine different datasets: APEX with original spectral resolution and 2, 20 and 30 m spatial resolution, S2 (simulated from APEX) with 2, 20 and 30 m spatial resolution, and L8 (simulated from APEX) with 2, 20 and 30 m spatial resolution.

3.3. Narrow-to-Broadband Conversion

Albedo retrievals based on multispectral optical satellite data essentially relate to shortwave broadband albedo considering the wavelength range from 0.38 to 2.5 µm. Since accurate estimates of the energy balance for snow and ice rely on knowledge of the so-called broadband albedo, the albedo comprising the entire solar spectrum, a narrow-to-broadband conversion is needed to employ albedo estimates from multispectral satellite data for energy balance modelling purposes. Such narrow-to-broadband conversions typically weight and aggregate individual spectral bands and assume certain spectral properties in wavelength regions not measured. Both assumptions underlying the conversion cause uncertainties in retrieved albedo products.
Imaging spectroscopy data provide continuous information of the spectral albedo considering the wavelength range from 0.4 to 2.5 µm. Resulting shortwave broadband albedo products can be considered as a benchmark to assess the impact of spectral and spatial resolution on albedo estimates. We selected the two most commonly applied narrow-to-broadband conversion formulae by Knap et al. [29] and by Liang [30] and compared them with our SBA algorithm. While these formulae are based on Landsat 5/7 data, we use the best corresponding bands of Sentinel-2 and Landsat 8, being aware that some of the band widths differ considerably (Figure 3). While Knap et al. [29] based their formula on two bands only, Liang [30] incorporated five individual bands. For both approaches we kept the empirical weighting parameters specified in the literature and assigned the corresponding band numbers for S2 and L8, respectively. Hence, the formulae adopted for S2 are as follows:
α K n a p =   0.726 b 3 0.322 b 3 2   0.015 b 8 + 0.581 b 8 2
α L i a n g =   0.356 b 2 + 0.130 b 4 + 0.373 b 8 + 0.085 b 11 + 0.072 b 12 0.0018
and for Landsat 8 as follows:
α K n a p =   0.726 b 3 0.322 b 3 2   0.015 b 5 + 0.581 b 5 2
α L i a n g =   0.356 b 2 + 0.130 b 4 + 0.373 b 5 + 0.085 b 6 + 0.072 b 7 0.0018
In all formulae, bn represents the spectral band number of S2 and L8. To apply these formulae to the APEX datasets, we convolved the APEX bands to Landsat 5/7 spectral characteristics.

3.4. Pre-Processing of Different Datasets

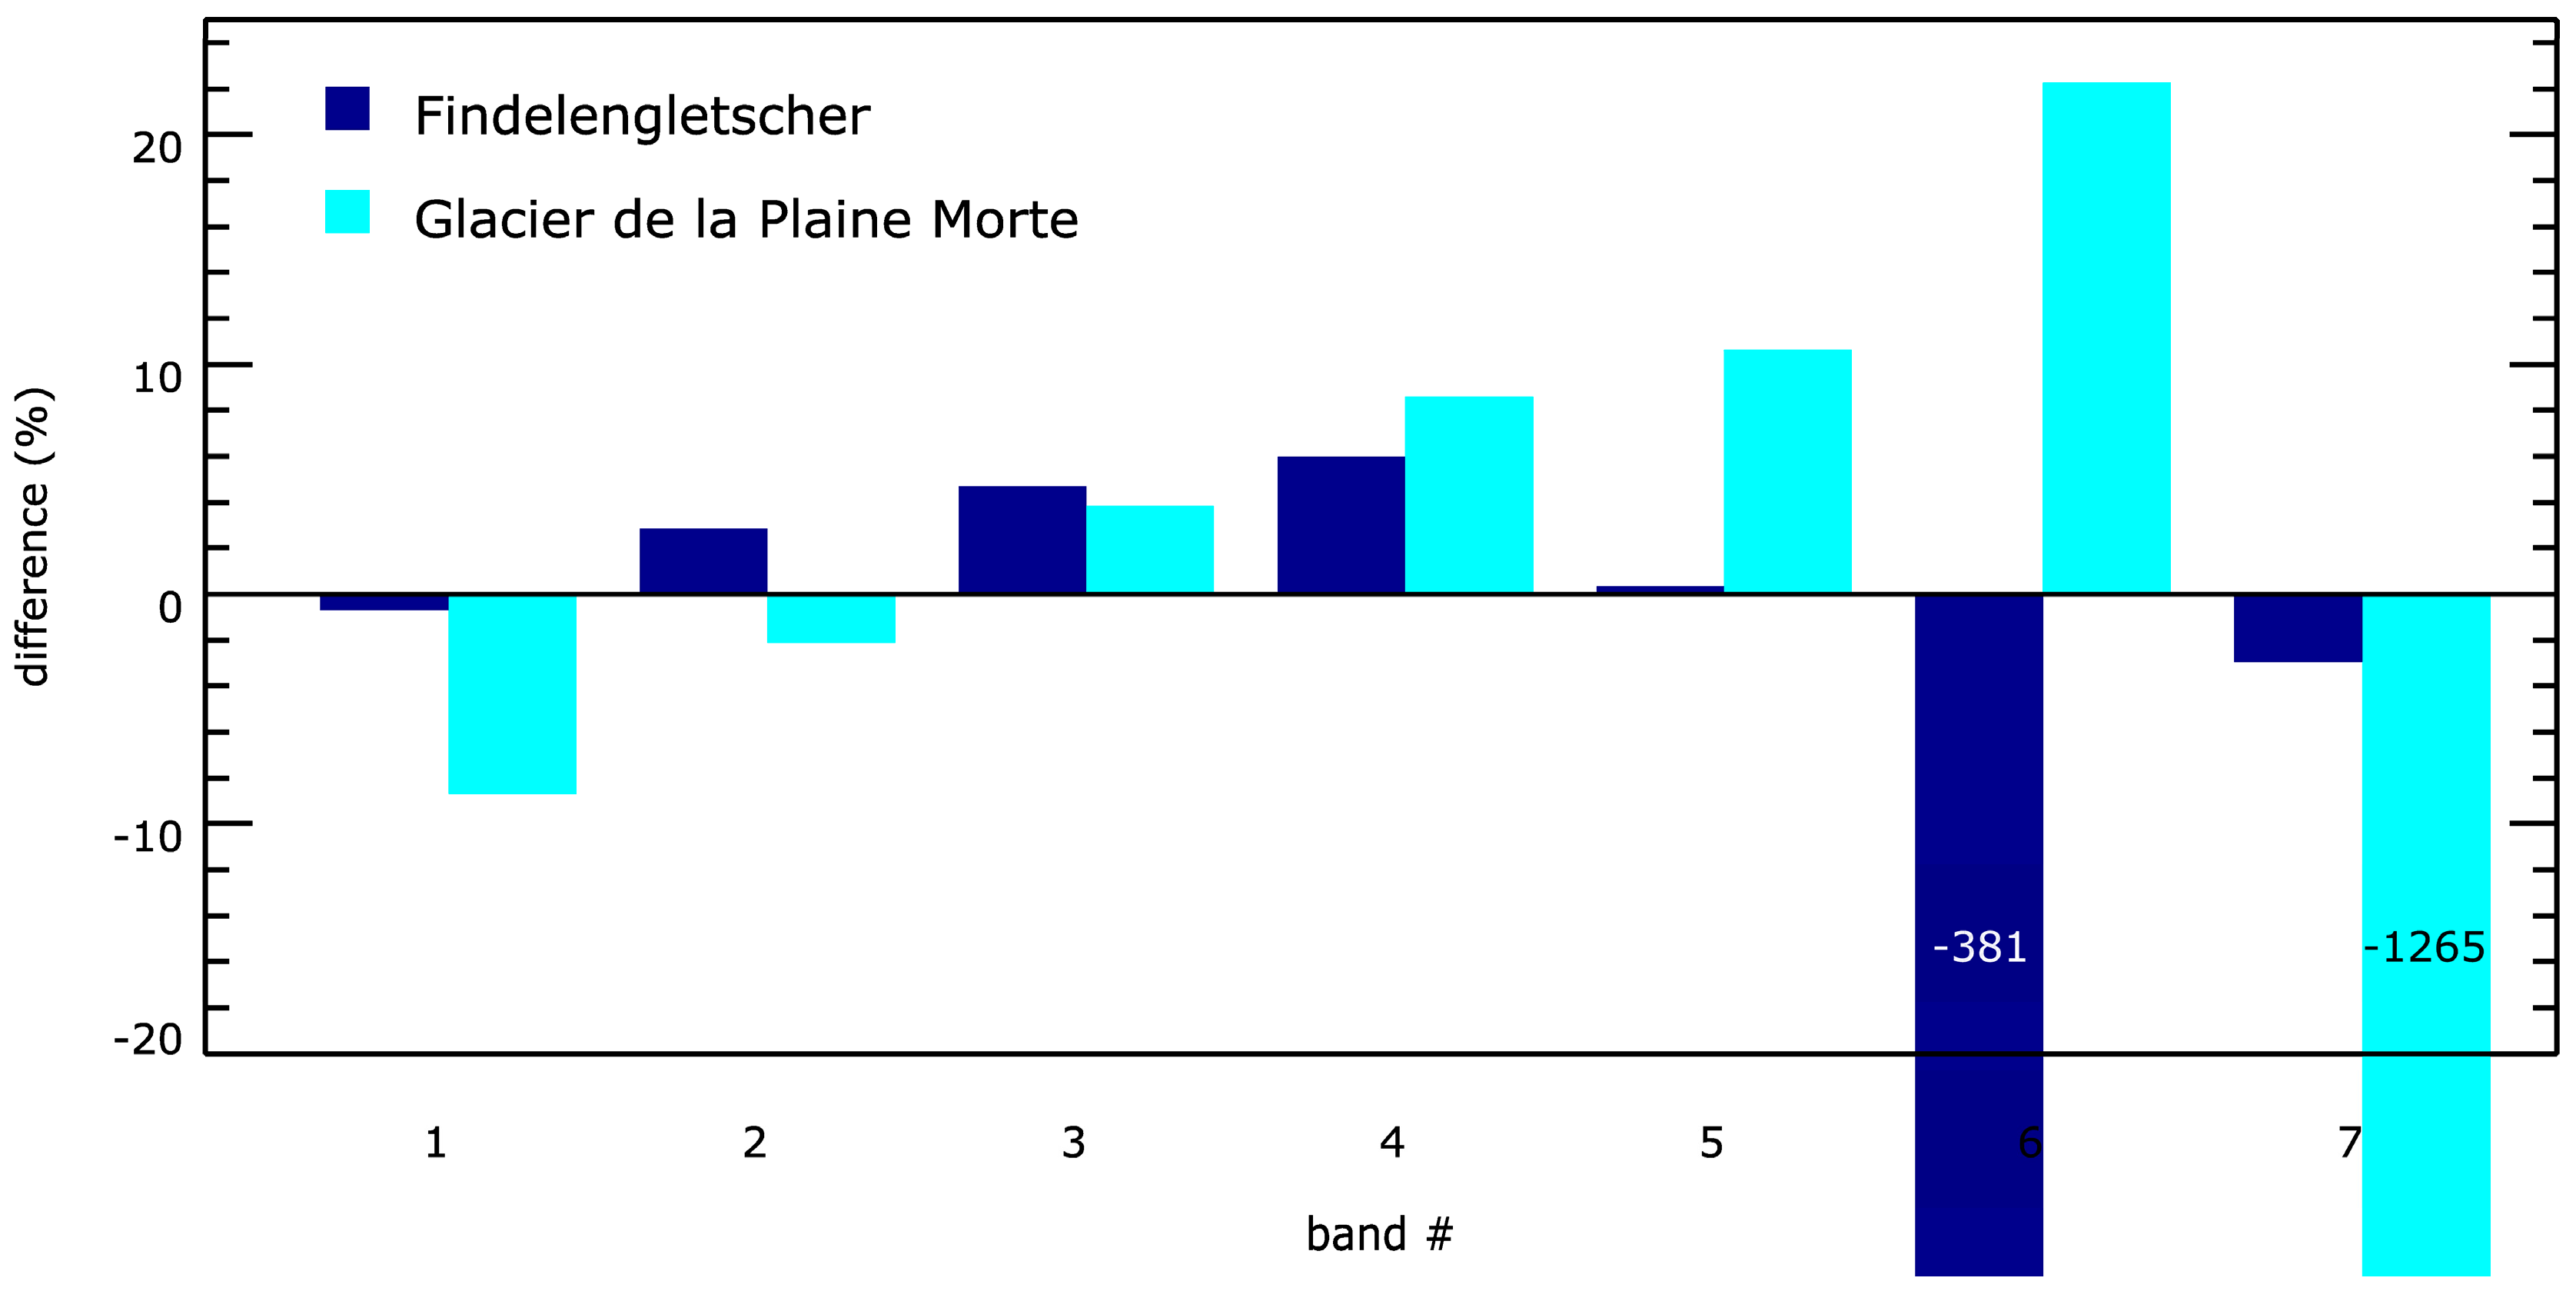
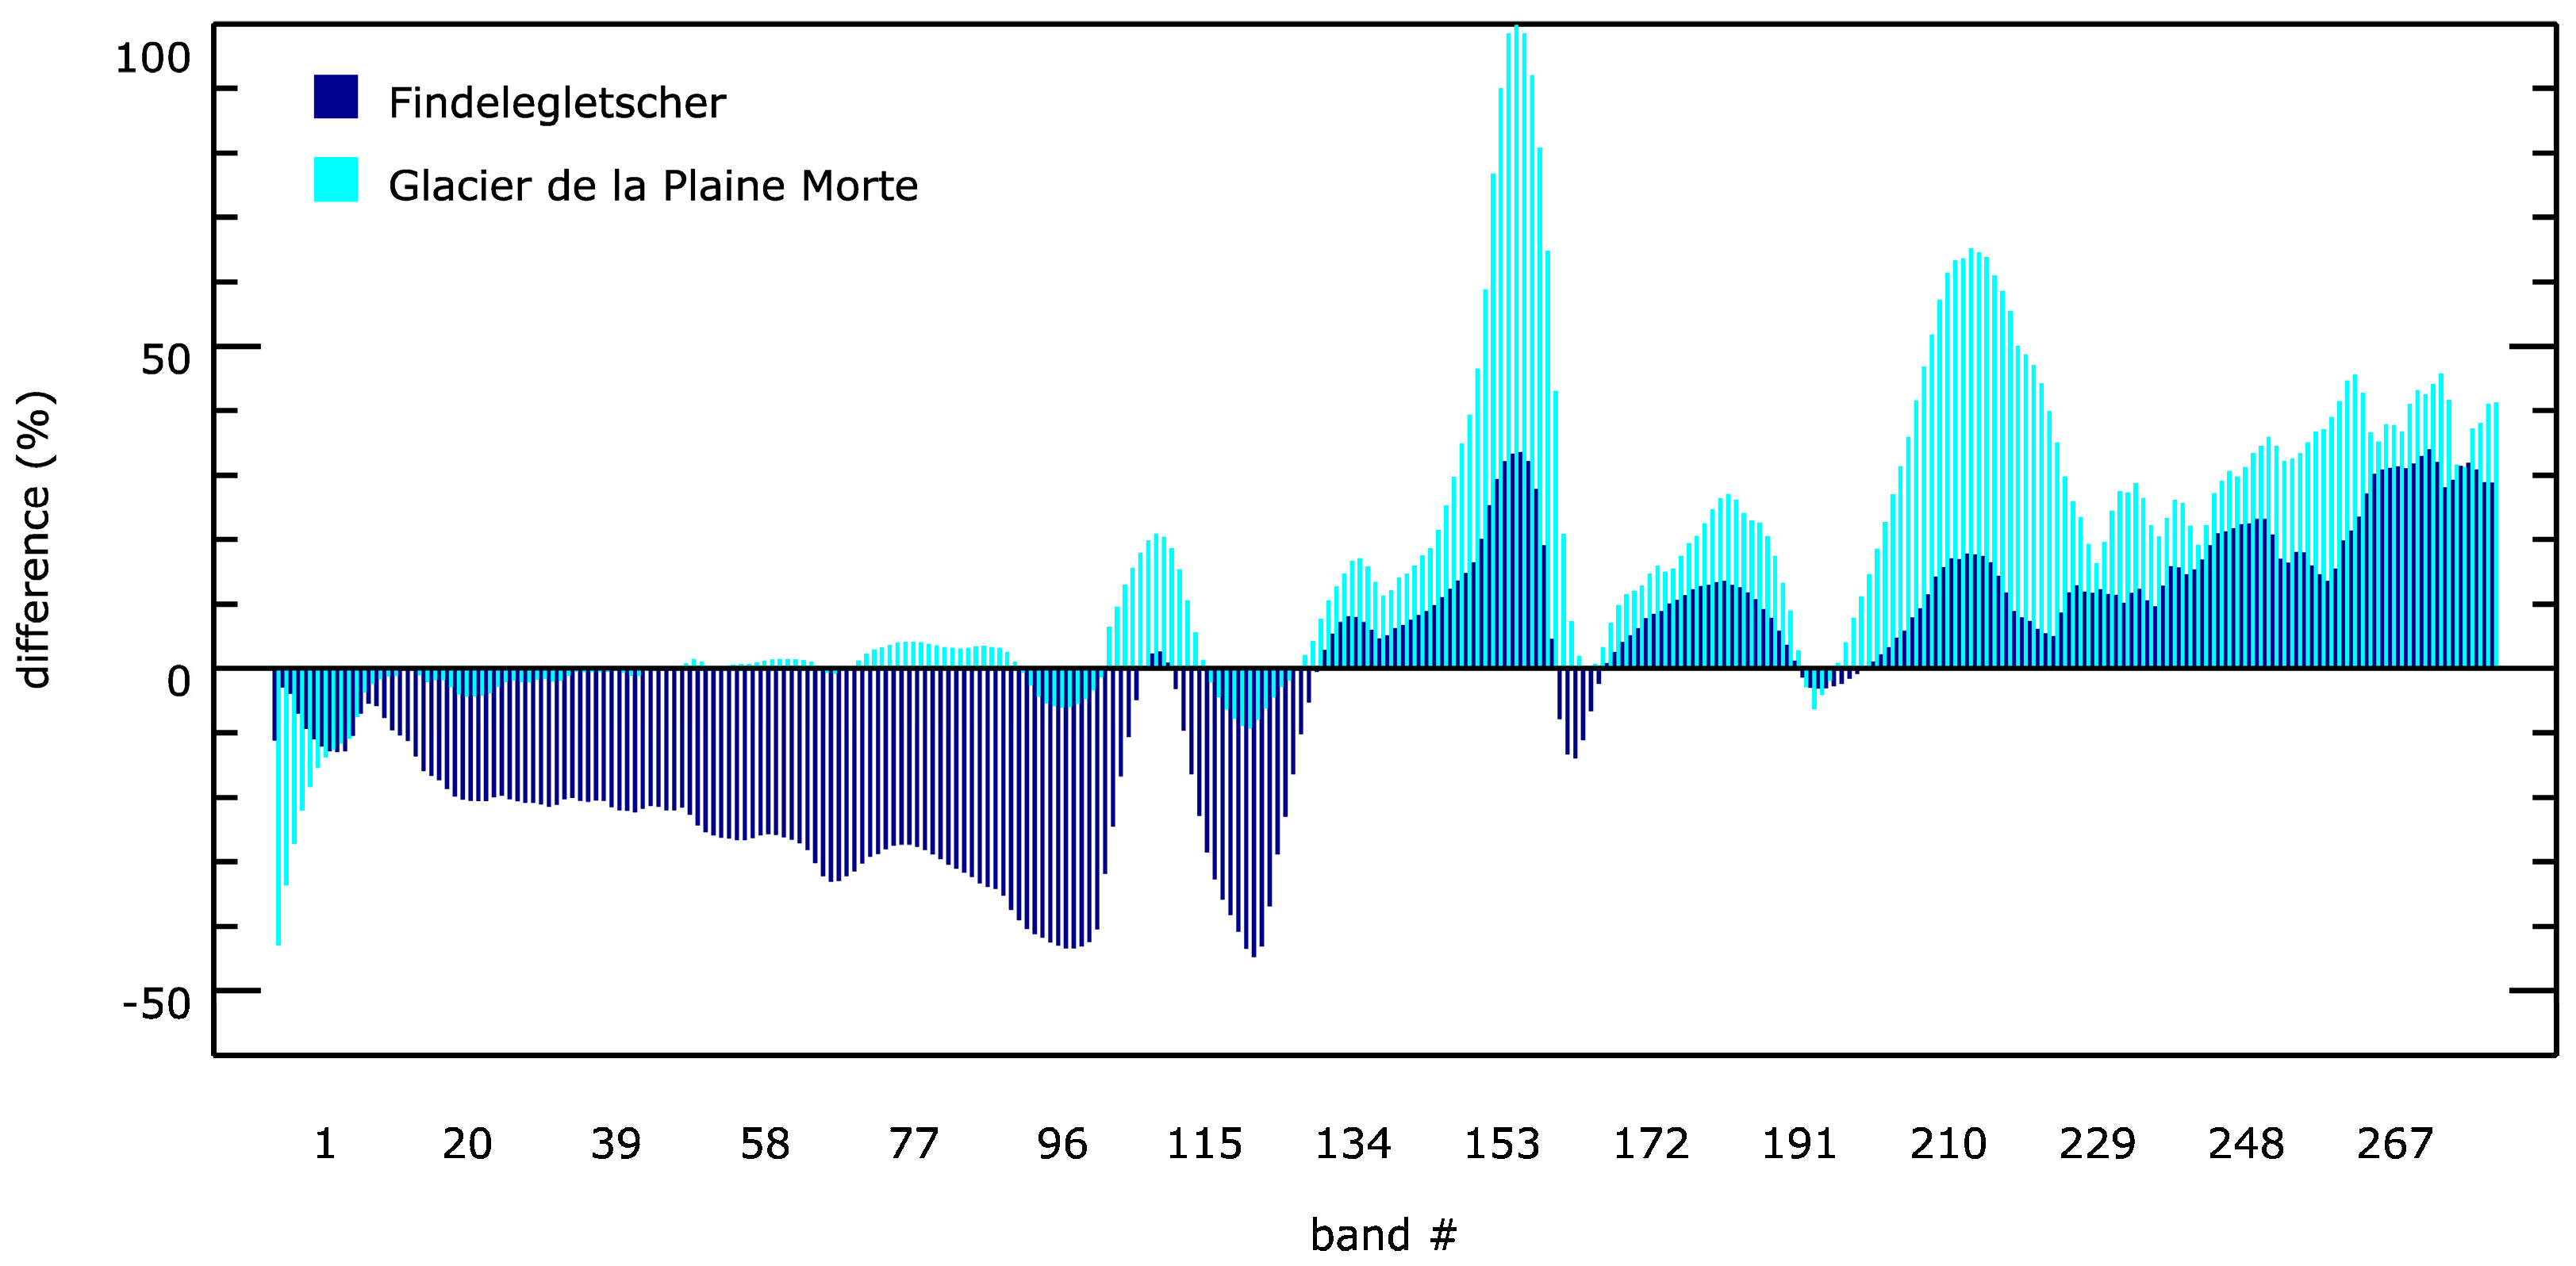
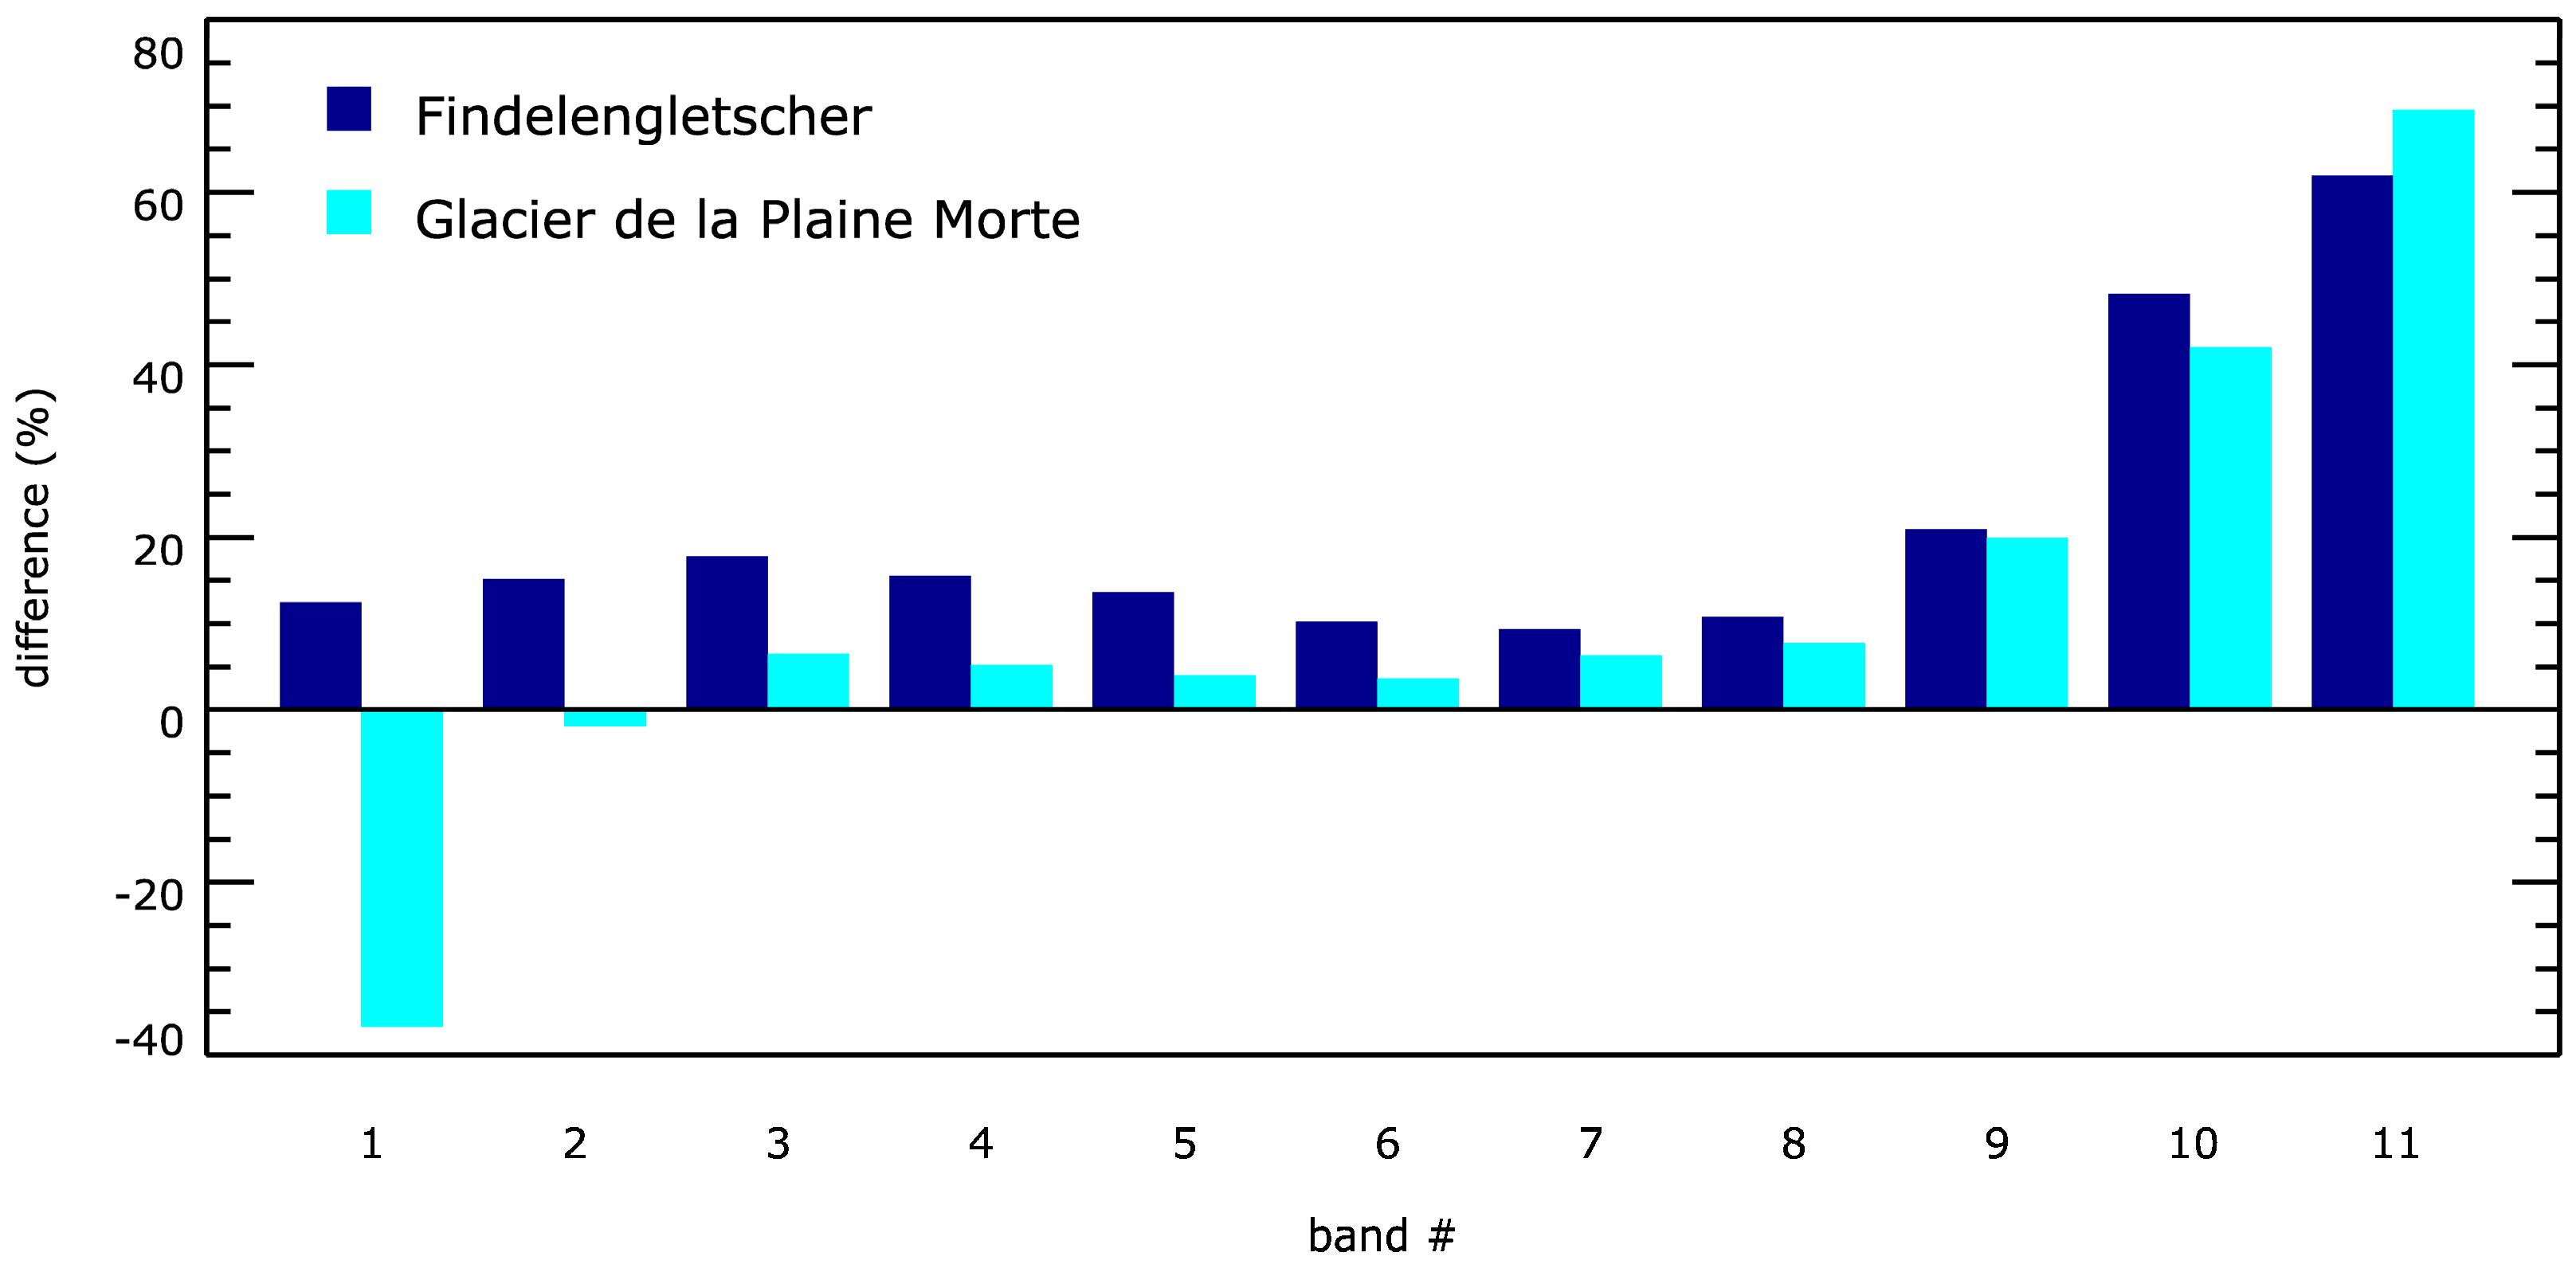
3.4.1. Vicarious Calibration

We applied a vicarious calibration to all datasets (i.e., APEX, S2 and L8) using field spectroscopy data measured separately for both glaciers. Changing sensor calibration and artefacts of the atmospheric correction likely impose differences in derived albedo products that hinder disentangling effects of spectral and spatial sampling on albedo product accuracy. The applied vicarious calibration minimizes such pre-processing artefacts, ensures optimal comparability of albedo products, and eventually allows assessing the impact of spectral and spatial resolution on the retrieval of albedo products. The calibrated bands of the different datasets differ on average between 3% and 17% from their original (see Appendix A).

3.4.2. Cloud Removal

The APEX scene over PM contains cloud-covered and cloud-shadowed areas on the southern side of the glacier. We delineated these areas manually and excluded the respective areas from further analyses. In total, about 25% of the entire glacier surface was masked out (white area in all following PM figures). Although both the S2 and L8 scenes were completely cloud-free over the PM study site, we only used the cloud-free area as defined by the APEX dataset for further analyses.

3.5. Experimental Setup

We structured our analysis, consecutive results and discussion in four experiments to tackle the four stated research objectives. Experiment 1 is solely based on data simulated from APEX to optimally control the sensitivity assessment of albedo retrievals for spectral and spatial resolution and to avoid disturbances by other effects (e.g., artefacts of atmospheric and geometric correction, land cover change due to slightly different observation times). Experiments 2–4 are based on original datasets (i.e., APEX, S2 and L8) to deduce the impact of environmental conditions (Experiment 2), to examine the applicability of published narrow-to-broadband conversions (Experiment 3), and to quantify the impact of anisotropy effects for snow and ice albedo estimates (Experiment 4). The use of original data that were acquired under slightly different environmental conditions implies varying albedo estimates even if the same retrieval algorithm for comparable spatial and/or spectral resolution is applied. It is important to keep this in mind when cross-comparing or interpreting results of different experiments.

4. Results

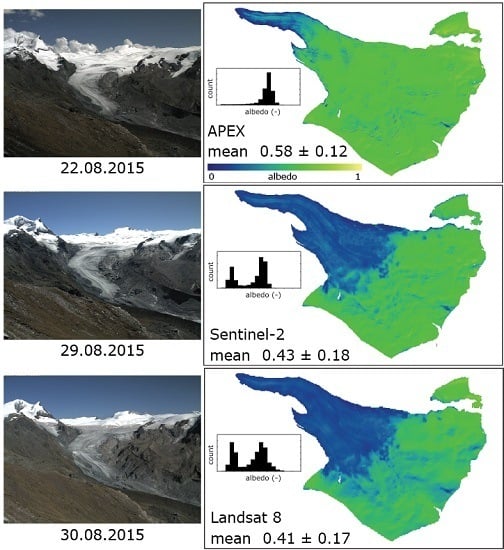
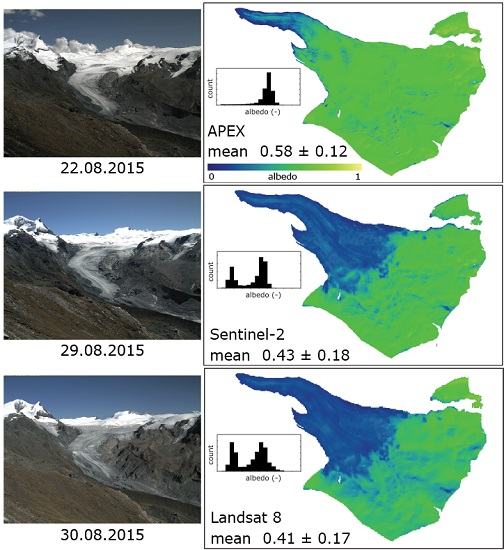
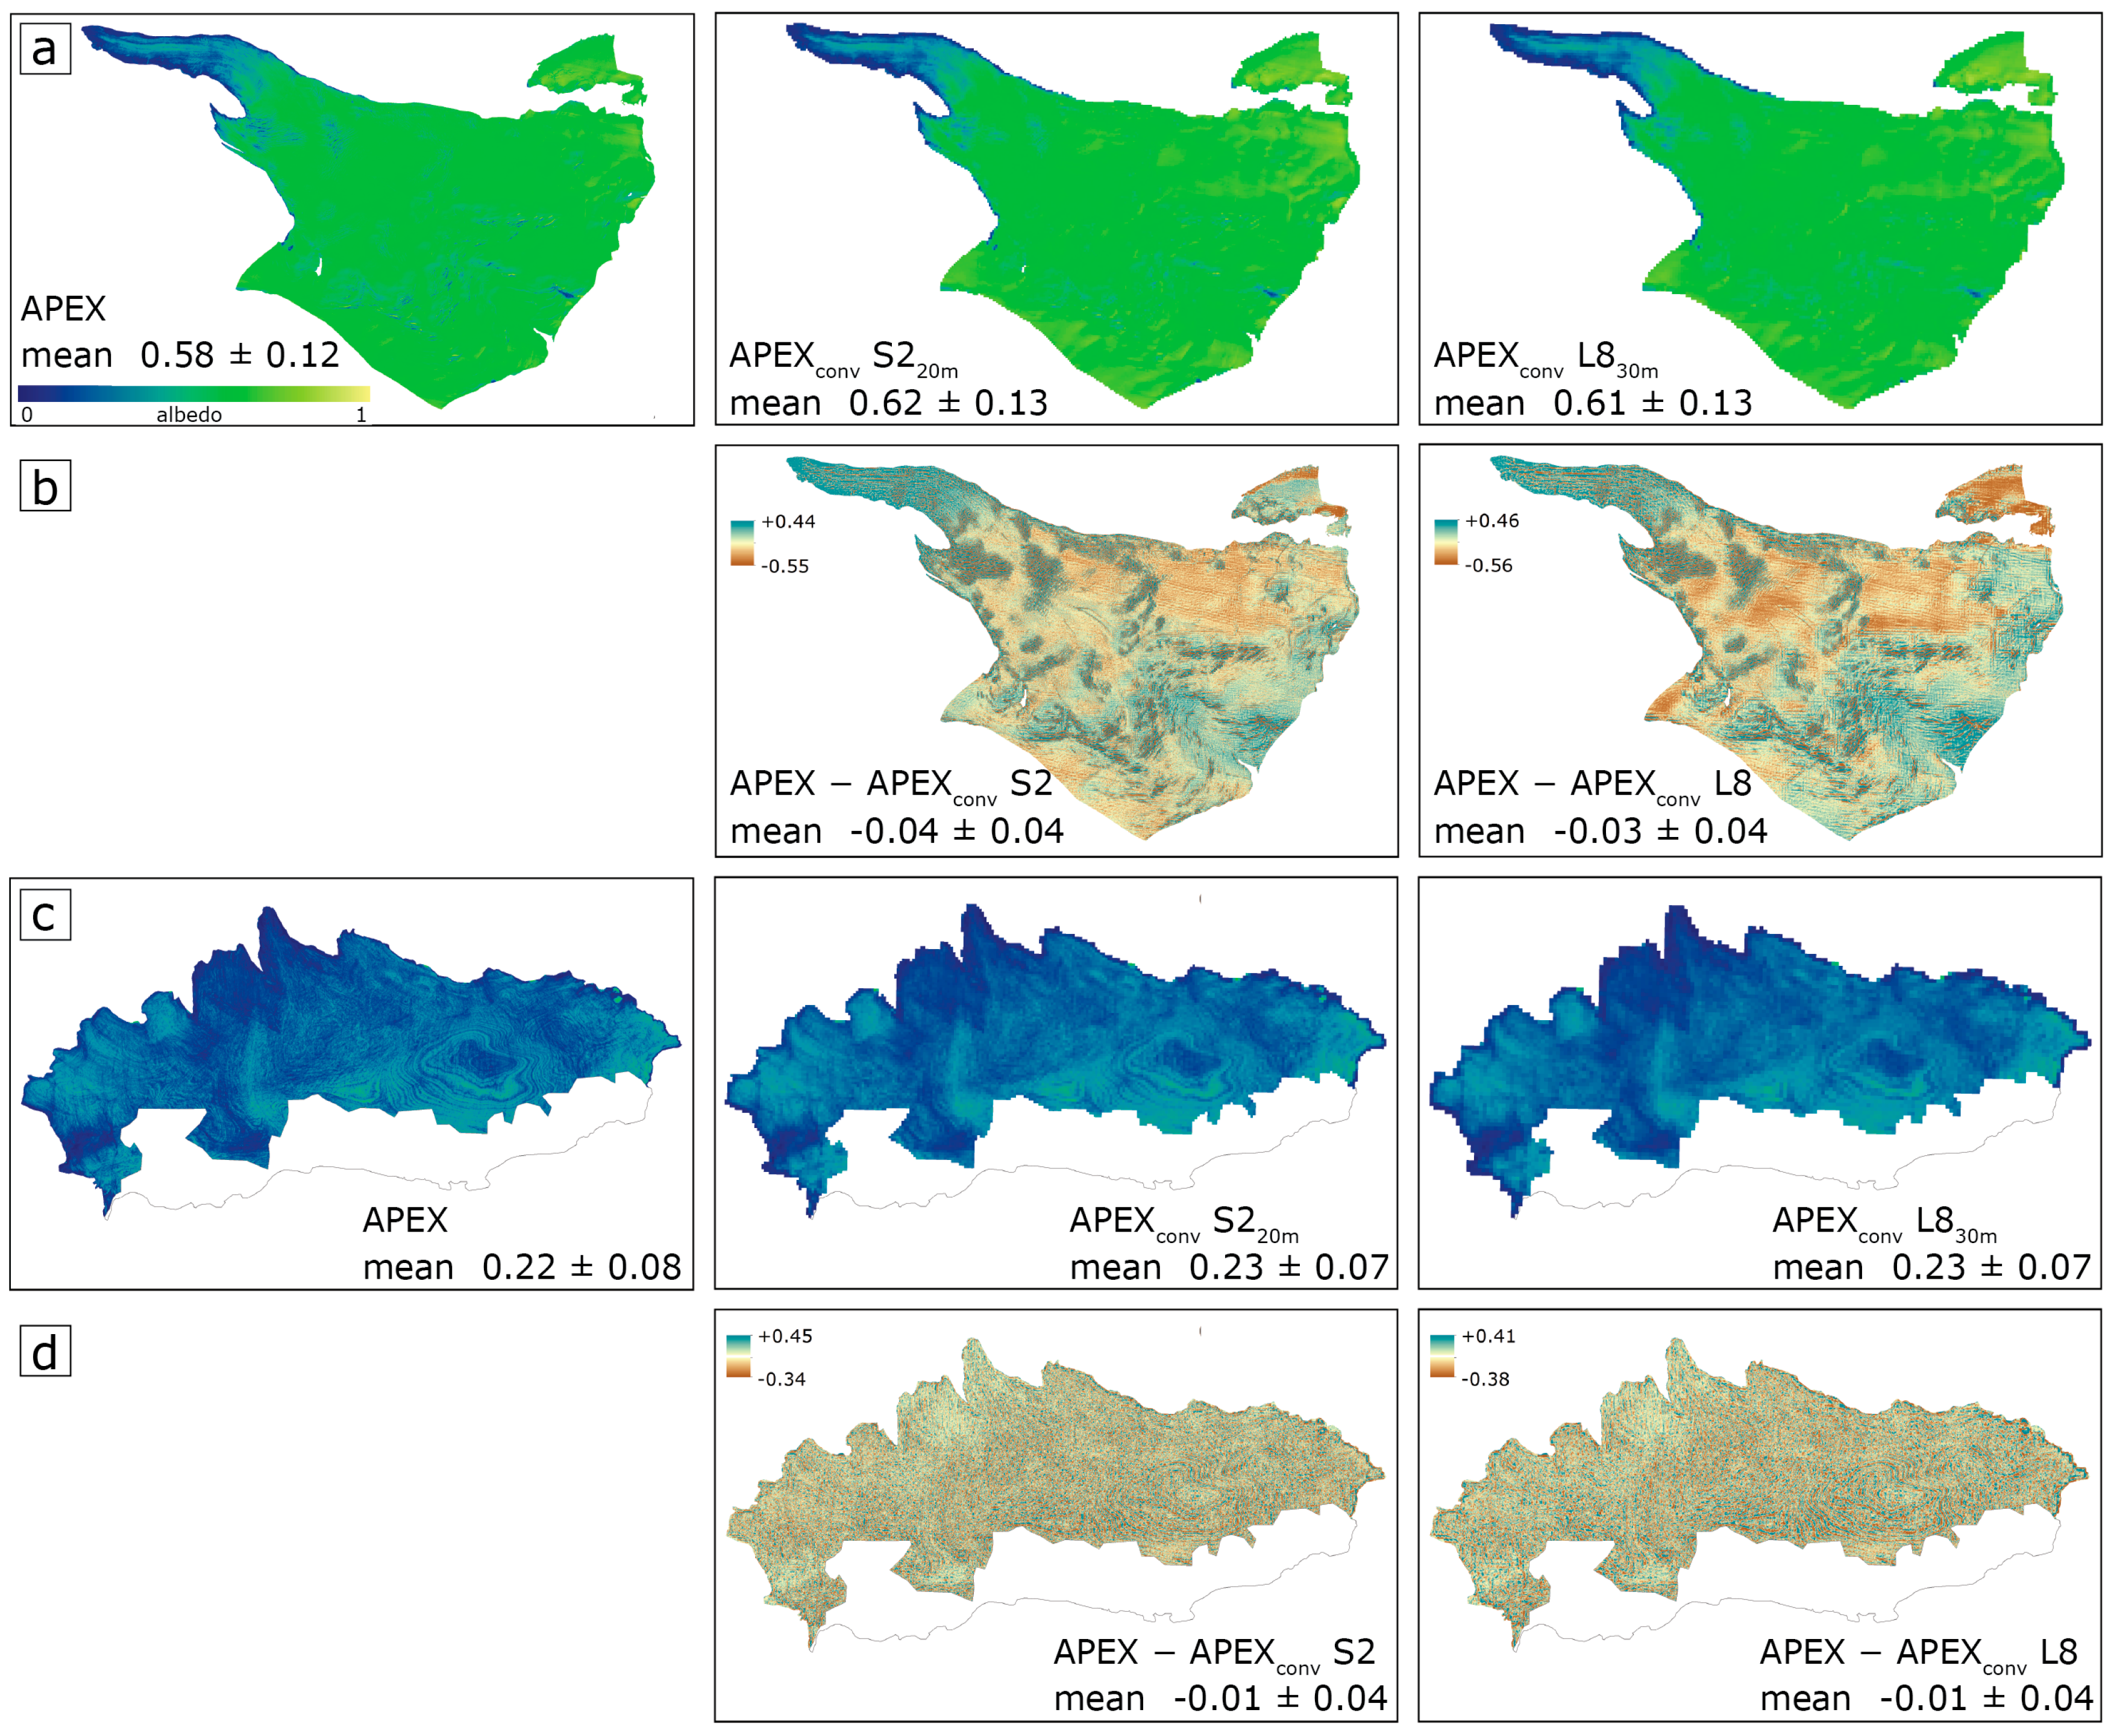
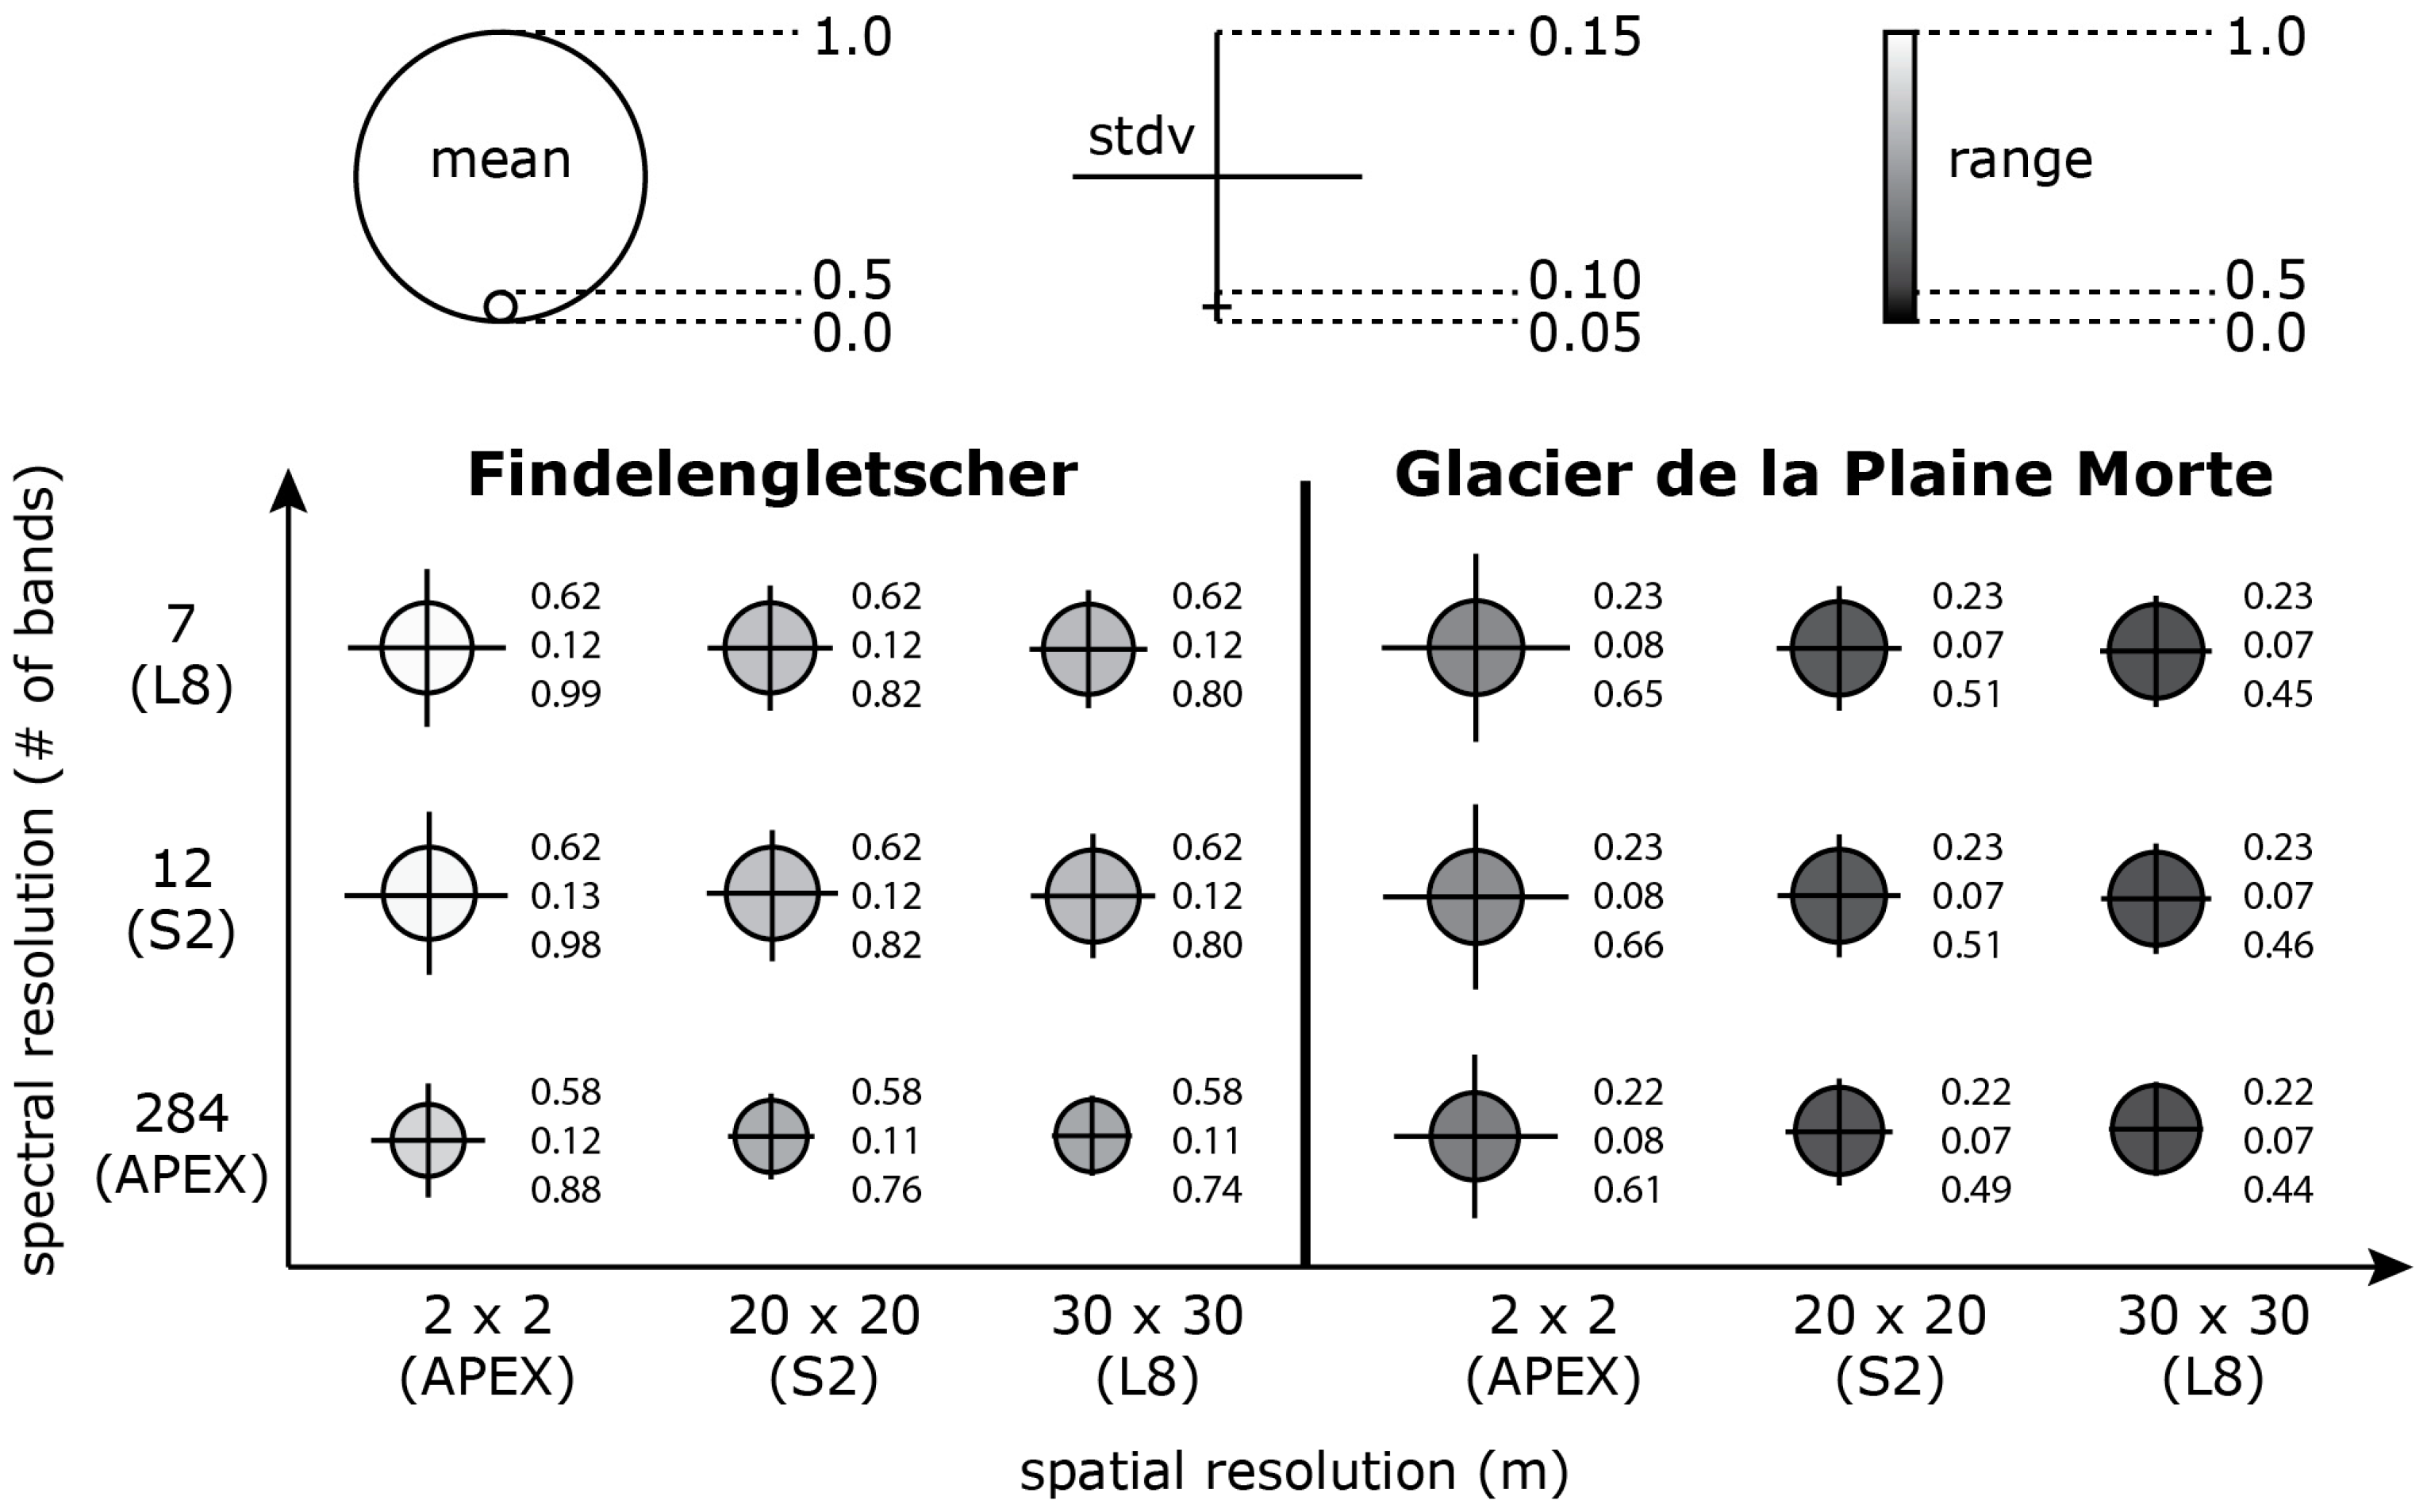
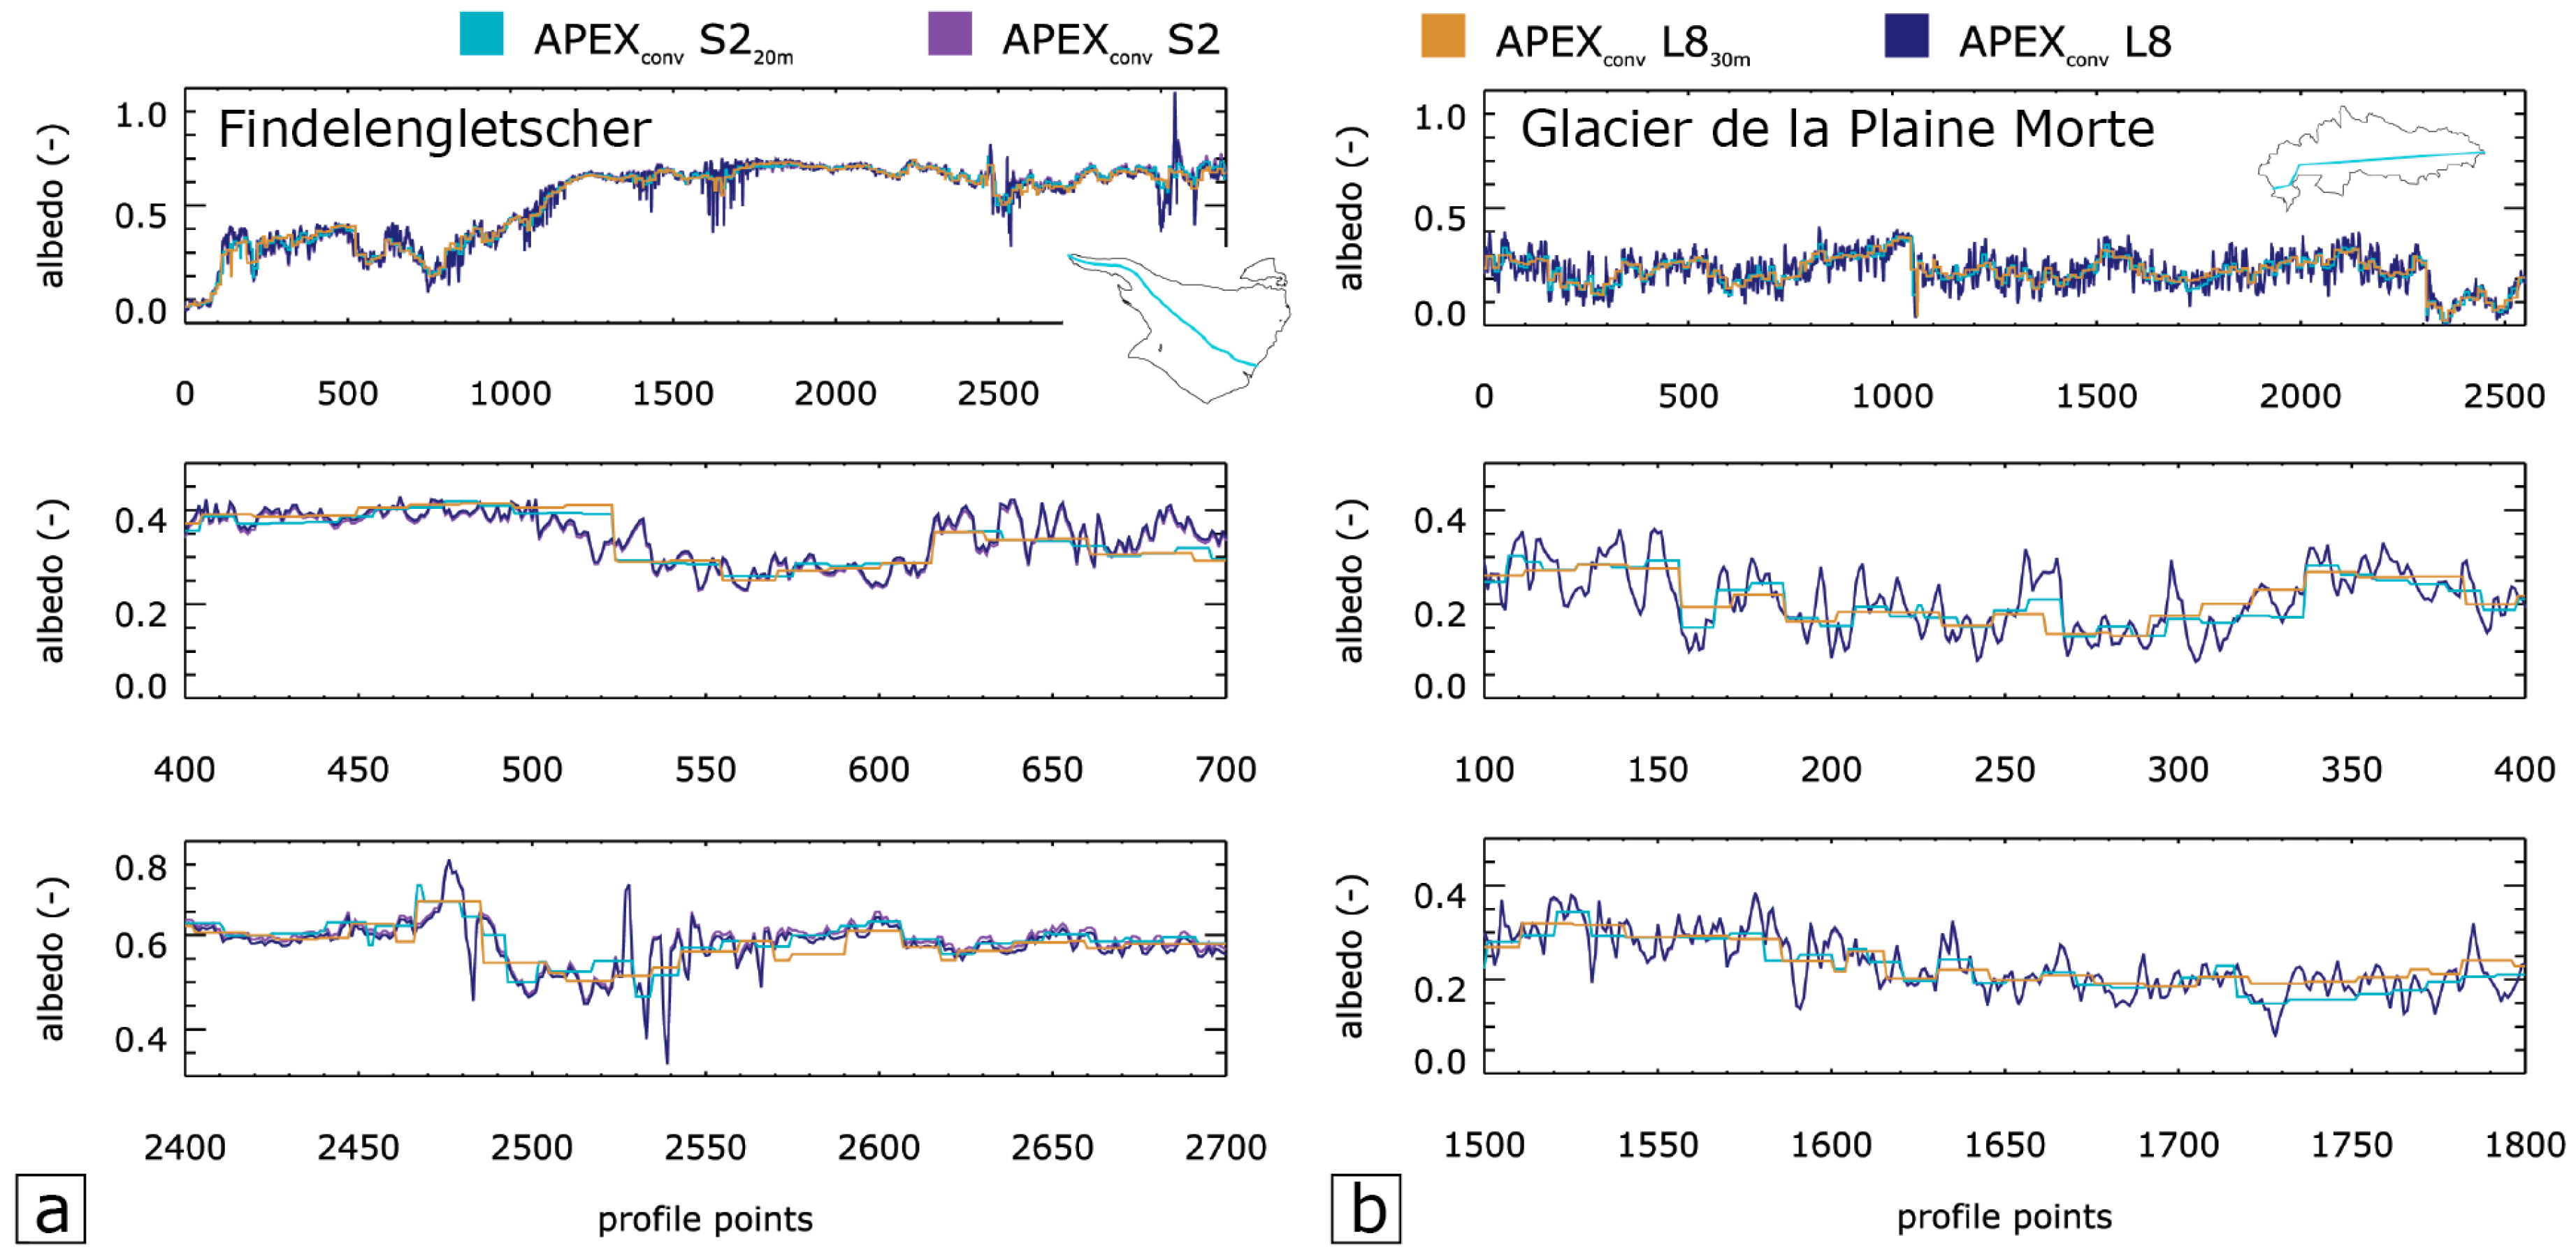
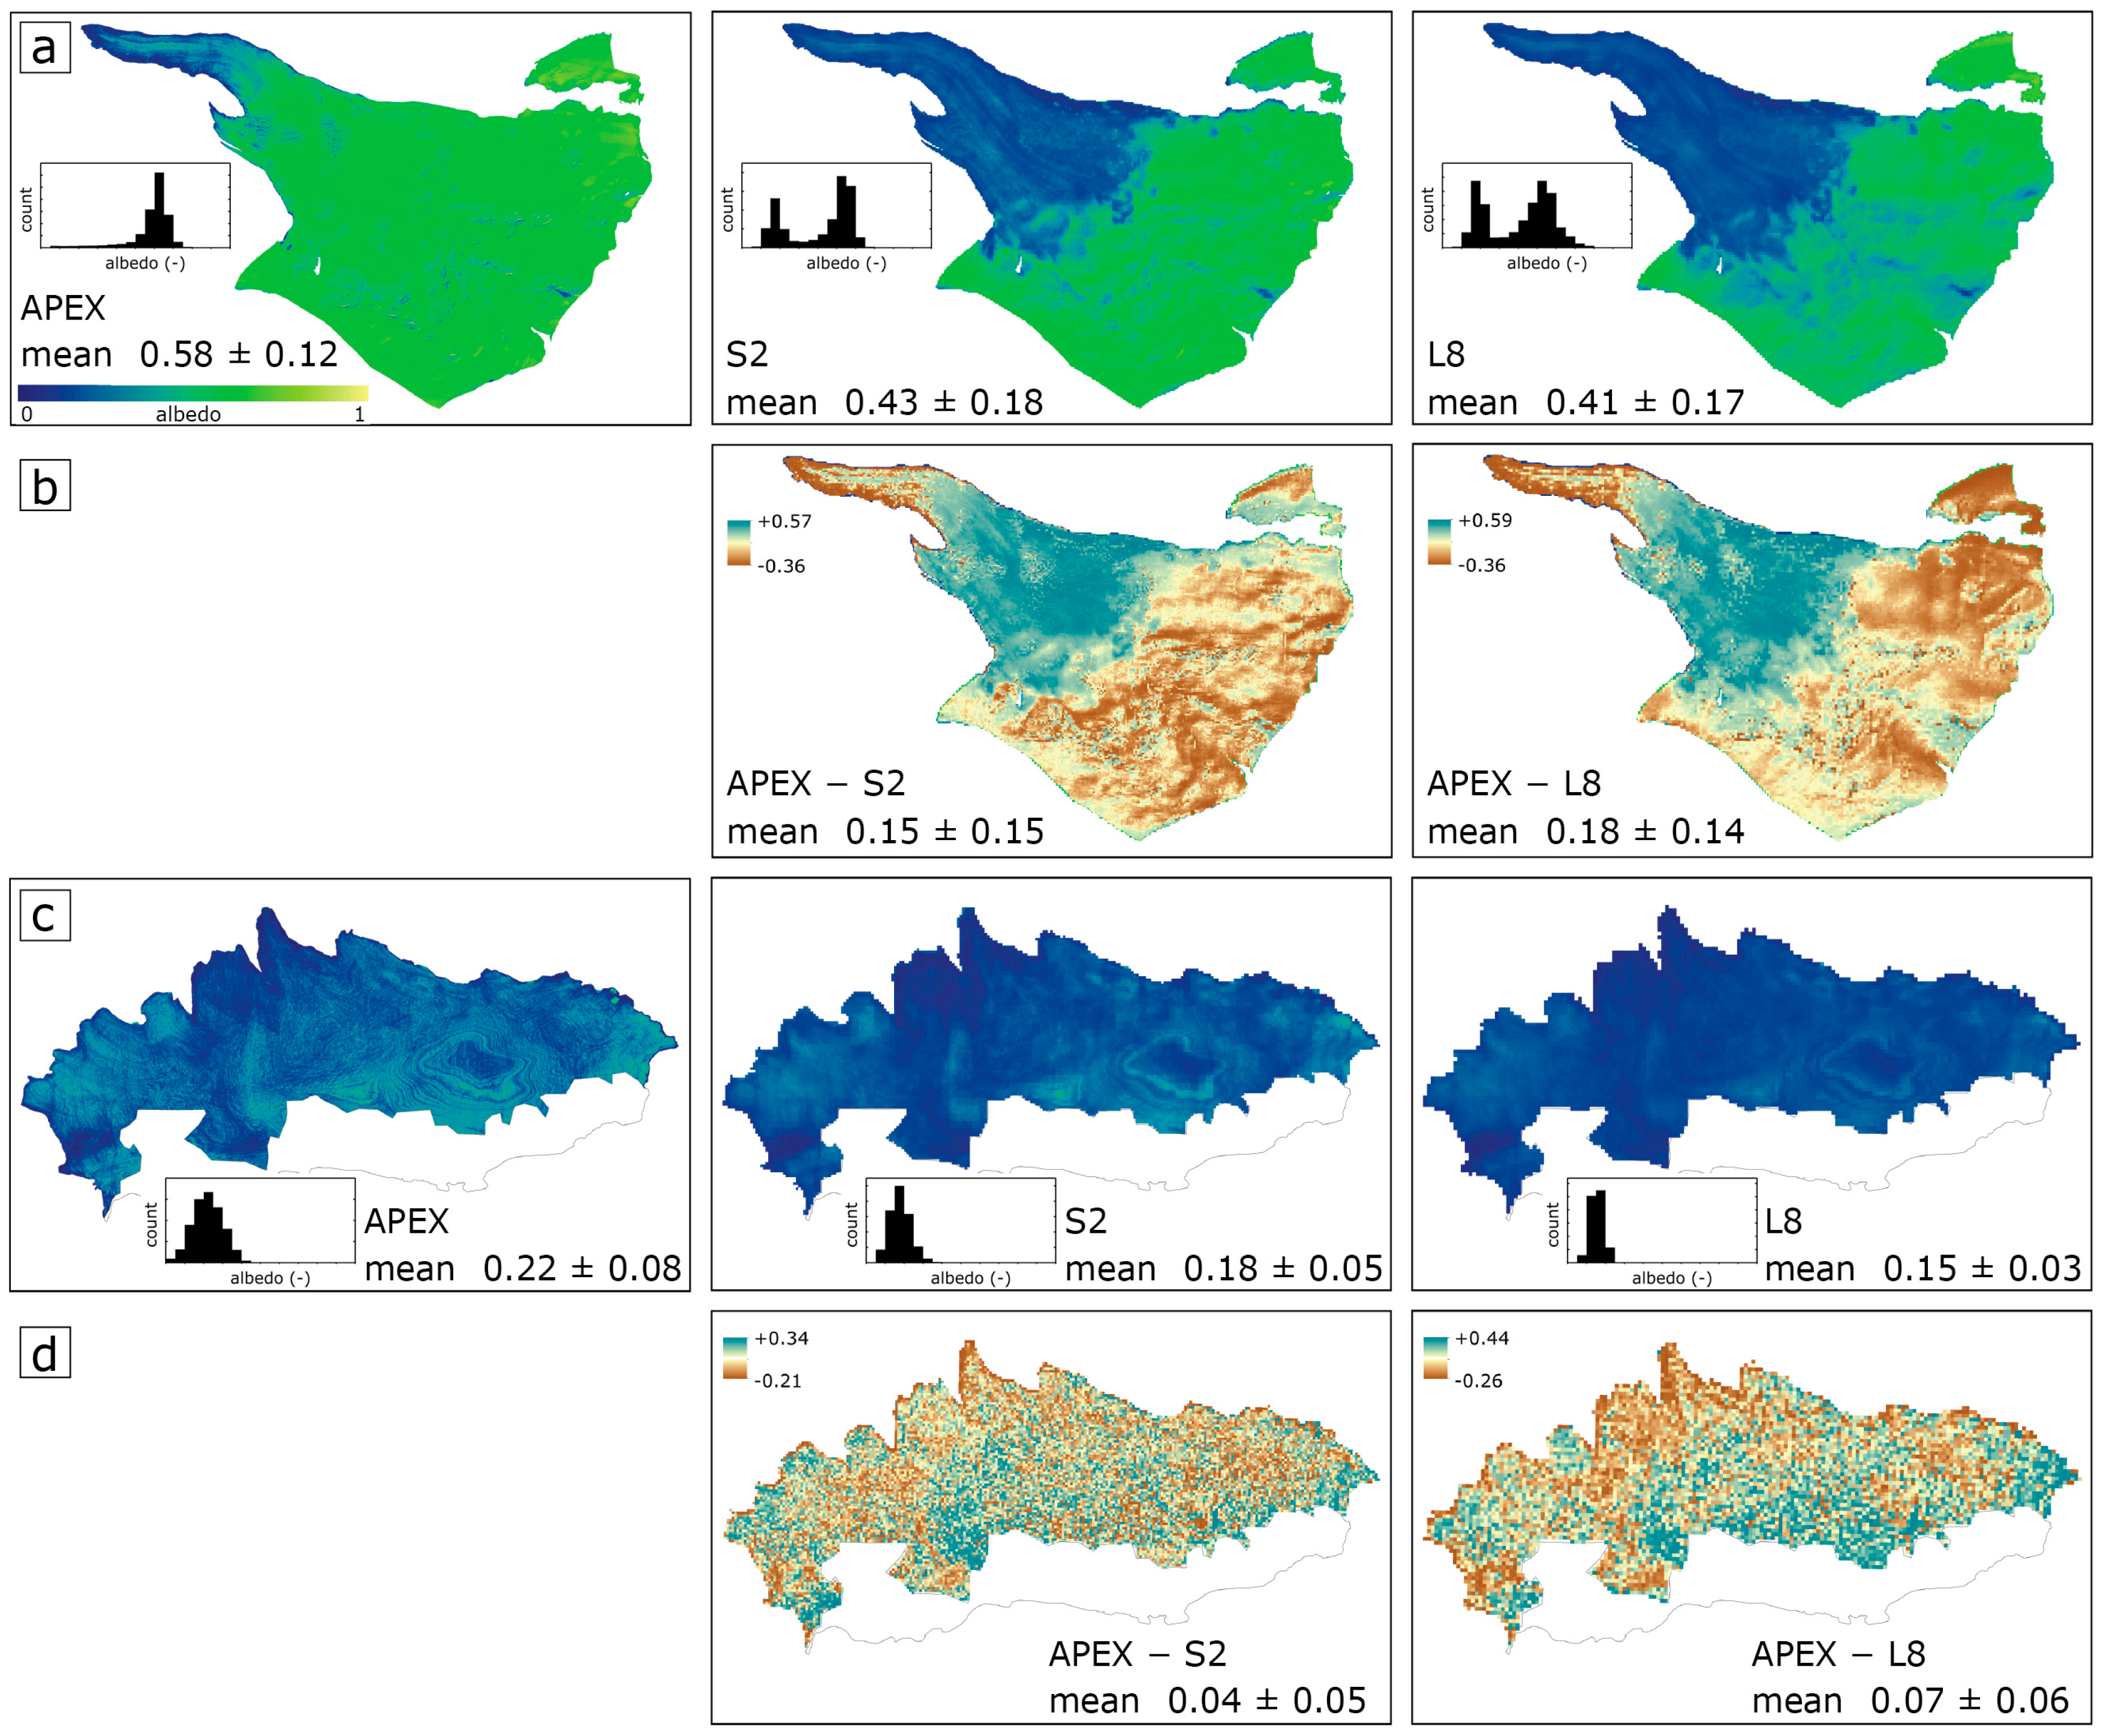
4.1. Impact of Spectral and Spatial Resolution (Experiment 1)

We convolved the APEX dataset to different spectral and spatial resolutions considering the characteristics of S2 and L8 (see also Section 3) to investigate the impact of spectral and spatial resolution of satellite imagery on mean glacier-wide shortwave broadband albedo. The original APEX dataset with 284 spectral bands and a 2 m × 2 m ground-sampling distance served as the reference. The use of APEX data revealed a mean albedo of 0.22 ± 0.08 for PM and of 0.58 ± 0.12 for FG. With decreasing spectral and spatial resolution, mean albedo increases to 0.23 ± 0.07 for PM and to 0.62 ± 0.13 for FG for both S2 and L8 (Figure 4).
A more systematic analysis indicates that a decreasing spectral resolution and sampling from 284 bands to 12 bands, and to 7 bands, respectively, corresponds to an increase in glacier-wide mean albedo by about 6% for FG and about 4% for PM, regardless of the spatial resolution. The spatial convolution from 2 to 20 and to 30 m, respectively, only slightly impacted the glacier-wide mean albedo by about +0.5% on average for both FG and PM, regardless of the spectral resolution. In general, the following trends for both glaciers were detected: a decreasing spatial resolution had little impact on the glacier-wide mean albedo, resulting in slightly reduced standard deviations and revealing narrower ranges of albedo values. Contrastingly, the spectral convolution resulted in a slight increase in glacier-wide mean albedo and standard deviations, as well as an increased range of albedo values (Figure 5). The systematic increase in albedo with higher spectral and spatial aggregation can be explained by the fact that spectrally aggregated data do not resolve small-scale absorption features. This effect in combination with the material composition and corresponding spectral shapes, as well as the assumption of linear behaviour between spectral measurements yields slightly higher albedo values (see also Figure 3).
The influence of spatial resolution on the variability of albedo becomes more apparent when point albedo values along profiles of the different products are plotted (Figure 6). While the S2 and L8 data simulated from APEX (APEXconv S2 and APEXconv L8) show an important small-scale variability, the simulated S2 and L8 products with their respective original resolution (APEXconv S220 m and APEXconv L830 m) appear smoother, i.e., with much less spatial heterogeneity. However, the general patterns—for example, between points 2450 and 2600 for FG or points 150 to 280 for PM—are similarly represented in coarse resolution S2 and L8 albedo products as well. Nevertheless, especially for the lower reaches of FG (Figure 6a, middle and bottom) and the entire cross-profile of PM, the S2 and L8 data products APEXconv S220 m and APEXconv L830 m are, due to their coarser spatial resolution, not capable of capturing the heterogeneous albedo distribution.

4.2. Impact of Environmental Factors on Albedo Products across Datasets (Experiment 2)

The SBAani algorithm was applied to APEX as well as original S2 and L8 data over FG and PM to evaluate the capability of both satellite sensors to derive an anisotropy-corrected shortwave broadband albedo product and to assess spatio-temporal variability of albedo (Figure 7). Considering the typical impact of spectral and spatial resolution on albedo products (see above), we expect that most of the differences revealed from such a comparison can be attributed to environmental factors. Since the observational dates slightly differed (maximum one week, Table 1), precipitation events (snow fall) and increased melting can cause considerable variations in albedo (Figure 2).
A similar albedo distribution pattern is revealed in all three albedo products for PM, whereas for FG, APEX displays higher albedo values compared to those obtained from S2 and L8. For PM, albedo frequency distributions for all sensors are similar and unimodal, i.e., most albedo values range between approximately 0.10 and 0.35. For FG, APEX shows a unimodal albedo frequency distribution with most albedo values ranging from 0.55–0.70. In contrast, both albedo products from S2 and L8 are characterized by a bimodal frequency distribution, i.e., displaying one peak around 0.15 and another at 0.5–0.6 (see insets in Figure 7a,c). Although the APEX product displays generally higher values due to fresh snow remnants at lower elevations compared to the S2 and L8 products, the general distribution of albedo is highly similar.
As expected, we found a decreasing standard deviation with decreasing spatial resolution for PM (Figure 7c). However, we also observe higher standard deviations for the S2 and the L8 albedo product of FG. This can be explained by the larger variability in albedo values compared to the APEX product since the snowline receded considerably after the APEX overflight (Figure 7a). In contrast to Experiment 1, where the glacier-wide mean albedo increased with higher spectral and spatial aggregation, the results in this experiment show a contradictory trend, i.e., mean albedo values decrease from APEX to S2 and to L8, respectively. However, this is solely driven by the acquisition dates of the datasets and the weather conditions in between them (see Table 1 and Figure 2). Hence, for our experiments, the environmental impact (i.e., albedo differences due to changing environmental conditions) on the shortwave broadband albedo of the glacier surface is much larger, and sometimes reversed, than the impact caused by the sensor (i.e., albedo differences due to varying spectral and spatial resolution and sampling, see Experiment 1) and its specific characteristics (Table 2).

4.3. Impact of Narrow-to-Broadband Conversion (Experiment 3)

Most studies performed so far have used narrow-to-broadband conversion formulae to derive broadband glacier surface albedo. We evaluated two frequently used formulae established for Landsat 5/7 (Equations (1)–(4)) and tested their applicability to S2 and L8 data. The main results of this experiment are summarized in Table 3. Both formulae revealed suitable albedo values for both glaciers. We found that the average results from Knap et al. [29] deviate somewhat stronger (up to +0.1; on average less than 0.05) from our benchmark SBAani product compared to results from Liang [30] (up to +0.02; on average less than 0.001). For both glaciers, two dataset-algorithm combinations (APEXKnap and L8Liang) revealed a low percentage of too high, and hence unrealistic, albedo values.

4.4. Impact of Anisotropy Correction (Experiment 4)
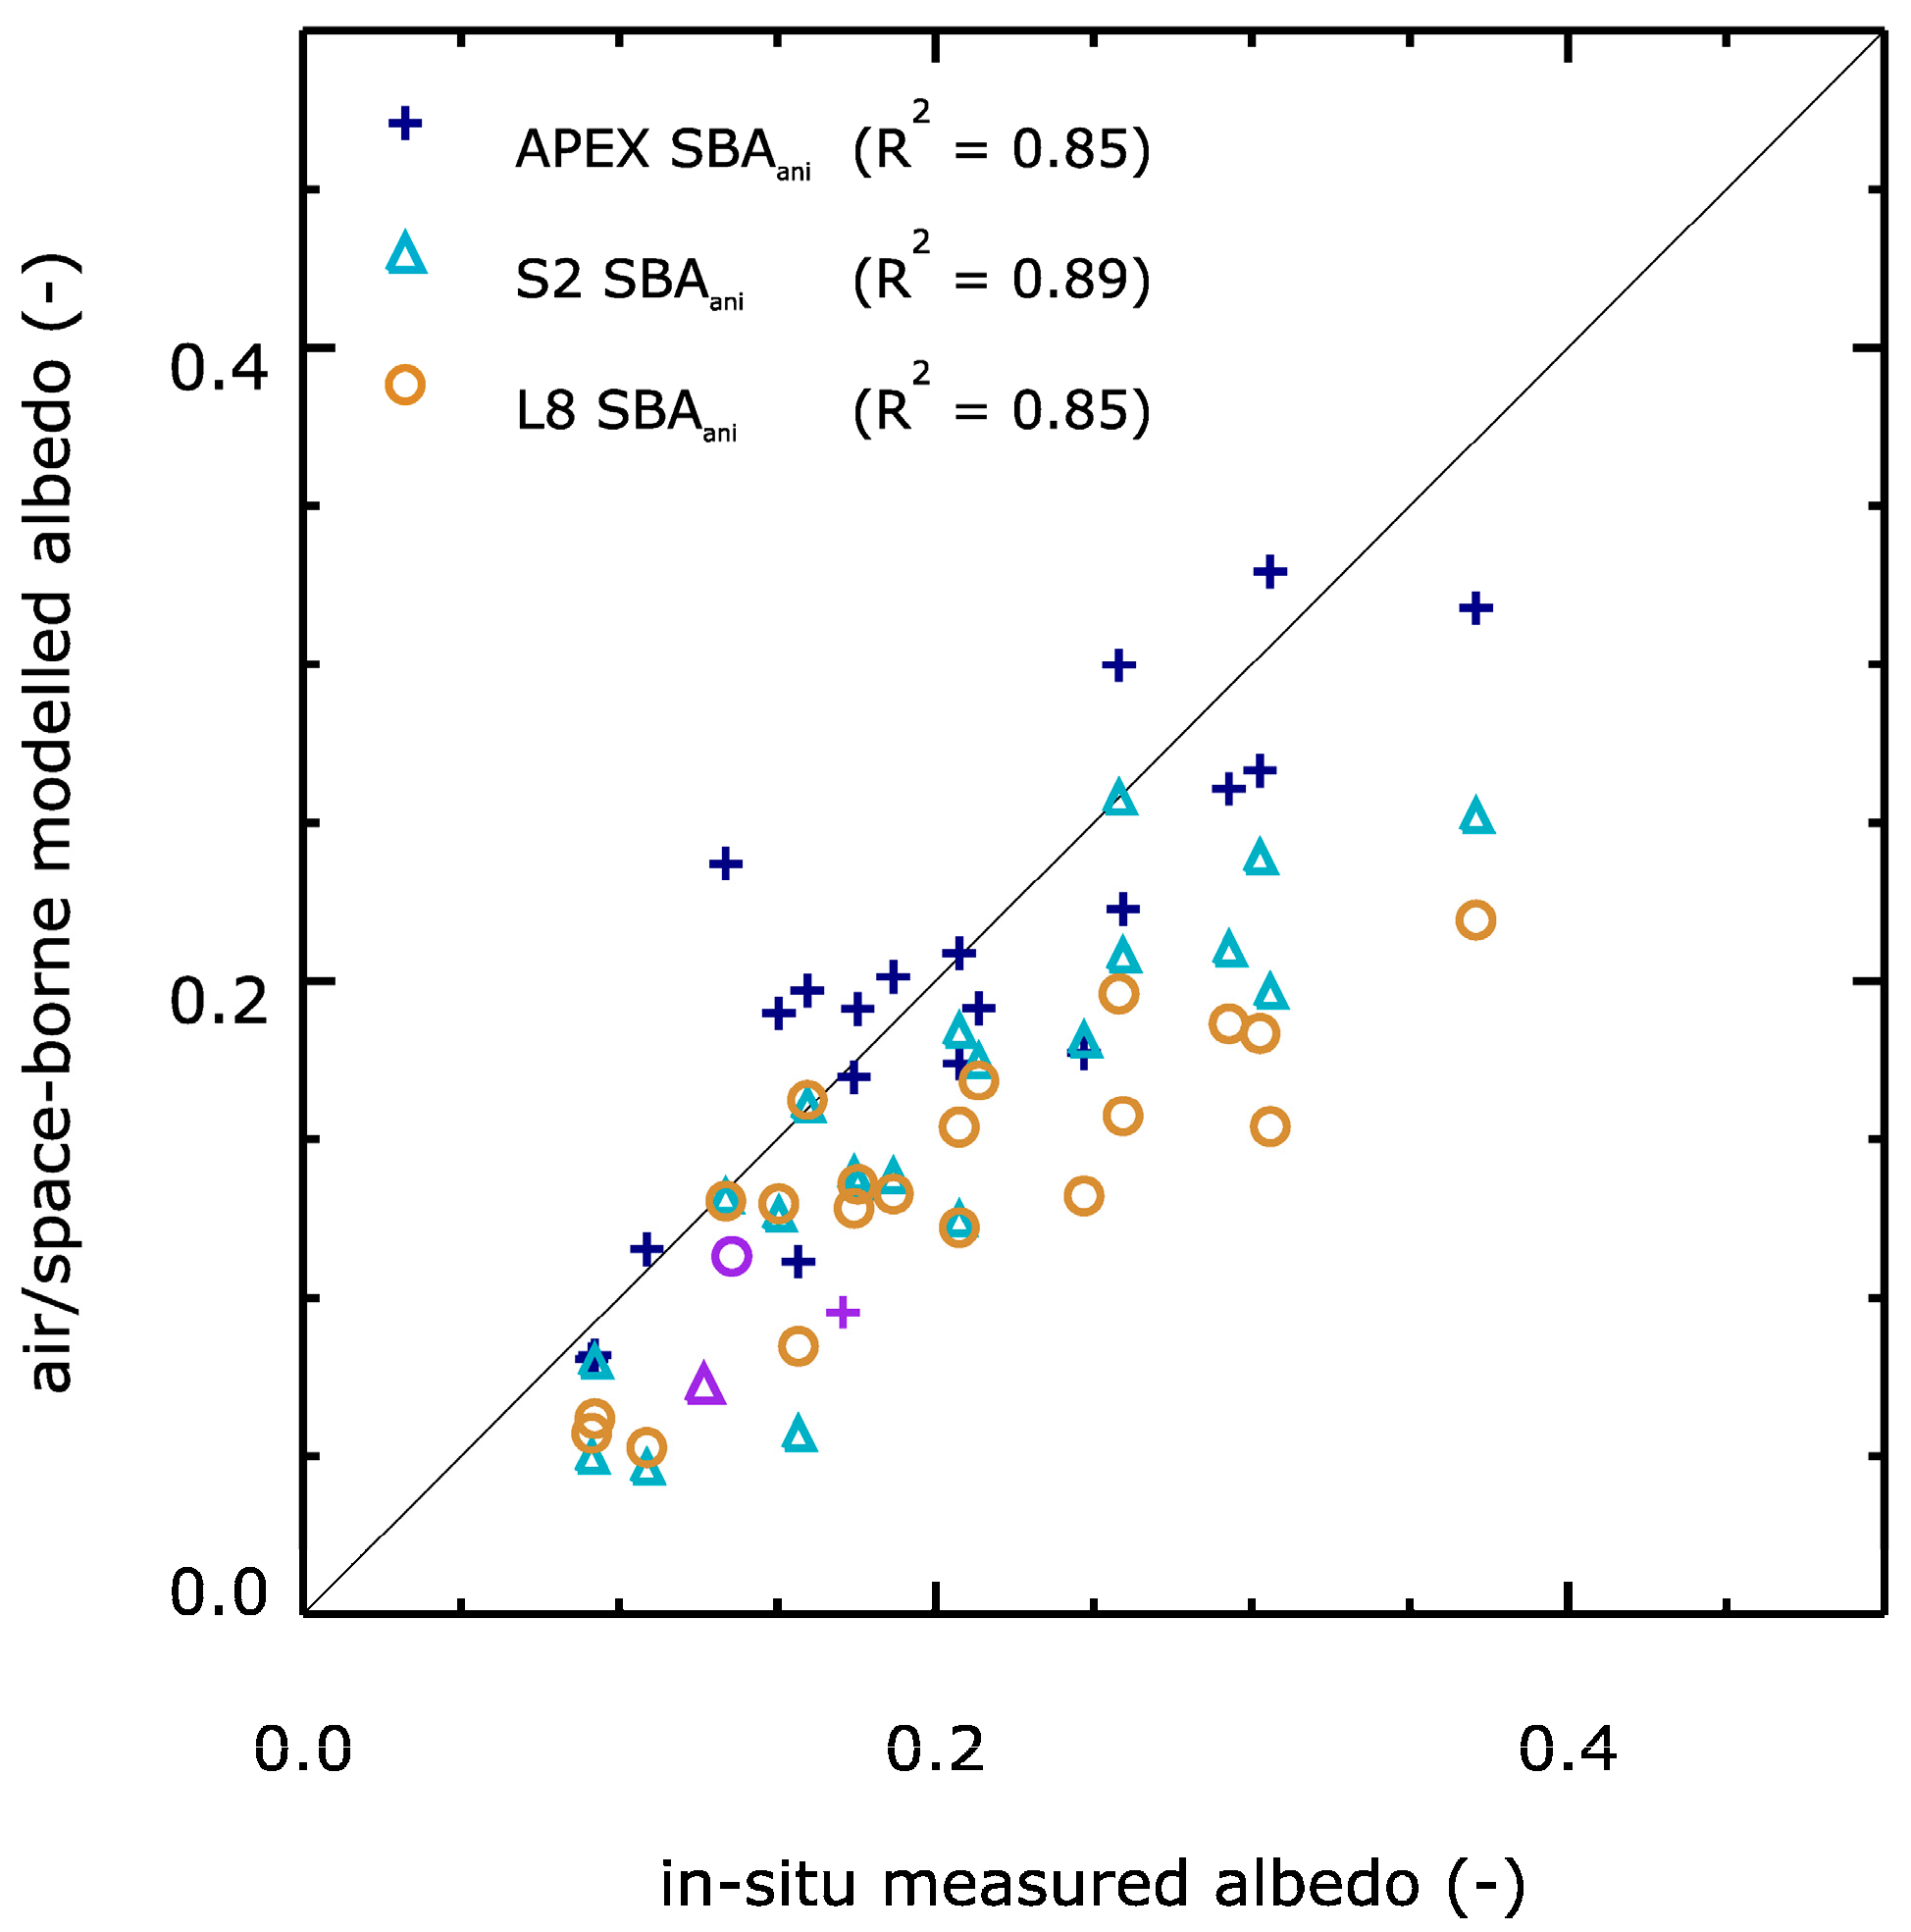
The application of the reflectance anisotropy yields different results for the different datasets used. The correction generally resulted in an increase in mean glacier-wide albedo of about 0.02 (Table 4).
Based on results from [31], a material-dependent impact of anisotropy effects is expected. We analysed respective anisotropy effects on glacier albedo by classifying glacier surface materials. The predominant materials for FG and PM are known to be snow and debris as well as three different types of ice—bright ice, ice and dirty ice—that differ mainly in their crystal structure and contamination of mineral and/or organic material [31]. The average impact of anisotropy effects, calculated as difference between albedo values obtained with and without a correction, ranges between 0% for debris and 11% for ice. Whereas snow and bright ice show differences of 2.6% to 3.9%, dirty ice and ice are more strongly affected with differences of between 8.5% and 10.8%, respectively. Hence, darker surfaces are affected more importantly by the anisotropy correction compared to brighter surfaces.

4.5. Validation

We used in situ point albedo measurements acquired on PM to validate the different albedo products that are based on remote imagery. Further, we used the exact hour of the airborne and satellite overflights to compare the retrieved albedo values by APEX, S2 and L8 with corresponding in situ albedo measurements at the on-glacier AWS (Figure 8). Considering that the 20 in situ collected albedo values are one year apart from the airborne and satellite datasets and that the spatial sampling distance of used sensors largely differs, results indicate that albedo obtained from the SBAani algorithm correlate well with reference data. In particular, spatial patterns are well represented, i.e., the absolute value of an airborne/satellite-derived albedo product might differ from the in situ data; however, the bias is relatively stable. For the APEX SBAani product, we find a bias of between 0.00 and 0.10 (average 0.03), for the S2 SBAani between 0.00 and 0.12 (average 0.05) and for the L8 SBAani between 0.00 and 0.15 (average 0.07). Hence, the deviation of the APEX and S2 SBAani are within, and the one for L8 SBAani product is close to, the suggested absolute accuracy requirements for global climate modelling of ±0.05 according to Henderson-Sellers and Wilson [48].

5. Discussion

5.1. Satellite-Based Glacier Surface Albedo Monitoring

Glacier surface albedo varies considerably at different temporal scales. During the course of one to several days, it can change drastically due to local weather conditions (see Figure 2 and Section 4.2); it shows a large seasonal cycling [2], and can exhibit extreme values due to particular climate conditions [20]. Moreover, glacier surface albedo often displays a severe spatial heterogeneity, particularly in the bare-ice areas of glaciers during summer months when warmer temperatures strongly influence the melt behaviour of glaciers [31]. Monitoring glacier albedo can be achieved with in situ-based AWS that provide high temporal resolution but are very limited in the spatial representation of glacier albedo. New multispectral satellite missions such as Sentinel-2 or Landsat 8, offering both moderate temporal resolution and large spatial coverage, can be considered as complementary observatories and are important for comprehensive glacier albedo monitoring programs.

Impact of Spectral and Spatial Resolution

Diverging spectral and spatial resolution affects estimates of glacier albedo. Decreasing spectral resolution hinders resolving certain absorption features due to water or other surface materials. The calculation of shortwave broadband albedo typically assumes linearity of surface reflectance between sampling points, thus overestimating albedo (deviation of 5% on average when reducing the sampling density from 284 to 7 bands). Spatial resolution does not impact retrieved mean albedo but decreases the standard deviation since spatial variability is less representatively sampled (reduced STD of up to 16% when reducing spatial sampling size from 2 to 30 m). Differences of retrieved albedo between S2 and L8 are low. For the spectral resolution and sampling, we found a deviation of about 0.5% on average; the larger sampling size of L8 (30 m) compared to S2 (20 m) resulted in a negligible change in albedo (less than 0.1%) and a slightly reduced STD (less than 3%). The moderate temporal resolution of about 10 days for S2 and 16 days for L8, and an even shorter temporal sampling distance if both sensor data are combined, allows capturing the significant variability occurring in glacier surface albedo. Our analyses suggest suitability of combining data products retrieved from S2 and L8, since they show only minor deviations.
These findings are considered essential to establish error budgets underlying operational monitoring. It must be noted that our investigation was based on a reference data providing high spatial and spectral resolution (APEX) which was assumed to be optimal. Deviations might be slightly underestimated since APEX has a high but still limited spatial and spectral resolution.

5.2. Further Considerations for the Use of Optical Data for Glacier Surface Albedo Monitoring

5.2.1. Impact of Environmental Factors on Glacier Albedo

The availability of the three datasets, APEX, S2 and L8, acquired within one week in August 2015 offers the possibility to assess short-term variability of surface albedo due to changing environmental factors such as precipitation and solar radiation. As illustrated in Figure 2, the weather situation prior to the APEX overflight was not ideal depositing fresh snow at high elevation and, in the case of FG, even close to the glacier terminus. The inverse trend of mean glacier-wide shortwave broadband albedo seen in Table 2 compared to results obtained using the simulated datasets (Figure 5) can be explained by the recession of the snowline on FG and strong melting leaving a thin water film on the ice surface on PM. This environmental impact causes a variation in glacier-wide mean albedo of 18%–32%, demonstrating the large spatio-temporal variability of glacier albedo underpinning the need for frequent albedo monitoring to advance the mass balance modelling of glaciers.
Related to changing weather conditions is the impact of atmospheric correction. Changing atmospheric conditions during the acquisition of the different datasets influences the state of the glacier surfaces and respective reflectance characteristics. Further, differing atmospheric conditions likely cause uncertainties when atmospheric correction approaches are applied, since these have intrinsic limitations in estimating actual atmospheric conditions and compensate for them. Moreover, the fact that each dataset was corrected with another atmospheric correction approach may cause further deviations between APEX, S2 and L8, (see also [22]). Besides these varying approaches to derive surface reflectance, the individual sensor configurations (positioning and widths of bands) and calibration artefacts result in differences between the derived shortwave albedo products. We tried to minimize potential uncertainties by applying a vicarious calibration, considering the in situ spectroscopy measurements as reference. We suggest further assessments to consolidate our results and associate uncertainty estimates to the above-mentioned components (i.e., assumptions inherent to atmospheric correction approaches, impact of point spread function, signal-to-noise ratio, spectral shift, etc.).

5.2.2. Impact of Narrow-to-Broadband Conversion

The retrieval of shortwave broadband albedo from multispectral optical satellite data requires a narrow-to-broadband conversion. Evaluated formulae were originally developed for Landsat 5/7 data and are not optimized for the spectral settings of L8 and S2 data that differ in terms of centre wavelength position and full width half maximum. This will likely impact on the overall absolute accuracy of derived albedo products and their agreement. Particularly the much narrower band 5 of L8 compared to the corresponding band 4 of Landsat 5/7 and band 8 of S2 is of concern. While the Liang [30] formula considers five individual bands, the Knap et al. [29] formula relies on two bands only. Thus, the latter is more affected by band shifts and consequently expected to be more error prone if applied to L8 or S2 data. From Experiment 3 (Table 3) it becomes evident that the Liang [30] formula provides good estimates for glacier-wide mean albedo for both glaciers and all datasets, whereas the Knap et al. [29] formula is subject to stronger deviations. We suggest a re-calibration of these formulae to optimize their applicability to newest multispectral data and allow continuity of albedo time series.

5.2.3. Impact of Surface Anisotropy

Surface anisotropy accounts for an underestimation of albedo of up to 10%, depending on the surface type, if not compensated for, and surface reflectance is assumed to be Lambertian. Particularly dark ice surfaces partly covered with mineralogical dust and organic materials show a more pronounced anisotropy effect compared to bright snow and ice surfaces. Local melting of ice surface due to overlying dark materials causes enhanced melt activities and thus decreases the albedo, which in turn increases the degree of anisotropy. Moreover, these surfaces can sometimes be characterized by small cavities and thus, a pronounced surface structure that increases the angular dependency of apparent surface reflectance. According to our results, debris did not show any significant angular dependency of surface reflectance. These results are in line with other studies that investigated the impact of reflectance anisotropy for the retrieval of glacier surface albedo [34] and addressed the dependency of anisotropy on the ice contamination and coverage with morainic material and or melt water [35,47].
It must be noted that the applied anisotropy correction scheme has its own limitations. The anisotropy behaviour was estimated in situ using directional reflectance measurements with a field spectrometer but only five different angles in and perpendicular to the solar principle plane were considered. The hemispheric extent of the surface-specific anisotropy effect was obtained by data interpolation. Nevertheless, this approach is still considered representative to approximate the reflectance anisotropy of different surface types present on a glacier. Furthermore, derived anisotropy characteristics are representative of a horizontal surface illuminated under a certain angle. We assumed them as representative for tilted surfaces as well, likely causing uncertainties in the anisotropy correction. This can be explained by the fact that the effective illumination angle determines the anisotropy behaviour, thus it changes with surface orientation and illumination angle. However, it is impossible to account for such variation with field measurements, and the application of suitable models is the only strategy to minimize potential errors.

6. Conclusions

We demonstrate the capability of the new satellite missions Sentinel-2 and Landsat 8 to derive shortwave broadband albedo over glacier surfaces. Supported by in situ and airborne imaging spectroscopy data, we provide accuracy estimates of glacier albedo simulated for both satellite missions.
We highlight that a decreasing spectral resolution more strongly impacts shortwave albedo retrievals as compared to coarsening spatial resolution. However, a coarser spatial resolution is not capable of capturing the small-scale heterogeneity of bare-ice glacier surfaces that modulate melt processes locally. We suggest using remote sensing data with intermediate (20–30 m) to high (~2 m) ground-sampling distance to reproduce the spatial variability of glacier surface albedo for mountain glaciers in complex terrain.
We found substantial variation of shortwave broadband albedo over glacier surfaces based on weather and environmental factors and suggest establishing satellite-based monitoring capability to track these substantial spatio-temporal changes and eventually advance predictions of actual and future glacier melt under global climate change.
We evaluated the effect of narrow-to-broadband albedo conversions, needing to be applied to satellite data for albedo monitoring, and found the impact negligible compared to the added value that would be provided by a dedicated satellite-based albedo monitoring.
We found a surface material-specific impact of reflectance anisotropy on the retrieval of glacier albedo and suggest accounting for this effect.
Spatially distributed albedo products might substantially improve the investigation of the spatio-temporal variations in bare-ice albedo for mountain glaciers. Our results stress the importance of a better understanding of material composition and distribution, especially light-absorbing impurities, on bare-ice surfaces and their impact on glacier surface albedo. The future evolution of mountain glaciers in a warming climate is particularly regulated by the impact of albedo on summer melt. Therefore, a better representation of ice albedo in the energy balance functions of current mass balance models is urgently needed. The new generation of satellites, Sentinel-2 and Landsat 8, opens new possibilities to tackle this issue at the mountain-range scale and provide an important data basis to obtain spatially distributed shortwave broadband albedo products of glacier surfaces at high temporal resolution.

Acknowledgments

This study is funded within the SUK and ETH-board funded KIP-5 project Swiss Earth Observatory Network (SEON). We are grateful to the numerous people that contributed to the collection of in situ data, in particular Ph. Schuppli and F. Denzinger. We thank the APEX team for processing support. We further thank Remontées Mécaniques Crans Montana Aminona (CMA) for their logistic support and the Institute for Atmospheric and Climate Science, ETH (IACETH) for the loan of the CM7B albedometer during summer 2014. Meteorological data were obtained from MeteoSwiss and PERMOS, and camera images of Glacier de la Plaine Morte were provided by Geopraevent AG, Zürich. We thank the editor and four anonymous reviewers for helpful comments on the manuscript.

Author Contributions

Kathrin Naegeli, Matthias Huss, Martin Hoelzle, Michael Schaepman and Alexander Damm designed the study. Kathrin Naegeli performed most analyses and wrote the manuscript. Alexander Damm, Hendrik Wulf and Kathrin Naegeli developed the shortwave broadband albedo retrieval approach. Martin Hoelzle, Alexander Damm and Hendrik Wulf edited the manuscript. Martin Hoelzle and Michael Schaepman commented on the manuscript.

Conflicts of Interest

The authors declare no conflict of interest.

Appendix A

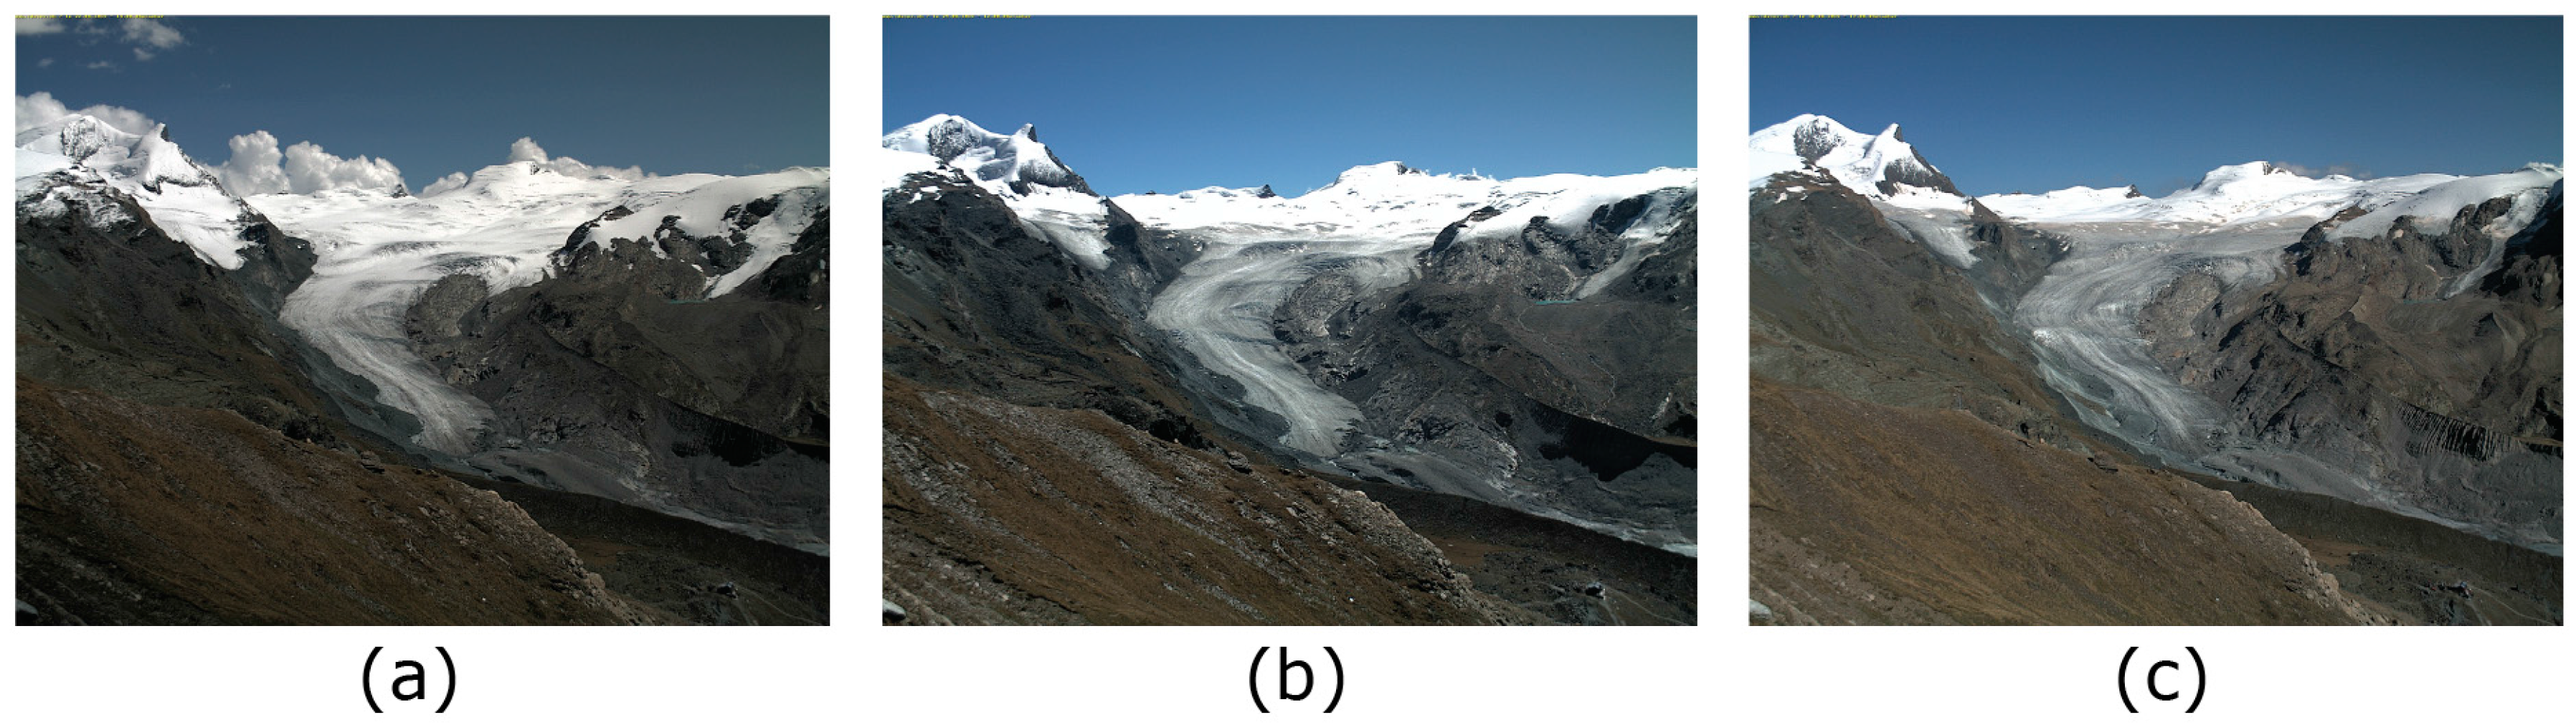
A1. Weather Situation between Acquisition Times of Datasets–Camera Images

Figure A1. In situ camera images of Findelengletscher on 22 (a), 29 (b) and 30 (c) August 2015. The recession of the snowline between 22 and 30 August is clearly visible. (Image courtesy of ACAG, Unifr).
Remotesensing 09 00110 g009
Figure A2. In situ camera images of Glacier de la Plaine Morte on 22 (a), 29 (b) and 30 (c) August 2015. The very bright area in the far back is due to oversaturation of the image. (Image courtesy of Geopraevent AG, Zurich).
Remotesensing 09 00110 g010

A2. Pre-Processing of Different Datasets–Vicarious Calibration

To analyse the impact of the vicarious calibration on the original dataset, we investigated the difference before and after calibration per band over the entire individual dataset. The deviations vary strongly between different bands. Therefore, the median is the best representative measure for comparison between the datasets (Table A1). An overview of the calibration impact on the individual bands is given in (Figure A3, Figure A4 and Figure A5).
Table A1. Glacier-wide average statistic values of the impact of anisotropy correction (SBAani minus SBAiso) on albedo products from different datasets for Findelengletscher and Glacier de la Plaine Morte derived with the SBA algorithm.
SensorFindelengletscherGlacier de la Plaine Morte
APEX17%13%
Sentinel-215%6%
Landsat 83%9%
Figure A3. Average difference in percent before and after calibration of APEX scenes per individual band.
Remotesensing 09 00110 g011
Figure A4. Average difference in percent before and after calibration of Sentinel-2 scenes per individual band.
Remotesensing 09 00110 g012
Figure A5. Average difference in percent before and after calibration of Landsat 8 scenes per individual band.
Remotesensing 09 00110 g013

References

  1. Tedesco, M.; Doherty, S.; Fettweis, X.; Alexander, P.; Jeyaratnam, J.; Stroeve, J. The darkening of the Greenland ice sheet: Trends, drivers, and projections (1981–2100). Cryosphere 2016, 10, 477–496. [Google Scholar] [CrossRef]
  2. Brun, F.; Dumont, M.; Wagnon, P.; Berthier, E.; Azam, M.F.; Shea, J.M.; Sirguey, P.; Rabatel, A.; Ramanathan, A. Seasonal changes in surface albedo of Himalayan glaciers from MODIS data and links with the annual mass balance. Cryosphere 2015, 9, 341–355. [Google Scholar] [CrossRef]
  3. Alexander, P.M.; Tedesco, M.; Fettweis, X.; van de Wal, R.S.W.; Smeets, C.J.P.P.; van den Broeke, M.R. Assessing spatio-temporal variability and trends in modelled and measured Greenland Ice Sheet albedo (2000–2013). Cryosphere 2014, 8, 2293–2312. [Google Scholar] [CrossRef]
  4. Box, J.E.; Fettweis, X.; Stroeve, J.C.; Tedesco, M.; Hall, D.K.; Steffen, K. Greenland ice sheet albedo feedback: Thermodynamics and atmospheric drivers. Cryosphere 2012, 6, 821–839. [Google Scholar] [CrossRef]
  5. Cuffey, K.M.; Paterson, W.S.B. The Physics of Glaciers, 4th ed.; Butterworth-Heinemann: Oxford, UK, 2010. [Google Scholar]
  6. Pope, A.; Rees, G.W. Impact of spatial, spectral, and radiometric properties of multispectral imagers on glacier surface classification. Remote Sens. Environ. 2014, 141, 1–13. [Google Scholar] [CrossRef]
  7. Nolin, A.W.; Payne, M.C. Classification of glacier zones in western Greenland using albedo and surfaceroughness from the Multi-angle Imaging SpectroRadiometer (MISR). Remote Sens. Environ. 2007, 107, 264–275. [Google Scholar] [CrossRef]
  8. Klein, A.G.; Isacks, B.L. Spectral mixture analysis of Landsat thematic mapper images applied to the detection of the transient snowline on tropical Andean glaciers. Glob. Planet. Chang. 1999, 22, 139–154. [Google Scholar] [CrossRef]
  9. Hock, R. Glacier melt: A review of processes and their modelling. Prog. Phys. Geogr. 2005, 29, 362–391. [Google Scholar] [CrossRef]
  10. Oerlemans, J.; Giesen, R.H.; Van Den Broeke, M.R. Retreating alpine glaciers: Increased melt rates due to accumulation of dust (Vadret da Morteratsch, Switzerland). J. Glaciol. 2009, 55, 729–736. [Google Scholar] [CrossRef]
  11. Takeuchi, N. Structure, Formation, and Darkening Process of Albedo-reducing Material (Cryoconite) on a Himalayan Glacier: A Granular Algal Mat Growing on the Glacier. Arctic Antarct. Alp. Res. 2001, 33, 115–122. [Google Scholar] [CrossRef]
  12. Lutz, S.; Anesio, A.M.; Villar, S.E.J.; Benning, L.G. Variations of algal communities cause darkening of a Greenland glacier. Fed. Eur. Microbiol. Soc. 2014, 89, 402–414. [Google Scholar] [CrossRef] [PubMed]
  13. Cook, J.; Edwards, A.; Takeuchi, N.; Irvine-Fynn, T. Cryoconite: The dark biological secret of the cryosphere. Prog. Phys. Geogr. 2016, 40, 66–111. [Google Scholar] [CrossRef]
  14. Wang, J.; Ye, B.; Cui, Y.; He, X.; Yang, G. Spatial and temporal variations of albedo on nine glaciers in western China from 2000 to 2011. Hydrol. Process. 2014, 28, 3454–3465. [Google Scholar] [CrossRef]
  15. Jonsell, U.; Hock, R.; Holmgren, B. Spatial and temporal variations in albedo on Storglaciären, Sweden. J. Glaciol. 2003, 49, 59–68. [Google Scholar] [CrossRef]
  16. Dumont, M.; Sirguey, P.; Arnaud, Y.; Six, D. Monitoring spatial and temporal variations of surface albedo on Saint Sorlin Glacier (French Alps) using terrestrial photography. Cryosphere 2011, 5, 759–771. [Google Scholar] [CrossRef] [Green Version]
  17. Paul, F.; Kotlarski, S. Forcing a distributed mass balance model with the regional climate model REMO, Part II: Downscaling strategy and results for two Swiss glaciers. J. Clim. 2010, 23, 1607–1620. [Google Scholar] [CrossRef]
  18. Paul, F.; Machguth, H.; Hoelzle, M.; Salzmann, N.; Haeberli, W. Alpine-wide distributed glacier mass balance modelling: A tool for assessing future glacier change? In Darkening Peaks: Glacier Retreat, Science, and Society; Orlove, B., Wiegandt, E., Luckman, B., Eds.; University of California Press: Berkeley, CA, USA, 2008; pp. 111–125. [Google Scholar]
  19. Machguth, H.; Paul, F.; Hoelzle, M.; Haeberli, W. Distributed glacier mass balance modelling as an important component of modern multi-level glacier monitoring. Ann. Glaciol. 2006, 43, 335–343. [Google Scholar] [CrossRef]
  20. Paul, F.; Machguth, H.; Kääb, A. On the impact of glacier albedo under conditions of extreme glacier melt: The summer of 2003 in the Alps. EARSeL eProc. 2005, 4, 139–149. [Google Scholar]
  21. Fugazza, D.; Senese, A.; Azzoni, R.S.; Maugeri, M.; Diolaiuti, G.A. Distribution of surface albedo at the Forni Glacier (Stelvio National Park, Central Italian Alps). Cold Reg. Sci. Technol. 2016, 125, 128–137. [Google Scholar] [CrossRef]
  22. Pope, E.L.; Willis, I.C.; Pope, A.; Miles, E.S.; Arnold, N.S.; Rees, W.G. Contrasting snow and ice albedos derived from MODIS, Landsat ETM+ and airborne data from Langjökull, Iceland. Remote Sens. Environ. 2016, 175, 183–195. [Google Scholar] [CrossRef]
  23. Knap, W.H.; Brock, B.W.; Oerlemans, J.; Willis, I.C. Comparison of Landsat TM- derived and ground-based albedos of Haut Glacier d’Arolla, Switzerland. Int. J. Remote Sens. 1999, 20, 3293–3310. [Google Scholar] [CrossRef]
  24. Dumont, M.; Gardelle, J.; Sirguey, P.; Guillot, A.; Six, D.; Rabatel, A.; Arnaud, Y. Linking glacier annual mass balance and glacier albedo retrieved from MODIS data. Cryosphere 2012, 6, 1527–1539. [Google Scholar] [CrossRef] [Green Version]
  25. Dumont, M.; Brun, E.; Picard, G.; Michou, M.; Libois, Q.; Petit, J.-R.; Geyer, M.; Morin, S.; Josse, B. Contribution of light-absorbing impurities in snow to Greenland’s darkening since 2009. Nat. Geosci. 2014, 7, 509–512. [Google Scholar] [CrossRef]
  26. Cogley, G.J.; Hock, R.; Rasmussen, L.A.; Arendt, A.A.; Bauder, A.; Braithwaite, R.J.; Jansson, P.; Kaser, G.; Möller, M.; Nicholson, L.; et al. Glossary of Glacier Mass Balance and Related Terms; International Hydrological Programme (IHP) VII Technical Documents in Hydrology No. 86; UNESCO-IHP: Paris, France, 2011. [Google Scholar]
  27. Lucht, W.; Hyman, A.H.; Strahler, A.H.; Barnsley, M.J.; Hobson, P.; Muller, J. A Comparison of Satellite-Derived Spectral Albedos to Ground-Based Broadband Albedo Measurements Modeled to Satellite Spatial Scale for a Semidesert Landscape. Remote Sens. Environ. 2000, 74, 85–98. [Google Scholar] [CrossRef]
  28. Qu, Y.; Liang, S.; Liu, Q.; He, T.; Liu, S.; Li, X. Mapping surface broadband albedo from satellite observations: A review of literatures on algorithms and products. Remote Sens. 2015, 7, 990–1020. [Google Scholar] [CrossRef]
  29. Knap, W.H.; Reijmer, C.H.; Oerlemans, J. Narrowband to broadband conversion of Landsat TM glacier albedos. Int. J. Remote Sens. 1999, 20, 2091–2110. [Google Scholar] [CrossRef]
  30. Liang, S. Narrowband to broadband converions of land surface albedo: I Algorithms. Remote Sens. Environ. 2000, 76, 213–238. [Google Scholar] [CrossRef]
  31. Naegeli, K.; Huss, M.; Damm, A.; Schaepman, M.; Hoelzle, M. Imaging spectroscopy to assess the composition of ice surface materials and their impact on glacier mass balance. Remote Sens. Environ. 2015, 168, 388–402. [Google Scholar] [CrossRef]
  32. Joerg, P.C.; Weyermann, J.; Morsdorf, F.; Zemp, M.; Schaepman, M.E. Computation of a distributed glacier surface albedo proxy using airborne laser scanning intensity data and in-situ spectro-radiometric measurements. Remote Sens. Environ. 2015, 160, 31–42. [Google Scholar] [CrossRef]
  33. Schaepman-Strub, G.; Schaepman, M.E.; Painter, T.H.; Dangel, S.; Martonchik, J.V. Reflectance quantities in optical remote sensing—Definitions and case studies. Remote Sens. Environ. 2006, 103, 27–42. [Google Scholar] [CrossRef]
  34. Klok, E.J.L.; Greuell, W.; Oerlemans, J. Temporal and spatial variation of the surface albedo of Morteratschgletscher, Switzerland, as derived from 12 Landsat images. J. Glaciol. 2003, 49, 491–502. [Google Scholar] [CrossRef]
  35. Greuell, W.; de Ruyter de Wildt, M.S. Anisotropic reflection by melting glacier ice: Measurements and parametrizations in Landsat TM Bands 2 and 4. Remote Sens. Environ. 1999, 70, 265–277. [Google Scholar] [CrossRef]
  36. Winther, J. Spectral bi-directional reflectance of snow and glacier ice measured in Dronning Maud Land, Antarctica. Ann. Glaciol. 1994, 20, 1–5. [Google Scholar] [CrossRef]
  37. Yearbooks of the Cryospheric Commission of the Swiss Academy of Sciences (SCNAT); Glaciological Reports, The Swiss Glaciers, 2011/2012–2012/2013; VAW-ETH: Zürich, Switzerland, 2016; pp. 133–134. [CrossRef]
  38. Sold, L.; Huss, M.; Machguth, H.; Joerg, P.C.; Vieli, G.L.; Linsbauer, A.; Salzmann, N.; Zemp, M.; Hoelzle, M. Mass Balance Re-analysis of Findelengletscher, Switzerland; Benefits of Extensive Snow Accumulation Measurements. Front. Earth Sci. 2016, 4. [Google Scholar] [CrossRef]
  39. Huss, M.; Voinesco, A.; Hoelzle, M. Implications of climate change on Glacier de la Plaine Morte, Switzerland. Geogr. Helv. 2013, 68, 227–237. [Google Scholar] [CrossRef]
  40. Schaepman, M.E.; Jehle, M.; Hueni, A.; D’Odorico, P.; Damm, A.; Weyermann, J.; Schneider, F.D.; Laurent, V.; Popp, C.; Seidel, F.C.; et al. Advanced radiometry measurements and Earth science applications with the Airborne Prism Experiment (APEX). Remote Sens. Environ. 2015, 158, 207–219. [Google Scholar] [CrossRef]
  41. Jehle, M.; Hueni, A.; Damm, A.; D’Odorico, P.; Weyermann, J.; Kneubühler, M.; Schläpfer, D.; Schaepman, M.E. APEX—Current status, performance and validation concept. IEEE Sens. 2010, 2010, 533–537. [Google Scholar] [CrossRef]
  42. Hueni, A.; Lenhard, K.; Baumgartner, A.; Schaepman, M.E. Airborne Prism Experiment Calibration Information System. IEEE Trans. Geosci. Remote Sens. 2013, 51. [Google Scholar] [CrossRef] [Green Version]
  43. Schläpfer, D.; Richter, R. Geo-atmospheric processing of airborne imaging spectrometry data. Part 1: Parametric orthorectification. Int. J. Remote Sens. 2002, 23, 2609–2630. [Google Scholar] [CrossRef]
  44. Richter, R.; Schläpfer, D. Geo-atmospheric processing of airborne imaging spectrometry data. Part 2: Atmospheric/topographic correction. Int. J. Remote Sens. 2002, 23, 2631–2649. [Google Scholar] [CrossRef]
  45. Vermote, E.; Justice, C.; Claverie, M.; Franch, B. Preliminary analysis of the performance of the Landsat 8/OLI land surface reflectance product. Remote Sens. Environ. 2016, 185, 46–56. [Google Scholar] [CrossRef]
  46. Swisstopo swissALTI3d Ausgabebericht 2015; Eidgenössisches Departement für Verteidigung, Bevölkerungsschutz und Sport, VBS, Wabern. 2015.
  47. Pellikka, P.; Rees, W.G. Remote Sensing of Glaciers; Taylor & Francis Group: London, UK, 2010. [Google Scholar]
  48. Henderson-Sellers, A.; Wilson, M.F. Surface Albedo Data for Climatic Modeling. Rev. Geophys. Sp. Phys. 1983, 21, 1743–1778. [Google Scholar] [CrossRef]
Figure 1. Overview of the two study sites (a) Findelengletscher and (b) Glacier de la Plaine Morte and (c) their location within Switzerland. Elevation bands with 100 m spacing (coloured), profiles (solid line and crosses) and location of weather stations (star) are shown for both glaciers.
Remotesensing 09 00110 g001
Figure 2. Albedo, temperature and precipitation for (a) Findelengletscher and (b) Glacier de la Plaine Morte. Airborne/satellite acquisitions: APEX (solid line), Sentinel-2 (dashed line) and Landsat 8 (dotted line). Surface height data for Glacier de la Plaine Morte is plotted with respect to 10 August, i.e., surface height is set to 0 cm for that date.
Remotesensing 09 00110 g002
Figure 3. Spectral band positions of Landsat 5/7, Landsat 8, Sentinel-2 and APEX. Three typical surface spectra of snow, bright ice, and dirty ice are plotted. APEX data was used to convolve to Sentinel-2 and Landsat data. The dashed lines represent linear interpolation between individual bands of the multispectral sensors.
Remotesensing 09 00110 g003
Figure 4. Albedo products derived using SBAani from APEX data as well as the simulations thereof (APEXconv S220 m and APEXconv L830 m) and differences between these data products are shown for Findelengletscher (a,b) and Glacier de la Plaine Morte (c,d).
Remotesensing 09 00110 g004
Figure 5. Glacier-wide mean shortwave albedo (circle), standard deviation (cross), and range (gradient) as a function of spatial (x-axis) and spectral (y-axis) resolution for Findelengletscher (left) and Glacier de la Plaine Morte (right). The three parameters mean (top), standard deviation (middle) and range (bottom) are given in exact numbers per individual product. For Glacier de la Plaine Morte, circles and crosses are enlarged tenfold for better readability.
Remotesensing 09 00110 g005
Figure 6. Simulated albedo with 2 (APEXconv S2, APEXconv L8), and 20 and 30 m, respectively (APEXconv S220 m, APEXconv L830 m) spatial resolution plotted along (a) a centre-line profile of Findelengletscher and (b) a cross profile of Glacier de la Plaine Morte. The locations of the profiles are marked in turquoise on the insets.
Remotesensing 09 00110 g006
Figure 7. Albedo product derived using the SBAani algorithm and three different datasets: APEX (left), Sentinel-2 (centre) and Landsat 8 (right) and difference maps of the albedo products: APEX minus Sentinel-2 (centre) and APEX minus Landsat 8 (right) for Findelengletscher (a,b) and Glacier de la Plaine Morte (c,d). The insets in (a) and (c) show the albedo frequency distribution per glacier and product.
Remotesensing 09 00110 g007
Figure 8. Comparison of observed point albedo values for Glacier de la Plaine Morte to albedo derived from airborne and satellite data using the SBAani approach. The blue, turquoise and light brown symbols are albedometer (CM7B) measurements, whereas the purple symbols refer to the net radiometer (CNR4) measurements at the AWS.
Remotesensing 09 00110 g008
Table 1. Imaging and non-imaging radiation measurements. Number of bands refers to available surface reflectance spectral bands.
SensorAcquisition DateNumber of BandsSpectral RangeGround-Sampling Distance
APEX22 August 20152840.38–2.50 μm2 m
Sentinel-229 August 2015110.45–2.28 μm20 m (on average)
Landsat 830 August 201570.43–2.29 μm30 m
ASD field spectrometer11 September 201421510.35–2.50 μm0.6 m
31 August 2013
CM7B albedometerVarious days summer 2014-0.31–2.8 μm-
CNR4 net radiometerContinuous (July 3–15 October 2015)-0.30–2.8 µm (short wave)-
4.50–42 µm (long wave)
Table 2. Glacier-wide albedo statistics of albedo products from different datasets for Findelengletscher (top) and Glacier de la Plaine Morte (bottom) derived with the SBAani algorithm. Overall variation (difference between APEX and S2/L8) and related sensor and environmental impact are given.
StatisticsFindelengletscher
APEXS2L8Average Overall VariationSensor Impact (Deduced from Experiment 1)Environmental Impact
min0.000.080.080.080.070.01
max0.880.780.79−0.15−0.03−0.12
mean0.580.430.41−0.160.04−0.20
std0.120.180.170.060.010.05
StatisticsGlacier de la Plaine Morte
APEXS2L8Average Overall VariationSensor ImpactEnvironmental Impact
min0.000.030.040.040.040.00
max0.610.440.31−0.24−0.05−0.19
mean0.220.180.15−0.060.01−0.07
std0.080.050.03−0.05−0.01−0.04
Table 3. Glacier-wide values of albedo products derived from different datasets using the narrow-to-broadband conversion formulae by Knap et al. [29] and Liang [30] for Findelengletscher (top) and Glacier de la Plaine Morte (bottom).
StatisticsFindelengletscher
APEXKnapAPEXLiangS2KnapS2LiangL8KnapL8Liang
min−0.02−0.050.060.080.060.08
max1.310.860.750.780.801.22
mean0.690.580.400.430.370.41
std0.170.110.170.180.170.18
% > 10.2%0%0%0%0%0.01%
StatisticsGlacier de la Plaine Morte
APEXKnapAPEXLiangS2KnapS2LiangL8KnapL8Liang
min−0.04−0.060.030.040.030.04
max0.710.600.410.450.271.09
mean0.190.230.160.170.140.17
std0.070.090.050.050.030.09
% > 10.002%0%0%0%0%0.03%
Table 4. Glacier-wide average statistic values of the impact of anisotropy correction (SBAani minus SBAiso) on albedo products from different datasets for Findelengletscher (left) and Glacier de la Plaine Morte (right) derived with the SBA algorithm.
StatisticsFindelengletscherGlacier de la Plaine Morte
APEXS2L8APEXS2L8
SBAani-isoSBAani-isoSBAani-isoSBAani-isoSBAani-isoSBAani-iso
min0.000.000.010.000.000.00
max0.040.040.020.020.020.03
mean0.020.020.020.020.010.01
std0.000.010.010.010.000.00

