Article

Comparison of Gas Emission Crater Geomorphodynamics on Yamal and Gydan Peninsulas (Russia), Based on Repeat Very-High-Resolution Stereopairs

1
Lomonosov Moscow State University, Faculty of Geography, Cryolithology and Glaciology Department, GSP-1, Leninskie Gory, 119991 Moscow, Russia
2
ScanEx Research and Development Center, Kiev highway p. 1. Business Park «Rumyantsevo», office 732, 108811 Moscow, Russia
3
Earth Cryosphere Institute Tyumen Scientific Centre SB RAS, 625000, PO Box 1230 Tyumen, Russia
4
University of Tyumen, International Institute of Cryology and Cryosophy, 6 Volodarskogo St., 625003 Tyumen, Russia
*
Authors to whom correspondence should be addressed.
Remote Sens. 2017, 9(10), 1023; https://doi.org/10.3390/rs9101023
Submission received: 19 August 2017 / Revised: 29 September 2017 / Accepted: 1 October 2017 / Published: 4 October 2017
(This article belongs to the Special Issue Remote Sensing of Arctic Tundra)

Abstract

:
Gas Emission Craters (GEC) represent a new phenomenon in permafrost regions discovered in the north of West Siberia. In this study we use very-high-resolution Worldview satellite stereopairs and Resurs-P images to reveal and measure the geomorphic features that preceded and followed GEC formation on the Yamal and Gydan peninsulas. Analysis of DEMs allowed us to: (1) distinguish different terrain positions of the GEC, at the foot of a gentle slope (Yamal), and on an upper edge of a terrace slope; (2) notice that the formation of both Yamal and Gydan GECs were preceded by mound development; (3) measure a funnel-shaped upper part and a cylindrical lower part for each crater; (4) and measure the expansion and plan form modification of GECs. Although the general characteristics of both craters are similar, there are differences when comparing both key sites in detail. The height of the mound and diameter of the resulting GEC in Yamal exceeds that in Gydan; GEC-1 was surrounded by a well-developed parapet, while AntGEC did not show any considerable accumulative body. Thus, using very-high-resolution remote sensing data allowed us to discriminate geomorphic features and relief positions characteristic for GEC formation. GECs are a potential threat to commercial facilities in permafrost and indigenous settlements, especially because at present there is no statistically significant number of study objects to identify the local environmental conditions in which the formation of new GEC is possible.

Graphical Abstract

1. Introduction

GECs represent a new phenomenon in permafrost regions discovered in the north of West Siberia. Various remote sensing methods and techniques are widely used to study permafrost-related problems and hazards [1]. In addition, remote sensing recently assisted with the discovery of several craters on Yamal Peninsula, one on Gydan Peninsula, and another on Yenisei Bay coast.
The north of West Siberia is known for continuous permafrost distribution and widespread tabular ground ice, which is found in numerous natural exposures and boreholes close to the ground surface. These ice layers are exposed in the walls of all known craters as well. Outside the West Siberian permafrost zone, craters presumably of similar origin are under study only at the sea floor. These are rather well understood pockmarks, formed as a result of methane ejection [2,3,4,5,6].
The first known crater (GEC-1) was discovered in the central part of the Yamal Peninsula (Figure 1) in the summer of 2014, 4 km west of the Bovanenkovo–Ukhta gas pipeline, part of the Yamal–Europe gas transportation system.
The GEC-1 morphometry and composition were first studied in July 2014. Based on the examination results, the term “gas emission crater” was suggested [7].
Further examination of the Yamal crater conducted in August and September 2014 involved further descriptions of the crater walls as well as geological, geophysical, and geochemical studies (with soil and lake water sampling) [8,9].
In 2014–2016, field work focused on the complex study of this object, continuing with the participation of specialists from the Earth Cryosphere Institute SB RAS, Lomonosov Moscow State University, and other organizations [7,8,9,10,11,12,13,14,15]. A number of publications describing the crater have been published, and a number of versions of the crater origin and the preliminary distribution of this process have been put forward, including those attributing the formation of this feature to gas emissions or pingo collapse [10,14,16,17,18,19,20,21].
In 2014–2015, the authors analyzed satellite images of the crater to determine the date of the crater formation as well as to provide the geomorphologic characteristics of the area prior to crater formation, immediately after it, and the state of its further development [22]. The crater and the preceding bulk characteristics were obtained as a result of processing stereopairs of satellite images of very high spatial resolution. It was shown that a mound preceded GEC. This mound was considered different from pingo. Several indicators proved this assumption [21]: unlike pingo, this mound was found on a slope, not in a drained lake basin, thus it did not form due to the freezing of injected water (which is how a pingo is defined, [23]); there were no traces of lake talik and injection of water in the exposed walls of the crater when it was first found. Later it was proven by dendrochronology that the mound was formed in a matter of decades, while pingo grows in a matter of centuries.
Almost immediately after the GEC-1 discovery, a similar crater was reported on the nearby Gydan Peninsula and preliminary remote sensing analysis was done [24,25].
The media reported on the Gydan crater in summer 2014 [26], but the site was not visited by experts until 2016. To reconstruct the relief that preceded formation of this crater and to estimate the relief changes that occurred, we, by analogy with the research done on GEC-1 [22], processed stereopairs of satellite images of very high spatial resolution [27].
The objective of this study is to compare the geomorphic features that preceded the GEC formation in Yamal (GEC-1) and Gydan (AntGEC), to determine the geomorphic effect after their formation, and to trace the further development of the resulting landforms. This objective is achieved through photogrammetric differentiation of relief characteristics and their changes over time associated with the GEC formation on Yamal and Gydan Peninsulas. Analyzed are common features (cylinder and funnel-shaped hole, thick layer of tabular ground ice in the geological section), and differences related to lithology (clay and loam characteristic of Yamal, and sand of Gydan), and environments (gentle shrubby slopes in Yamal and wind-blown sandy hilltop in Gydan). Processing of the repeated imagery is aimed at receiving the trends of different GECs’ development, expanding of the landform, and its filling in with sediment and water.
The overall result expected from the study of GEC formation is to understand the potential for these features to have formed in the past and be a precursor to permafrost lakes along with the more common thermokarst process.

2. Study Area

The north of West Siberia comprises a number of alluvial-lacustrine-marine plains and terraces dissected by rivers, lakes, drained lake basins (khasyreys), and thermoerosion ravines and gullies. The geology of this region is debatable, so we use geomorphic levels instead of geological units to describe the terrain of the study region. The geomorphic system presented in [28] suggests distinguishing three high terrace levels: the Salekhardskaya (V-th) marine plain (the geological section is built of clay with clastic inclusions of marine and glacio-marine origin), the highest in the region; Kazantsevskaya (IV-th), a coastal plain built of interbedding of loam and sandy deposits with an essential amount of organic matter dispersed in the section; and Zyryanskaya-Karginskaya (III-d), an alluvial-marine or alluvial-lacustrine plain that contains fine interbedding of sandy, silty, loamy, and organic layers of several mm to several cm thick. Flat hilltops of the plains are often occupied by polygonal sandy landscapes with windblown sand hollows on the tops of high-centered polygons. Lowered surfaces are peat plateaus or hummocky tundra. Lower terraces are of fluvial origin. Elevations differ from site to site due to active neotectonics.

2.1. Yamal Peninsula (GEC-1 Key Site)

The key site is located in the central part of the Yamal peninsula, south of Bovanenkovo gas field (Figure 1). In the crater area, there are fragments of the IV coastal-marine plain 40–60 m high, composed of the upper quaternary deposits of the Kazantsevskaya suite [29]. The crater itself is situated on the boundary between a khasyrey (a drained lake depression) and a slope of a terrace-like surface, modified by erosion channels and thermokarst ponds.
This key site is within the zone of continuous permafrost, where taliks are likely to be present under the largest lakes. The active layer thickness varies from 0.5 to 0.6 m on sites with moss and grass cover and up to 1.8 m on bare or shrubby sites. At the Bovanenkovo gas field, the permafrost thickness ranges from 100 to 280 m; permafrost temperature varies from −2.1 to −7.1 °C [30,31]. Widespread tabular ground ice bodies are one of the main features of the Central Yamal permafrost. These ice layers may be more than 20 m thick and extend for hundreds of meters [32,33,34,35,36]. Tabular ground ice is found under practically all geomorphic levels.

2.2. Gydan Peninsula (AntGEC Key Site)

AntGEC is located in the western part of the Gydan Peninsula in the upper reaches of the Yuribey River, 106 km northwest of Antipayuta settlement (see Figure 1). AntGEC formed in the tundra zone at approximately the same latitude as the first known Yamal crater (GEC-1). Here, the watershed areas are represented by the remains of the III-d alluvial-marine plain 30–50 m above sea level, built up by the Ermakovsky horizon deposits [37]. The remains are surrounded by lower alluvial terraces and the floodplain of the Yuribey River and its tributaries. The AntGEC is located on the III-d plain edge, bordering the small flat-bottomed gully (Figure 2a).
The remains of the third terrace, widely distributed within the study area, are significantly dissected by erosion and thermokarst processes including erosion ravines and gullies. AntGEC embedded in the terrace, which is characterized by pronounced polygonal microrelief with convex polygons and deep troughs, rather poorly vegetated. The edge part of the terrace near the crater is disturbed by barren wind-blown sands. From the northwest side AntGEC is bordered by the flat bottom of a gully with thick grass-moss cover and rare willow shrubs. Mostly sandy deposits are exposed in the AntGEC walls, while in the gully peat covers sandy sediments.
AntGEC is located in the North Gydan region within the continuous permafrost zone, with a mean temperature of about −8 °C and thickness greater than 200 m [38]. This region is characterized by widespread tabular ground ice close to the ground surface. Active layer depth measured in 2016 around AntGEC showed a clear relationship with the soil texture and vegetation cover. The highest values, exceeding 170 cm (the length of the probe), are found on the wind-blown sandy hollows on the hilltop; the values exceed 120 cm on the vegetated surfaces on the hilltop and drop to 55–65 cm in the mossy peaty gully bottom.

3. Materials and Methods

Due to the lack of both updated large-scale topographic maps and instrumental field measurements on key sites before the GEC formation, DEMs with a node density of 1 m and under need to be created in order to define the morphological characteristics of the relief before and after the GEC formation. Such models can be obtained from airborne laser scanning, or when using dense stereo correspondence algorithms based on stereopairs of digital frames or scanner satellite imagery. In our case, the most suitable input data source for the reconstruction of the terrain and for change detection is the stereo mode of very high spatial resolution satellite imagery.
The first step is to determine the time of the GEC formation, set as:
  • the time interval of the GEC-1 formation from 9 October to 1 November 2013 as a result of analyzing a series of satellite images of medium and high spatial resolution [16],
  • the date of the AntGEC formation on 27 September 2013 according to the observation of local residents and the similar space imagery data analysis [27].
In addition, we selected multi-temporal stereopairs of very high spatial resolution satellite images, closest to the pre-set time intervals of the GEC-1 and AntGEC for further analysis (Table 1).
In catalogs, the minimum time interval of the repeat stereopairs is as follows: for GEC-1, 12 months; for AntGEC, 13.5 months (Figure 3).
Photogrammetric processing of stereopairs of satellite images was carried out in the ScanEx IMAGE Processor software package in the following sequence: relative orientation of images based on the rational polynomial coefficient (RPC) of the third degree; automated measurement of tie-points; creation of a normalized stereopair (transforming images into an epipolar plane); automated drawing of digital terrain models; post-processing of the digital terrain models received, which included filling in blank spots and artifacts resulting from inaccurate calculation of the absolute parallax, applying automated stereo correspondence; transformation of resulting models into orthoprojection; automated plotting of orthophotomaps based on left and right stereopair images.
Using the stereopairs, we created digital terrain models with 1 m grid spacing in the universal transverse cylindrical Mercator map projection (UTM) and with the WGS84 ellipsoid heights. For ease of interpretation and compatibility with materials from the geological maps, the ellipsoidal heights were reduced to the EGM2008 quasi-geoid heights.
For key sites on the Yamal and Gydan Peninsulas, the concepts of DEM and digital terrain model (DTM) can be equated, as the tundra vegetation of key sites is represented mainly by low shrub and grass complexes, with height not exceeding 0.5 m. However, in places on Yamal willow shrubs may reach heights of 1.2 m in erosional gullies and lower slopes.
To evaluate the relative DEM height accuracy we used:
E r e l a t i v e = ( H B ) × G S D ,
where H is the satellite orbit height, B is the stereo base, and GSD is the ground sample distance.
To calculate the stereo imagery base, spacecraft attitude angles at the time of the imaging were used, as listed in the satellite data files (Table 1). Using the scan azimuth and elevation angle values as per [39], the ratio of the stereo imagery base to the stereo imagery height (B/H) was calculated.
For the GEC-1 key site 2013 stereopair B/H = 0.67, and 2014 stereopair B/H = 0.8. Multiplying inverse value of base to height ratios (H/B) with real image pixel size prior to resampling, we get a relative accuracy of 0.86 for the 2013 stereopair and of 0.69 m for the 2014 stereopair.
For the AntGEC key site 2013 stereopair B/H = 0.73 the resulting relative accuracy is 0.7 m; for the 2014 stereopair (B/H = 0.55) the relative accuracy is 1.1 m. However, it is correct for manual tie-points measurement, where co-registration accuracy does not exceed one pixel, on average. In our case, the corresponding points were measured automatically using two stereo correspondence algorithms, based on semi-global matching (SGM) [40], and global energy minimization problem by Simulated Annealing algorithm [41] with Metropolis–Hastings sampling [42]. This enables calculating correspondence with a sub-pixel accuracy (up to 1/4 pixel), which allows for reducing the calculated values of the relative errors at least twice.
Thus, the relative accuracies of the DEMs can be estimated as:
  • 0.45 m for GEC-1 key site DEM of 2013,
  • 0.35 m for GEC-1 key site DEM of 2014,
  • 0.35 m for AntGEC key site DEM of 2013,
  • 0.55 m for AntGEC key site DEM of 2014.
The relative precisions of the DEM products are close to each other and allow a comparison of multi-temporal DEMs for the key sites with respect to the estimated accuracy.
DEMs of the key sites are used to define the morphological characteristics of the terrain. Changes in relief are calculated as the difference of two DEMs: before and after the GEC formation. Changes in the surface height of up to 0.9 m were not taken into account because they are within the aggregate accuracy of the received multi-temporal DEMs.
To determine further relief dynamics of GECs, we used the following data:
-
Resurs-P2 satellite image (panchromatic band is 0.5 m GSD) of 31 August 2015 at AntGEC key site area. Image orthorectification was based on DEM of 2014 obtained before,
-
Field GPS data on GEC-1 crater edge position in 2015 and 2016.

4. Results

Data on morphometric characteristics of GEC-1 key site were obtained as a result of processing repeat very-high-resolution stereopairs. We presented DEM differencing results earlier in [22]. This study aims on the comparison of commonalities and differences between the Yamal (GEC-1) and Gydan (AntGEC) craters.
Our created DEMs of the AntGEC key site allowed us to determine the morphological characteristics of the relief and change associated with crater formation.
In the AntGEC area, the highest elevation level is represented by the remains of the III-d plain, which are considerably dissected by erosion-thermokarst processes (Figure 4a). AntGEC is located on the slope edge with a polygonal microrelief with deflation hollows.
To characterize the relief changes, we constructed hypsometric profiles that intersect the crater through its center (Figure 5 and Figure 6). The profile AOB is drawn along the watershed line (segment BO), and then descends into the bottom of the erosion gully (segment OA) (Figure 6). The COD profile characterizes the mound slopes on either side of its center. On the EOF profile, the center of the crater is localized at the terrace edge, which was destroyed by a gas eruption. The section EO characterizes the steepest part of the initial slope with a superimposed mound and the highest elevation difference.
From the analysis of profiles it follows that in August 2013 on the site of a future crater there was a low mound with a relative height of about 2 m and a base diameter of about 20 m. The small relative height of the mound is most clearly defined when analyzing the hypsometric profile of BOD parallel to the watershed line of the descending fragment of the terrace-like surface (see Figure 6).
To check whether the detected mound can be interpreted as just a typical polygonal microform of the terrace, a GH profile was created. The topography in the GH segment is characterized by minimal amplitude; there are no convexities with a relative height of 1–2 m as on the BOD profile.
On the satellite images of 2014 (see Figure 3b) and on the profiles created using the DEM (see Figure 6), the upper funnel-shaped portion of the crater with inclined walls and the cylindrical portion below with sheer walls are distinguished in the structure of the AntGEC. Since this crater is located in part on the terrace and in part on the slope, the crater edge line is inclined, with the elevation marks of its upper rim being 46–48 m, and of the lower one about 43 m (see Figure 6). In a horizontal plane, the diameter of the crater edge is 25–28 m as of 11 October 2014.
The lower rim of the crater edge is located 1.5–2 m above the bottom of the gully. Thus, the lower portion of the original slope, which separated the crater from the gully, is preserved. On satellite images of 11 October 2014, on the surface of this part of the slope, furrows are deciphered, which we associate with the erosion of ejected sandy material that covers the initial surface.
On the satellite images from 2014, the cylindrical portion of the crater is shaded, so we do not know at what depth the bottom is located, and whether there is water in there. As it turned out, it was not possible to extract a reliable topography of the cylindrical part by the stereopair. The deepest point, which can be identified by the correlator on the stereopair, is 10.5 m from the highest point of the rim. Since the cylindrical portion of the crater and the bottom of the crater in the images are a dark object with low reflectivity and contrast, we assume that at this depth (10–11 m below the edge) there was a bend from the funnel-shaped to the cylindrical portion. The diameter of the cylinder is estimated at 10–13 m. Based on the field photos of the crater taken in the summer of 2014 (Figure 7a), the depth and diameter of the cylindrical portion of the crater are in a ratio of 1:1.9, respectively, and the depth is estimated as 5–6 m. The total depth of the funnel-shaped and cylindrical portions together is approximately 15–19 m.
In the summer 2014 photographs (see Figure 2a and Figure 7b), it can be noticed that sandy material has been thrown out and surrounds the crater. Though the slope between the lower rim of the crater and the bottom of the gully was blocked by ejected sand, when calculating the difference between the 2013 and 2014 DEMs, areas of accumulation of material with a height of more than 0.9 m (the relative error of the subtraction results of DEMs) have not been identified.

5. Discussion

The two craters observed have a number of similar and distinct features. The DEMs reveal the differences in the geomorphic patterns of both new landforms (Figure 4).
The AntGEC is located on the terrace edge and upper part of a slope to a gully intersecting the remains of the III alluvial-marine plain. The slope is well drained; the surface is characterized by a sandy polygonal network with deflation hollows.
GEC-1 on Central Yamal is located on the foot of a gentle slope 19–22 m high descending from the remains of the IV coastal-marine Kazantsevskaya plain next to the lower, leveled bottom of a khasyrey (drained lake basin) adjoining the northward residual lake [22].
The DEMs confirm that the formation of both craters was preceded by a mound. However, there are significant differences in the size of these mounds, as it has been measured as close as possible to the time of their disappearance (Table 2). The AntGEC was preceded by a mound much smaller than the one preceding the formation of GEC-1 [22], with heights of 2 and 5–6 m, respectively, and the diameter of the base 20 and 45–58 m, respectively.
Earlier, based on the results of the GEC-1 study, we suggested that the presence of a significant mound protruding against the background of the aligned relief is an indicator and precursor of the craters, and can be used to predict new craters. A comprehensive high-resolution DEM-based analysis could potentially identify such mounds. However, the results obtained from the AntGEC show that it was formed in the place of the mound only slightly expressed in the relief. Such a local elevation difference of 1–2 m is common for horizontal and weakly inclined sites with high-center convex polygons due to ice-wedge degradation. Such elevation differences are often observed and, accordingly, prediction of new craters, based on the search for mound predecessors, can either lead to misallocations or to missing potential objects because of their low expression on a DEM. It is also possible to miss the predecessors, since the rate of their growth has not been reliably established. To identify rapidly growing mounds, it is necessary to update the DEMs on the actual satellite stereo imagery data.
In the structure of both craters, the lower cylindrical portion and the upper funnel-shaped portion are marked (Figure 8). An expansion (the so-called grotto) was observed in the cylindrical part of GEC-1 at a depth below 24 m from the edge. For AntGEC, this phenomenon is not fixed on the available field photos; the walls are represented as sub-vertical.
The two craters are compared with each other using dimensions measured in both field survey and remote sensing (see Figure 8). The upper edge diameter of the AntGEC and GEC-1 were the same one year after their formation: about 25–29 m. The cylinder diameter at the bend from the funnel in AntGEC the next year after formation was 10–13 m. That is 20–30% less than in GEC-1 in the mid-summer of 2014 (Table 2, Figure 8), but these differences may be due to the inaccuracy in the cylindrical portion boundary detection due to the darkening inside the crater.
Ejected material is found around both landforms, with separate fragments of the ground material and turf detected at a distance of up to 120 m from GEC-1 [7]. However, unlike AntGEC, GEC-1 is surrounded by a newly formed accumulative form, a parapet up to 3.2 m high, built of the ejected material. This parapet, as shown by field observations, is a superimposed accumulative body easily distinguishable from the remnant slopes of the initial mound. According to calculations by [22], the volume of the material deposited around the crater as a parapet was 1940 m3. The volume of the ejected material differed for each GEC due to the difference in depths of the two GECs (the initial diameter was practically the same). We consider that the deeper the initial position of the deposits, the less far from the crater edge it “flew”. This is supposed to be one of the main reasons for a more distinct parapet of GEC-1. The other reason is erosion resistance being higher for clayey (GEC-1) and lower for sandy (AntGEC) deposits.
Subtracting the 2013 DEM from the 2014 DEM for AntGEC indicates the absence of accumulative bodies that have formed and survived in this time interval (taking into account the data accuracy). Hence, if the accumulative bodies even existed in October 2014, their thickness was less than the DEM difference relative accuracy, up to 0.9 m. The absence of accumulative bodies fixed on the DEM can be explained as follows. At the time of the satellite imagery acquisition of 2014, AntGEC had existed for the entire summer. It is possible that during this time part of the material, ejected from the crater and accumulated directly near the edge, collapsed into the crater as a result of the retreat of the crater walls built of icy permafrost.
On the satellite images of the AntGEC surroundings in 2014 (see Figure 3b), several ponds 1.1–3 m in diameter are visually deciphered at the gully bottom. These are impact microforms, the formation of which is associated with the impact from the falling blocks of frozen sediments and ice ejected from the crater. Since the ponds are filled with water, not sediment, we conclude that ice was the primary component in the fallen blocks.
The absence of microrelief changes (taking into account the accuracy of the models) also confirms the assumption that the ejected material was represented by frozen sand (fairly easily eroded by meltwater and rains) and ice that melted and left traces of sand. The sand is also exposed in the upper part of the crater walls above the tabular ground ice and within the deflation hollows on the terrace surface. The tabular ice exposure in the crater walls is clearly visible in field photos from 2014 (see Figure 2b and Figure 7). Perhaps within the pre-crater mound there was a reduced thickness of sand that overlaid the tabular ice due to the dome-shaped rise of the ice roof. This supposed reduction in the thickness of the ice-covering sand can be deduced from the absence of significant volumes of ejected sand accumulated on the surface.
In turn, the presence and preservation of the GEC-1 parapet were determined by the fact that loamy blocks, more resistant to erosion by rainwater, were thrown to the surface, some being ejected from the deeper GEC-1 layers and having arrived to the surface with less energy.
Craters are actively expanding due to the thaw and collapse of frozen icy walls, and are being filled with water due to the melting of snow accumulating inside the craters in winter, and rainfalls. After craters are filled with water, the impact of the inner lake water on the frozen walls begins to play an important role in the retreat of the edges. The intensity of the wave action is limited by the small size of the inner lakes. At the initial stage, which covers the first two years, for both craters these forms were characterized by an isometric, nearly round shape. From 2014 to 2015 the diameter of AntGEC edge increased from 25–28 m to 43–47 m (Figure 9a). During the same period, the diameter of the GEC-1 increased from 29 to 52–54 m. In the field survey of GEC-1 in 2016, the growth of a lake of irregular shape due to accelerated destruction was noted (Figure 9b). The northwestern and northeastern shores, built of highly ice saturated deposits, retreated much faster than the others.

6. Conclusions

This study revealed commonalities and differences in the relief position and the geomorphic effects of the Yamal (GEC-1) and Gydan (AntGEC) gas-emission crater formations. AntGEC was formed within the same time interval as Yamal GEC-1 in the fall of 2013. Processing and analysis of very-high-resolution spatial satellite imagery lead us to the following conclusions:
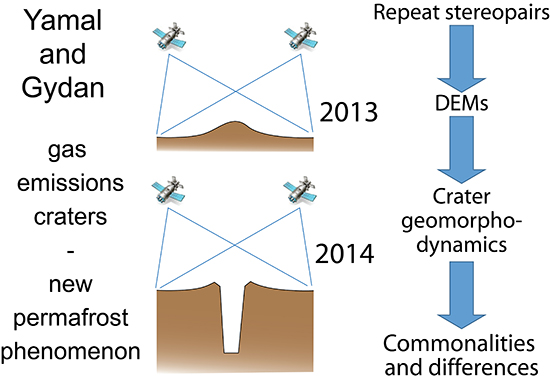
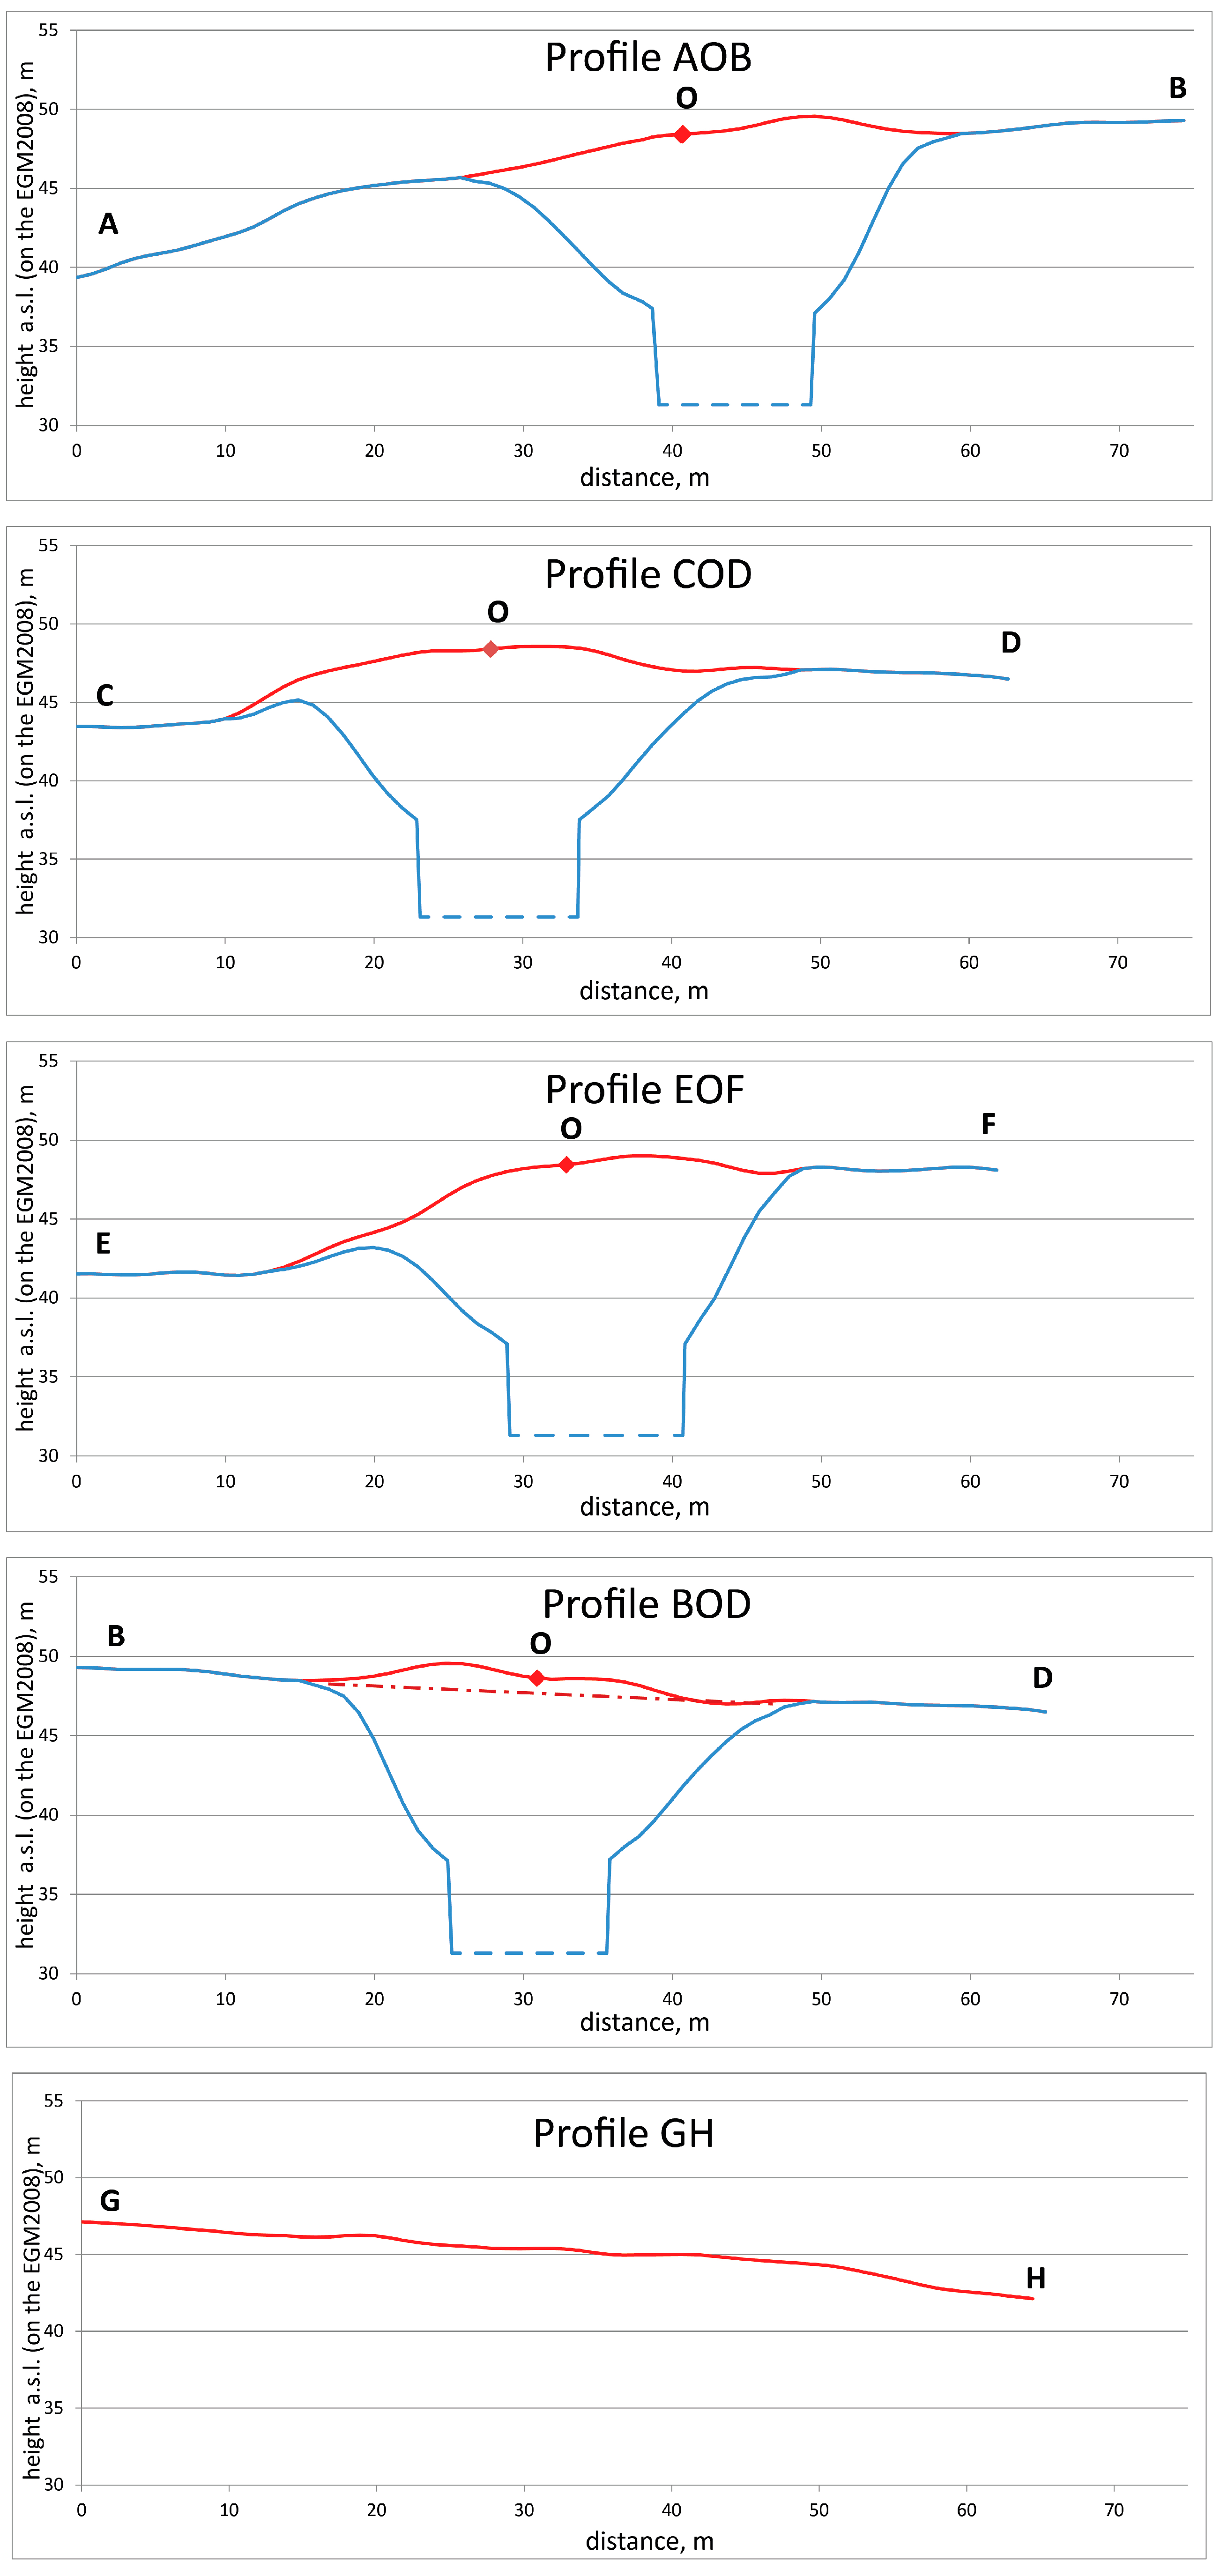
  • Photogrammetric processing of stereopair imagery for DEM creation allowed us to differentiate the relief characteristics and their changes over time that are associated with the GEC formation on Yamal and Gydan Peninsulas.
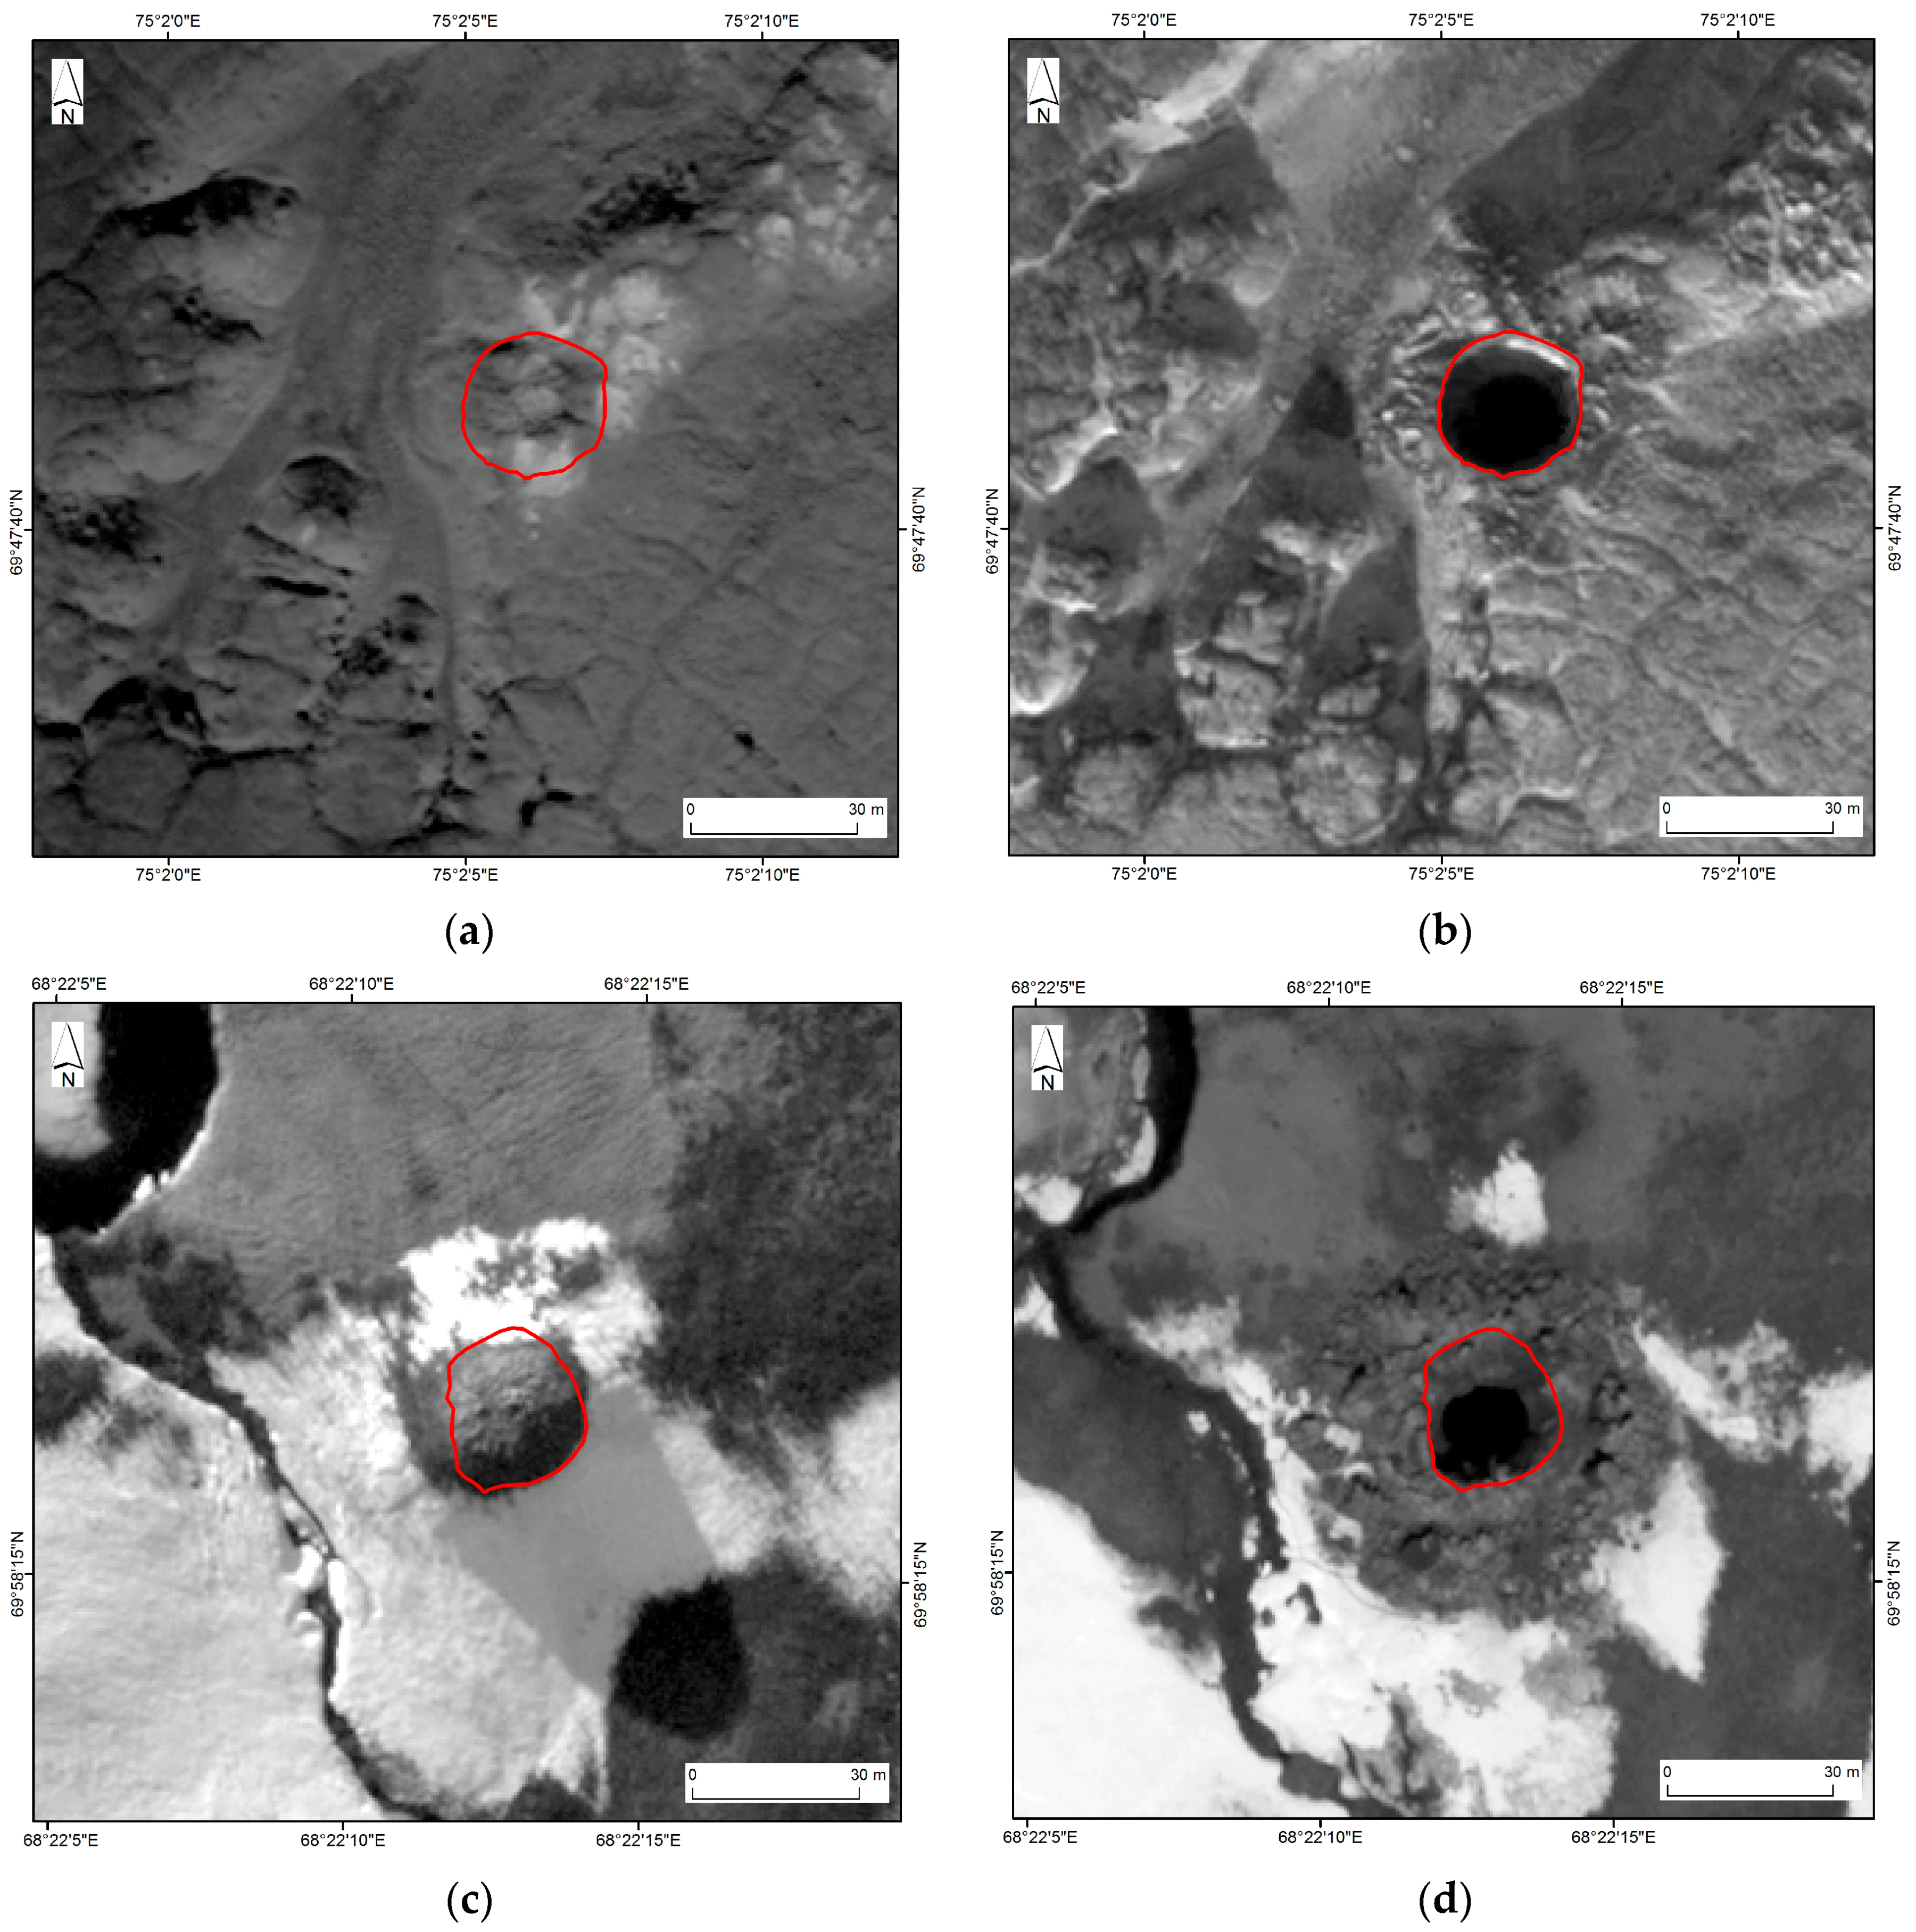
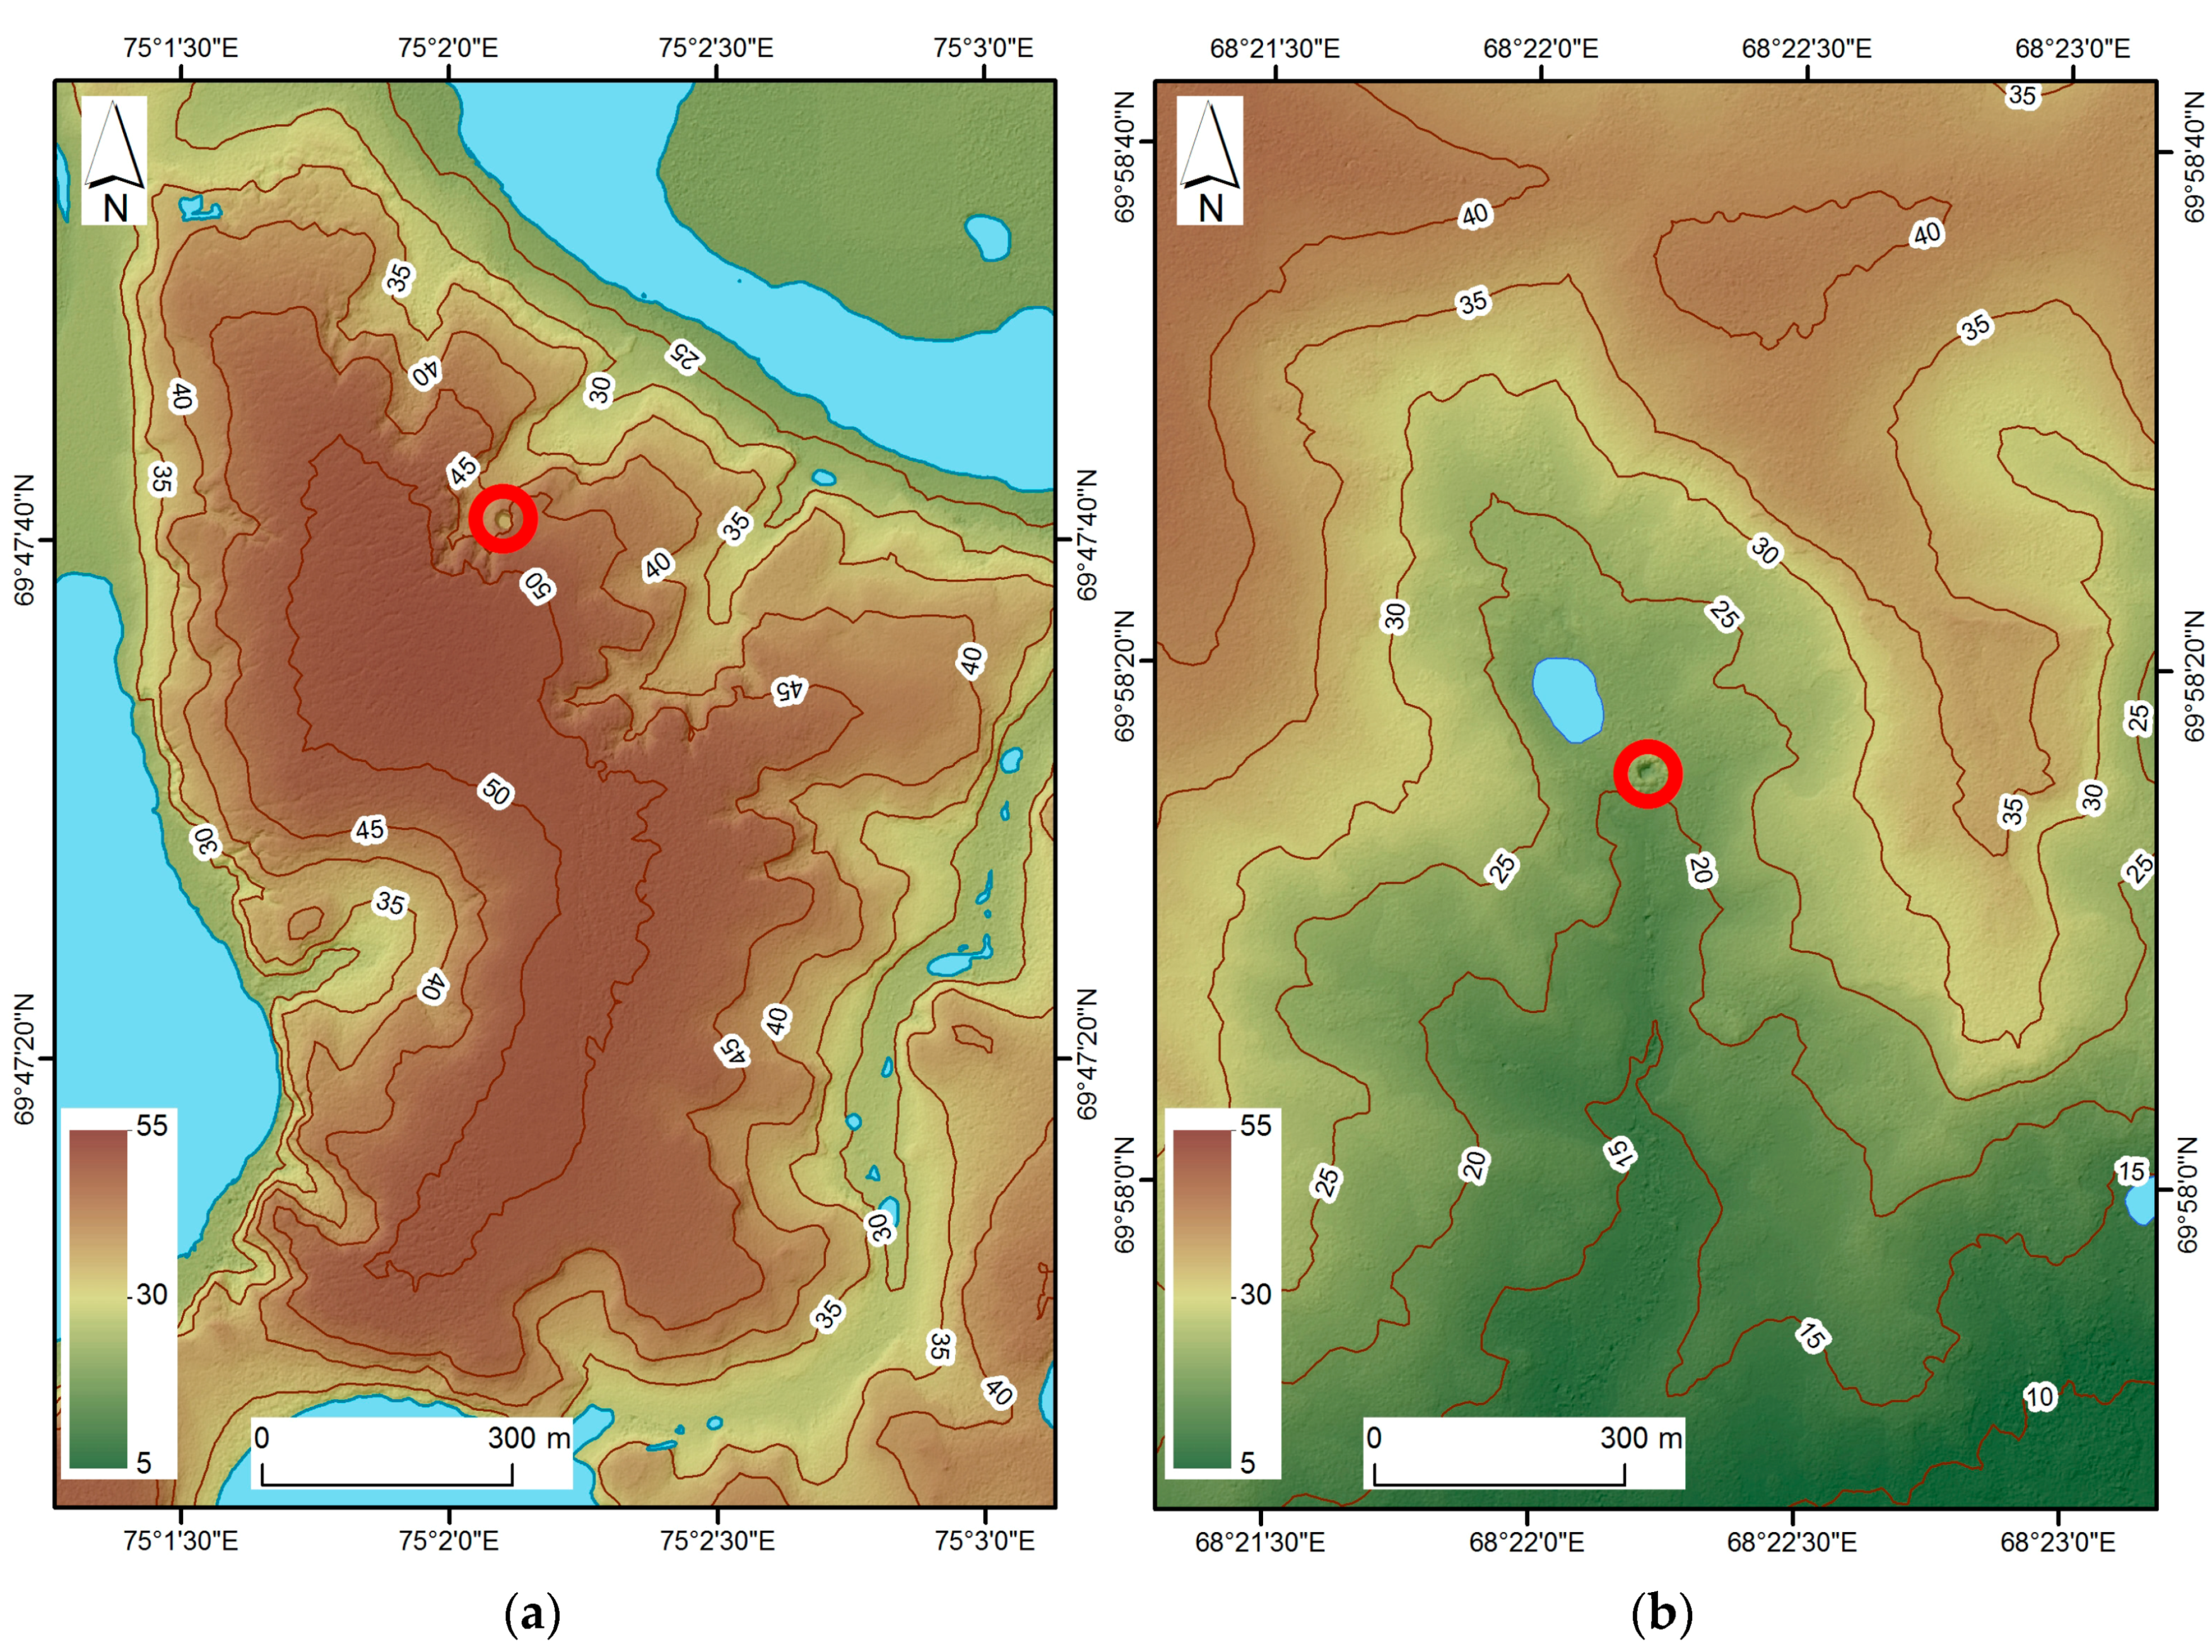
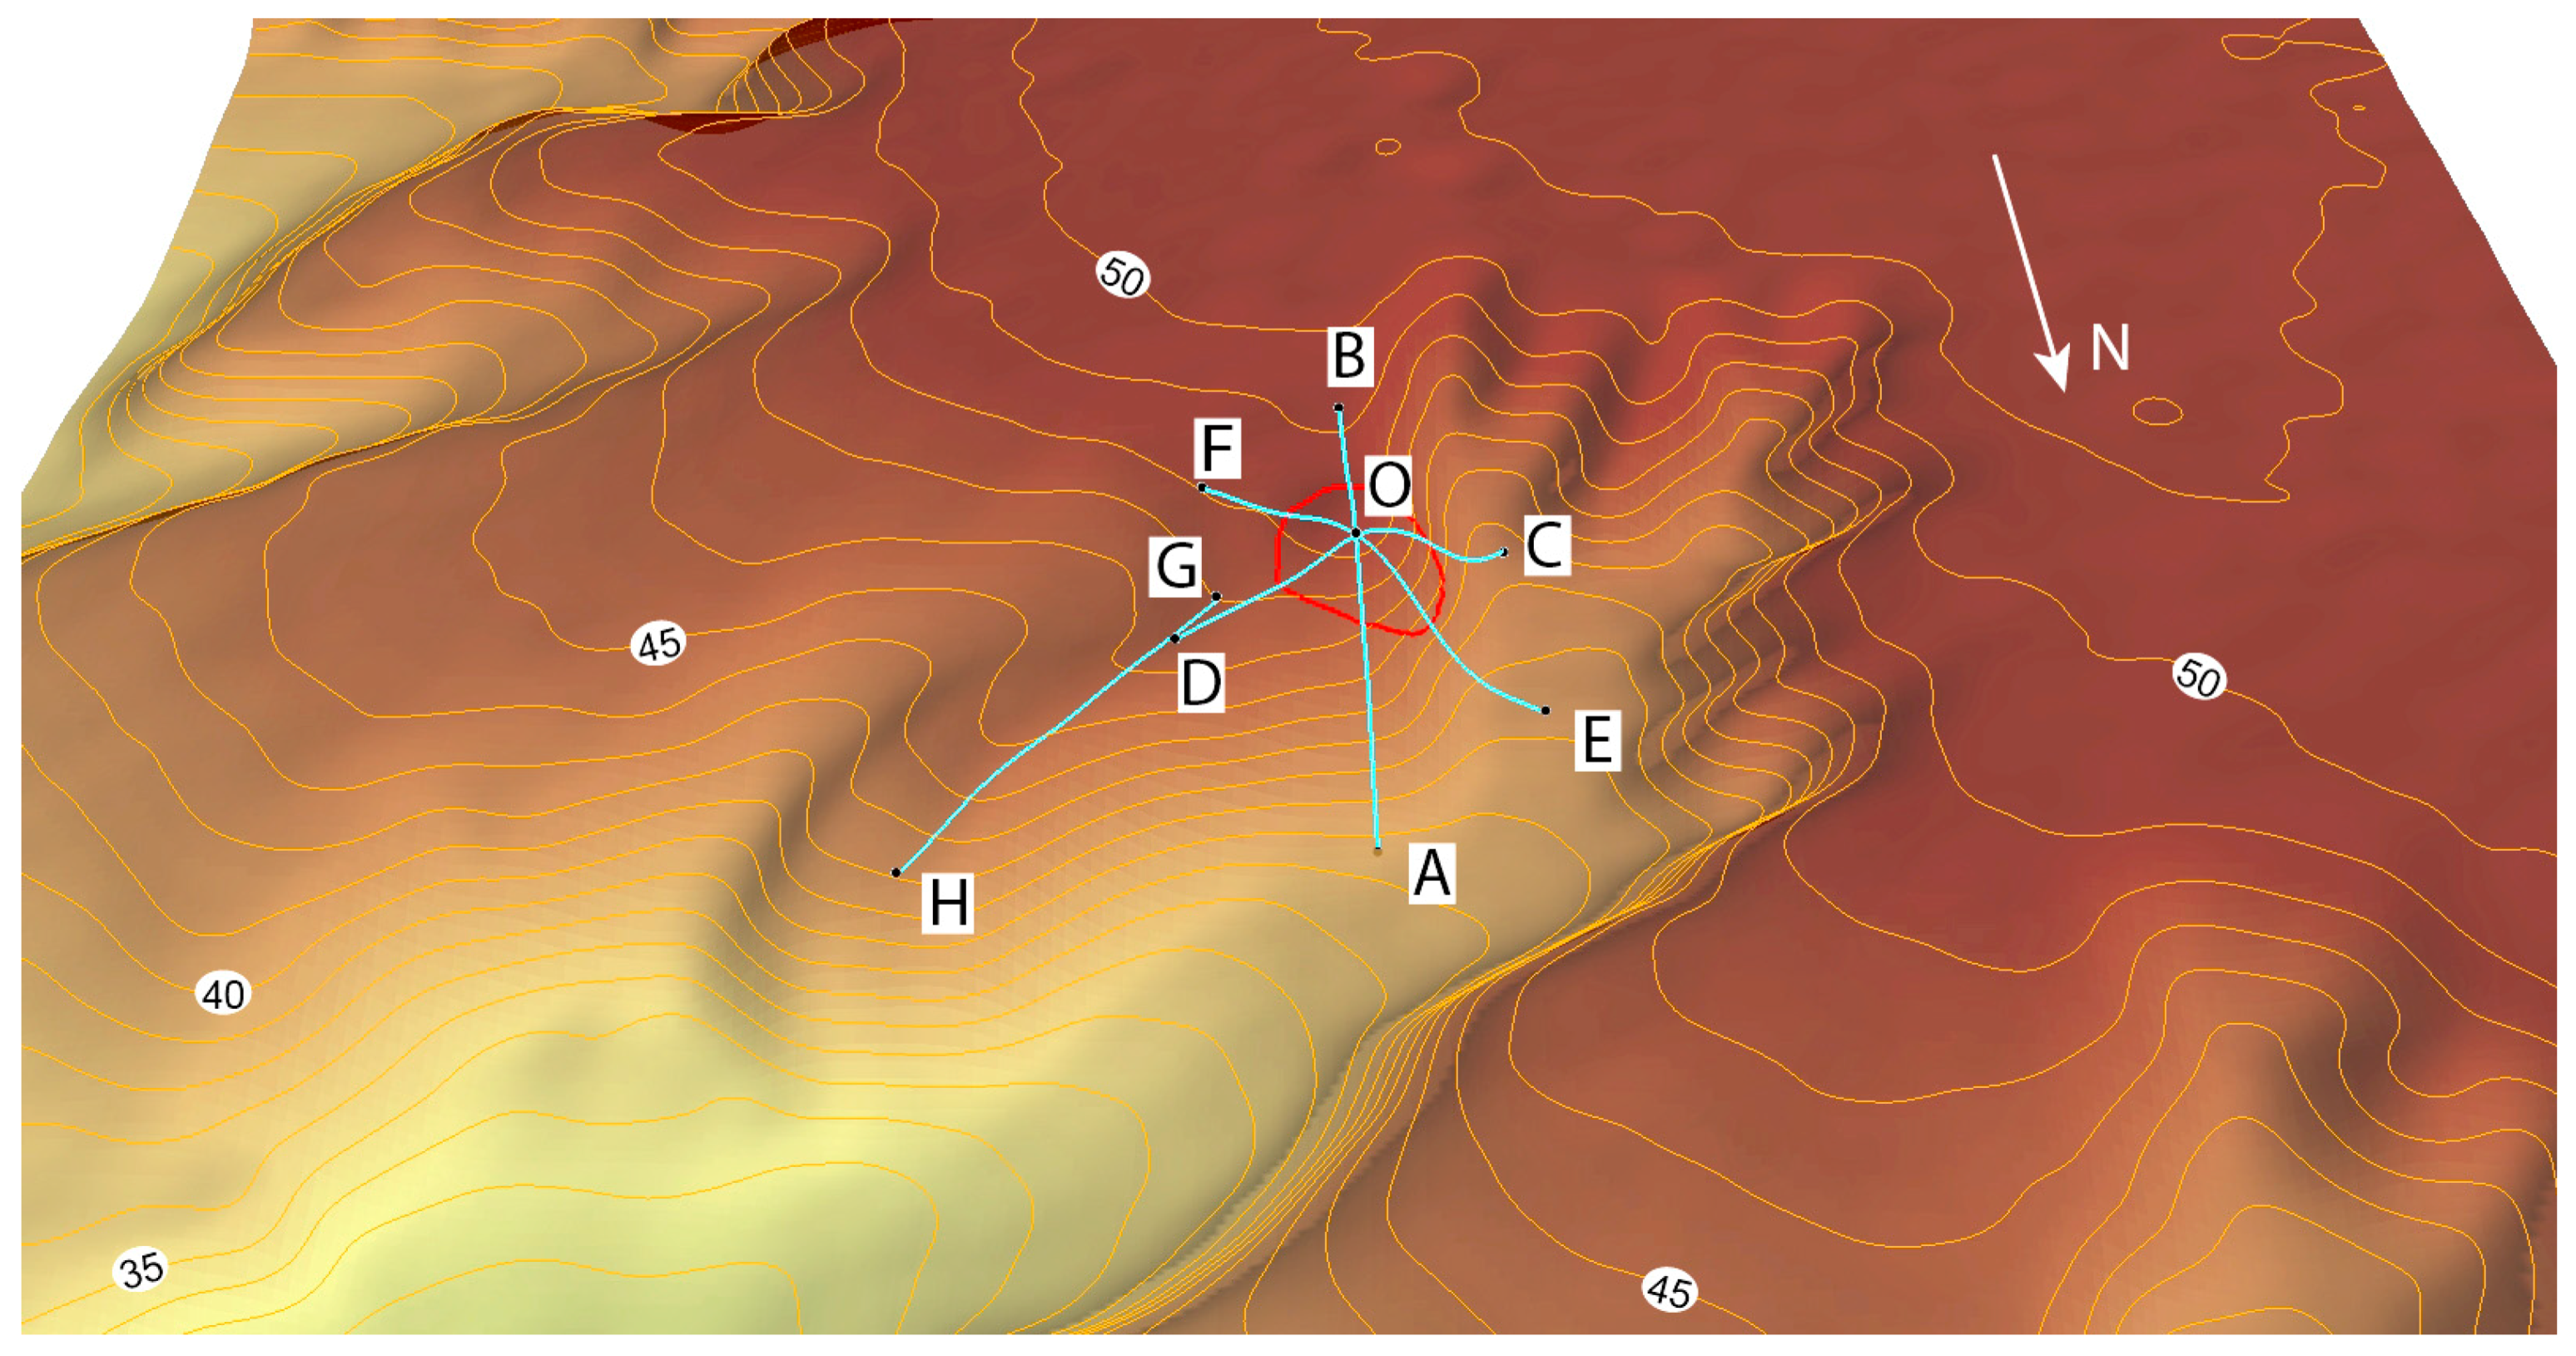
  • The studied craters are located in different relief positions. AntGEC is confined to the edge of the terrace bending into the slope of the erosion hollow cut in a terrace-like surface 30–50 m high; GEC-1 is located at the foot of a gentle slope.
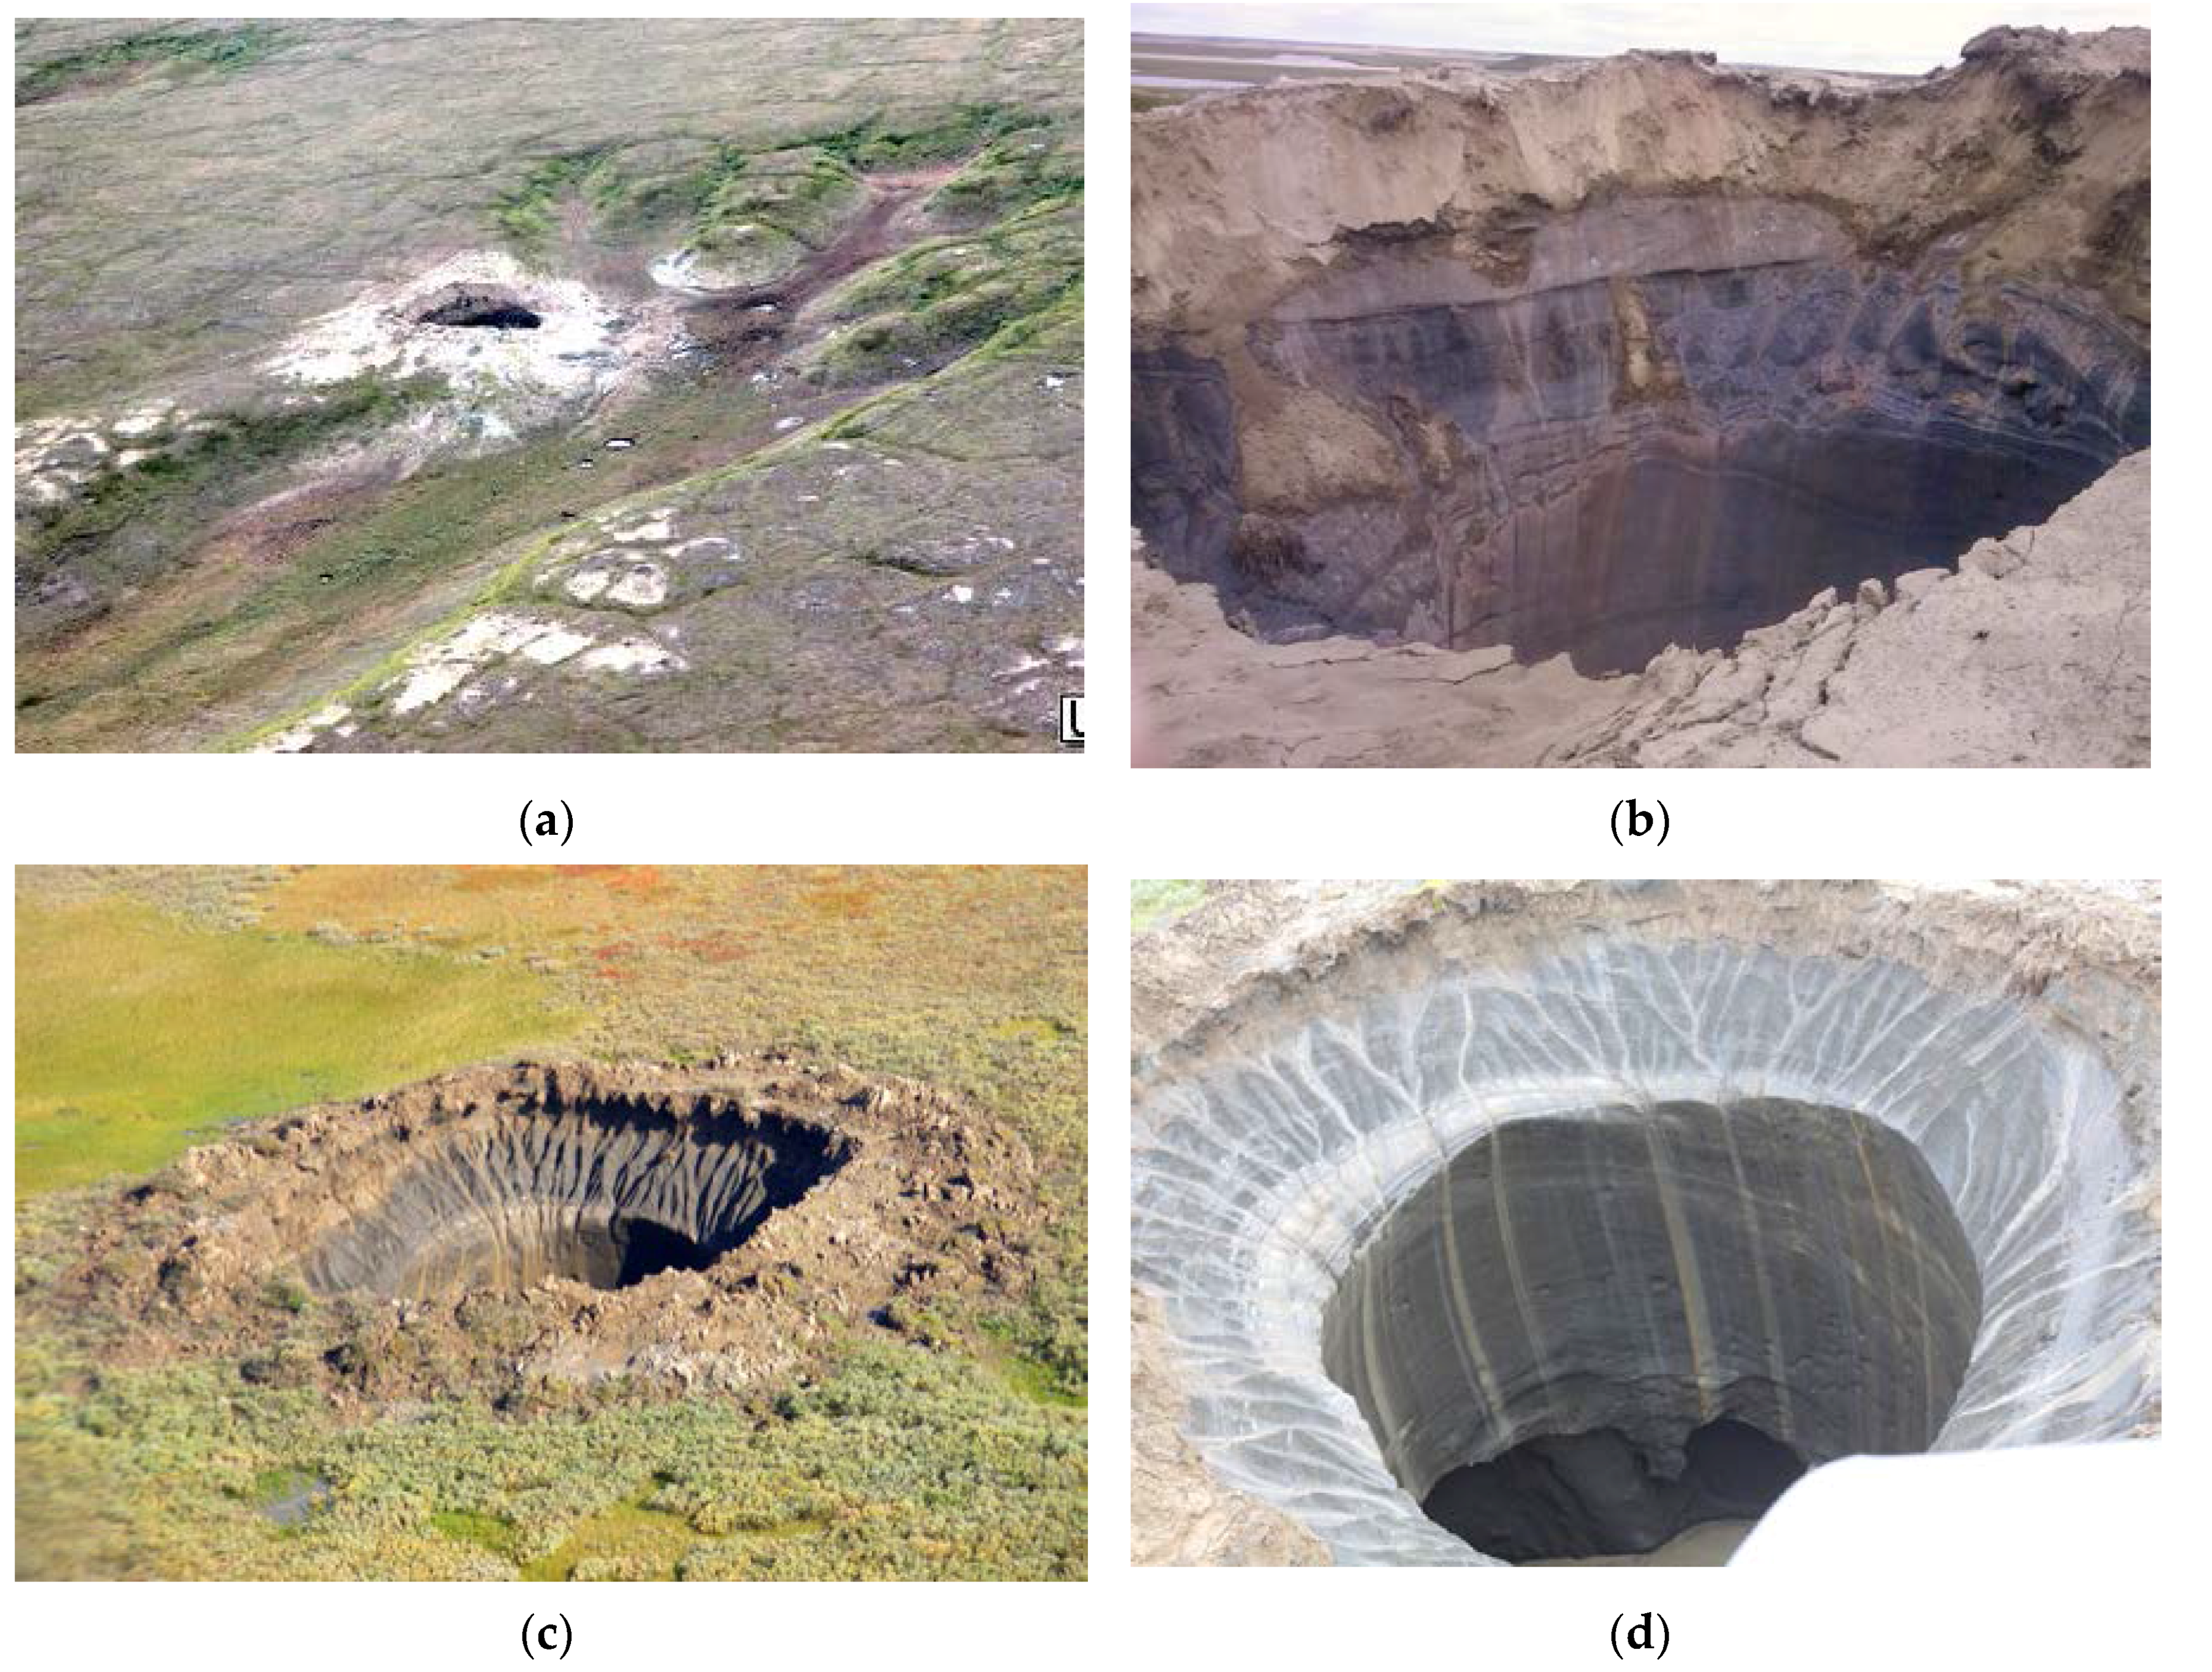
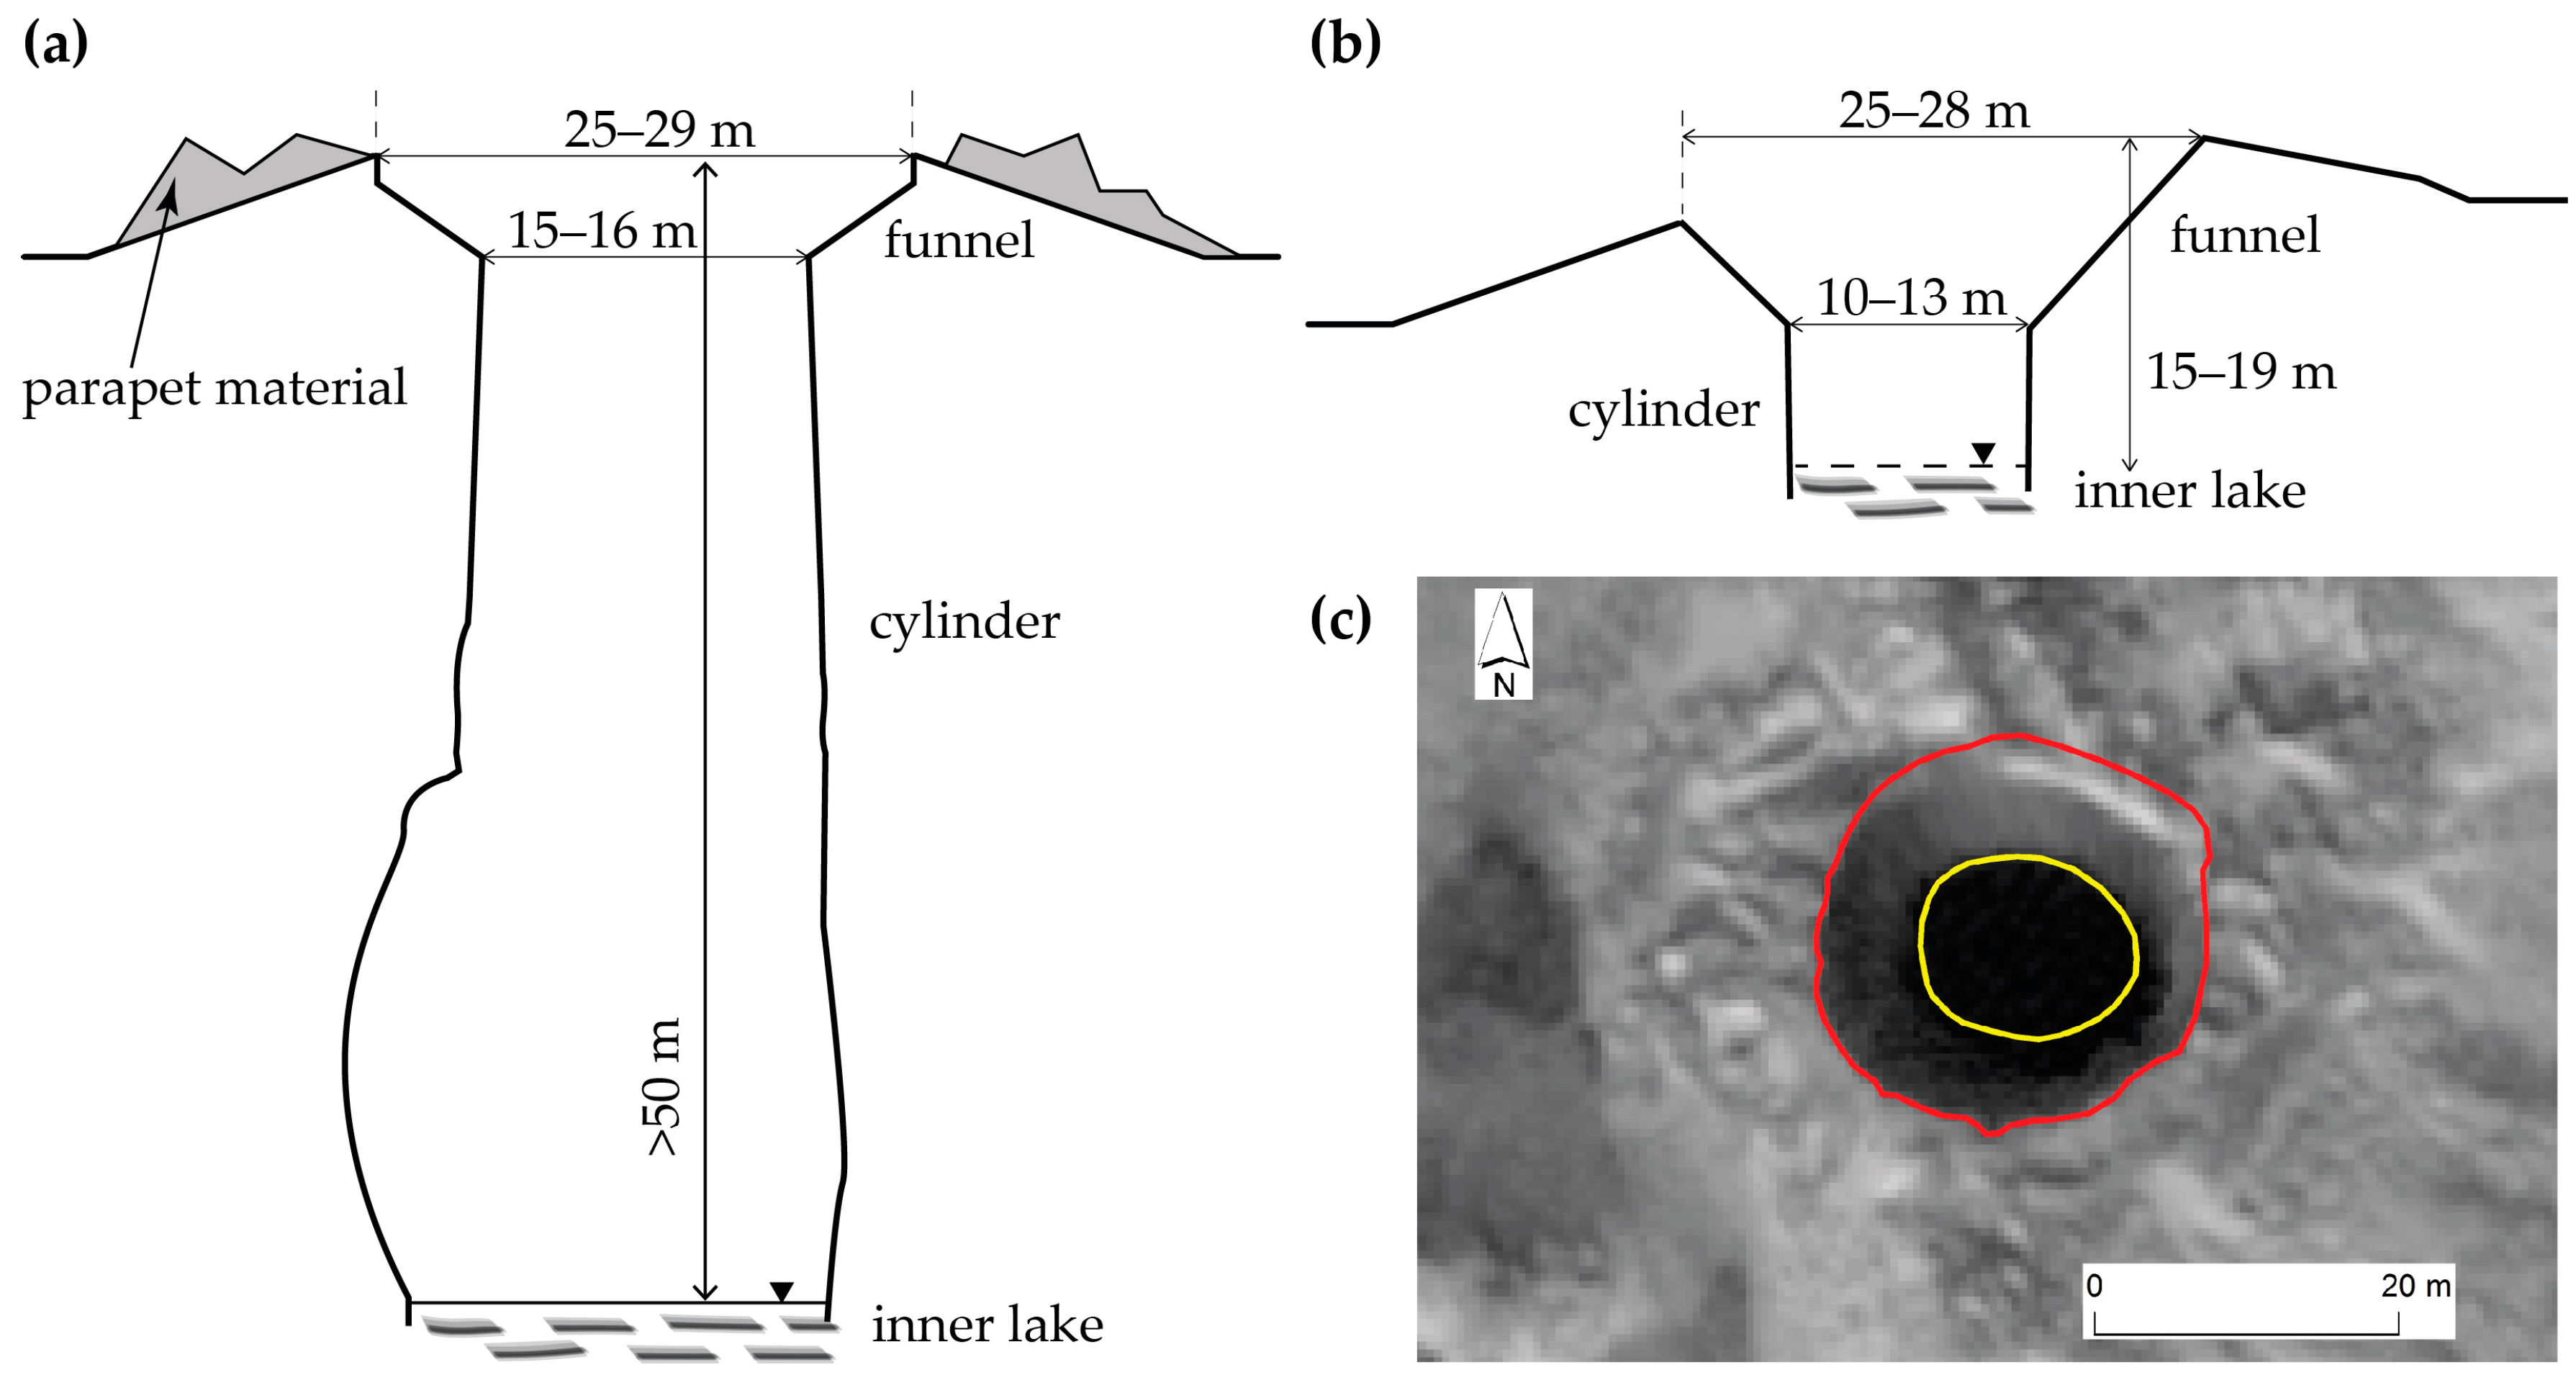
  • The formation of the AntGEC was preceded by a mound of about 2 m height, with a base diameter of about 20 m. The dimensions of the mound, as well as the initial diameter of the cylindrical part of the AntGEC, are smaller than for the Yamal GEC-1.
  • Both GECs have a similar structure, consisting of a funnel-shaped upper portion and a cylindrical lower portion.
  • No accumulation of the ejected material was detected on the DEM around AntGEC, while, in contrast, the Yamal GEC-1 was surrounded by a parapet of ejected material up to 3.2 m high. This difference results from (a) differences in geological construction and lithology (sandy, easily eroded, at AntGEC and loamy, resistant to erosion, at GEC-1), and (b) a difference in depth (deeper GEC-1 compared to AntGEC): a deeper crater provided more ejected material from the depth, which landed closer to the crater edge.
  • Small pools were observed around AntGEC, formed by the impact of the ejected blocks of frozen sediments and ground ice, but such features were not seen around GEC-1, which may be explained by shrub coverage around GEC-1 hampering visual inspection in the field and even more so on the imagery.
  • GECs were expanding due to the retreat of their walls and filled with sediment, rainwater, and melting snow. GEC-1 was almost entirely filled up with water to form an irregularly shaped lake, while the AntGEC’s inner lake preserved its round shape due to both slowly retreating walls, protected by sandy scree, and the drainage of lake water into a gully nearby.
  • The search for mounds–predecessors that might indicate the locations of possible future gas emission craters cannot be exclusively based on mound dimensions because of their considerable variations. Indicators to characterize such predecessor mounds are still to be discovered.

Acknowledgments

This work was funded by Russian Science Foundation (RSF) grant No. 16-17-10203. General permafrost information was obtained within the US NASA Land Cover Land Use Change program grant No. NNX14AD90G.The authors are grateful to anonymous reviewers for constructive comments on the manuscript.

Author Contributions

Alexandr Kizyakov provided research setting, analyzed the data, and wrote the paper. Mikhail Zimin and Anton Sonyushkin did satellite images processing, DEM creation, and map design. Yury Dvornikov and Artem Khomutov obtained and processed field data at both craters. Marina Leibman suggested approaches, provided field descriptions, and edited conclusions.

Conflicts of Interest

The authors declare no conflict of interest. The founding sponsors had no role in the design of the study; in the collection, analyses, or interpretation of data; in the writing of the manuscript, and in the decision to publish the results.

References

  1. Kääb, A. Remote sensing of permafrost-related problems and hazards. Permafr. Periglac. Process. 2008, 19, 107–136. [Google Scholar] [CrossRef]
  2. Hovland, M.; Gardner, J.V.; Judd, A.G. The significance of pockmarks to understanding fluid flow processes and geohazards. Geofluids 2002, 2, 127–136. [Google Scholar] [CrossRef]
  3. Hovland, M.; Judd, A.G. The global production of methane from shallow submarine sources. Cont. Shelf Res. 1992, 12, 1231–1238. [Google Scholar] [CrossRef]
  4. Portnov, A.; Smith, A.J.; Mienert, J.; Cherkashov, G.; Rekant, P.; Semenov, P.; Serov, P.; Vanshtein, B. Offshore permafrost decay and massive seabed methane escape in water depths >20 m at the South Kara Sea shelf. Geophys. Res. Lett. 2013, 40, 3962–3967. [Google Scholar] [CrossRef] [Green Version]
  5. Serov, P.; Portnov, A.; Mienert, J.; Semenov, P.; Ilatovskaya, P. Methane release from pingo-like features across the South Kara Sea shelf, an area of thawing offshore permafrost. J. Geophys. Res. Earth Surf. 2015, 120, 1515–1529. [Google Scholar] [CrossRef]
  6. Mironyuk, S.G.; Otto, V.P. Gas-saturated seabed grounds and natural hydrocarbon gassings: Regularities of distribution and engineering construction hazards. Georisk 2014, 2, 8–18. (In Russian) [Google Scholar]
  7. Leibman, M.O.; Plekhanov, A.V. The Yamal gas emission crater: Results of preliminary survey. KholodOK 2014, 2, 9–15. (In Russian) [Google Scholar]
  8. Epov, M.I.; Eltsov, I.N.; Olenchenko, V.V.; Potapov, V.V.; Kushnarenko, O.N.; Plotnikov, A.E.; Sinitsky, A.I. The Bermuda Triangle of the Yamal Peninsula. Nauka Perv. Ruk 2014, 5, 14–23. (In Russian) [Google Scholar]
  9. Leibman, M.O.; Dvornikov, Y.A.; Khomutov, A.V.; Babkin, E.M.; Babkina, E.A.; Vanshtein, B.G.; Kizyakov, A.I.; Oblogov, G.E.; Semenov, P.B.; Streletskaya, I.D. Hydro-chemical features of water in lakes and gas-emission craters embedded in the marine deposits of West-Siberian north. In Proceedings of the XXII International Conference on Marine Geology, Moscow, Russia, 20–24 November 2017. (In press) (In Russian). [Google Scholar]
  10. Olenchenko, V.V.; Sinitsky, A.I.; Antonov, E.Y.; Eltsov, I.N.; Kushnarenko, O.N.; Plotnikov, A.E.; Potapov, V.V.; Epov, M.I. Results of geophysical researches of the area of new geological formation “Yamal crater”. Kriosf. Zemli 2015, XIX4, 94–106. [Google Scholar]
  11. Kizyakov, A.I.; Leibman, M.O.; Sonyushkin, A.V.; Zimin, M.V.; Khomutov, A.V. Gas-emission crater, geomorphological characteristics and relief dynamics on Yamal Peninsula, Russia. In Proceedings of the XI International Conference on Permafrost, Potsdam, Germany, 20–24 June 2016; Book of Abstracts. Günther, F., Morgenstern, A., Eds.; Bibliothek Wissenschaftspark Albert Einstein: Potsdam, Germany, 2016; pp. 987–988. [Google Scholar]
  12. Leibman, M.O.; Kizyakov, A.I.; Streletskaya, I.D.; Khomutov, A.V.; Dvornikov, Y.A.; Ermokhina, K.A.; Gubarkov, A.A. Complex study of gas-emission crater in Central Yamal, Russia. In Proceedings of the XI. International Conference on Permafrost, Potsdam, Germany, 20–24 June 2016; Book of Abstracts. Günther, F., Morgenstern, A., Eds.; Bibliothek Wissenschaftspark Albert Einstein: Potsdam, Germany, 2016; pp. 989–990. [Google Scholar]
  13. Ermokhina, K.A.; Kizyakov, A.I.; Leibman, M.O.; Khomutov, A.V. GIS of the gas-emission crater area (Yamal peninsula, Russia). In Proceedings of the XI. International Conference on Permafrost, Potsdam, Germany, 20–24 June 2016; Book of Abstracts. Günther, F., Morgenstern, A., Eds.; Bibliothek Wissenschaftspark Albert Einstein: Potsdam, Germany, 2016; pp. 972–973. [Google Scholar]
  14. Khilimonyuk, V.Z.; Ospennikov, E.N.; Buldovich, S.N.; Gunar, A.Y.; Gorshkov, E.I. Geocryological conditions of Yamal crater location. In Proceedings of the Fifth Conference of Russian Geocryologists, Moscow, Russia, 14–17 June 2016; University Book: Moscow, Russia, 2016; Volume 2, pp. 245–255. (In Russian). [Google Scholar]
  15. Streletskaya, I.D.; Leibman, M.O.; Kizyakov, A.I.; Oblogov, G.E.; Vasiliev, A.A.; Khomutov, A.V.; Dvornikov, Y.A. Ground Ice and its Role in the Formation of Gas-Emission Crater in the Yamal Peninsula. Moscow University Bulletin. Series 5, Geography 2017, 2, 91–99. (In Russian) [Google Scholar]
  16. Leibman, M.O.; Kizyakov, A.I.; Plehanov, A.V.; Streletskaya, I.D. New permafrost feature: Deep crater in Central Yamal, West Siberia, Russia as a response to local climate fluctuations. Geogr. Environ. Sustain. 2014, 4, 68–80. [Google Scholar] [CrossRef]
  17. Bogoyavlenskiy, V.I. Threat of catastrophic gas blowouts from the Arctic permafrost zone. Yamal and Taimyr Craters, Part 1. Oil Drill. 2014, 9, 13–18. (In Russian) [Google Scholar]
  18. Bogoyavlenskiy, V.I. Threat of catastrophic gas blowouts from the Arctic permafrost zone. Yamal and Taimyr Craters, Part 2. Oil Drill. 2014, 10, 4–9. (In Russian) [Google Scholar]
  19. Kojina, L.Y.; Miklyaeva, E.S.; Perlova, E.V.; Sinitsky, A.I.; Tkacheva, E.V.; Cherkasov, V.A. Dangerous contemporary phenomenons of cryoactivity—The main results of the Yamal crater study. Sci. Bull. Yamalo Nenets Auton. Dist. 2015, 2, 19–28. (In Russian) [Google Scholar]
  20. Bychkov, A.Y.; Vorobyev, S.A.; Buldovicz, S.N.; Khilimonyuk, V.Z.; Ospennikov, E.N. Cryovolcanism on the Earth: Origin of a Giant Crater in the Yamal Peninsula (Russia). In Goldschmidt Abstracts; Paris, France, 2017; Available online: https://www.goldschmidtabstracts.info/abstracts/abstractView?id=2017005692 (accessed on 1 October 2017).
  21. Leibman, M.; Kizyakov, A.; Khomutov, A.; Dvornikov, Yu.; Babkina, E.; Arefiev, S.; Khairullin, R. Are pre-crater mounds gas-inflated? In Proceedings of EGU General Assembly Conference, Vienna, Austria, 23–28 April 2017; p. 4085. [Google Scholar]
  22. Kizyakov, A.I.; Sonyushkin, A.V.; Leibman, M.O.; Zimin, M.V.; Khomutov, A.V. Geomorphological conditions of the gas-emission crater and its dynamics in Central Yamal. Kriosf. Zemli 2015, 2, 13–22. [Google Scholar]
  23. Van Everdingen, R. Multi-Language Glossary of Permafrost and Related Ground-Ice Terms; National Snow and Ice Data Center: Boulder, CO, USA, 1988; (revised 2005). [Google Scholar]
  24. Sizov, O.S. Remote sensing data analysis of the consequences of gas releases in the north of Western Siberia. Geomatica 2015, 1, 53–68. (In Russian) [Google Scholar]
  25. Bogoyavlenskiy, V.I.; Sizov, O.S.; Bogoyavlenskiy, I.V.; Nikonov, R.A. Remote detection of surface gas releases in the Arctic: The Yamal Peninsula. Arct. Ecol. Econ. 2016, 3, 4–15. (In Russian) [Google Scholar]
  26. News Service URA.RU. Available online: http://ura.ru/news/1052185773 (accessed on 12 March 2017).
  27. Kizyakov, A.I.; Sonyushkin, A.V.; Khomutov, A.V.; Dvornikov, Y.A.; Leibman, M.O. Assessment of the relief-forming effect of the Antipayuta gas emission crater formation using satellite stereo pairs. Curr. Probl. Remote Sens. Earth From Space 2017, 4, 67–75. (In Russian) [Google Scholar]
  28. Danilov, I.D. Pleistocene of the Marine Sub-Arctic Plains; Moscow University Press: Moscow, Russia, 1978; p. 200. (In Russian) [Google Scholar]
  29. Ananyeva, G.V. Specific features of the engineering-geocryological conditions of the northern section of the Obskaya-Bevanenkovo railway under design. In Results of Fundamental Research of the Earth Cryosphere in Arctic and Subarctic; Nauka: Novosibirsk, Russia, 1997; pp. 116–123. (In Russian) [Google Scholar]
  30. Melnikov, E.S.; Kritsuk, L.N.; Pavlov, A.V. Geocryological and Engineering-Geological Problems of Yamal Development; VNIEMS: Moscow, Russia, 1990; p. 53. (In Russian) [Google Scholar]
  31. Badu, Y.B.; Podborny, E.E. Permafrost thickness. In Cryosphere of Oil and Gas Condensate Fields of the Yamal Peninsula; Badu, Y.B., Gafarov, E.A., Podborny, E.E., Eds.; Cryosphere of the Bovanenkovskoye oil and gas condensate field; Gazprom Expo: Moscow, Russia, 2013; Volume 2, pp. 168–184. (In Russian) [Google Scholar]
  32. Badu, Y.B.; Trofimov, V.T.; Vasilchuk, Y.K. The main patterns of distribution and types of tabular ground ice in the northern part of the West Siberian Plate. In Tabular Ground Ice in Cryolithozone; Popov, A.I., Ed.; Permafrost Institute: Yakutsk, Russia, 1982; pp. 13–24. (In Russian) [Google Scholar]
  33. Dubikov, G.I. Composition and Cryogenic Structure of the Western Siberia Permafrost; GEOS: Moscow, Russia, 2002; p. 246. (In Russian) [Google Scholar]
  34. Streletskaya, I.D.; Leibman, M.O. Cryogeochemical interrelation of massive ground ice, cryopegs, and enclosing deposits of Central Yamal. Kriosf. Zemli 2002, 4, 15–24. (In Russian) [Google Scholar]
  35. Khomutov, A.V.; Leibman, M.O.; Andreyeva, M.V. Mapping of tabular ice in Central Yamal. Tyumen State Univ. Herald 2012, 7, 68–76. (In Russian) [Google Scholar]
  36. Vasilchuk, Y.K. Tabular ground ice. In Cryosphere of Oil and Gas Condensate Fields of the Yamal Peninsula; Badu, Y.B., Gafarov, E.A., Podborny, E.E., Eds.; Cryosphere of the Bovanenkovskoye oil and gas condensate field; Gazprom Expo: Moscow, Russia, 2013; Volume 2, pp. 284–317. (In Russian) [Google Scholar]
  37. State Geological Map of the Russian Federation. Scale 1:1000000 (New Edition). Sheet R-43-(45)—Gydan-Dudinka; VSEGEI: Sankt-Petersburg, Russia, 2000. [Google Scholar]
  38. Vasilchuk, Y.K.; Trofimov, V.T.; Badu, Y.B.; Kudryashov, V.G. North-Gydan region. In Geocryology of USSR. Western Siberia; Ershov, E.D., Ed.; Nedra: Moscow, Russia, 1989; pp. 180–189. (In Russian) [Google Scholar]
  39. Choi, S.Y.; Kang, J.M.; Shin, D.S. A comparison of accuracies of the RPC models: Homo- and heterotype stereo pairs of GeoEye and WorldView images. In Proceedings of the ISPRS Annals of the Photogrammetry, Remote Sensing and Spatial Information Sciences, XXII ISPRS Congress, Melbourne, Australia, 25 August–1 September 2012; Volume 1–4, pp. 65–69. [Google Scholar]
  40. Hirshmuller, H. Accurate and efficient stereo processing by semi-global matching and mutual information, In Proceedings of the IEEE Conference on Computer Vision and Pattern Recognition (CVPR). San Diego, CA, USA, 20–26 June 2005; Volume 2, pp. 807–814. [Google Scholar]
  41. Kirkpatrick, S.; Gelatt, C.D.; Vecchi, M.P. Optimization by Simulated Annealing. Science 1983, 220, 671–680. [Google Scholar] [CrossRef] [PubMed]
  42. Hastings, W.K. Monte Carlo Sampling Methods Using Markov Chains and Their Applications. Biometrika 1970, 57, 97–109. [Google Scholar] [CrossRef]
Figure 1. Scheme of the gas-emission craters location. Craters under study: 1, GEC-1 on Central Yamal; 2, AntGEC on Gydan Peninsula. Other known craters in the North of West Siberia: 3–5, on Yamal Peninsula; 6, on Yenisei Bay coast.
Remotesensing 09 01023 g001
Figure 2. AntGEC and GEC-1 state in summer 2014: (a) AntGEC photo taken from a helicopter, the round-shaped crater is located on the terrace edge [26]; (b) note the tabular ground ice in AntGEC funnel and cylinder walls, Photo courtesy of Kh. S. Okotetto. (c) GEC-1 at a practically flat surface, the foot of a gentle slope. The crater is surrounded by parapet built out of the ejected material. Photo by M. O. Leibman. (d) Note the tabular ground ice in GEC-1 funnel and cylinder walls. One can see a grotto in the cylindrical portion. Photo courtesy of V. Pushkarev.
Remotesensing 09 01023 g002
Figure 3. Satellite images of the AntGEC: (a) a WorldView-2 image dated 21 August 2013 (before the crater formation); (b) a WorldView-1 image dated 11 October 2014 (after the crater formation). The red line represents the AntGEC crater edge as of 11 October 2014; Satellite images of the GEC-1: (c) a WorldView-1 image dated 09 June 2013 (before the crater formation); (d) a WorldView-1 image dated 15 June 2014 (after the crater formation). The red line represents the GEC-1 crater edge as of 15 June 2014.
Remotesensing 09 01023 g003
Figure 4. Differences in the crater location: (a) AntGEC is confined to the edge of the terrace remain and upper slope. The slopes of the third terrace remains are cut by erosion gullies, and separated by thermokarst basins; (b) GEC-1 is located at the foot of a gentle slope near the border of the khasyrey (drained lake bottom).
Remotesensing 09 01023 g004
Figure 5. 3D model of the AntGEC location, DEM of 21 August 2013 with the hypsometric profiles position.
Remotesensing 09 01023 g005
Figure 6. Morphometric characteristics of AntGEC. Hypsometric profiles: red line as of 21 August 2013, blue line as of 11 October 2014. The bottom of the crater was not detected with the DEM comparison.
Remotesensing 09 01023 g006
Figure 7. AntGEC inner structure: (a) the diameter of the cylindrical portion of the crater was 10–13 m in the summer of 2014 and vertical walls height was estimated as 5–6 m [26]; (b) sandy deposits with different thicknesses cover tabular ground ice in the upper part of the crater walls. Photo by courtesy of Kh. S. Okotetto.
Remotesensing 09 01023 g007
Figure 8. Differences in the structure of the studied craters: (a) GEC-1 at the time of the first field survey on 16 July 2014; (b) AntGEC as of the date of the satellite imagery acquisition on 11 October 2014; (c) the AntGEC crater edge (top of the funnel-shaped portion) position by the red line, the position of the cylindrical portion edge by the yellow line (WorldView-1 of 11 October 2014).
Remotesensing 09 01023 g008
Figure 9. Crater evolution: (a) position of the upper edge of the AntGEC: red line as of 11 October 2014 (WorldView-1 image), orange line as of 31 August 2015 (Resurs-P2 image); (b) position of the GEC-1 upper edge: red line as of 15 June 2014 (WorldView-1 image), orange line as of 31 August 2015 (according to the field survey), green line as of 19 October 2016 (according to the field survey).
Remotesensing 09 01023 g009
Table 1. Attributes of satellite data sets used.
SensorDateMean Scan Azimuth AngleMean Scan Elevation AngleHeight (H), kmPan Ground Sample Distance (GSD), mStereopair
GEC-1 (Yamal Peninsula)
WorldView-19 June 2013307.964.94400.580+
WorldView-19 June 2013196.867.44400.563
WorldView-115 June 2014184.166.54400.540+
WorldView-115 June 201437.464.04400.579
AntGEC (Gydan Peninsula)
WorldView-221 August 201327.577.07700.48+
WorldView-221 August 2013205.860.07700.55
WorldView-111 October 2014335.964.84400.58+
WorldView-111 October 2014258.163.64400.62
Table 2. Comparison of Yamal GEC-1 and Gydan AntGEC morphometric characteristics.
Yamal GEC-1 1Gydan AntGEC 2
Mound characteristics
base diameter, m45–4820
relative height, m5–62
Crater characteristics
crater edge diameter, m25–2925–28
cylindrical part diameter, m15–1610–13
crater depth, m>5015–19
1 according to field survey data of 16 July 2014, satellite imagery data and DEMs of 9 June 2013 and 15 June 2014. 2 according to satellite imagery data and DEMs of 21 August 2013 and 11 October 2014.

