Application of Landsat Imagery to Investigate Lake Area Variations and Relict Gull Habitat in Hongjian Lake, Ordos Plateau, China

Abstract
:
1. Introduction
2. Materials and Methods
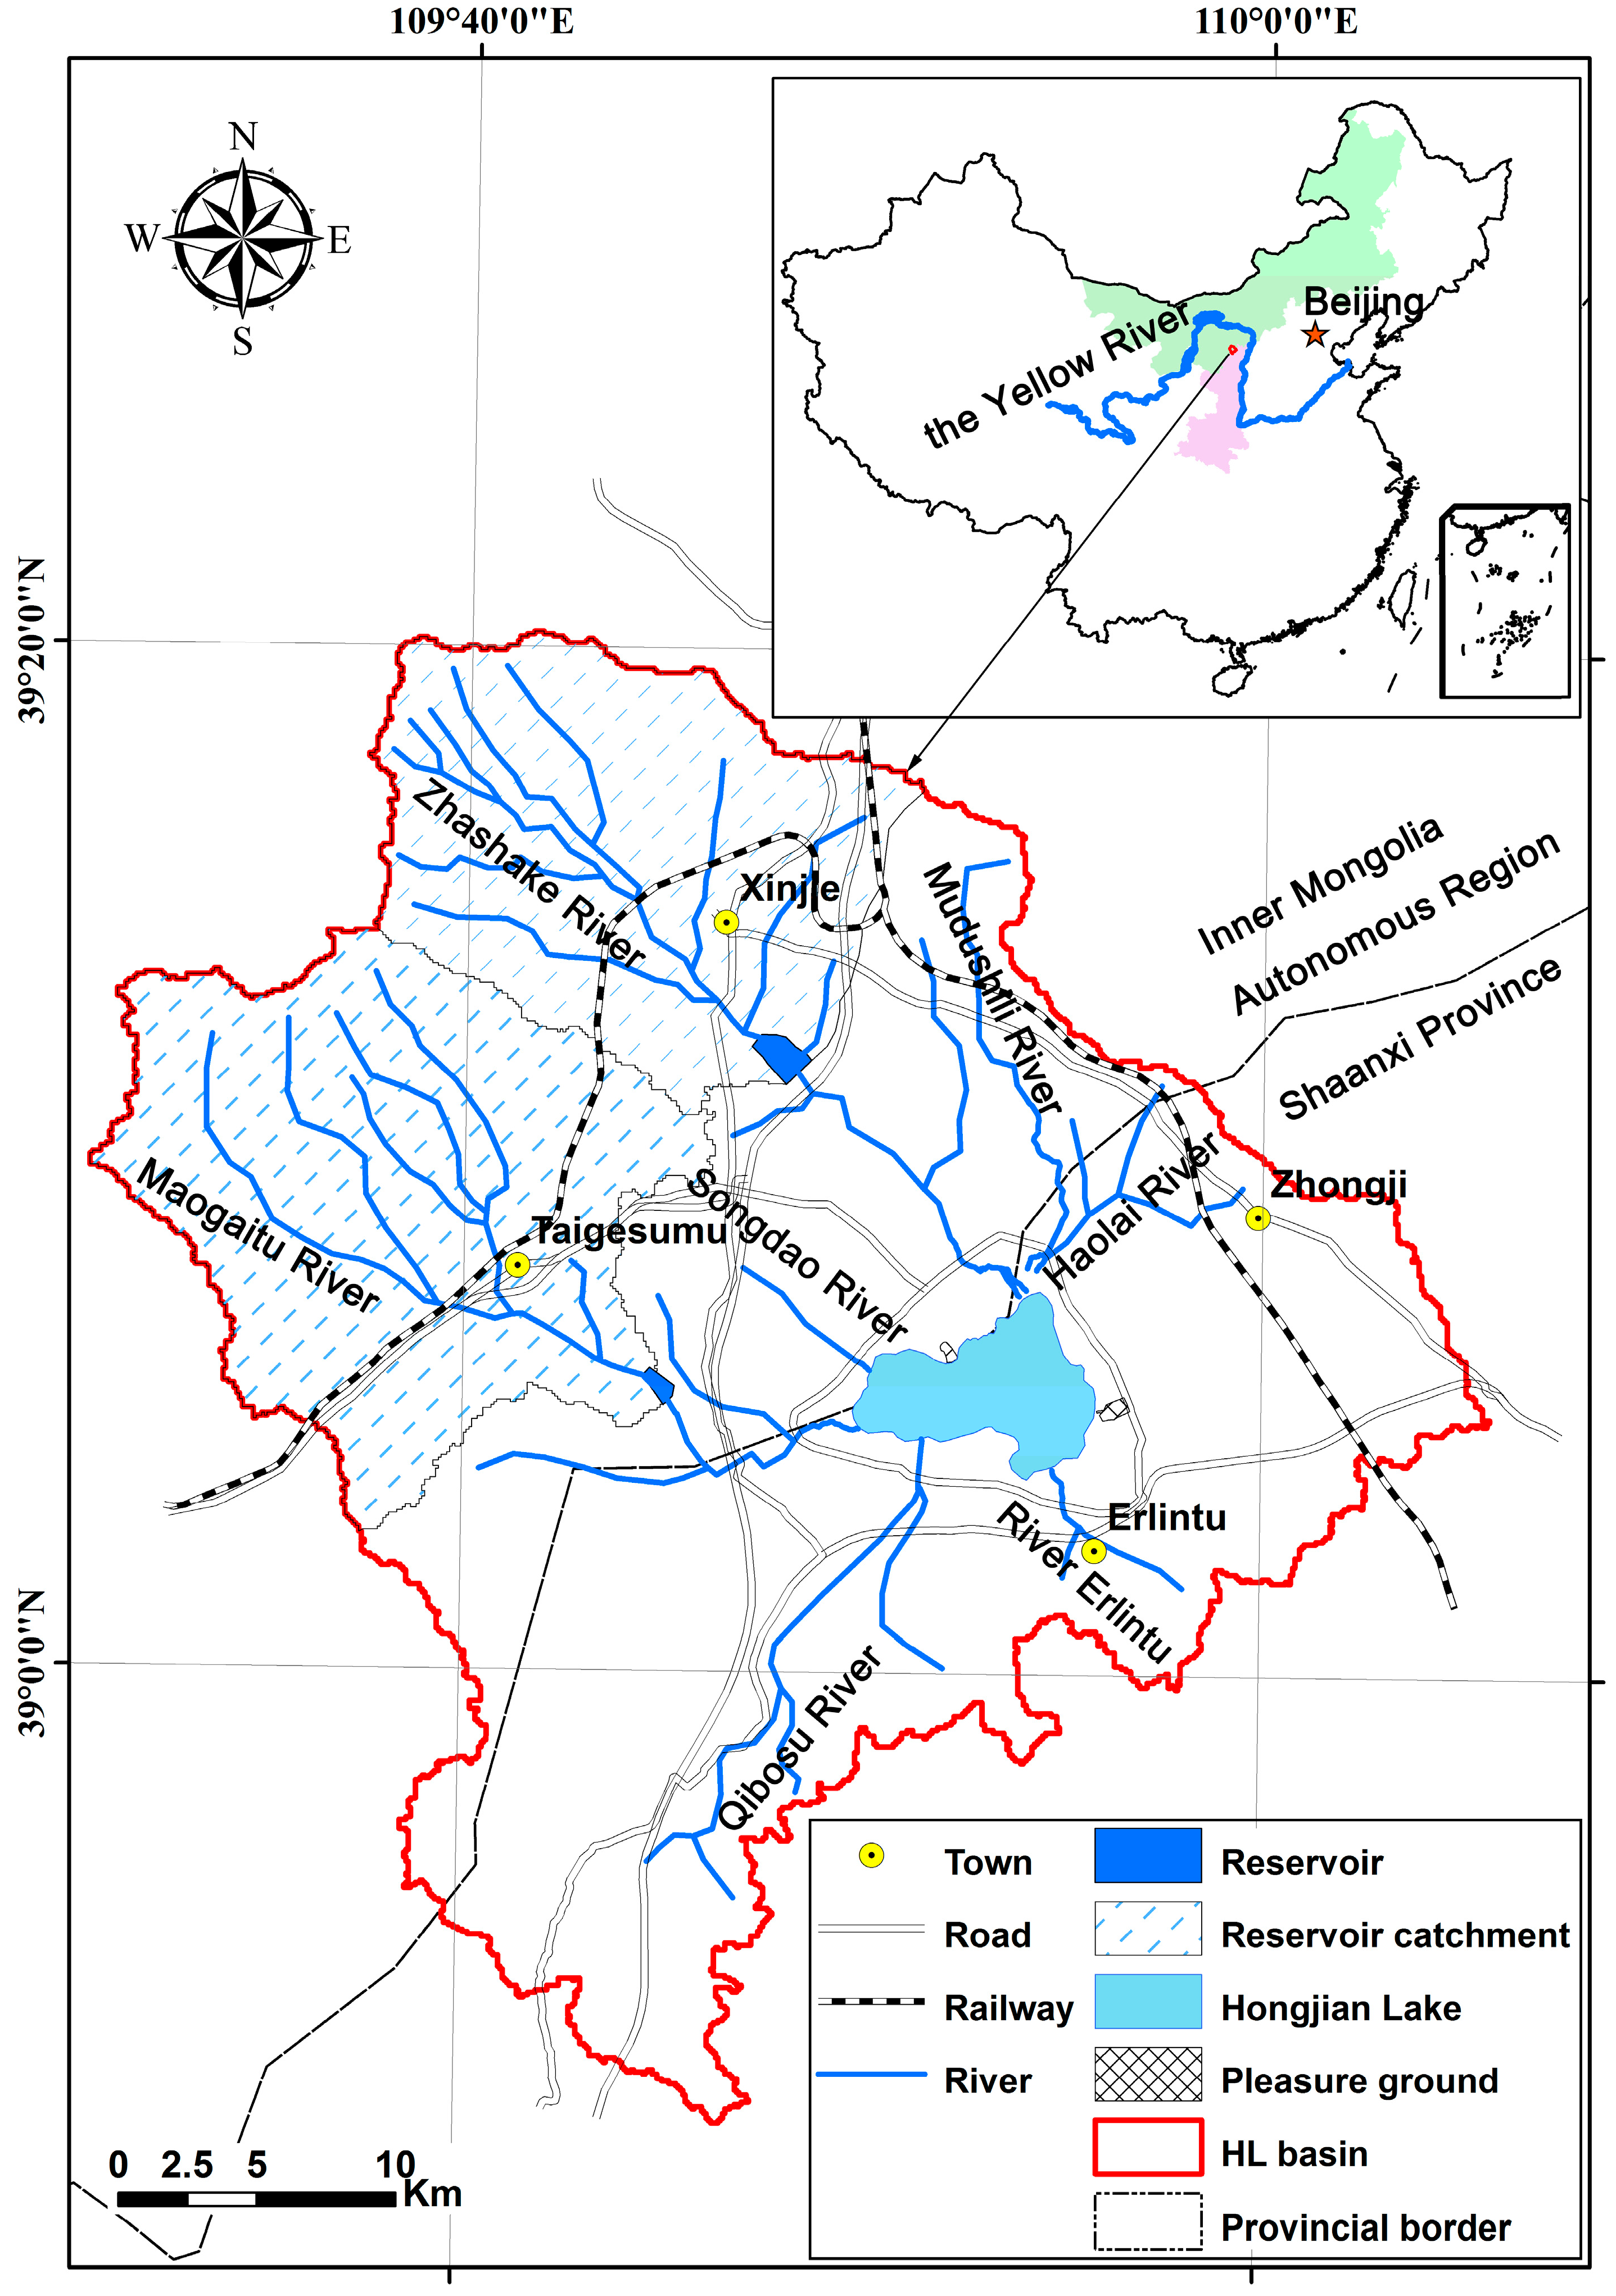
2.1. Study Site
2.2. Data
2.3. Methods
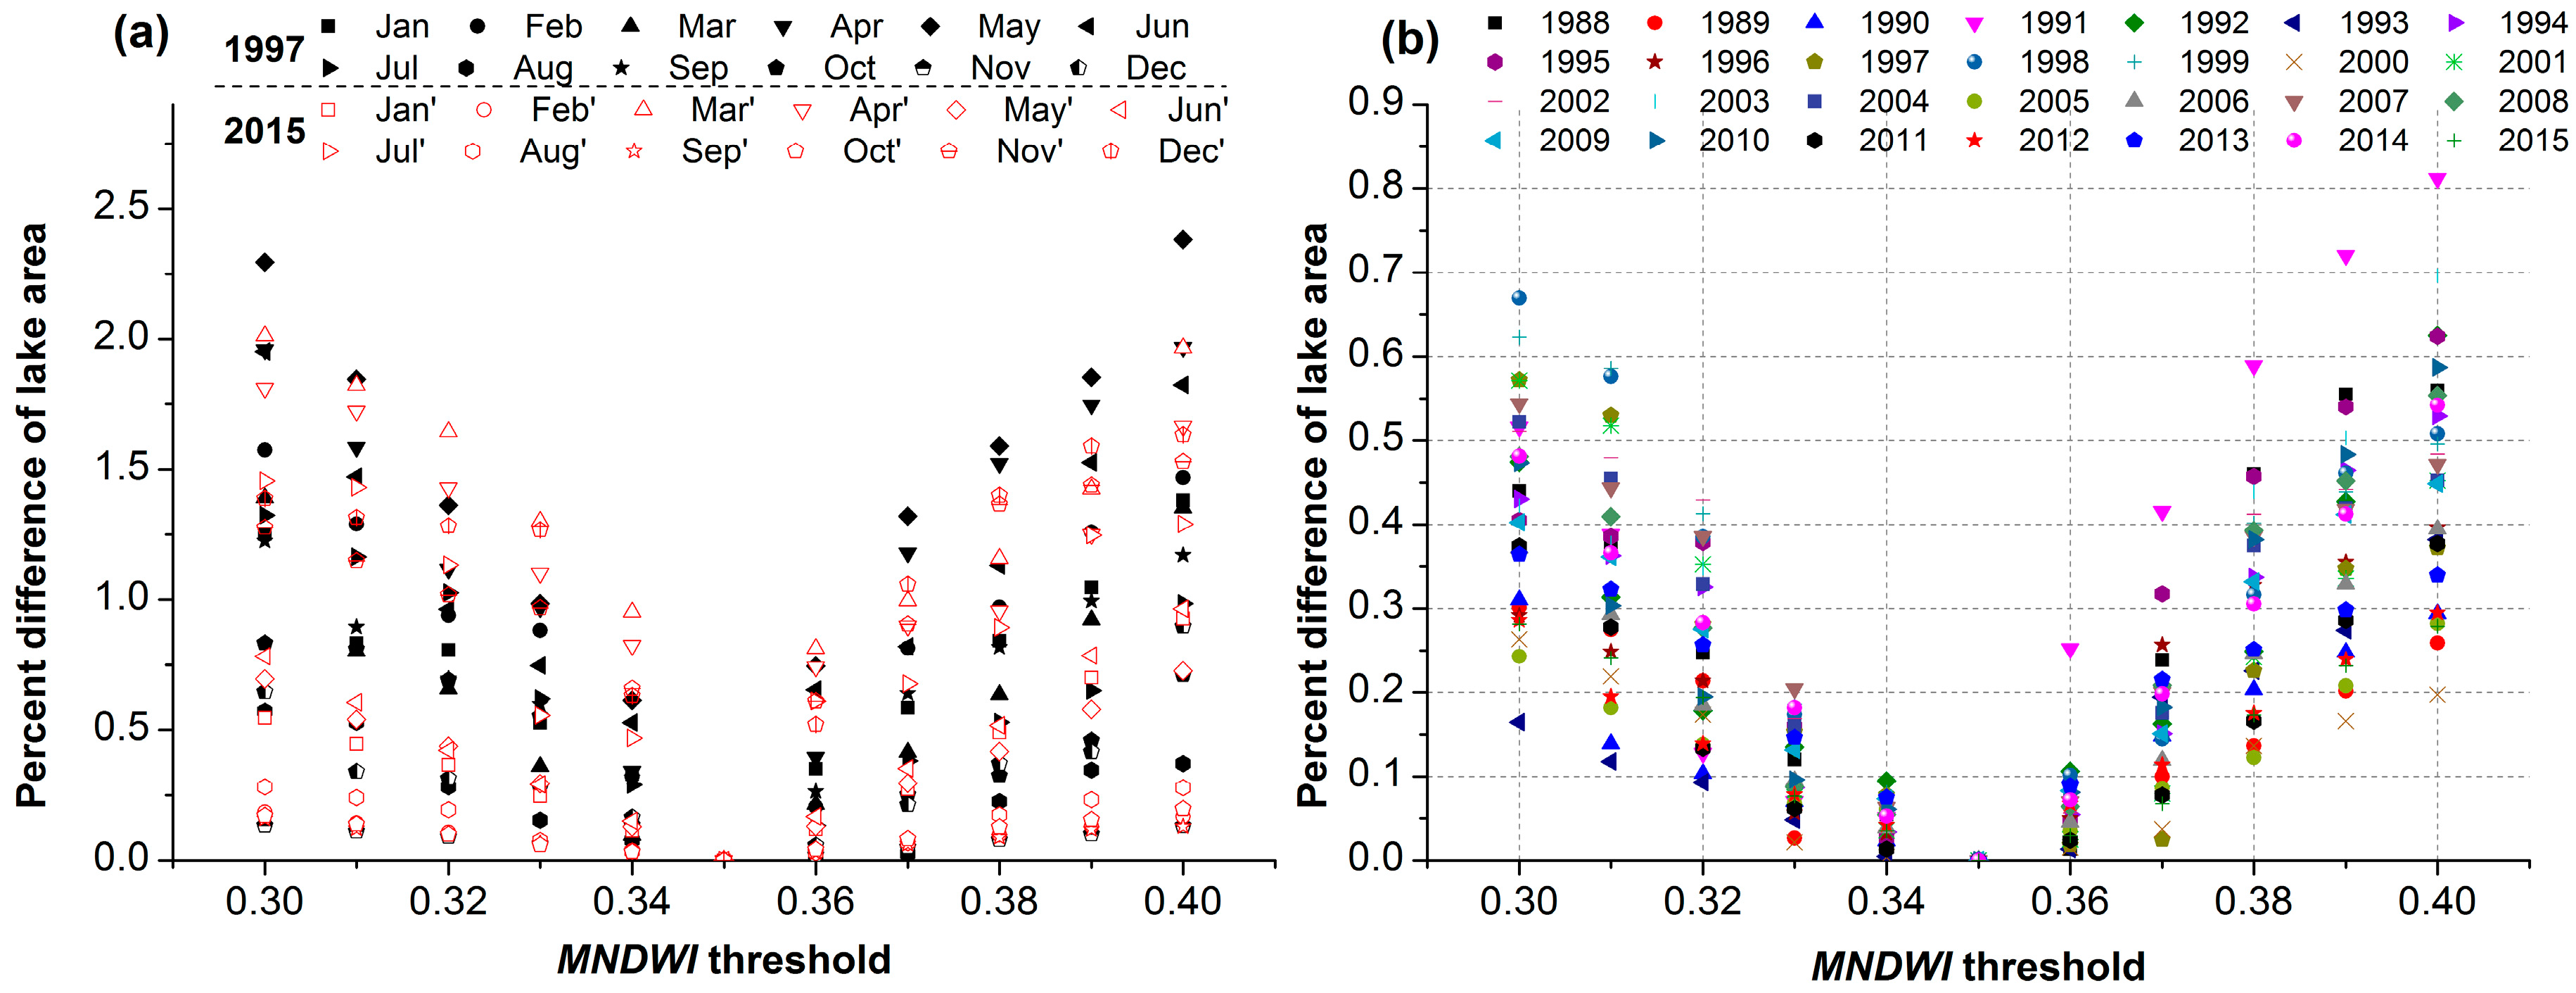
2.3.1. Remote-Sensing Extraction of Lake Surface Area Using the Modified Normalized Difference Water Index
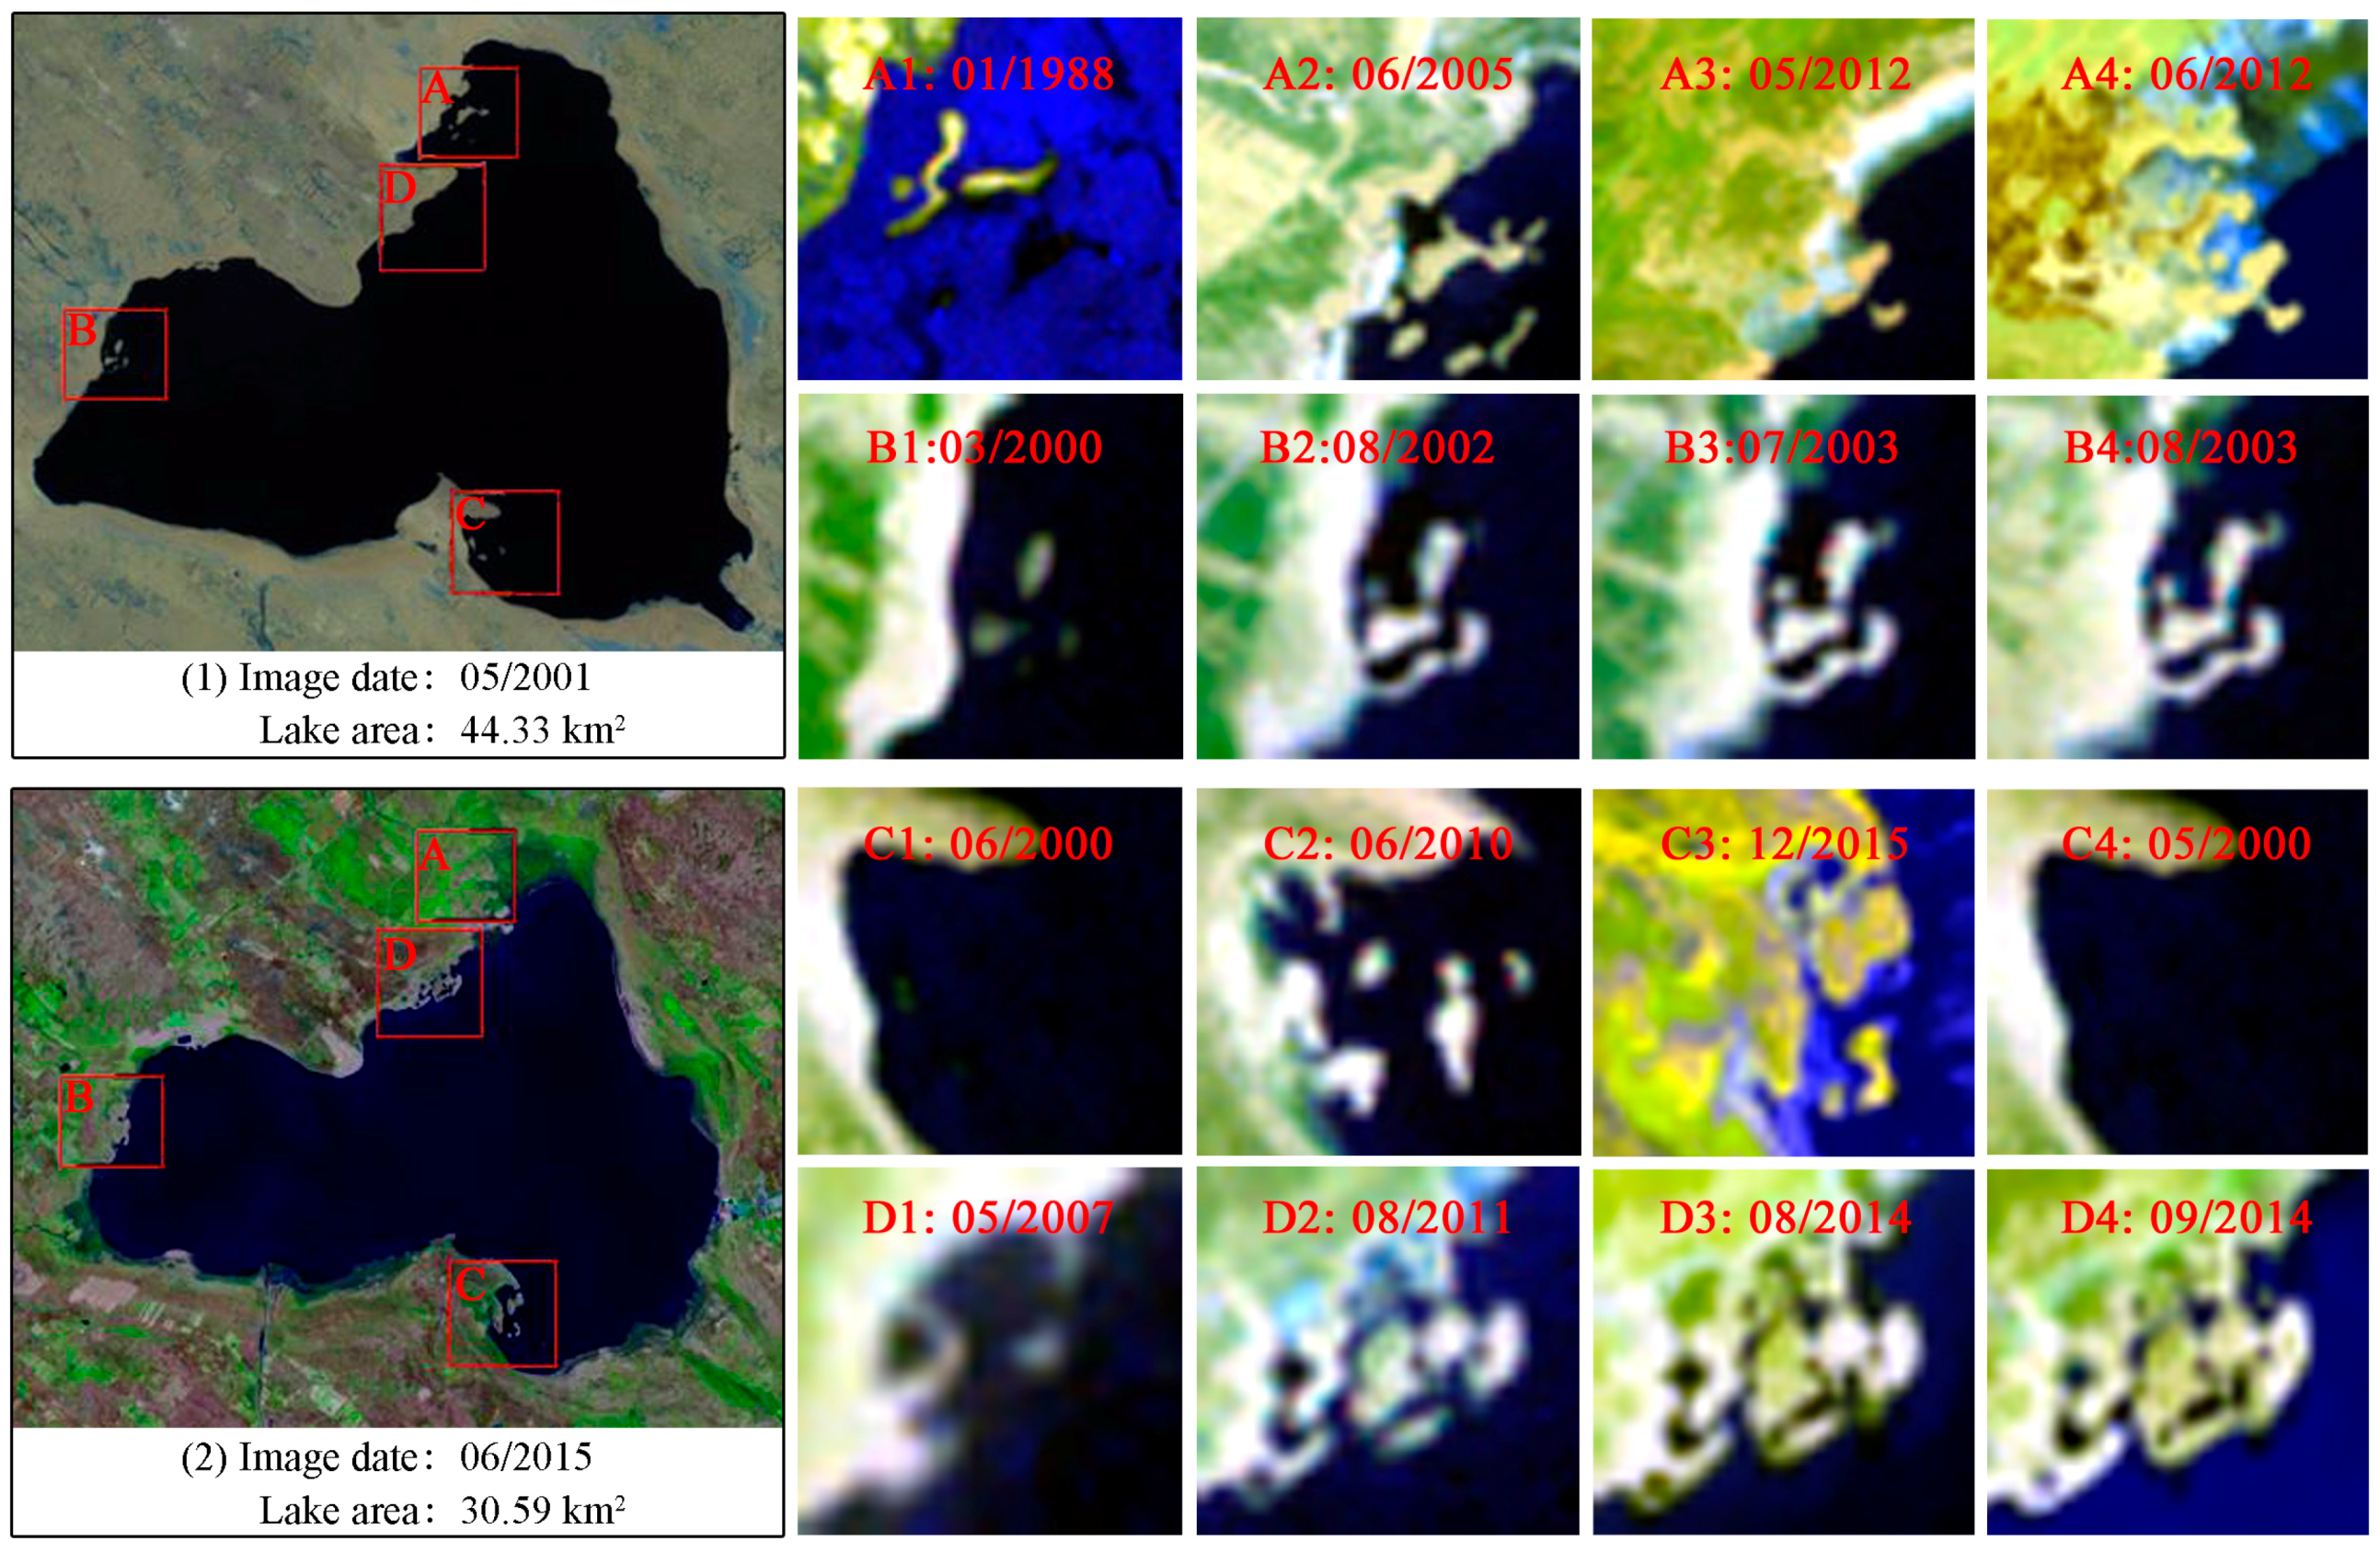
2.3.2. Remote-Sensing Identification of Lake Islands
2.3.3. Field Observation and Survey of Relict Gull Populations
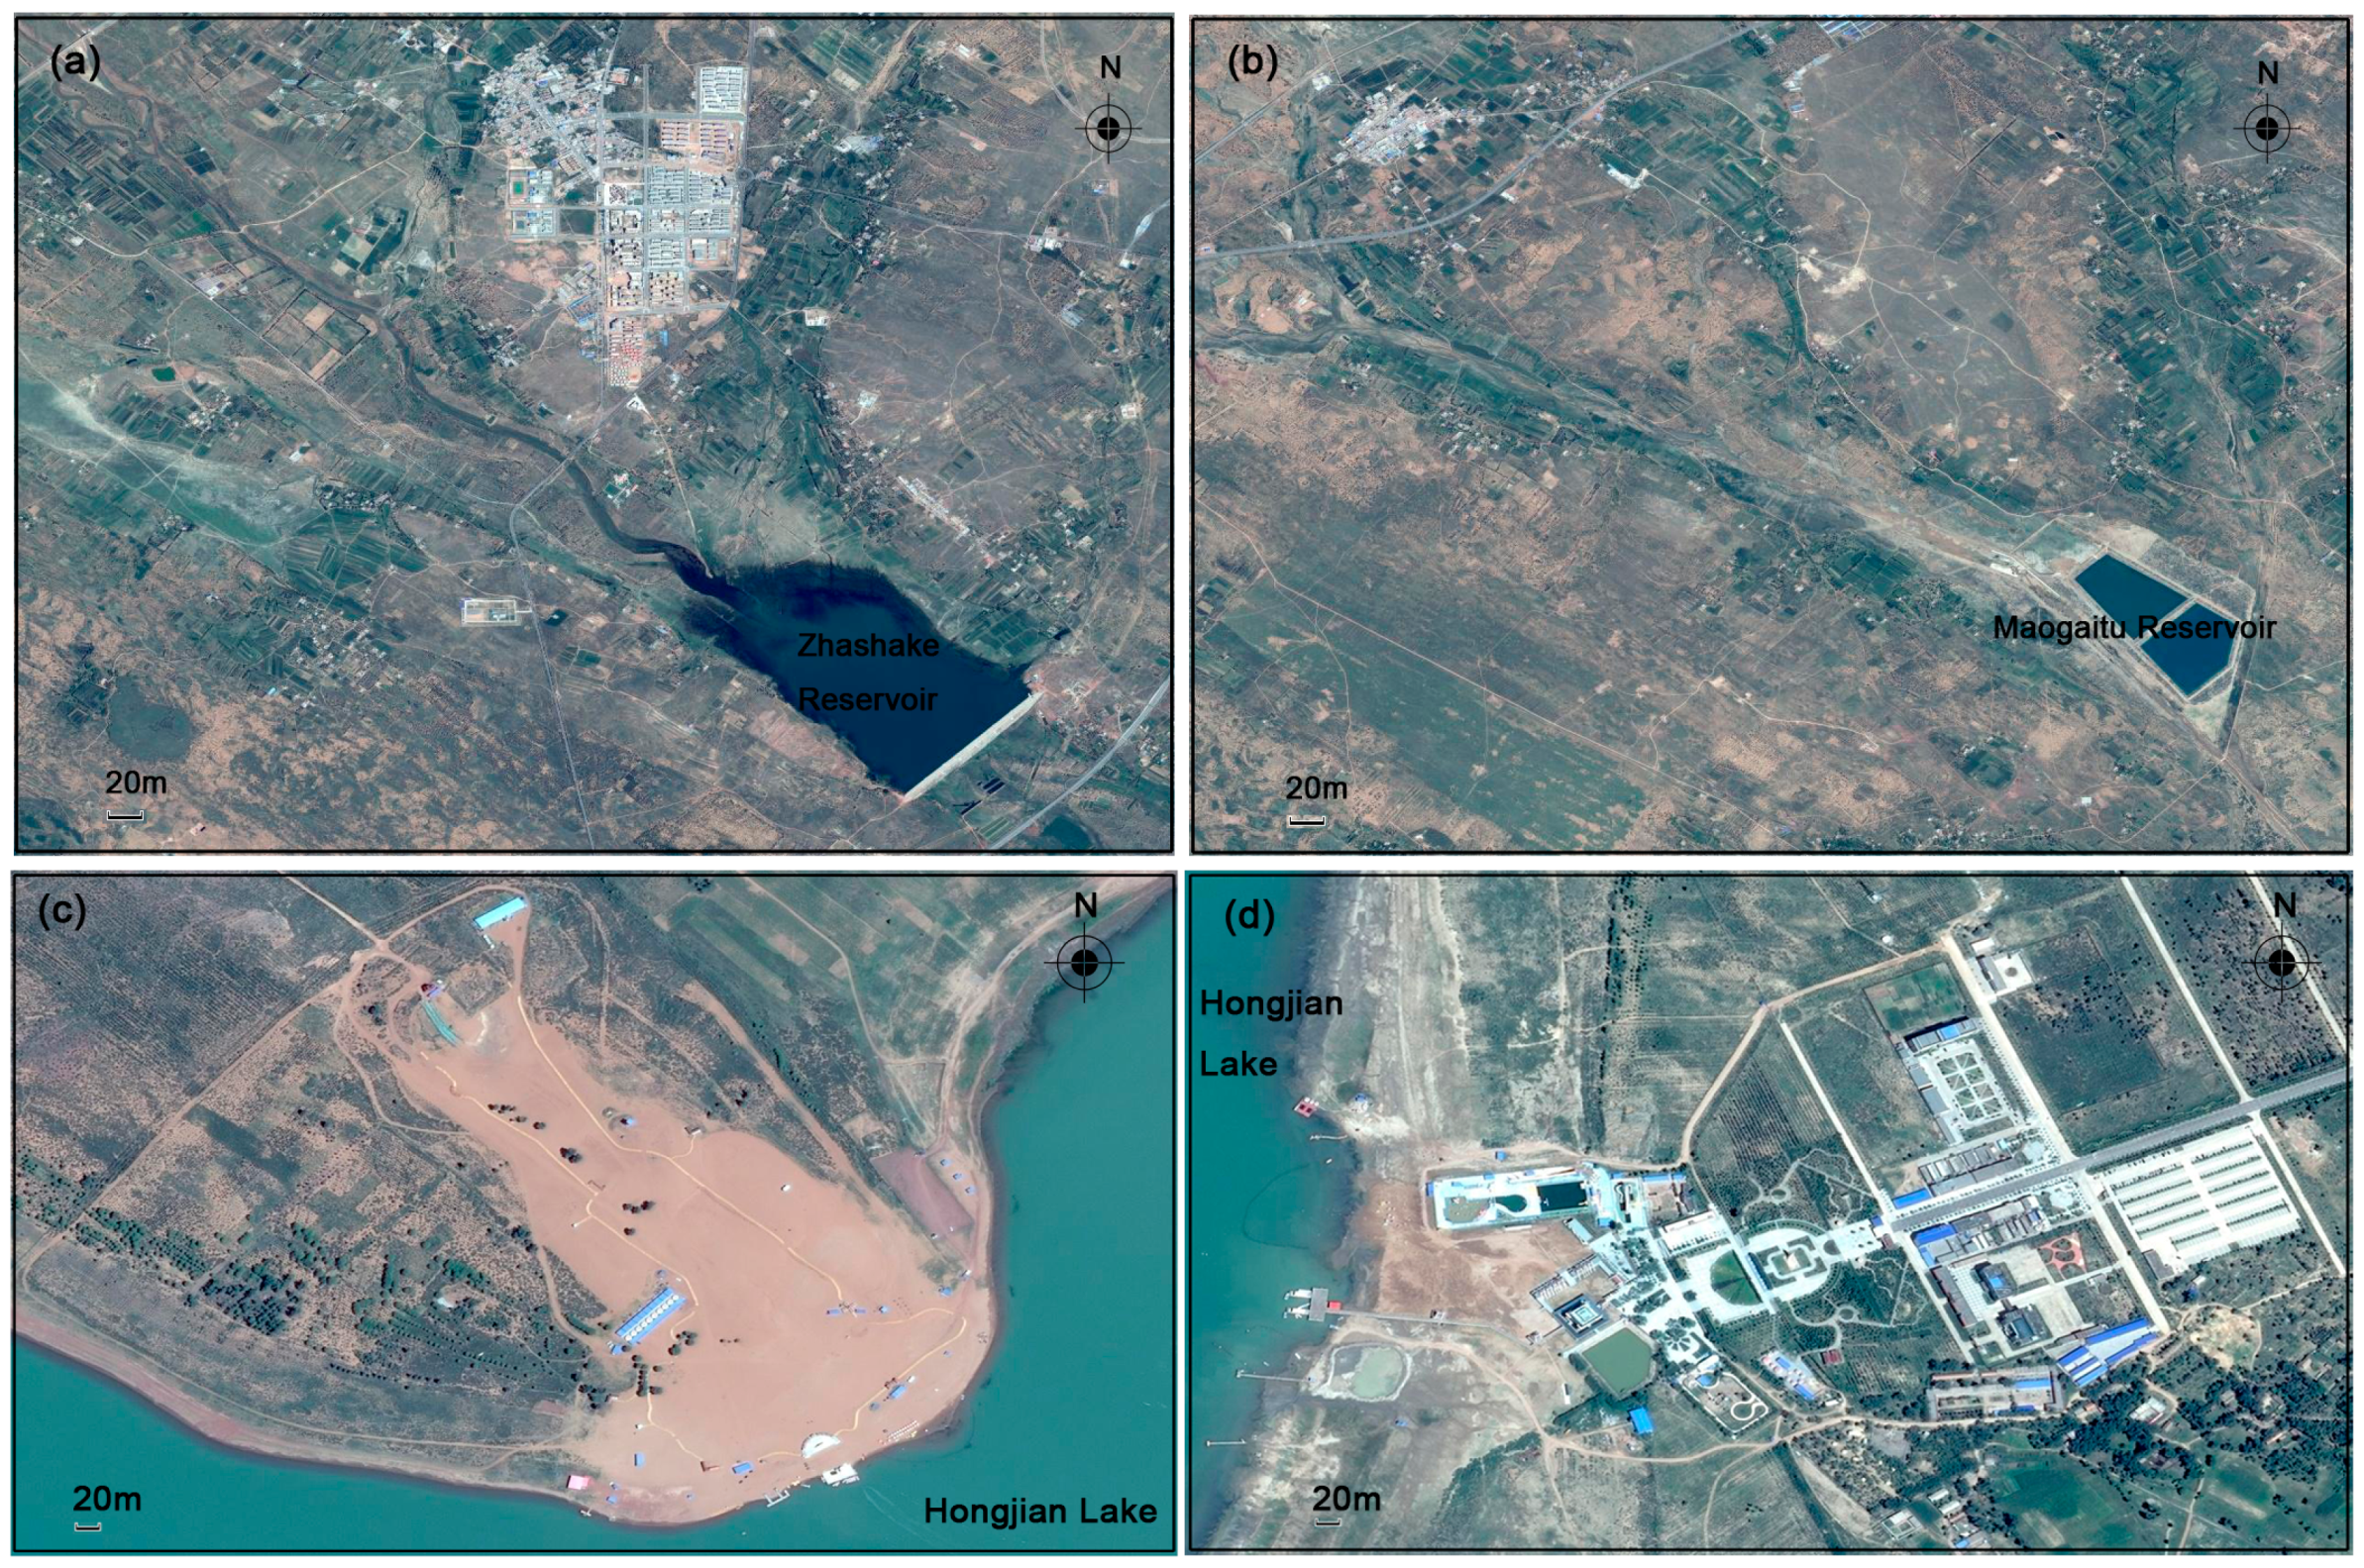
2.3.4. Estimation of Potential Evaporation in the HL Basin and Watershed Analysis of Reservoirs
2.3.5. Statistical Methods for Trend Analysis and Correlation Analysis
3. Results
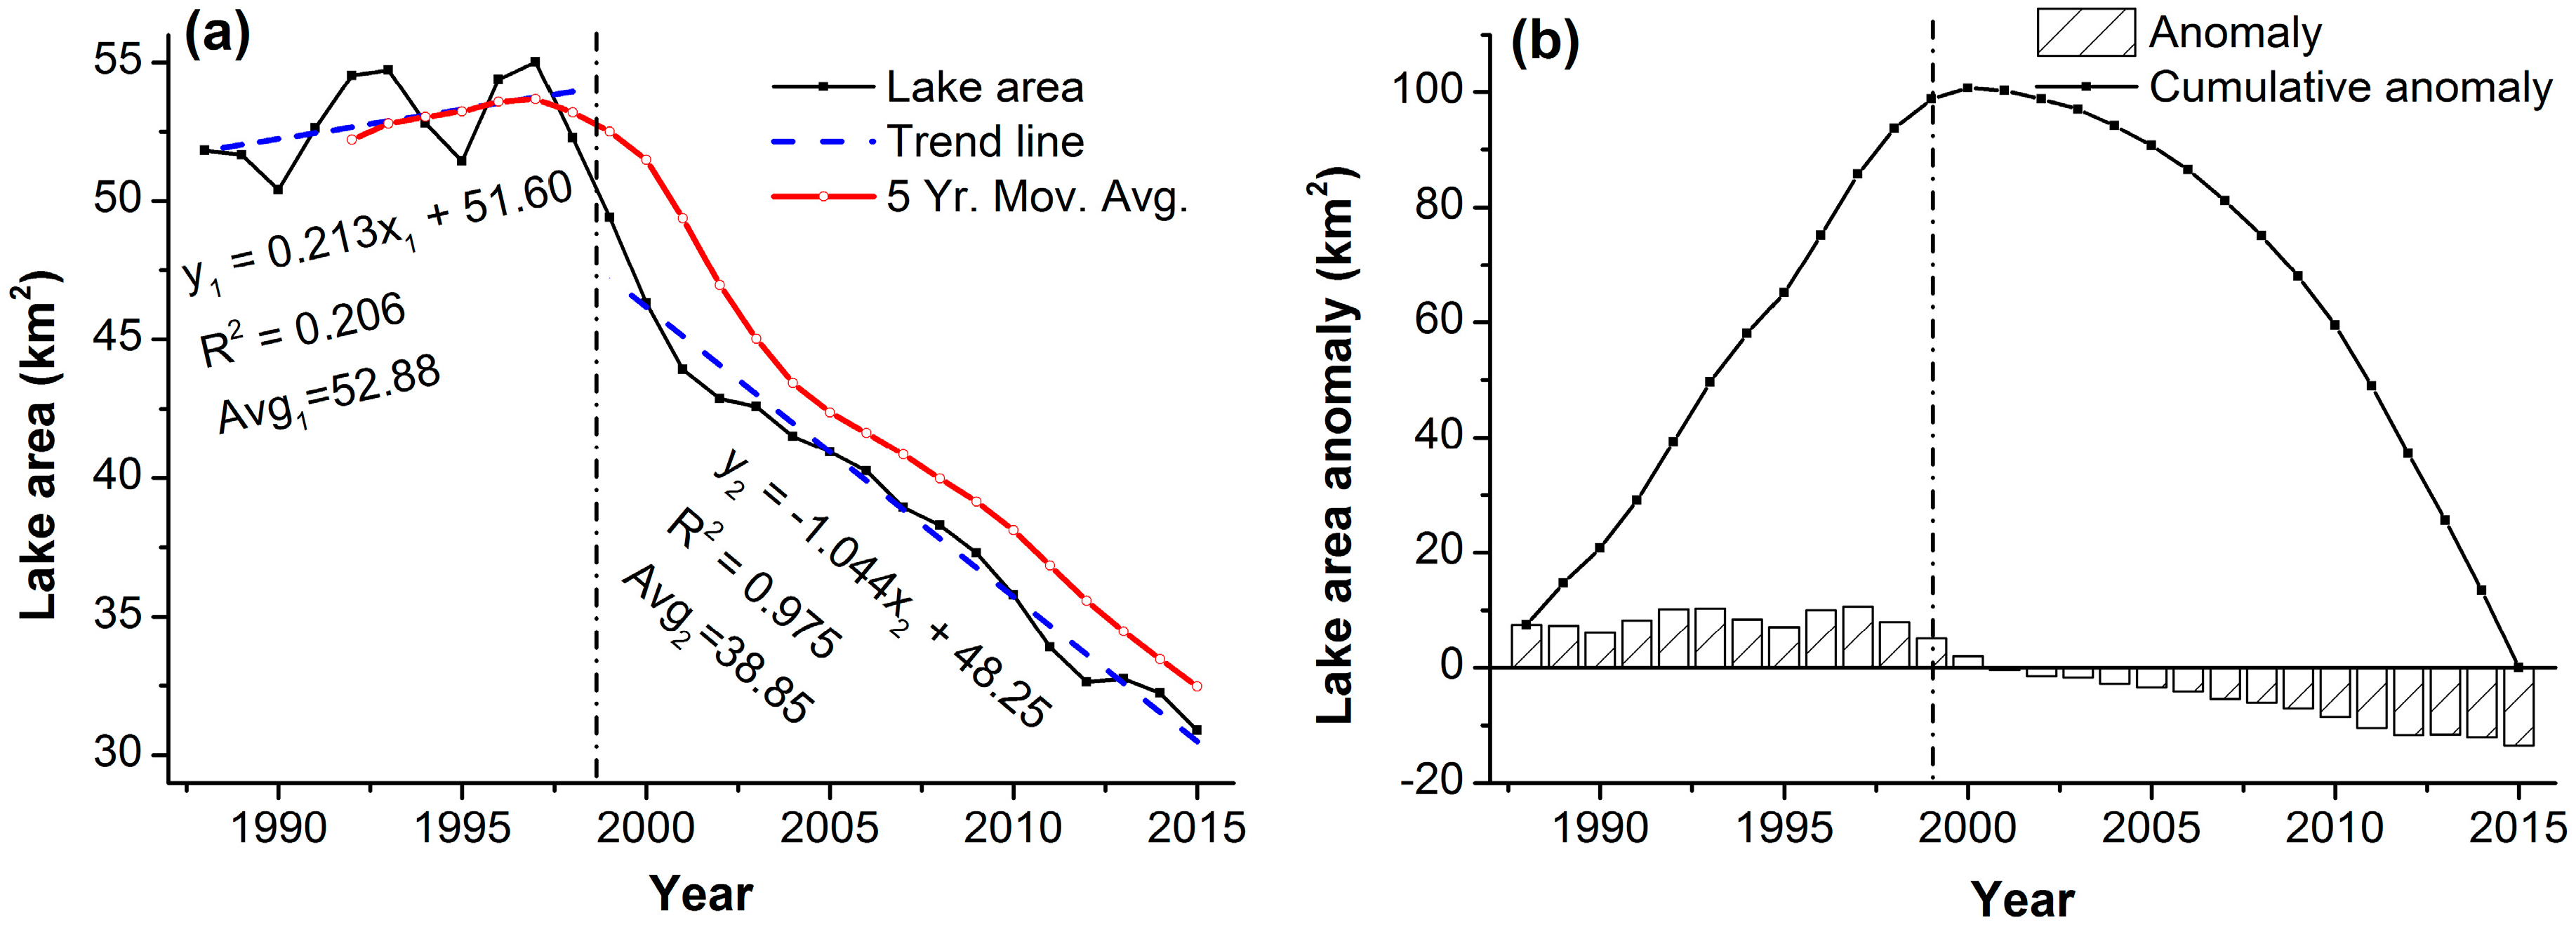
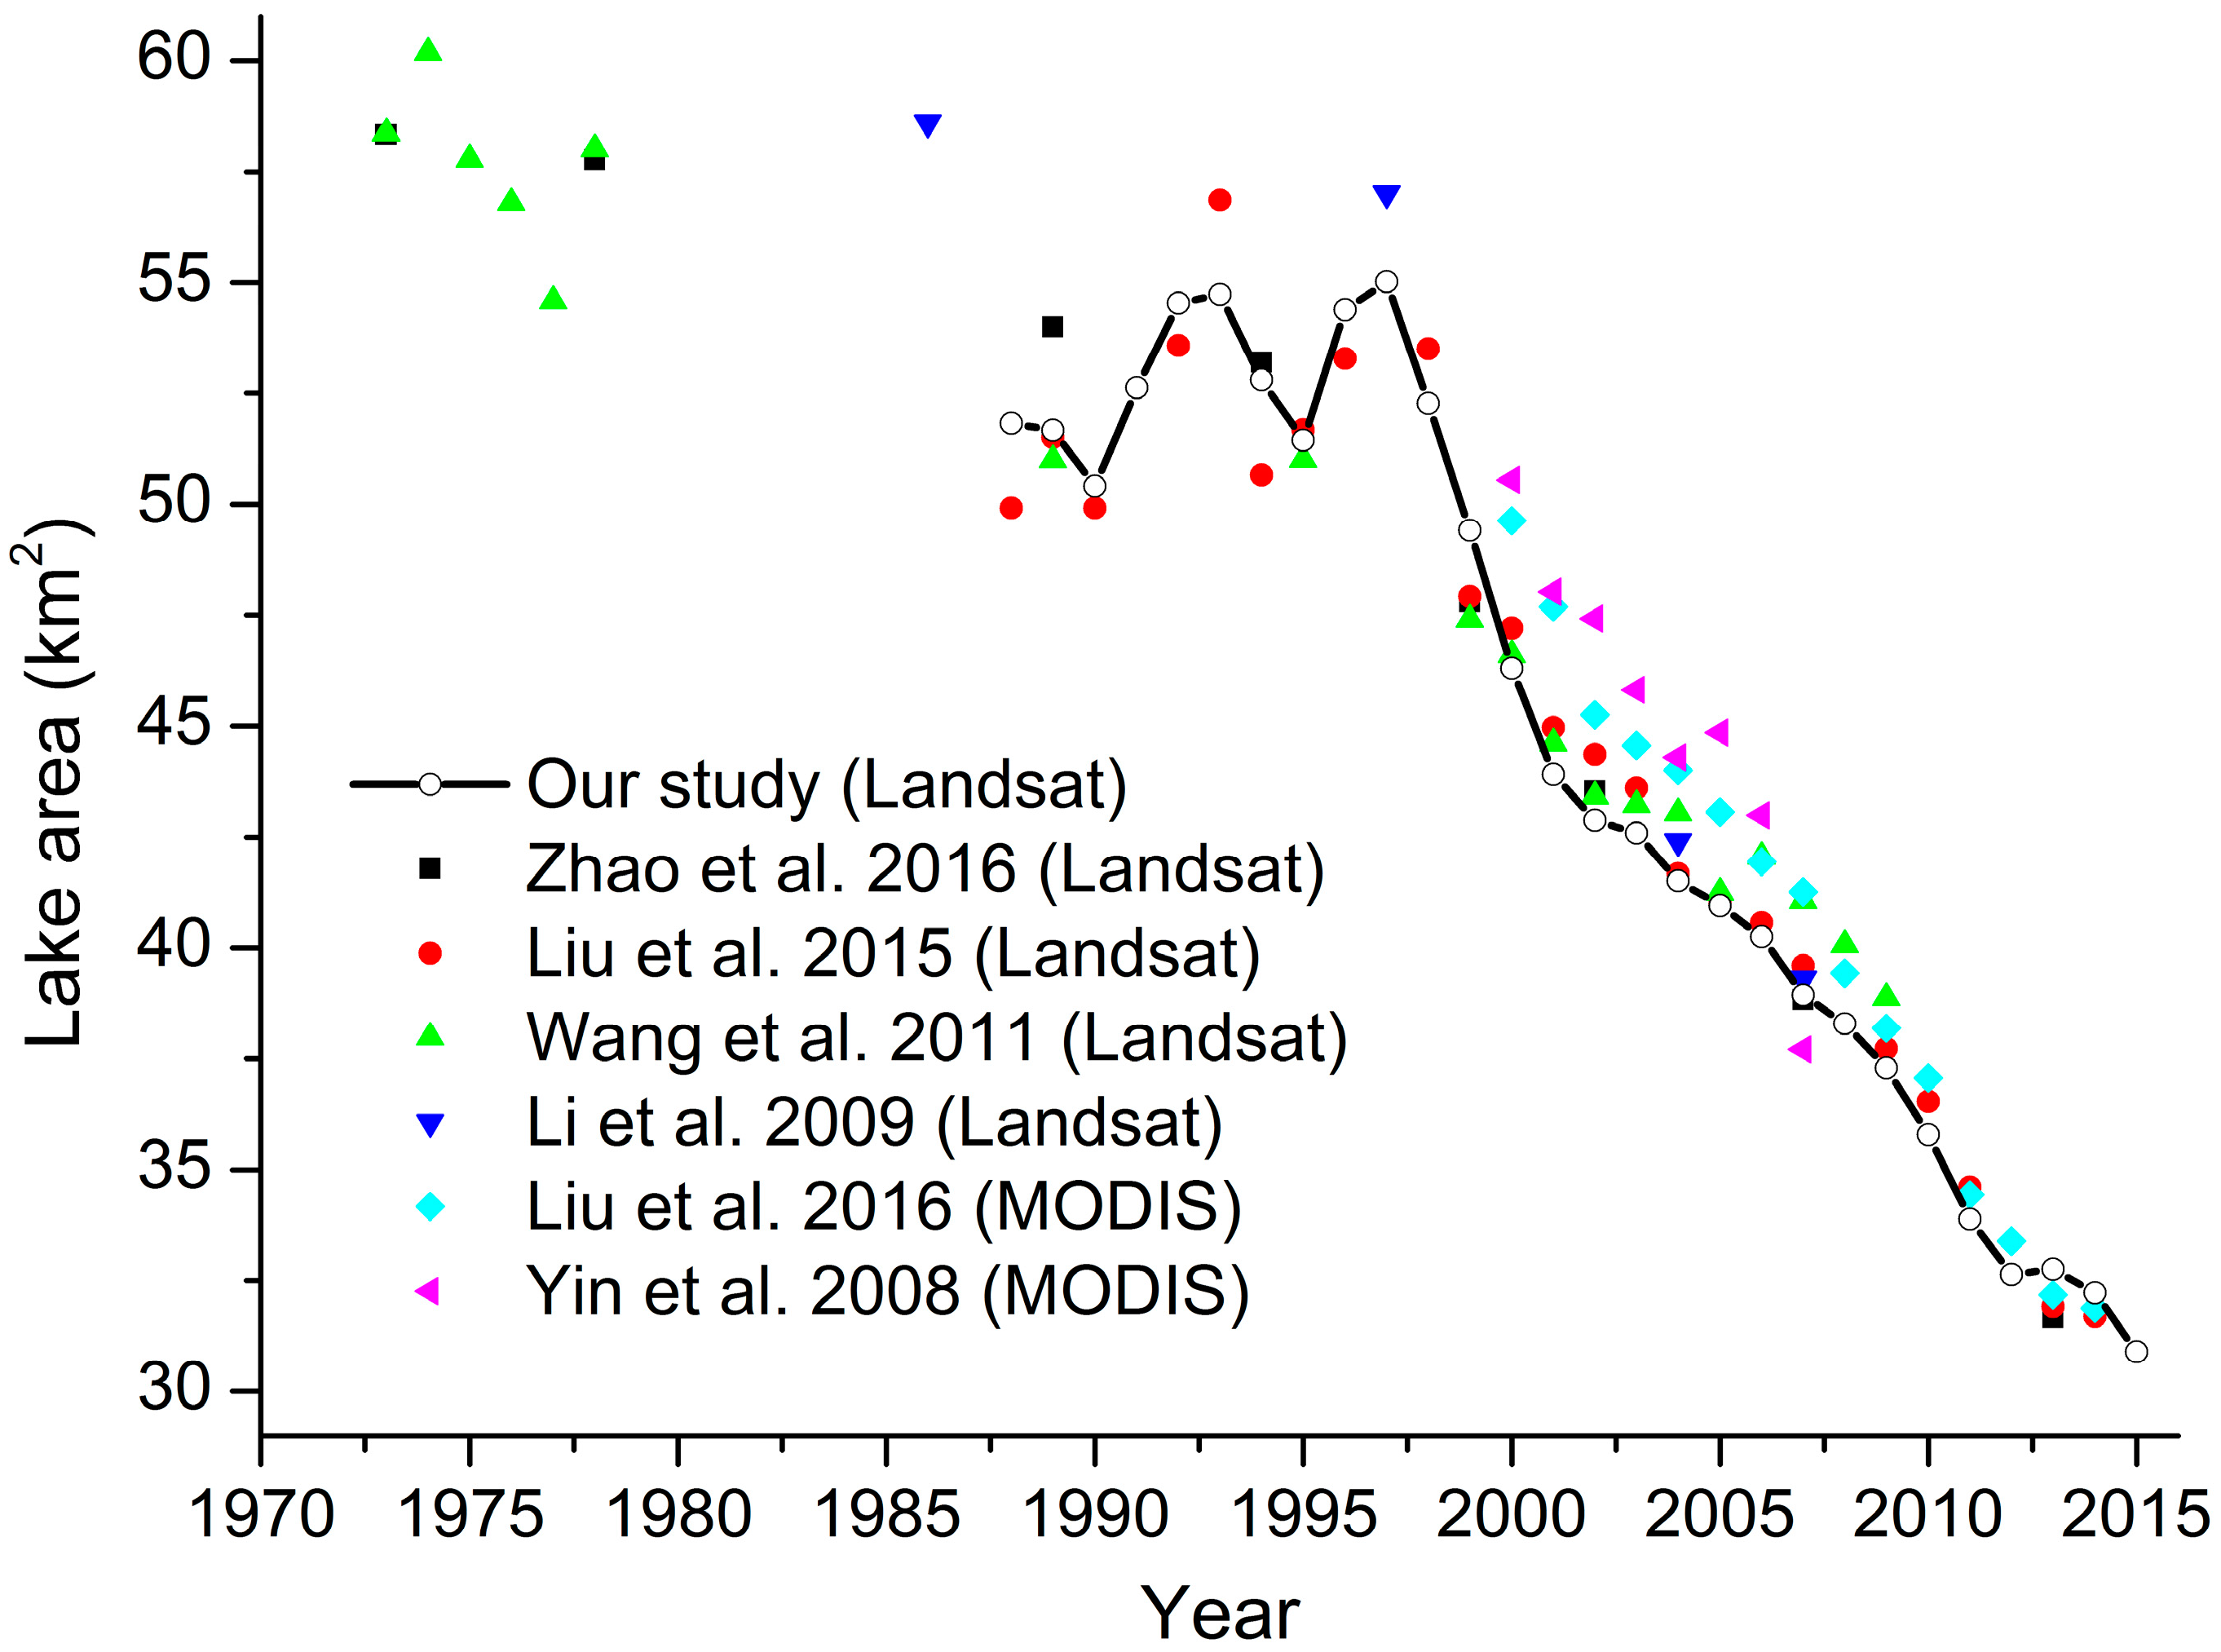
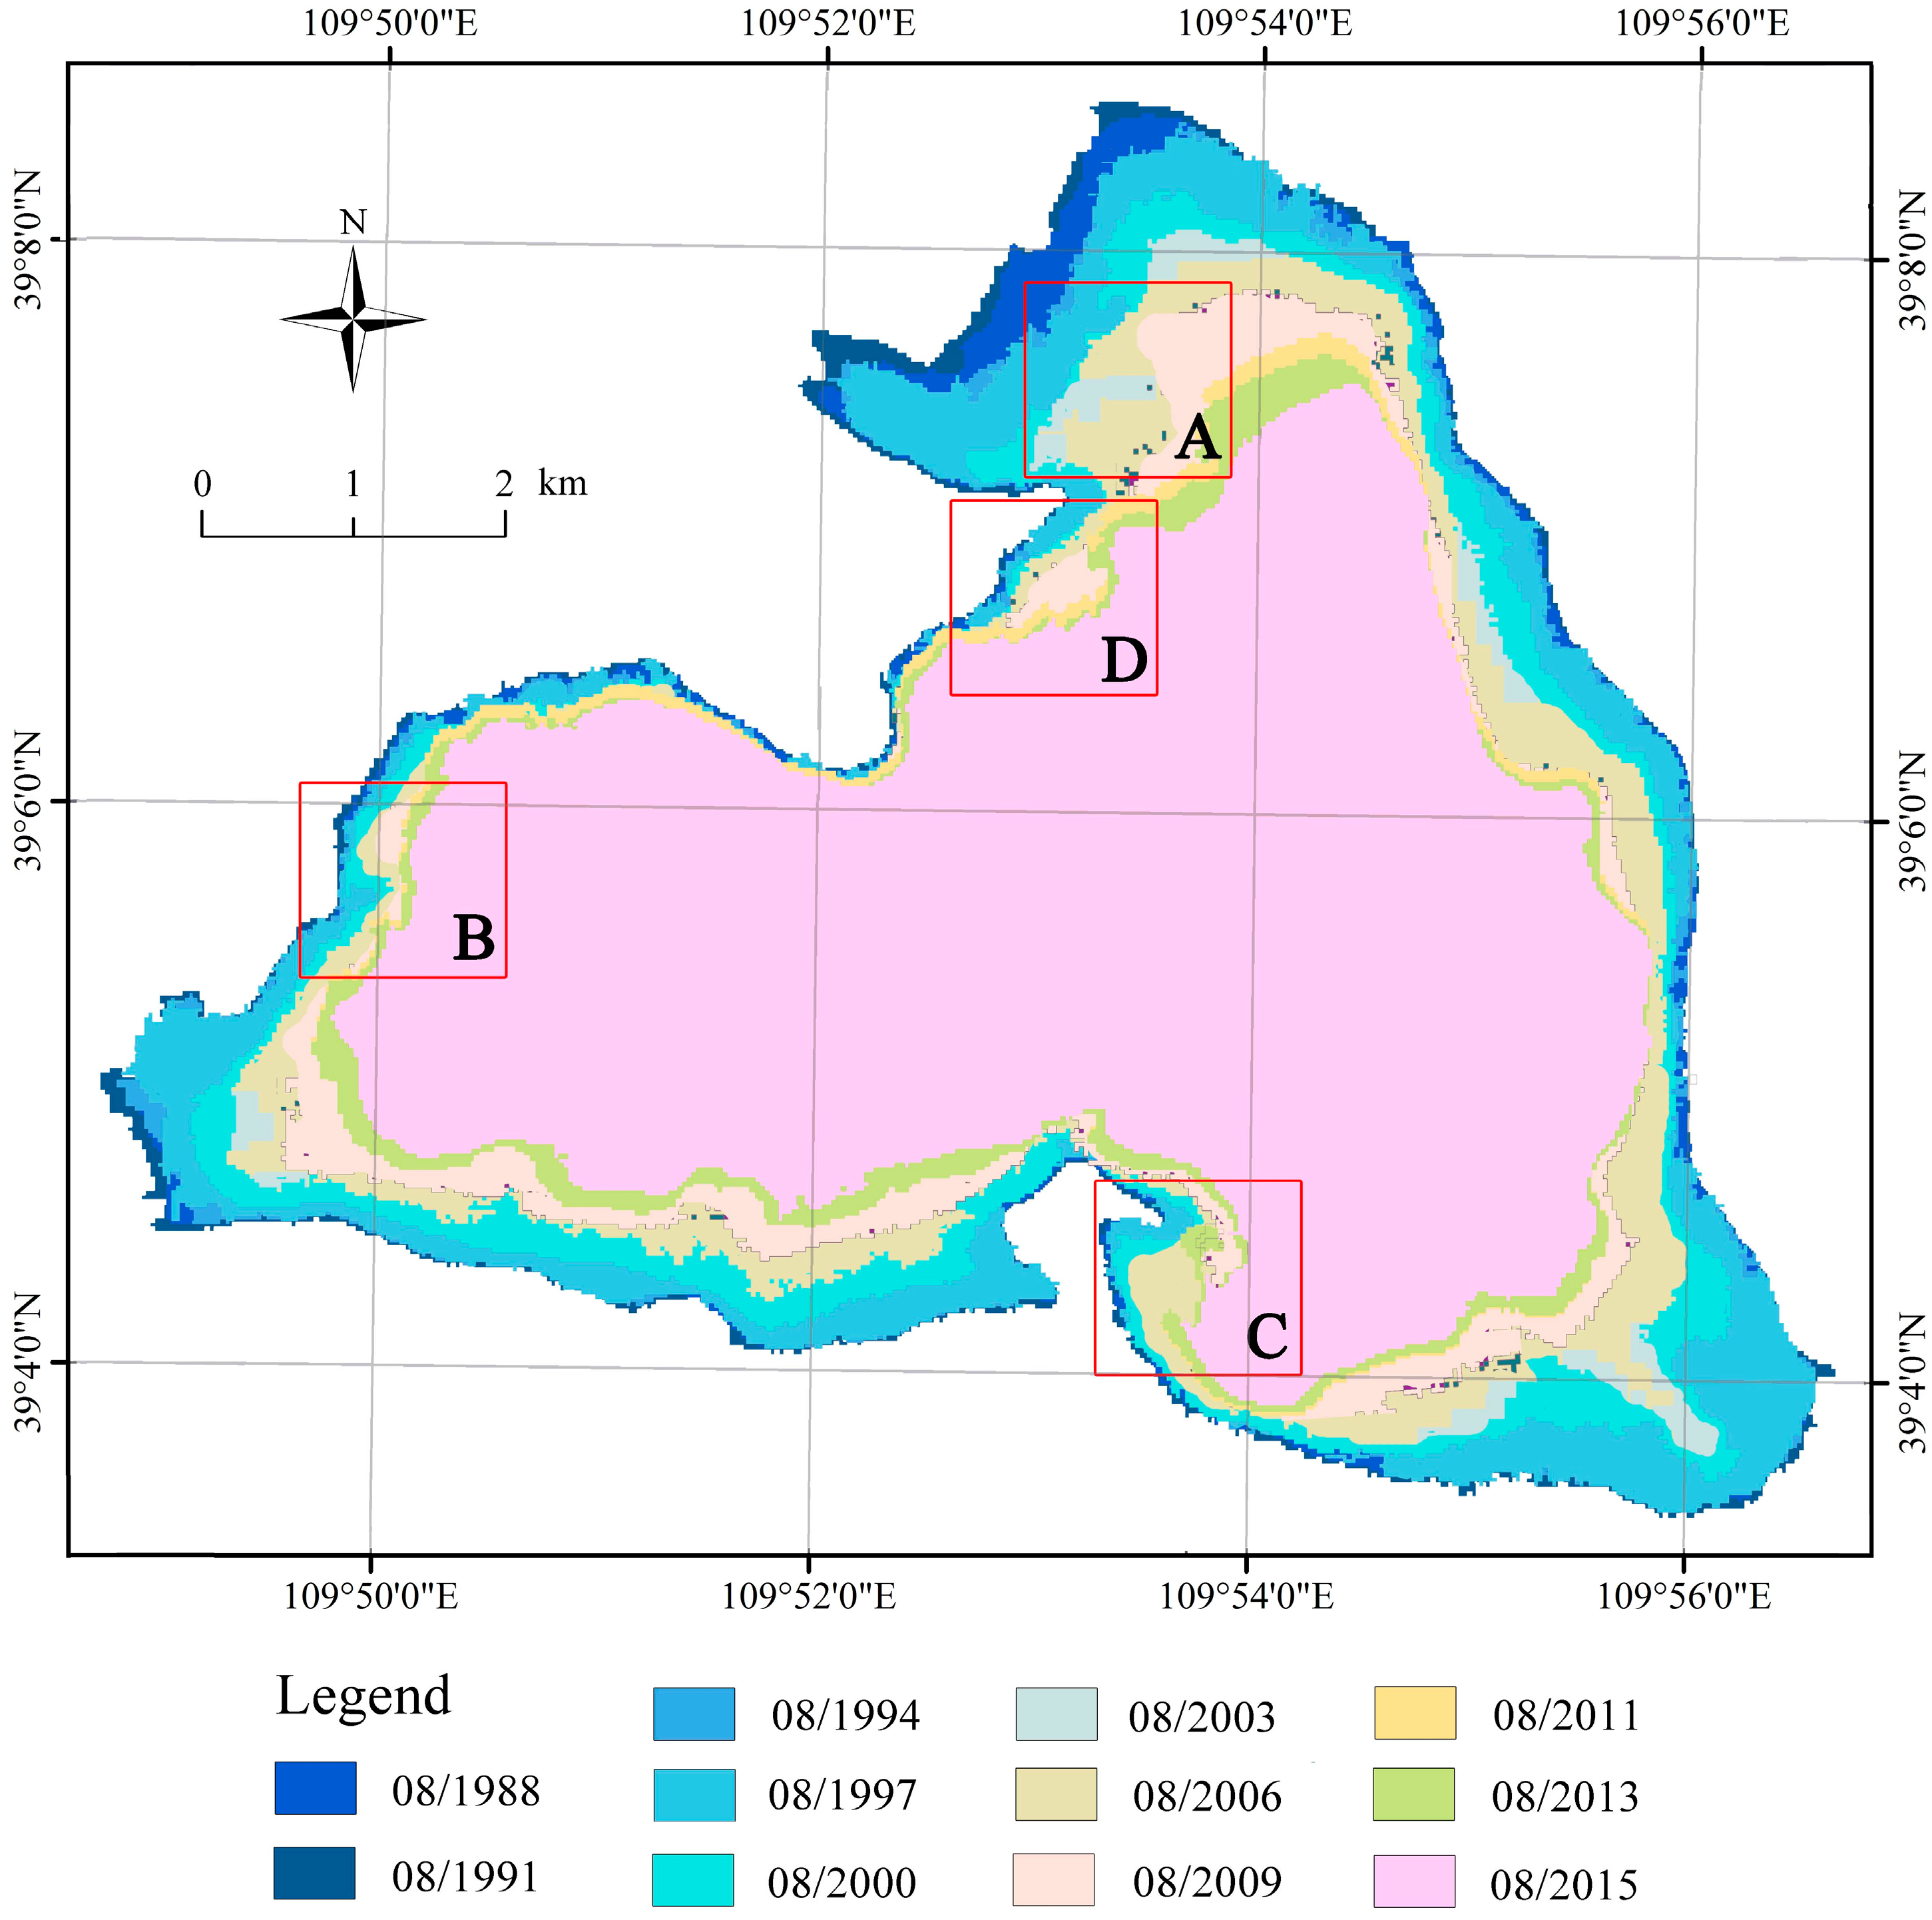
3.1. Changes in the Area of Hongjian Lake
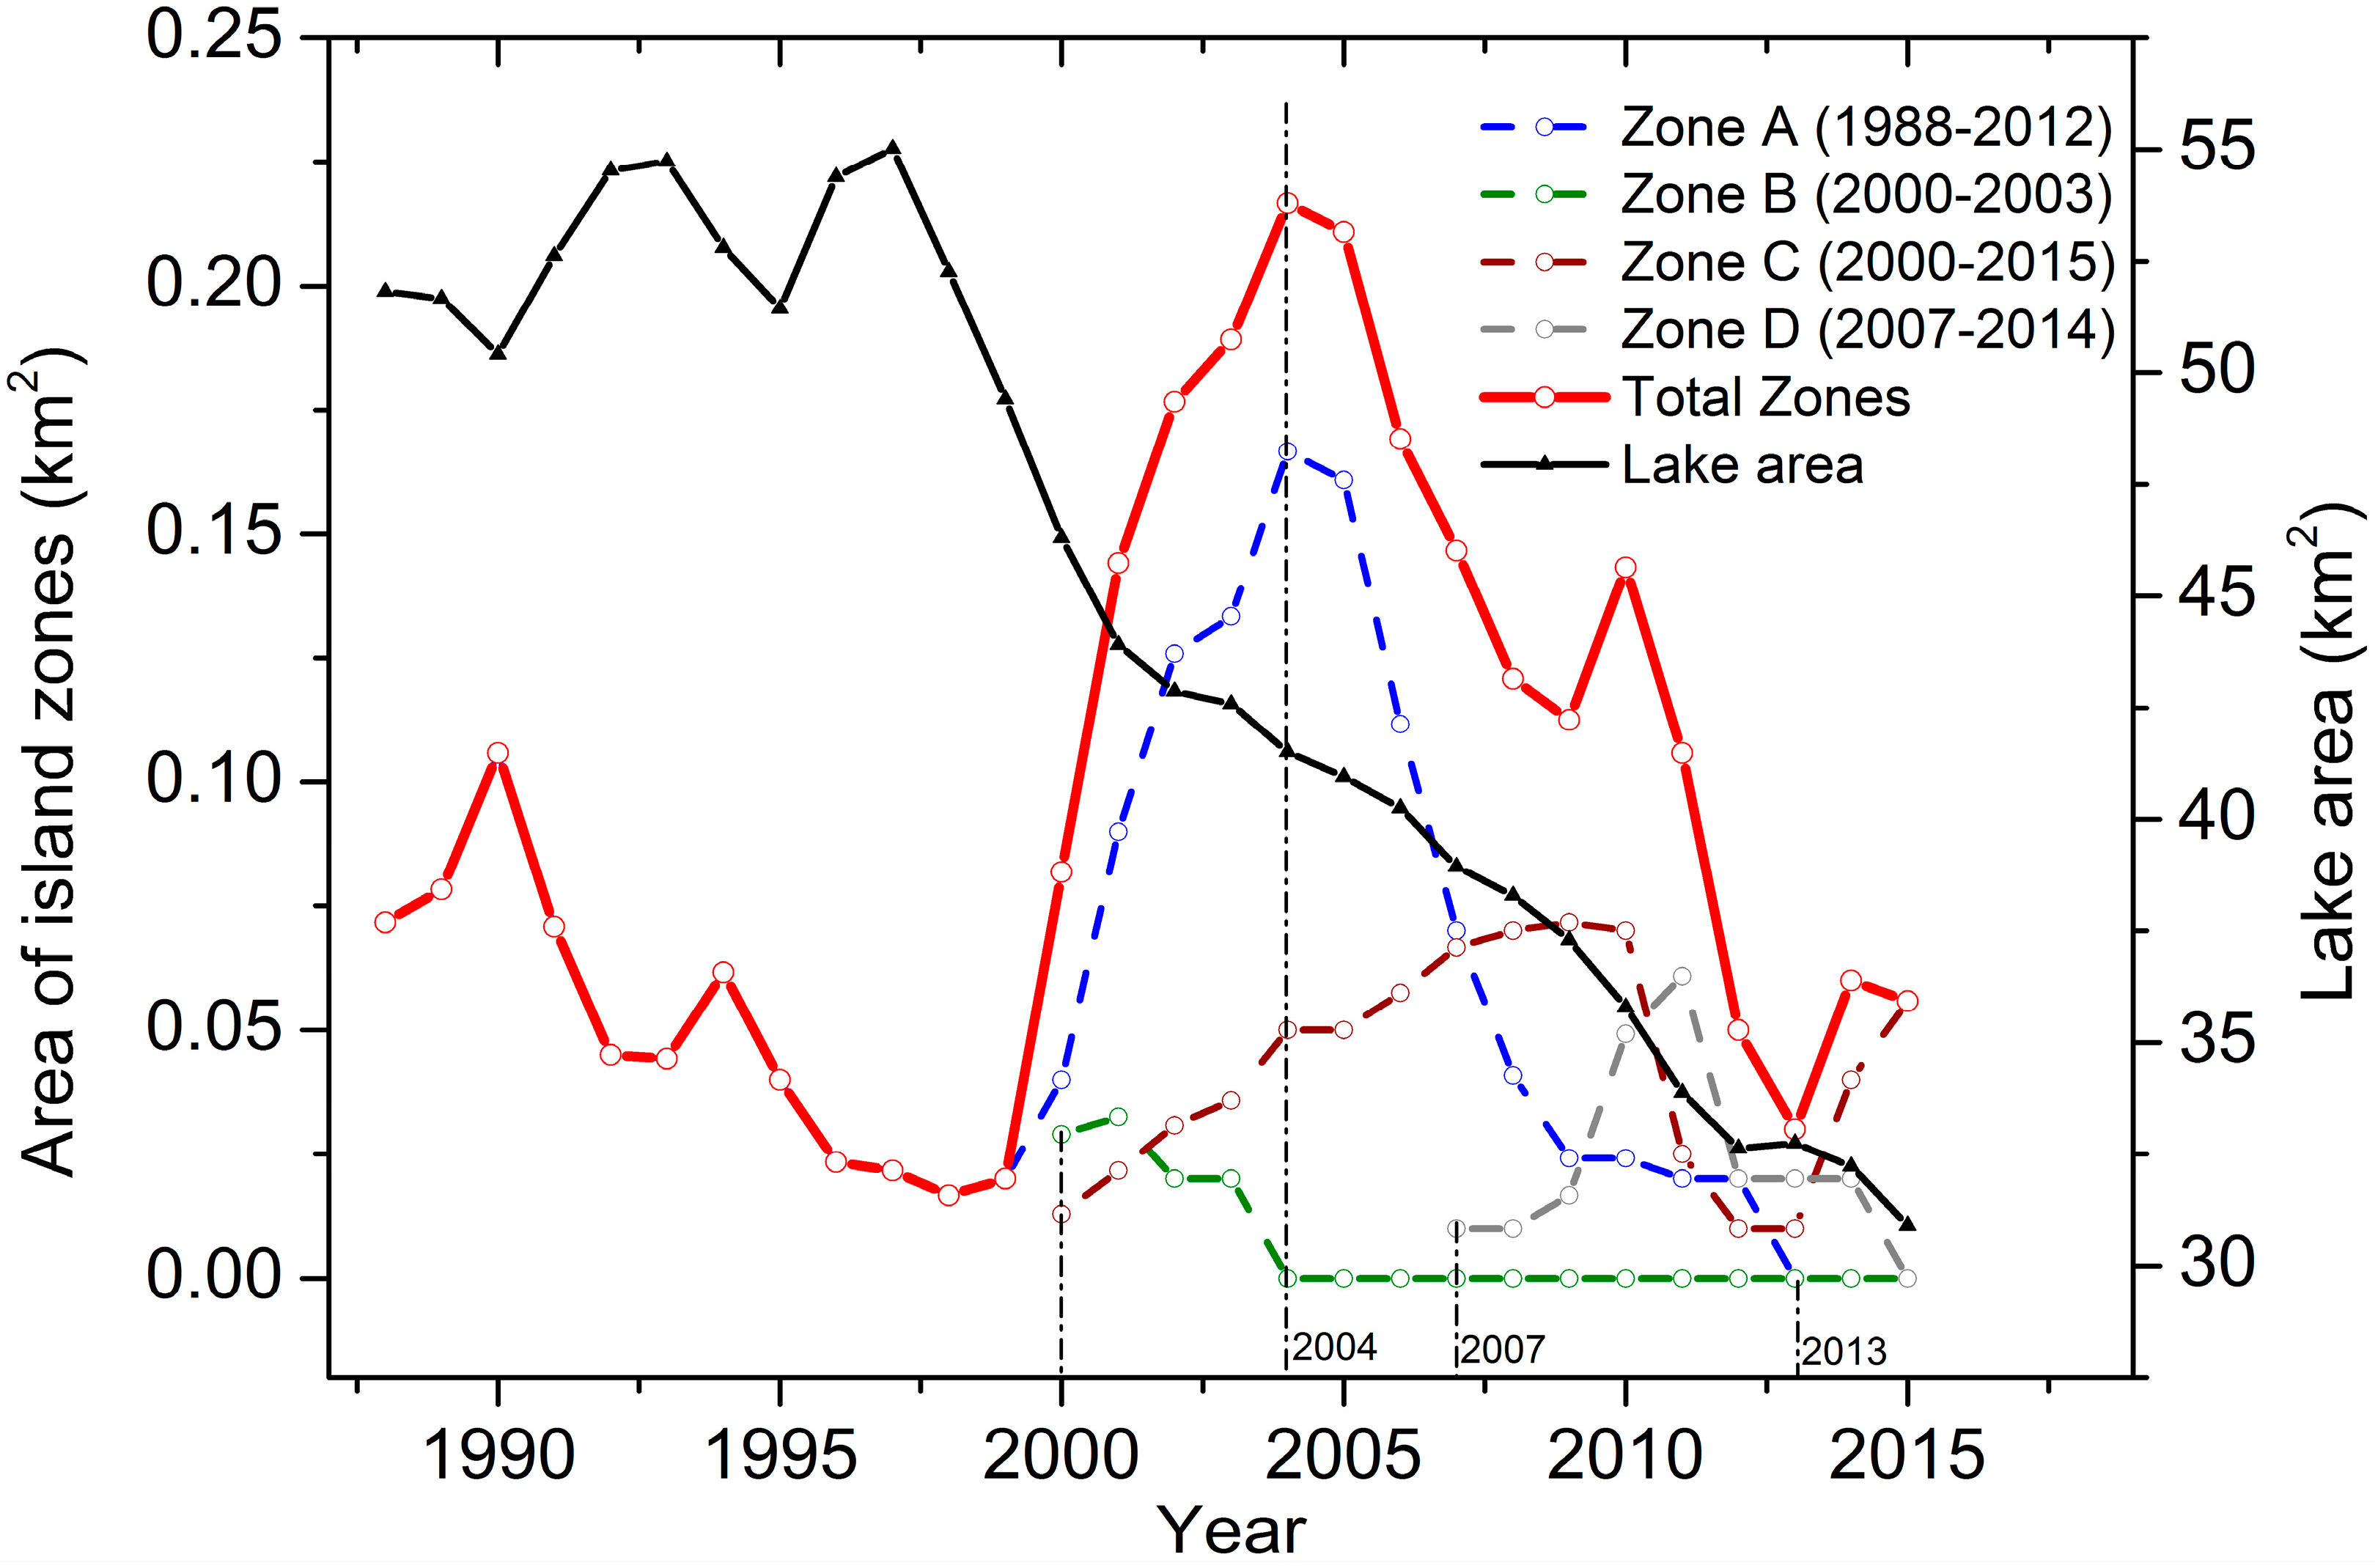
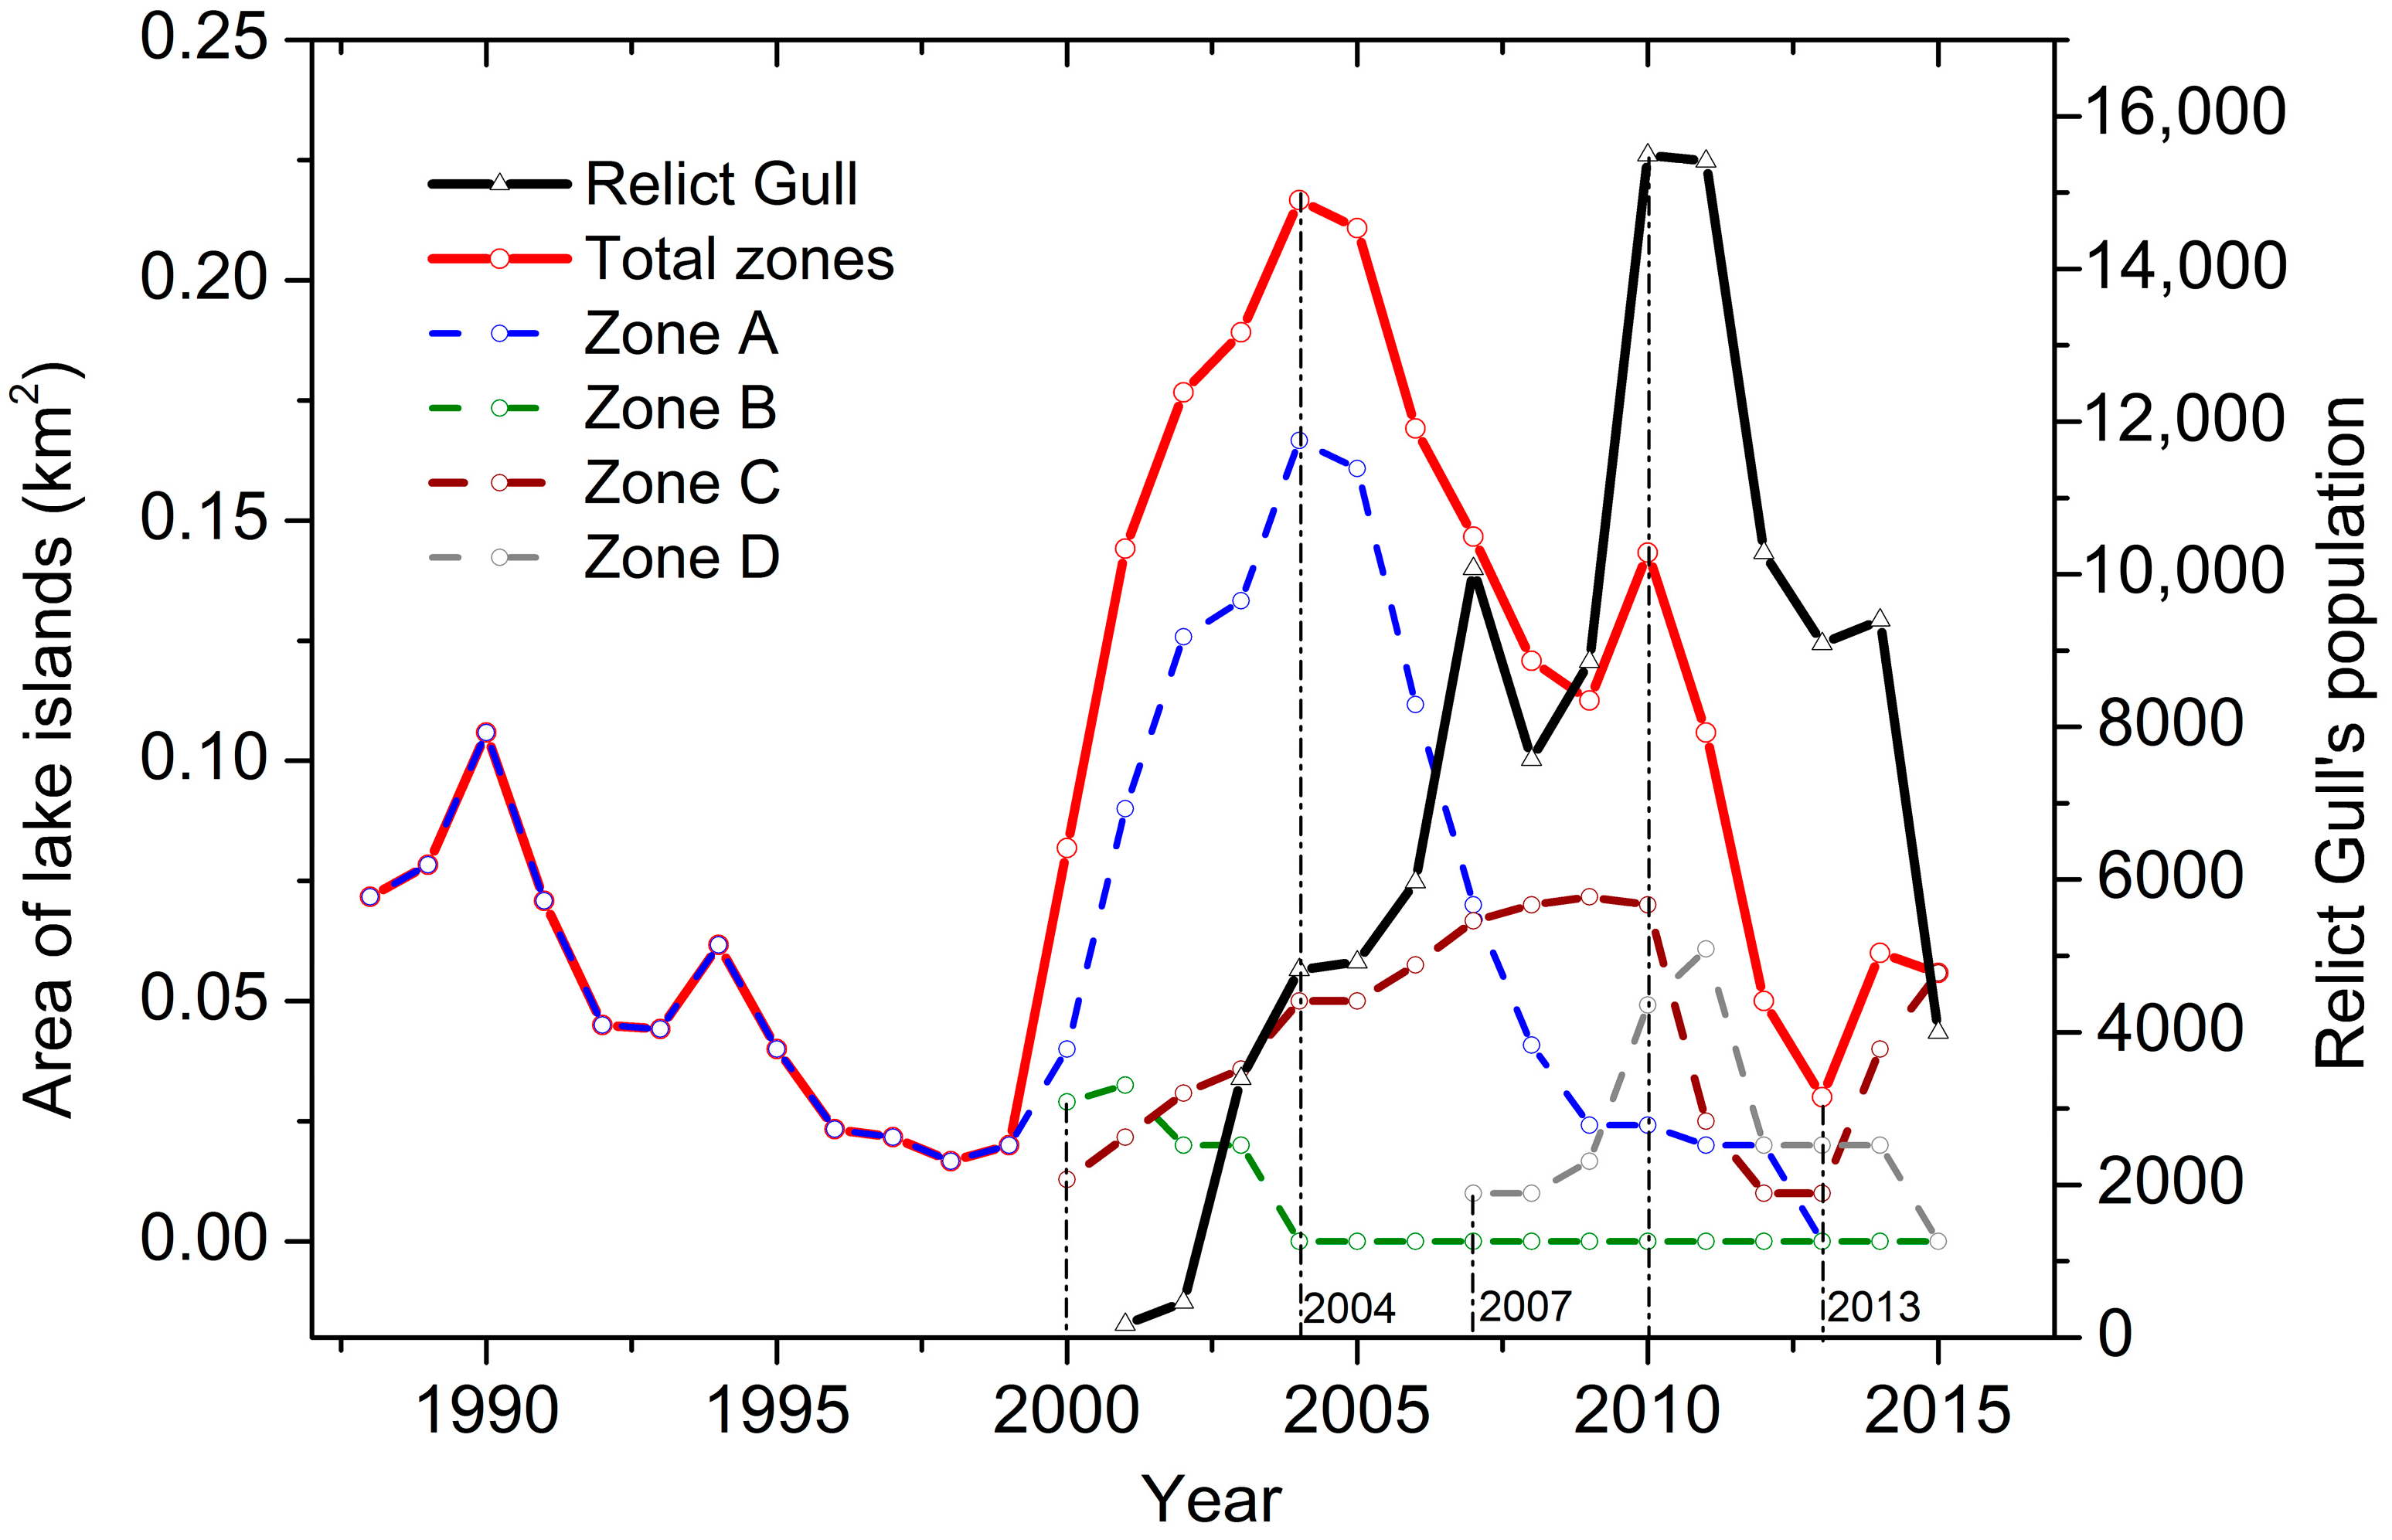
3.2. Changes of Relict Gull Habitat in Hongjian Lake
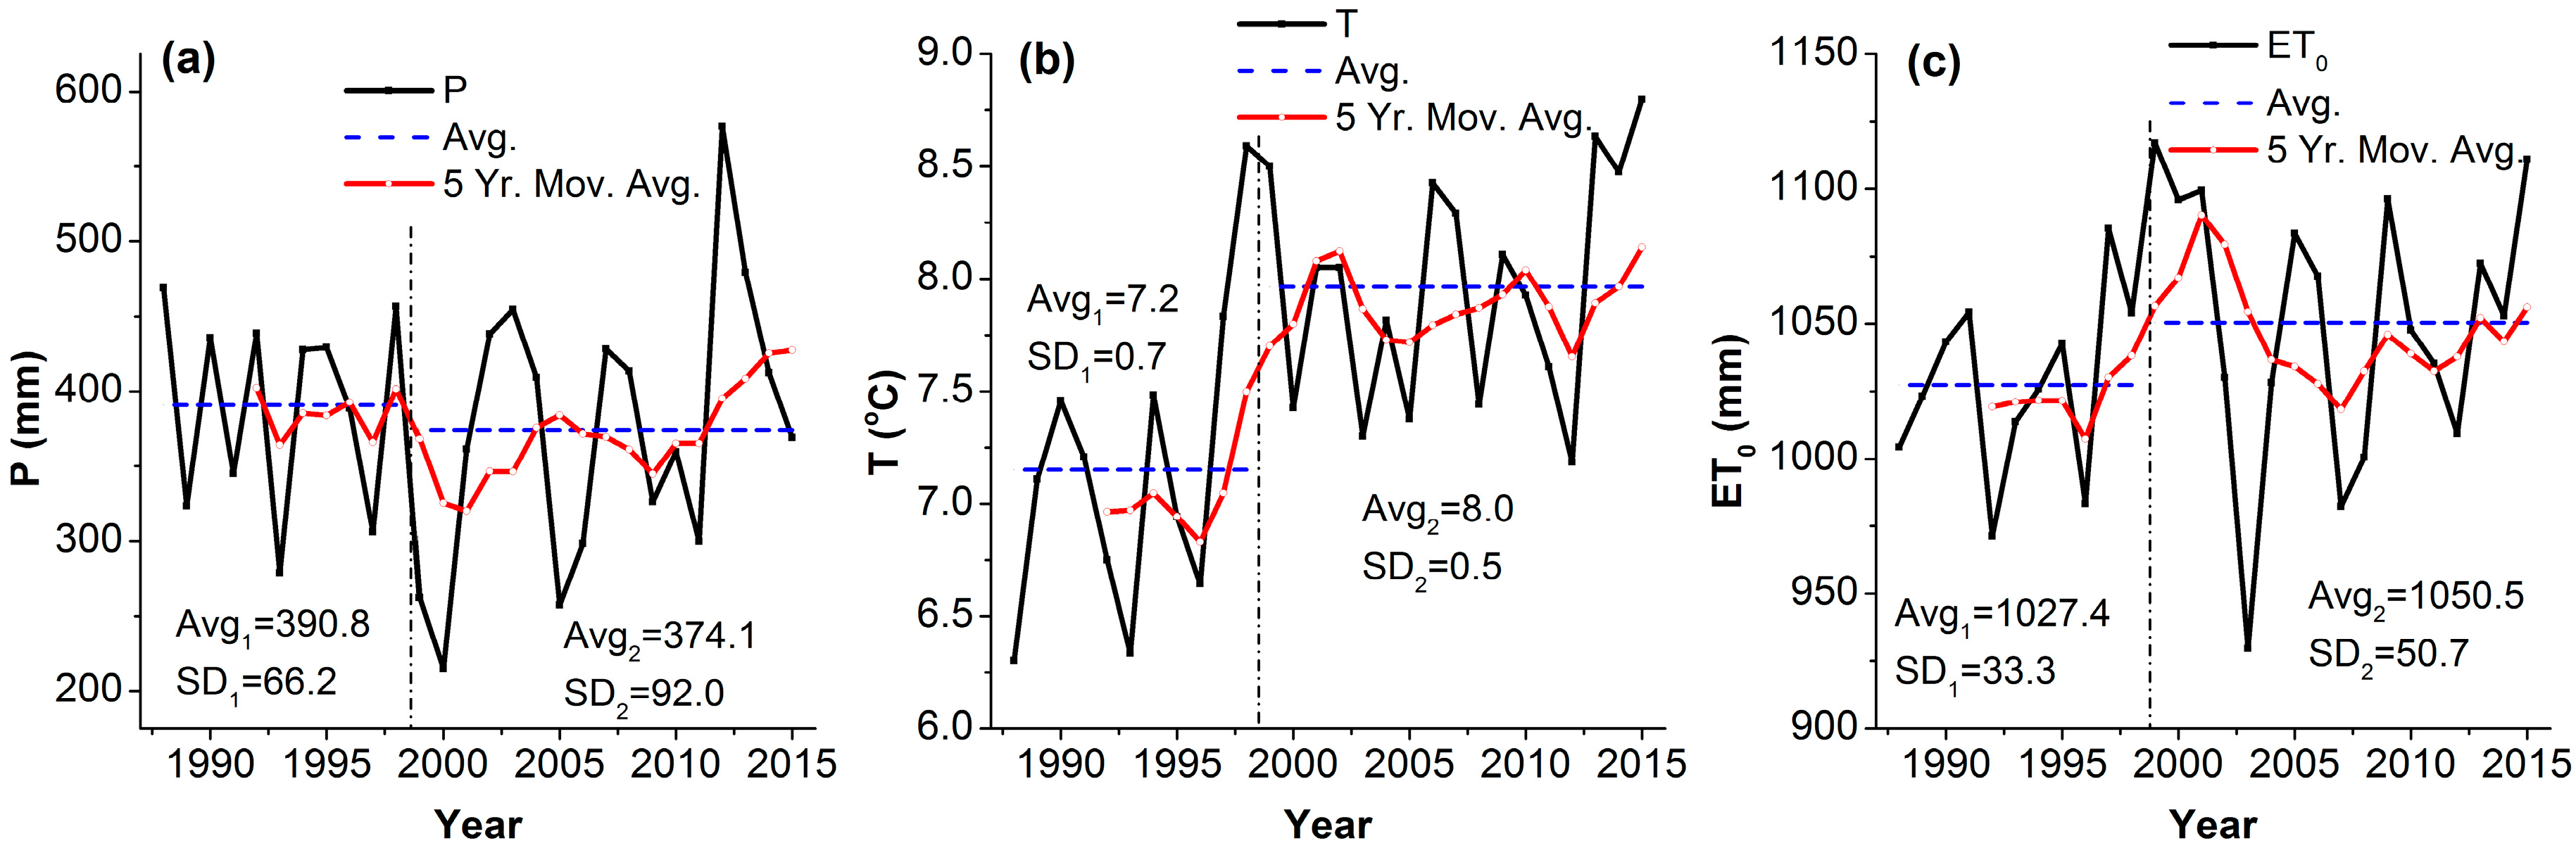
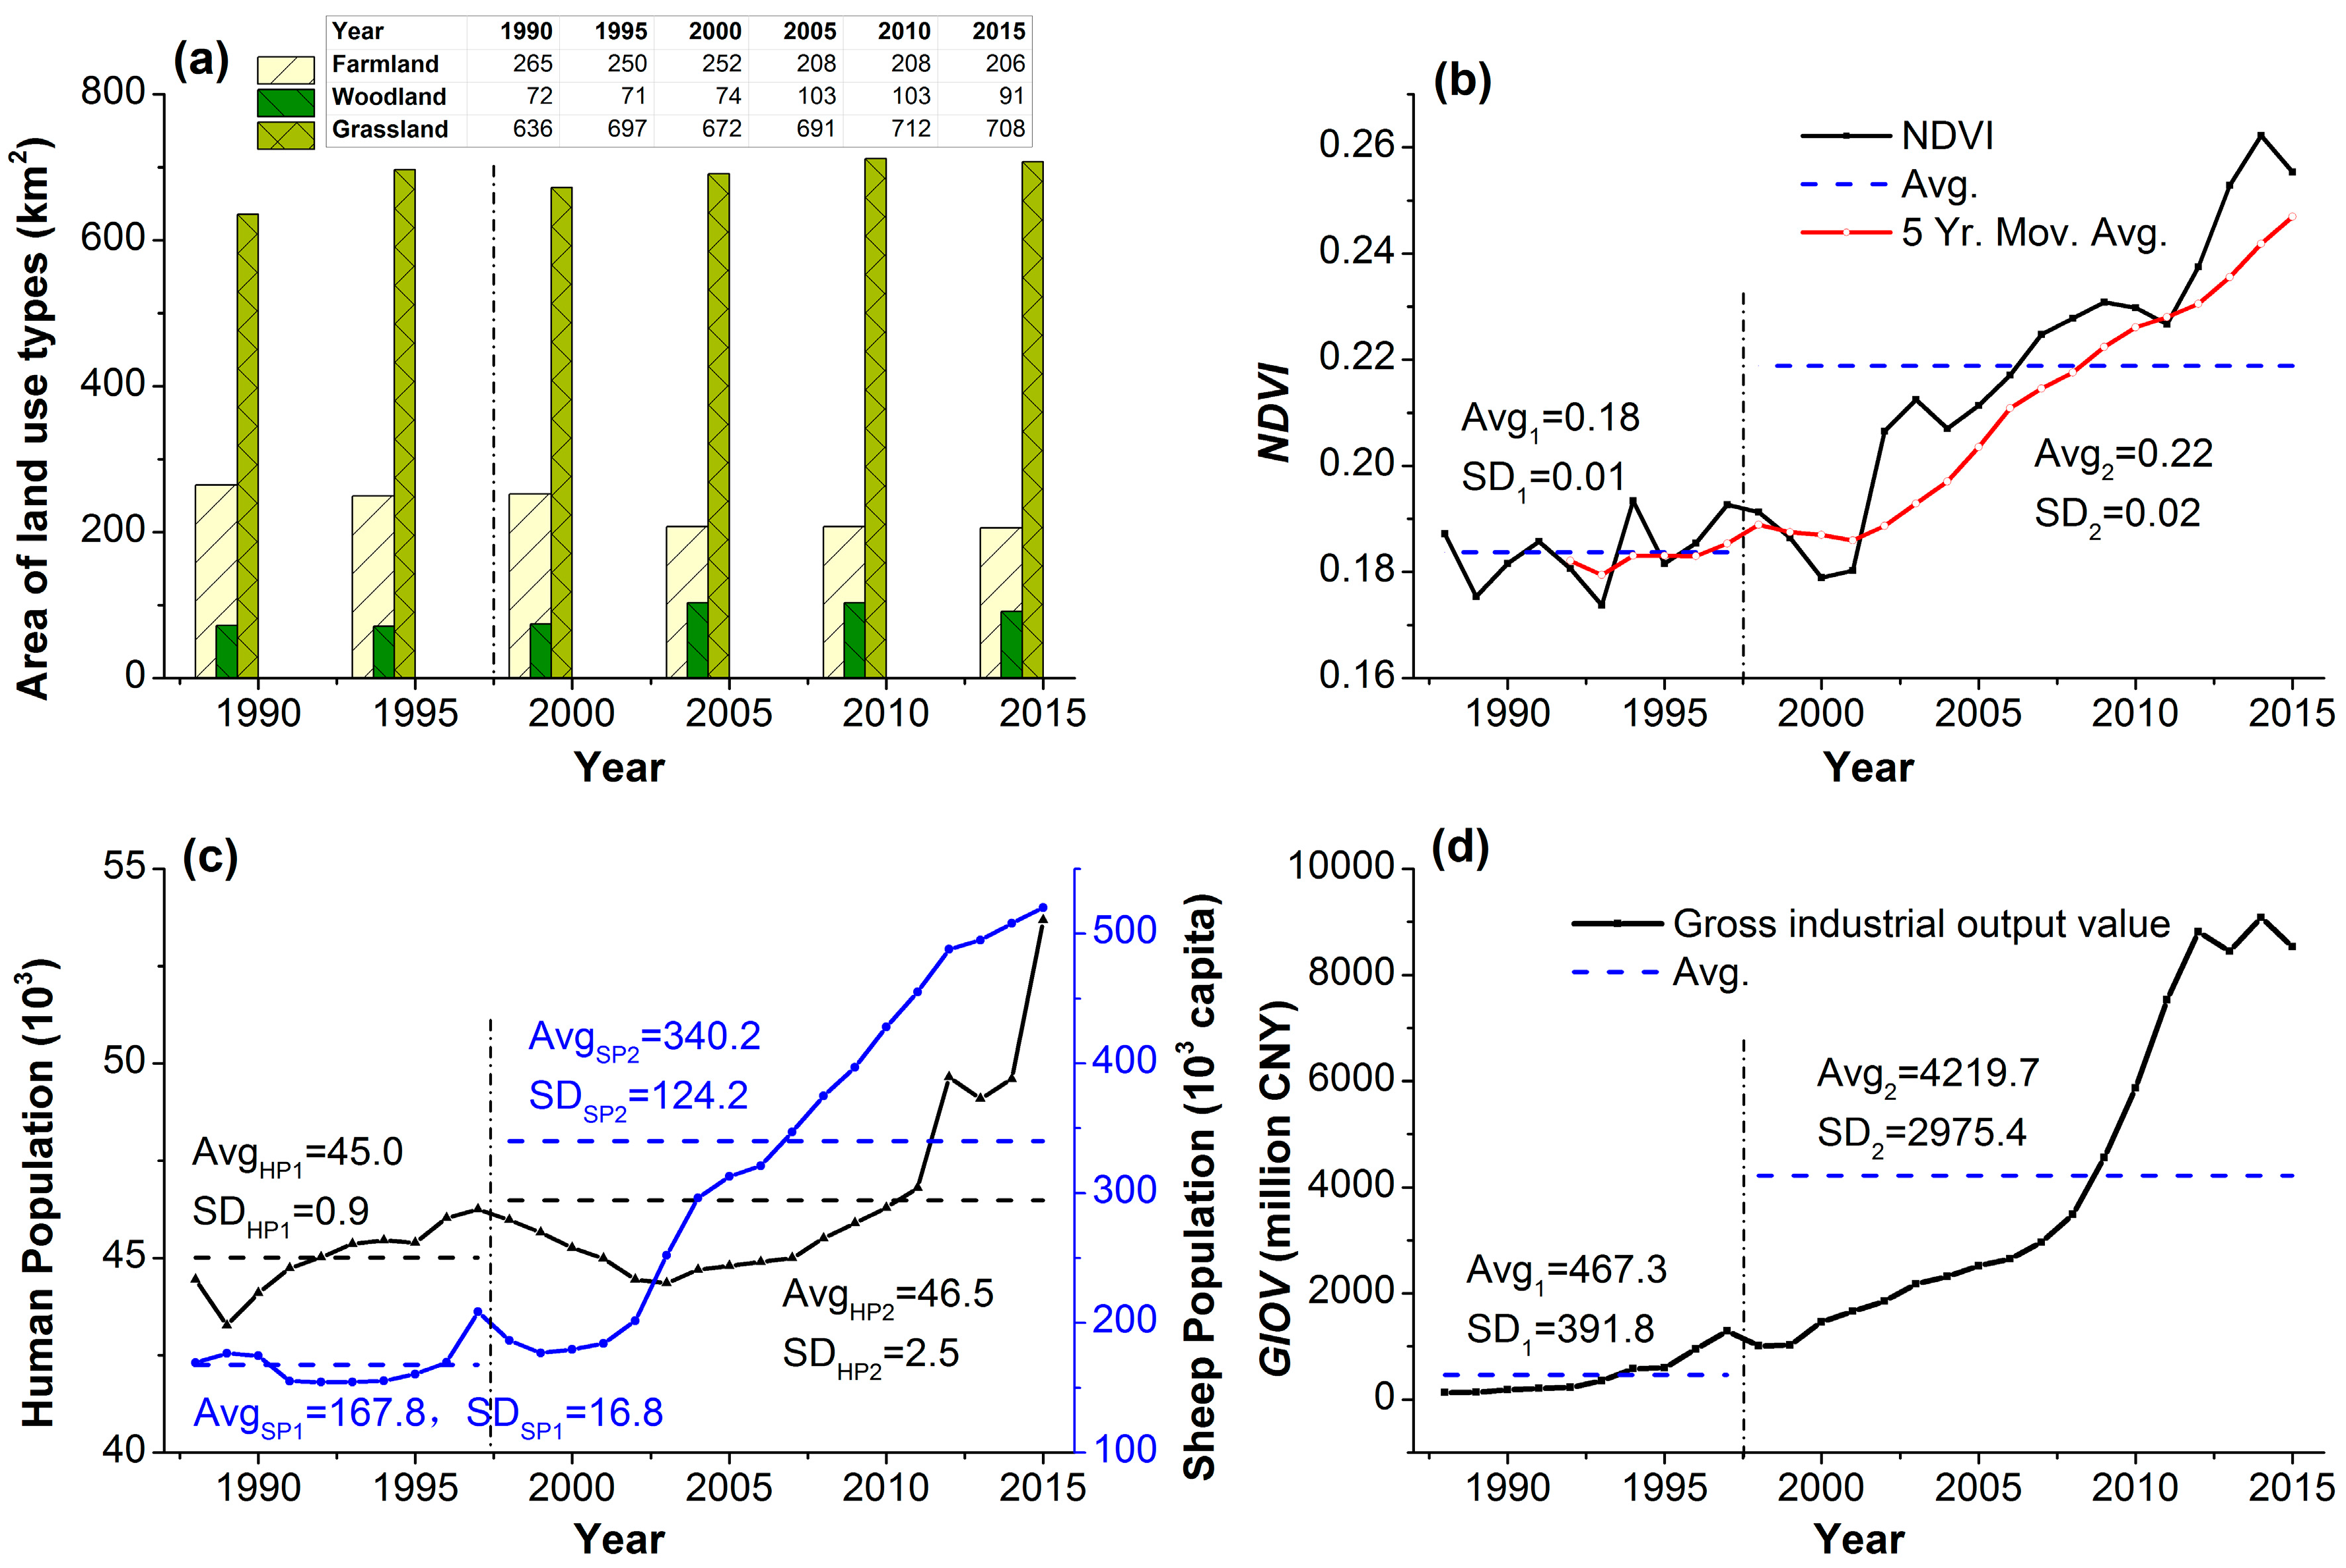
3.3. Changes in Climatic Factors and Human Factors
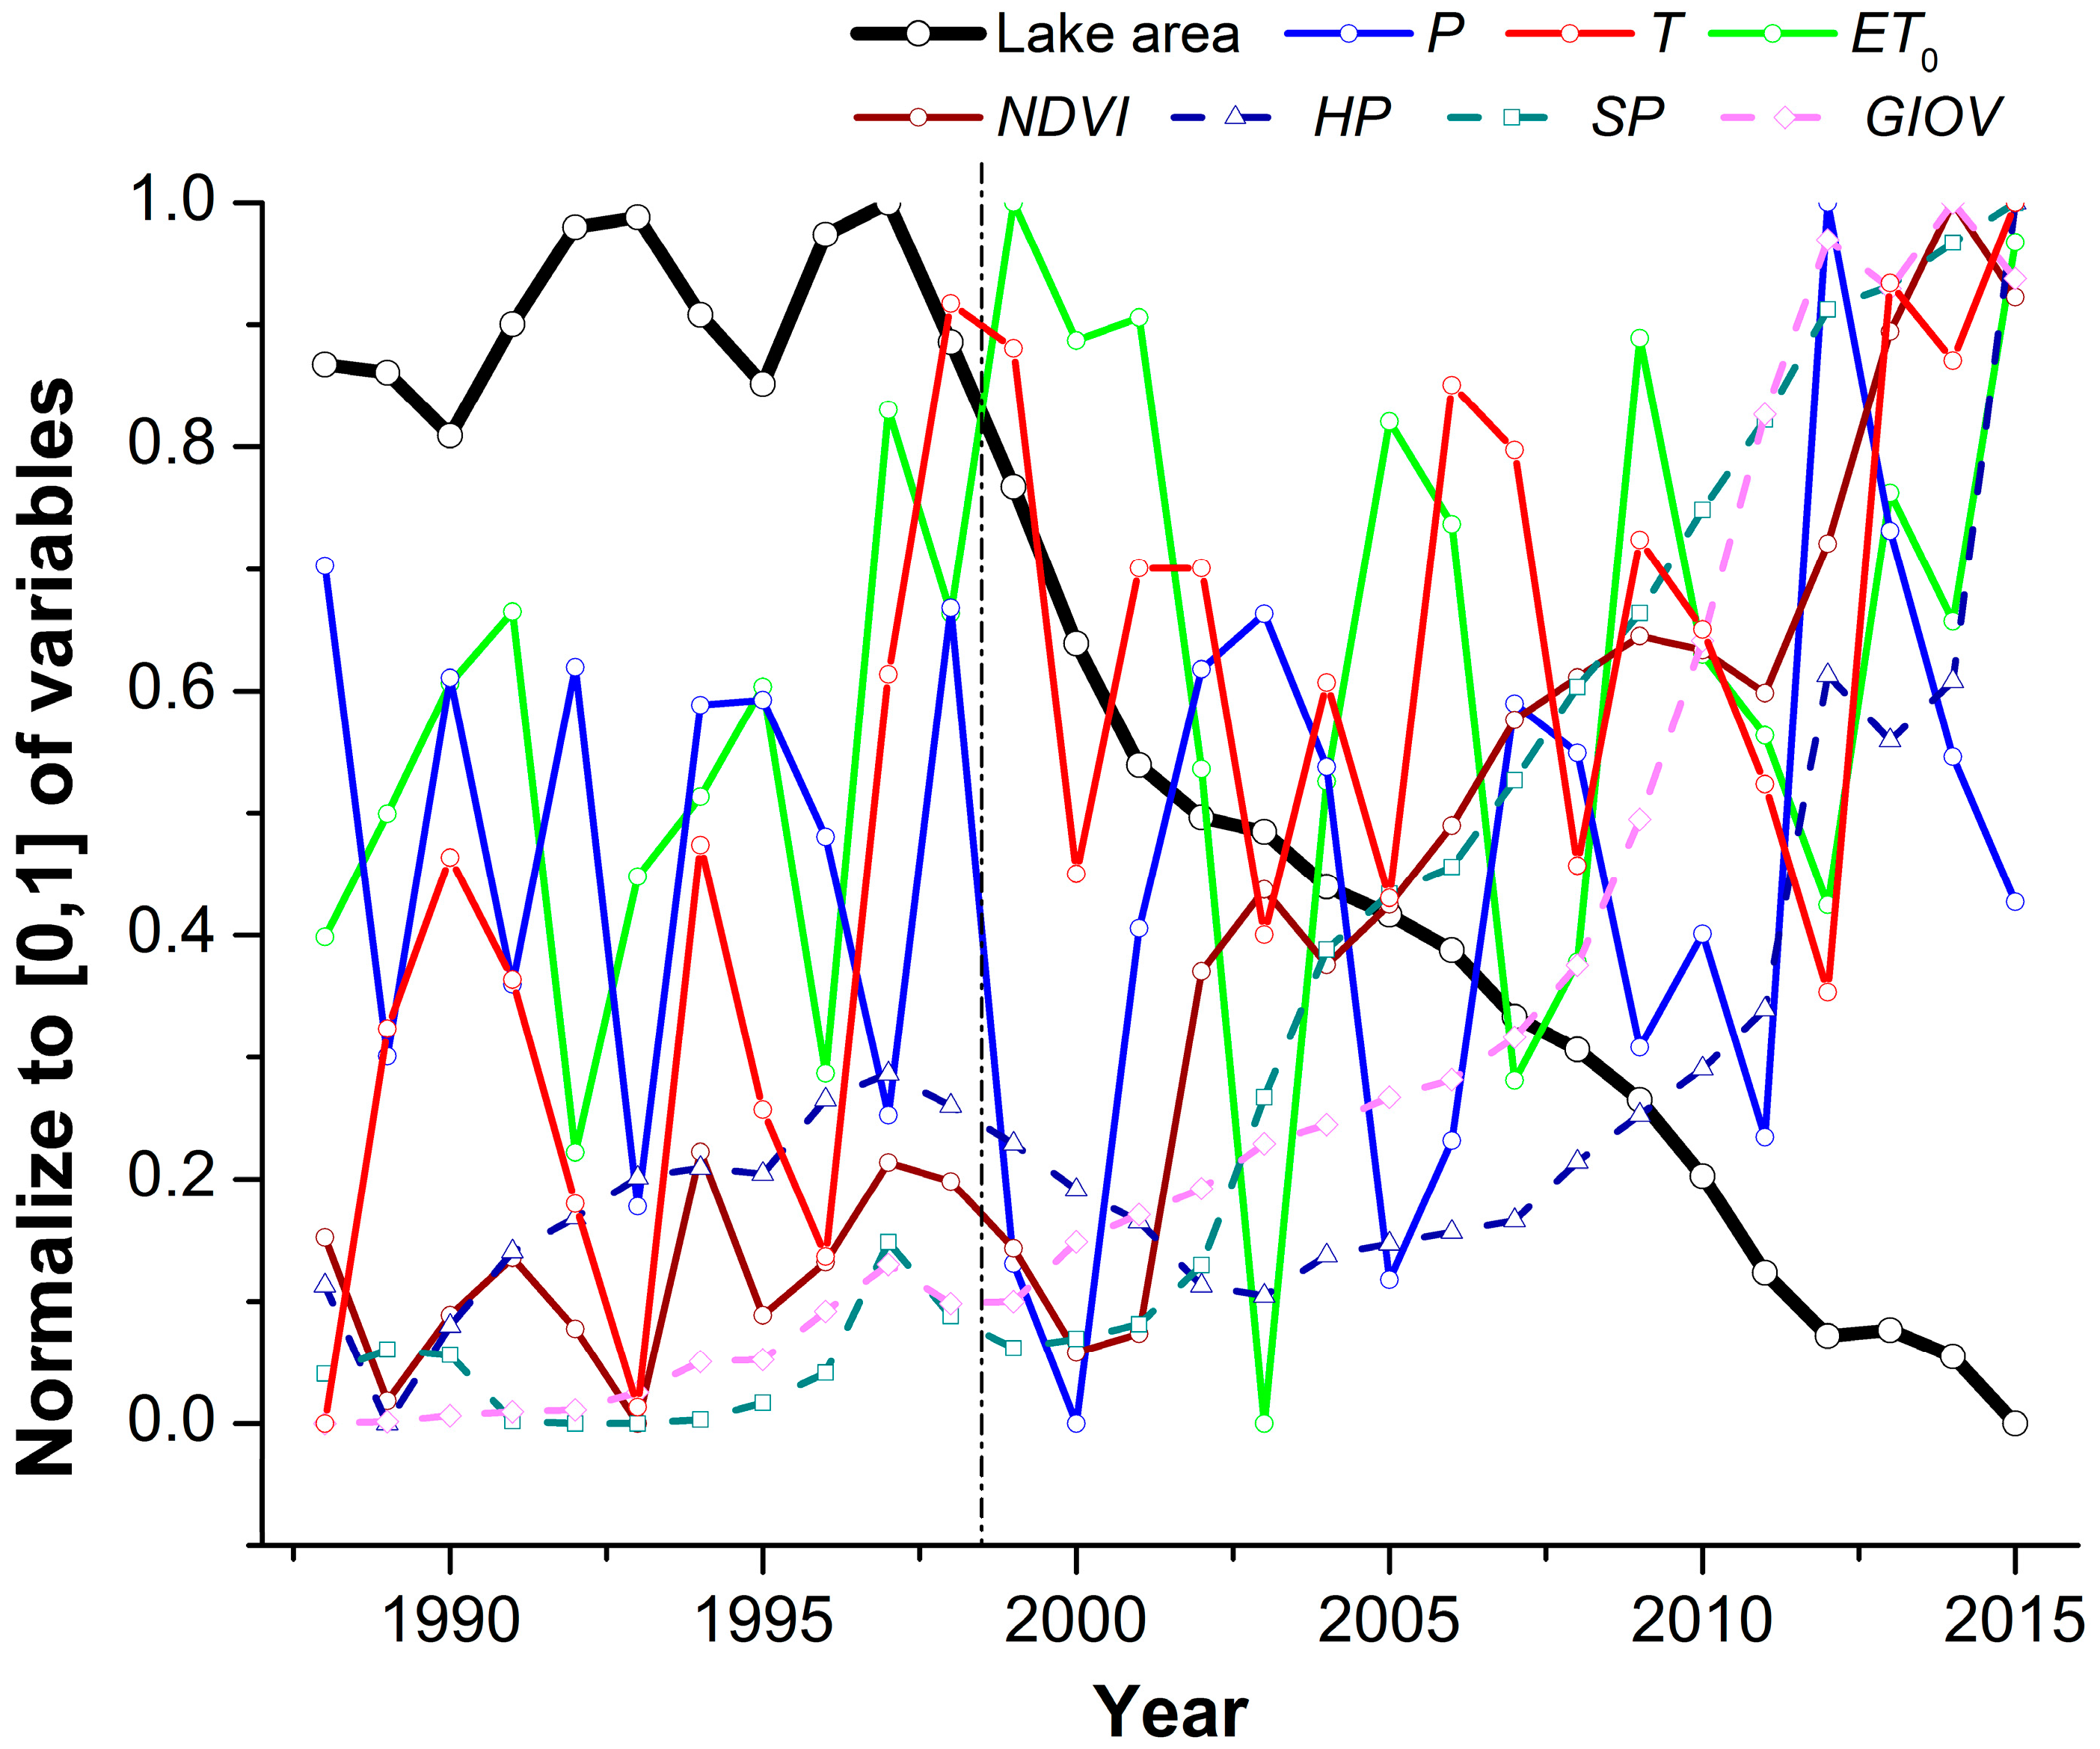
3.4. Correlation Between the Lake Area and Its Driving Factors
4. Discussion
4.1. Variations in Lake Size, Lake Island Area and the Driving Factors
4.2. Implications to the Protection for Lake Water Resources and Relict Gull Habitat
4.3. Uncertainties and Limitations
5. Conclusions
Acknowledgments
Author Contributions
Conflicts of Interest
References
- Liu, H.; Yin, Y.; Piao, S.; Zhao, F.; Engels, M.; Ciais, P. Disappearing lakes in semiarid northern china: Drivers and environmental impact. Environ. Sci. Technol. 2013, 47, 12107–12114. [Google Scholar] [CrossRef] [PubMed]
- Tao, S.; Fang, J.; Zhao, X.; Zhao, S.; Shen, H.; Hu, H.; Tang, Z.; Wang, Z.; Guo, Q. Rapid loss of lakes on the mongolian plateau. Proc. Natl. Acad. Sci. USA 2015, 112, 2281–2286. [Google Scholar] [CrossRef] [PubMed]
- Talbot, M.R.; Delibrias, G. Holocene variations in the level of lake bosumtwi, Ghana. Nature 1977, 268, 722–724. [Google Scholar] [CrossRef]
- Macdonald, G.M.; Edwards, T.W.D.; Moser, K.A.; Pienitz, R.; Smol, J.P. Rapid response of treeline vegetation and lakes to past climate warming. Nature 1993, 361, 243–246. [Google Scholar] [CrossRef]
- Williamson, C.E.; Saros, J.E.; Vincent, W.F.; Smold, J.P. Lakes and reservoirs as sentinels, integrators, and regulators of climate change. Limnol. Oceanogr. 2009, 54, 2273–2282. [Google Scholar] [CrossRef]
- Song, C.; Huang, B.; Richards, K.; Ke, L.; Hien Phan, V. Accelerated lake expansion on the tibetan plateau in the 2000s: Induced by glacial melting or other processes? Water Resour. Res. 2014, 50, 3170–3186. [Google Scholar] [CrossRef]
- Pekel, J.-F.; Cottam, A.; Gorelick, N.; Belward, A.S. High-resolution mapping of global surface water and its long-term changes. Nature 2016, 540, 418–422. [Google Scholar] [CrossRef] [PubMed]
- Yuan, Y.; Zeng, G.; Liang, J.; Huang, L.; Hua, S.; Li, F.; Zhu, Y.; Wu, H.; Liu, J.; He, X. Variation of water level in dongting lake over a 50-year period: Implications for the impacts of anthropogenic and climatic factors. J. Hydrol. 2015, 525, 450–456. [Google Scholar] [CrossRef]
- Coe, M.T.; Foley, J.A. Human and natural impacts on the water resources of the lake chad basin. J. Geophys. Res. Atmos. 2001, 106, 3349–3356. [Google Scholar] [CrossRef]
- Assel, R.A.; Quinn, F.H.; Sellinger, C.E. Hydroclimatic factors of the recent record drop in laurentian great lakes water levels. Bull. Am. Meteorol. Soc. 2004, 85, 1143–1151. [Google Scholar] [CrossRef]
- Sellinger, C.E.; Stow, C.A.; Lamon, E.C.; Qian, S.S. Recent water level declines in the lake michigan-huron system. Environ. Sci. Technol. 2008, 42, 367–373. [Google Scholar] [CrossRef] [PubMed]
- Ma, R.; Duan, H.; Hu, C.; Feng, X.; Li, A.; Ju, W.; Jiang, J.; Yang, G. A half-century of changes in china’s lakes: Global warming or human influence? Geophys. Res. Lett. 2010, 37, L24106. [Google Scholar] [CrossRef]
- Yang, X.; Lu, X. Drastic change in China’s lakes and reservoirs over the past decades. Sci. Rep. 2014, 4, 6041. [Google Scholar] [CrossRef] [PubMed]
- Birkett, C.M. The contribution of topex/poseidon to the global monitoring of climatically sensitive lakes. J. Geophys. Res. Atmos. 1995, 100, 25179–25204. [Google Scholar] [CrossRef]
- Alsdorf, D.E.; Rodriguez, E.; Lettenmaier, D.P. Measuring surface water from space. Rev. Geophys. 2007, 45, RG2002. [Google Scholar] [CrossRef]
- Song, C.; Huang, B.; Ke, L. Modeling and analysis of lake water storage changes on the tibetan plateau using multi-mission satellite data. Remote Sens. Environ. 2013, 135, 25–35. [Google Scholar] [CrossRef]
- Mueller, N.; Lewis, A.; Roberts, D.; Ring, S.; Melrose, R.; Sixsmith, J.; Lymburner, L.; Mcintyre, A.; Tan, P.; Curnow, S. Water observations from space: Mapping surface water from 25 years of landsat imagery across australia. Remote Sens. Environ. 2015, 174, 341–352. [Google Scholar] [CrossRef]
- Halabisky, M.; Moskal, L.M.; Gillespie, A.; Hannam, M. Reconstructing semi-arid wetland surface water dynamics through spectral mixture analysis of a time series of landsat satellite images (1984–2011). Remote Sens. Environ. 2016, 177, 171–183. [Google Scholar] [CrossRef]
- Zhu, W.; Jia, S.; Lv, A. Monitoring the fluctuation of lake qinghai using multi-source remote sensing data. Remote Sens. 2014, 6, 10457–10482. [Google Scholar] [CrossRef]
- BirdLife International. Larus relictus. (amended version published in 2016) The IUCN Red List of Threatened Species 2017: e.T22694447A112120559. Available online: http://dx.doi.org/10.2305/IUCN.UK.2017-1.RLTS.T22694447A112120559.en (accessed on 30 September 2017).
- He, F.; Melville, D.; Xing, X.; Ren, Y. A review on studies of the relict gull larus relictus. Chin. J. Zool. 2002, 37, 65–70. [Google Scholar]
- Zhang, Y.; He, F. A study of the breeding ecology of the relict gull larus relictus at ordos, Inner Mongolia, China. Forktail 1993, 8, 125–132. [Google Scholar]
- Yan, G.; Lou, H.; Liang, K.; Zhang, Z. Dynamics and driving forces of bojiang lake area in erdos larus relictus national nature reserve, china. Quat. Int. 2017. [Google Scholar] [CrossRef]
- Xiao, H.; Zhang, Z.; Wang, Z.; Wang, Y. Breding population dynamic of relict gull (Larus relietus) at Hongjiannao lake of Shaanxi Province. J. Shaanxi Norm. Univ. 2006, 34, 83–86. (In Chinese) [Google Scholar]
- Xiao, H.; Wang, Z.; Hu, C.; Wang, Y. Relict gull Larus relictus breeding population dynamics and their breeding habitat in Hongjian nur, Shaanxi Province. Sci. Technol. Rev. 2008, 26, 54–57. (In Chinese) [Google Scholar]
- Zhou, L.; Feng, N.; Zhang, B.; Wang, Z.; Lu, Z. Population dynamics and distribution of Larus relictus and waterfowls in Hongjiannao wetland. Chin. J. Wildl. 2008, 29, 299–301. (In Chinese) [Google Scholar]
- Wang, Q.; Yang, C.; Liu, Z.; Hu, C.; Xiao, H. Brooding behavior and nestling growth of relict gull in hongjiannao, shaanxi province. Chin. J. Zool. 2013, 48, 357–362. (In Chinese) [Google Scholar]
- Shen, J.; Wang, Y.; Xiangdong, Y.; Enlou, Z.; Yang, B.; Junfeng, J. Paleosandstorm characteristics and lake evolution history deduced from investigation on lacustrine sediments—The case of Hongjiannao lake, Shaanxi Province. Chin. Sci. Bull. 2005, 50, 2355–2361. [Google Scholar]
- Fang, T.; Xu, Q.H.; Li, Y.C.; Cao, X.Y.; Wang, X.L.; Zhang, L.Y. Pollen assemblage characteristics of lakes in the monsoon fringe area of china. Sci. Bull. 2008, 53, 3354–3363. [Google Scholar]
- Li, S.; Chen, S.; Zhang, J. Environmental changes analysis of hongjiannao lake during recent fifty years—Based on the data of lake sediments. Agric. Sci. Technol. 2009, 178–183. [Google Scholar]
- Li, D.; He, H.; Liu, A. Impact of human activities and climate change on vegetation around hongjian nur lake in Northwestern China. J. Desert Res. 2010, 30, 831–836. (In Chinese) [Google Scholar]
- Tan, L.; Zhang, H.; Zhang, R.; Luo, Z.; Li, X.; Liu, P. Study on the landscape pattern change of Hongjiannao watershed in northern Shaanxi Province. J. Xi'an Jiaotong Univ. 2010, 44, 126–132. (In Chinese) [Google Scholar]
- Zhang, H.; Liu, P.; Li, X. Land use dynamic change of hongjiannao watershed in northern shaanxi province. Environ. Sci. Technol. 2011, 34, 180–183. (In Chinese) [Google Scholar]
- Tang, K.; Wang, H.; Liu, C. Preliminary study of hongjiannao lake’s variation and ecological water demand. J. Nat. Resour. 2003, 18, 304–309. (In Chinese) [Google Scholar]
- Liu, P.; Gan, W.; Zhang, R.; Tan, L. Quantitative analysis on water volume change and impacting factors for hongjiannao watershed in northern shaanxi province. J. Xi’an Jiaotong Univ. 2009, 43, 119–124. (In Chinese) [Google Scholar]
- Yang, L.; Huang, Q.; Wu, J.; Jia, Z. Influence factors and prediction on area change of lake hongjiannao. J. Arid Land Resour. Environ. 2014, 28, 74–78. (In Chinese) [Google Scholar]
- Zhao, N.; Ma, C.; Yang, Y. Water quality variation of lake hongjiannao and its driving force analysis from 1973 to 2013. J. Lake Sci. 2016, 28, 982–993. (In Chinese) [Google Scholar]
- Ma, B.; Wu, L.; Zhang, X.; Li, X.; Liu, Y.; Wang, S. Locally adaptive unmixing method for lake-water area extraction based on modis 250m bands. Int. J. Appl. Earth Obs. Geoinf. 2014, 33, 109–118. [Google Scholar] [CrossRef]
- Yin, L.; zhang, M.; Dong, J. Area variation and controlling factors of lake hongjian, mu us desert, china based on remote sensing techniques. Geol. Bull. China 2008, 27, 1151–1156. (In Chinese) [Google Scholar]
- Li, D.; Zhuo, J.; Wang, Z. Effect of human activities and climate change on the water surface area of hongjiannao lake. J. Glaciol. Geocryol. 2009, 31, 1110–1115. (In Chinese) [Google Scholar]
- Wang, J.; Qu, J.; Zhang, W. Extraction and monitoring of hongjiannao lake area in mu us sandy land based on mixed pixel decomposition of remote sensing data. J. Desert Res. 2011, 31, 558–562. (In Chinese) [Google Scholar]
- Liu, Y.; Yue, H. Analysis of hongjiannao lake area based on smmi. Sci. Technol. Eng. 2016, 16, 122–127. (In Chinese) [Google Scholar]
- Liu, Y.; Wu, L.; Yue, H. Monitoring of hongjiannao lake area based on landsat and hj imageries. Geogr. Geo-Inf. Sci. 2015, 31, 60–64. (In Chinese) [Google Scholar]
- Zhang, B.; Yang, L.; Ge, H.; Dong, W. Study on the countermeasures to alleviate the water ecological environment crisis. Agric. Ltechnol. 2013, 33, 41–42. (In Chinese) [Google Scholar]
- Rubini, B.; Berezovikov, N.N. The fluctuation of breeding numbers of relict gull larus relictus onlake alakol (se kazakhstan): A review of surveys from 1968 to 2001. Acrocephalus 2002, 23, 185–188. [Google Scholar]
- He, F.Q.; Ren, Y.-Q. Alternative choosing of breeding sites of those ordos relict gulls. China Nat. 2006, 4, 16–17. (In Chinese) [Google Scholar]
- Liang, K. Quantifying streamflow variations in ungauged lake basins by integrating remote sensing and water balance modelling: A case study of the erdos larus relictus national nature reserve, china. Remote Sens. 2017, 9, 588. [Google Scholar] [CrossRef]
- Allen, R.G.; Pereira, L.S.; Raes, D.; Smith, M. Crop Evapotranspiration-Guidelines for Computing Crop Water Requirements-Fao Irrigation and Drainage Paper 56; FAO: Rome, Italy, 1998; Volume 300, p. D05109. [Google Scholar]
- Tucker, C.J.; Pinzon, J.E.; Brown, M.E.; Slayback, D.A.; Pak, E.W.; Mahoney, R.; Vermote, E.F.; El Saleous, N. An extended avhrr 8-km ndvi dataset compatible with modis and spot vegetation NDVI data. Int. J. Remote Sens. 2005, 26, 4485–4498. [Google Scholar] [CrossRef]
- Holben, B.N. Characteristics of maximum-value composite images from temporal avhrr data. Int. J. Remote Sens. 1986, 7, 1417–1434. [Google Scholar] [CrossRef]
- Piao, S.; Wang, X.; Ciais, P.; Zhu, B.; Wang, T.; Liu, J. Changes in satellite-derived vegetation growth trend in temperate and boreal eurasia from 1982 to 2006. Glob. Chang. Biol. 2011, 17, 3228–3239. [Google Scholar] [CrossRef]
- Xu, H. Modification of normalised difference water index (NDWI) to enhance open water features in remotely sensed imagery. Int. J. Remote Sens. 2006, 27, 3025–3033. [Google Scholar] [CrossRef]
- Mcfeeters, S.K. The use of the normalized difference water index (NDWI) in the delineation of open water features. Int. J. Remote Sens. 1996, 17, 1425–1432. [Google Scholar] [CrossRef]
- Ji, L.; Zhang, L.; Wylie, B. Analysis of dynamic thresholds for the normalized difference water index. Photogramm. Eng. Remote Sens. 2009, 75, 1307–1317. [Google Scholar] [CrossRef]
- Liu, C.; Zhang, D.; Liu, X.; Zhao, C. Spatial and temporal change in the potential evapotranspiration sensitivity to meteorological factors in china (1960–2007). J. Geogr. Sci. 2012, 22, 3–14. [Google Scholar] [CrossRef]
- Keyantash, J.; Dracup, J.A. The quantification of drought: An evaluation of drought indices. Bull. Am. Meteorol. Soc. 2002, 83, 1167. [Google Scholar]
- Van Den Broeke, M.; Bamber, J.; Ettema, J.; Rignot, E.; Schrama, E.; van de Berg, W.J.; van Meijgaard, E.; Velicogna, I.; Wouters, B. Partitioning recent greenland mass loss. Science 2009, 326, 984–986. [Google Scholar] [CrossRef] [PubMed]
- Wei, F. Modern Climatic Statistical Diagnosis and Prediction Techniques, 2nd ed.; China Meteorological Press: Beijing, China, 2007. [Google Scholar]
- Gibbs, P.H. Introduction to linear regression analysis. Technometrics 2012, 25, 2775–2776. [Google Scholar] [CrossRef]
- Lee Rodgers, J.; Nicewander, W.A. Thirteen ways to look at the correlation coefficient. Am. Stat. 1988, 42, 59–66. [Google Scholar] [CrossRef]
- Liang, K.; Bai, P.; Li, J.; Liu, C. Variability of temperature extremes in the yellow river basin during 1961–2011. Quat. Int. 2014, 336, 52–64. [Google Scholar] [CrossRef]
- Liang, K.; Liu, S.; Bai, P.; Nie, R. The yellow river basin becomes wetter or drier? The case as indicated by mean precipitation and extremes during 1961–2012. Theor. Appl. Climatol. 2015, 119, 701–722. [Google Scholar] [CrossRef]
- Hrachowitz, M.; Savenije, H.H.G.; Blöschl, G.; Mcdonnell, J.J.; Sivapalan, M.; Pomeroy, J.W.; Arheimer, B.; Blume, T.; Clark, M.P.; Ehret, U. A decade of predictions in ungauged basins (pub)—A review. Hydrol. Sci. J. 2013, 58, 1–58. [Google Scholar] [CrossRef]
- Montanari, A.; Young, G.; Savenije, H.H.G.; Hughes, D.; Wagener, T.; Ren, L.L.; Koutsoyiannis, D.; Cudennec, C.; Toth, E.; Grimaldi, S. Panta rhei-everything flows: Change in hydrology and society-the iahs scientific decade 2013–2022. Hydrol. Sci. J. 2013, 58, 1256–1275. [Google Scholar] [CrossRef]


| Year | Sensor | Path/Row | Acquisition Date (DD/MM) |
|---|---|---|---|
| 1988 | TM | 127/33 | 28 January, 29 February, 31 March, 17 April, 19 May, 20 June, 21 July, 07 August, 08 September, 26 October, 27 November, 29 December |
| 1989 | TM | 127/33 | 14 January, 15 February, 03 March, 20 April, 22 May, 07 June, 09 July, 26 August, 27 September, 29 October, 30 November, 16 December |
| 1990 | TM | 127/33 | 17 January, 18 February, 22 March, 23 April, 25 May, 10 June, 12 July, 29 August, 21 September, 16 October, 17 November, 19 December |
| 1991 | TM | 127/33 | 20 January, 21 February, 25 March, 26 April, 28 May, 29 June, 31 July, 30 August, 17 September, 19 October, 20 November, 22 December |
| 1992 | TM | 127/33 | 23 January, 24 February, 27 March, 28 April, 30 May, 15 June, 17 July, 18 August, 19 September, 21 October, 22 November, 24 December |
| 1993 | TM | 127/33 | 25 January, 26 February, 30 March, 15 April, 17 May, 18 June, 20 July, 05 August, 22 September, 24 October, 25 November, 27 December |
| 1994 | TM | 127/33 | 28 January, 13 February, 17 March, 18 April, 20 May, 21 June, 07 July, 24 August, 25 September, 27 October, 28 November, 30 December |
| 1995 | TM | 127/33 | 31 January, 16 February, 20 March, 21 April, 07 May, 24 June, 26 July, 27 August, 12 September, 30 October, 15 November, 24 December |
| 1996 | TM | 127/33 | 25 January, 19 February, 06 March, 23 April, 25 May, 10 June, 12 July, 29 August, 30 September, 23 October, 24 November, 10 December |
| 1997 | TM | 127/33 | 20 January, 21 February, 25 March, 26 April, 28 May, 29 June, 31 July, 16 August, 17 September, 19 October, 20 November, 22 December |
| 1998 | TM | 127/33 | 23 January, 24 February, 28 March, 29 April, 31 May, 16 June, 02 July, 19 August, 20 September, 22 October, 24 November, 25 December |
| 1999 | TM | 127/33 | 26 January, 27 February, 31 March, 16 April, 18 May, 19 June, 21 July, 22 August, 23 September, 25 October, 26 November, 28 December |
| 2000 | TM/ETM+ | 127/33 | 22 January, 14 February, 17 March, 18 April, 20 May, 21 June, 23 July, 24 August, 25 September, 27 October, 28 November, 30 December |
| 2001 | TM/ETM+ | 127/33 | 31 January, 16 February, 20 March, 21 April, 23 May, 24 June, 26 July, 27 August, 28 September, 30 October, 22 November, 17 December |
| 2002 | TM/ETM+ | 127/33 | 18 January, 19 February, 23 March, 24 April, 26 May, 27 June, 29 July, 30 August, 15 September, 17 October, 18 November, 20 December |
| 2003 | TM/ETM+ | 127/33 | 21 January, 22 February, 25 March, 27 April, 29 May, 30 June, 17 July, 17 August, 18 September, 20 October, 21 November, 23 December |
| 2004 | TM/ETM+ | 127/33 | 24 January, 25 February, 28 March, 29 April, 31 May, 16 June, 18 July, 19 August, 20 September, 22 October, 23 November, 25 December |
| 2005 | TM/ETM+ | 127/33 | 26 January, 27 February, 31 March, 16 April, 18 May, 19 June, 20 July, 22 August, 23 September, 25 October, 26 November, 28 December |
| 2006 | TM/ETM+ | 127/33 | 29 January, 14 February, 27 March, 19 April, 21 May, 22 June, 24 July, 25 August, 26 September, 28 October, 29 November, 31 December |
| 2007 | TM/ETM+ | 127/33 | 24 January, 25 February, 21 March, 22 April, 24 May, 25 June, 18 July, 20 August, 21 September, 23 October, 24 November, 26 December |
| 2008 | TM/ETM+ | 127/33 | 19 January, 20 February, 23 March, 24 April, 26 May, 27 June, 29 July, 30 August, 15 September, 17 October, 18 November, 20 December |
| 2009 | TM/ETM+ | 127/33 | 21 January, 22 February, 26 March, 27 April, 29 May, 30 June, 24 July, 17 August, 18 September, 20 October, 21 November, 23 December |
| 2010 | TM/ETM+ | 127/33 | 24 January, 25 February, 26 March, 30 April, 16 May, 17 June, 19 July, 20 August, 21 September, 23 October, 24 November, 26 December |
| 2011 | TM/ETM+ | 127/33 | 27 January, 28 February, 23 March, 17 April, 19 May, 20 June, 22 July, 23 August, 24 September, 26 October, 22 November, 24 December |
| 2012 | ETM+ | 127/33 | 22 January, 23 February, 26 March, 27 April, 29 May, 30 June, 16 July, 17 August, 18 September, 20 October, 21 November, 23 December |
| 2013 | ETM+/OLI | 127/33 | 24 January, 25 February, 29 March, 30 April, 21 May, 25 June, 27 July, 28 August, 29 September, 23 October, 24 November, 26 December |
| 2014 | OLI | 127/33 | 19 January, 20 February, 24 March, 22 April, 24 May, 25 June, 27 July, 31 August, 22 September, 18 October, 19 November, 21 December |
| 2015 | OLI | 127/33 | 22 January, 23 February, 27 March, 28 April, 30 May, 15 June, 17 July, 18 August, 19 September, 21 October, 22 November, 24 December |
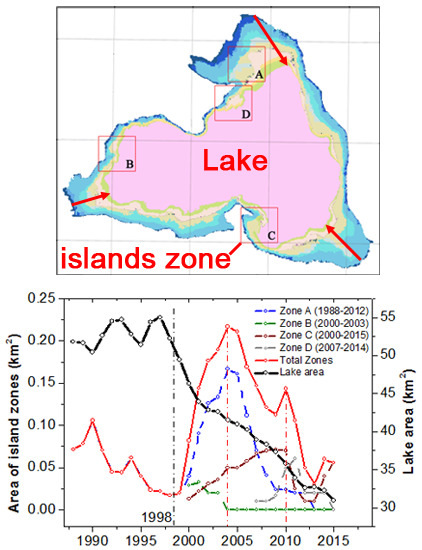
| Zones | Existence Date Span a (MM/YY) | Area Extent (km2) | Status b | Acquisition Date (MM/YY) | Islands Area (km2) | Lake Area (km2) |
|---|---|---|---|---|---|---|
| A | January 1988–May 2012 | 0–0.16 | A1 | January 1988 | 0.08 | 51.07 |
| A2 | June 2005 | 0.16 | 39.98 | |||
| A3 | May 2012 | 0.02 | 32.96 | |||
| A4 | June 2012 | 0 | 32.28 | |||
| B | March 2000–July 2003 | 0–0.06 | B1 | March 2000 | 0.01 | 47.38 |
| B2 | August 2002 | 0.06 | 43.19 | |||
| B3 | July 2003 | 0.02 | 42.81 | |||
| B4 | August 2003 | 0 | 42.41 | |||
| C | June 2000–December 2015 | 0–0.08 | C1 | June 2000 | 0.01 | 46.76 |
| C2 | June 2010 | 0.08 | 36.05 | |||
| C3 | December 2015 | 0.07 | 30.11 | |||
| C4 | May 2000 | 0 | 46.92 | |||
| D | May 2007–August 2014 | 0–0.08 | D1 | May 2007 | 0.01 | 39.23 |
| D2 | August 2011 | 0.08 | 33.67 | |||
| D3 | August 2014 | 0.02 | 32.72 | |||
| D4 | September 2014 | 0 | 32.64 |
| P | T | ET0 | NDVI | HP 1 | SP 2 | GIOV 3 | |
|---|---|---|---|---|---|---|---|
| HL area 1988–2015 | −0.15 | −0.56 ** | −0.18 | −0.92 ** | −0.61 ** | −0.94 ** | −0.91 ** |
| HL area 1988–1998 | −0.50 | −0.18 | −0.22 | −0.02 | 0.62 * | 0.06 | 0.46 |
| HL area 1999–2015 | −0.48 | −0.19 | 0.10 | −0.94 ** | −0.76 ** | −0.98 ** | −0.94 ** |
© 2017 by the authors. Licensee MDPI, Basel, Switzerland. This article is an open access article distributed under the terms and conditions of the Creative Commons Attribution (CC BY) license (http://creativecommons.org/licenses/by/4.0/).
Share and Cite
Liang, K.; Yan, G. Application of Landsat Imagery to Investigate Lake Area Variations and Relict Gull Habitat in Hongjian Lake, Ordos Plateau, China. Remote Sens. 2017, 9, 1019. https://doi.org/10.3390/rs9101019
Liang K, Yan G. Application of Landsat Imagery to Investigate Lake Area Variations and Relict Gull Habitat in Hongjian Lake, Ordos Plateau, China. Remote Sensing. 2017; 9(10):1019. https://doi.org/10.3390/rs9101019
Chicago/Turabian StyleLiang, Kang, and Guozhen Yan. 2017. "Application of Landsat Imagery to Investigate Lake Area Variations and Relict Gull Habitat in Hongjian Lake, Ordos Plateau, China" Remote Sensing 9, no. 10: 1019. https://doi.org/10.3390/rs9101019
APA StyleLiang, K., & Yan, G. (2017). Application of Landsat Imagery to Investigate Lake Area Variations and Relict Gull Habitat in Hongjian Lake, Ordos Plateau, China. Remote Sensing, 9(10), 1019. https://doi.org/10.3390/rs9101019