Article

Assessing Terrestrial Water Storage and Flood Potential Using GRACE Data in the Yangtze River Basin, China

1
State Key Laboratory of Earth Surface Processes and Resource Ecology, Beijing Normal University, Beijing 100875, China
2
Key Laboratory of Environmental Change and Natural Disaster, Ministry of Education, Beijing Normal University, Beijing 100875, China
3
State Key Laboratory of Remote Sensing Science, Jointly Sponsored by Beijing Normal University and Institute of Remote Sensing and Digital Earth of Chinese Academy of Sciences, Beijing 100875, China
4
Institute of Remote Sensing Science and Engineering, Faculty of Geographical Science, Beijing Normal University, Beijing 100875, China
*
Author to whom correspondence should be addressed.
Remote Sens. 2017, 9(10), 1011; https://doi.org/10.3390/rs9101011
Submission received: 14 August 2017 / Revised: 20 September 2017 / Accepted: 22 September 2017 / Published: 29 September 2017
(This article belongs to the Special Issue Remote Sensing for Flood Mapping and Monitoring of Flood Dynamics)

Abstract

:
Floods have caused tremendous economic, societal and ecological losses in the Yangtze River Basin (YRB) of China. To reduce the impact of these disasters, it is important to understand the variables affecting the hydrological state of the basin. In this study, we used Gravity Recovery and Climate Experiment (GRACE) satellite data, flood potential index (FPI), precipitation data (Tropical Rainfall Measuring Mission, TRMM 3B43), and other meteorological data to generate monthly terrestrial water storage anomalies (TWSA) and to evaluate flood potential in the YRB. The results indicate that the basin contained increasing amounts of water from 2003 to 2014, with a slight increase of 3.04 mm/year in the TWSA. The TWSA and TRMM data exhibit marked seasonal characteristics with summer peaks and winter dips. Estimates of terrestrial water storage based on GRACE, measured as FPI, are critical for understanding and predicting flooding. The 2010 flood (FPI ~ 0.36) was identified as the most serious disaster during the study period, with discharge and precipitation values 37.95% and 19.44% higher, respectively, than multi-year average values for the same period. FPI can assess reliably hydrological extremes with high spatial and temporal resolution, but currently, it is not suitable for smaller and/or short-term flood events. Thus, we conclude that GRACE data can be effectively used for monitoring and examining large floods in the YRB and elsewhere, thus improving the current knowledge and presenting potentially important political and economic implications.

Graphical Abstract

1. Introduction

Terrestrial/total water storage (TWS), defined as the sum of all water stored on the Earth’s surface (e.g., lakes, reservoirs, rivers, and snow water equivalent), in the entire soil profile, and in aquifers [1], is the most critical variable of the hydrological cycle. TWS plays an important role in the Earth’s climate system by strongly influencing its water, energy and biogeochemical fluxes [2]. Monitoring of the TWS using traditional methods and characterization of extreme hydrologic events without adequate data, however, have presented a significant challenge until 2002—i.e., the year when the twin-satellite Gravity Recovery and Climate Experiment (GRACE) mission was launched. GRACE takes detailed measurements of the changes in the Earth’s gravitational field, with a spatial resolution of several hundred kilometers and a temporal resolution of approximately one month, and is currently revolutionizing the investigations of the Earth’s water reserves in land, ice, and oceans, as well as their influence on earthquakes and crustal deformations [3]. The GRACE-derived terrestrial/total water storage anomaly (TWSA) represents the total vertically integrated water storage, which has been used widely to study the regional or continental hydrological states [4,5].
Floods are complicated natural disasters that involve many factors—human activities, climate change, and the Ei Nino-Southern Oscillation (ENSO) [6] all affect the behavior of floods. Floods characterized with a large area of impact and a huge economic loss are among the most serious natural disasters in China [7]. Assessing floods plays a major role in developing disaster mitigation plans. The traditional methods used to monitor floods are based on access to sufficient hydro-meteorological data, such as discharge and precipitation, which are not only time-consuming to collect and process, but are also affected by weather conditions. Such field monitoring generally requires huge computational costs and significant financial resources. Additionally, obtaining sufficient data can be complicated by the fact that hydrological and meteorological stations are often distributed unevenly. Remote sensing observations can potentially be used in their stead, however, optical methods struggle to acquire high-quality data because of weather effects, while radar methods contain no spectral characteristics, and the availability of dense time-series data is scarce in many regions [8]. Moreover, remote sensing methods can only cover a limited scope at any given time. As an important part of the water balance, the TWSA corresponds strongly to extreme hydrological events, especially floods. The introduction of GRACE-based TWSA provides a new tool for monitoring floods—one that is fast, covers a large area, eliminates most limitations imposed by the climate and atmosphere [9], and involves reduced computational costs. This tool has been shown to be effective for studying hydrological features and has been widely used to monitor floods in recent decades [10,11]. For example, Chen [12] quantified the extent and intensity of the exceptional Amazon flood in 2009 and Tangdamrongsub [13] identified flood events in the Tonle Sap Basin using both GRACE and MODIS (Moderate-Resolution Imaging Spectro-radiometer) satellite data.
There is currently no effective and universal index that has yet been established for flood studies because flood characteristics are hard to capture due to their relatively short duration and small extent. Reager and Famiglietti [14] developed the flood potential index (FPI) in order to define a quantitative, effective terrestrial storage capacity, and to highlight the information contained within the GRACE data that is relevant for regional flooding. This index uses the difference between precipitation and the GRACE-derived TWS in the last month to study flood potential. The flood potential can be interpreted as the amount of water in excess of the potential water storage. Several previous studies have used FPI to examine various flood features. For example, Long [11] monitored flooding in the Yun-Gui Plateau using FPI and demonstrated that it is valuable for both evaluating flood potential and improving flood prediction capability. Molodtsova [15] evaluated the efficiency of the FPI in continental USA using multi-year observational flood data and reported a good agreement between the FPI and observed flood data.
The Yangtze River Basin (YRB) located in Southern China is regularly affected by floods, which have resulted in tremendous economic, societal and ecological losses over the past several decades [6,16]. Therefore, it is important and urgent to understand the hydrological state variables in order to reduce flood disasters in the future. Here, we used GRACE data to assess the hydrological conditions of YRB. Two main objectives are addressed in this paper: (1) the analysis and assessment of TWSA in the YRB in the period from 2003 to 2014; and (2) the evaluation of flood potential across the large YRB basin based on FPI and other hydro-meteorological data. The introduction of GRACE data is expected to increase the efficiency and convenience of achieving a broad view of flood potential and extreme hydrological features in a large area basin such as YRB, and compensate for or complement the ground-based observations that are limited by insufficient numbers of hydro-meteorological stations. The methodology employed in this study is expected to help address the challenges associated with assessing hydrological conditions over large area basins: terrestrial water storage evaluation based on the GRACE data is expected to increase the accuracy and efficiency of hydrological statistics for large area basins, and the use of FPI to assess hydrological extremes is expected to unravel new implications for water resource management over this region, and provide a value reference for flood indices studies.

2. Materials and Methods
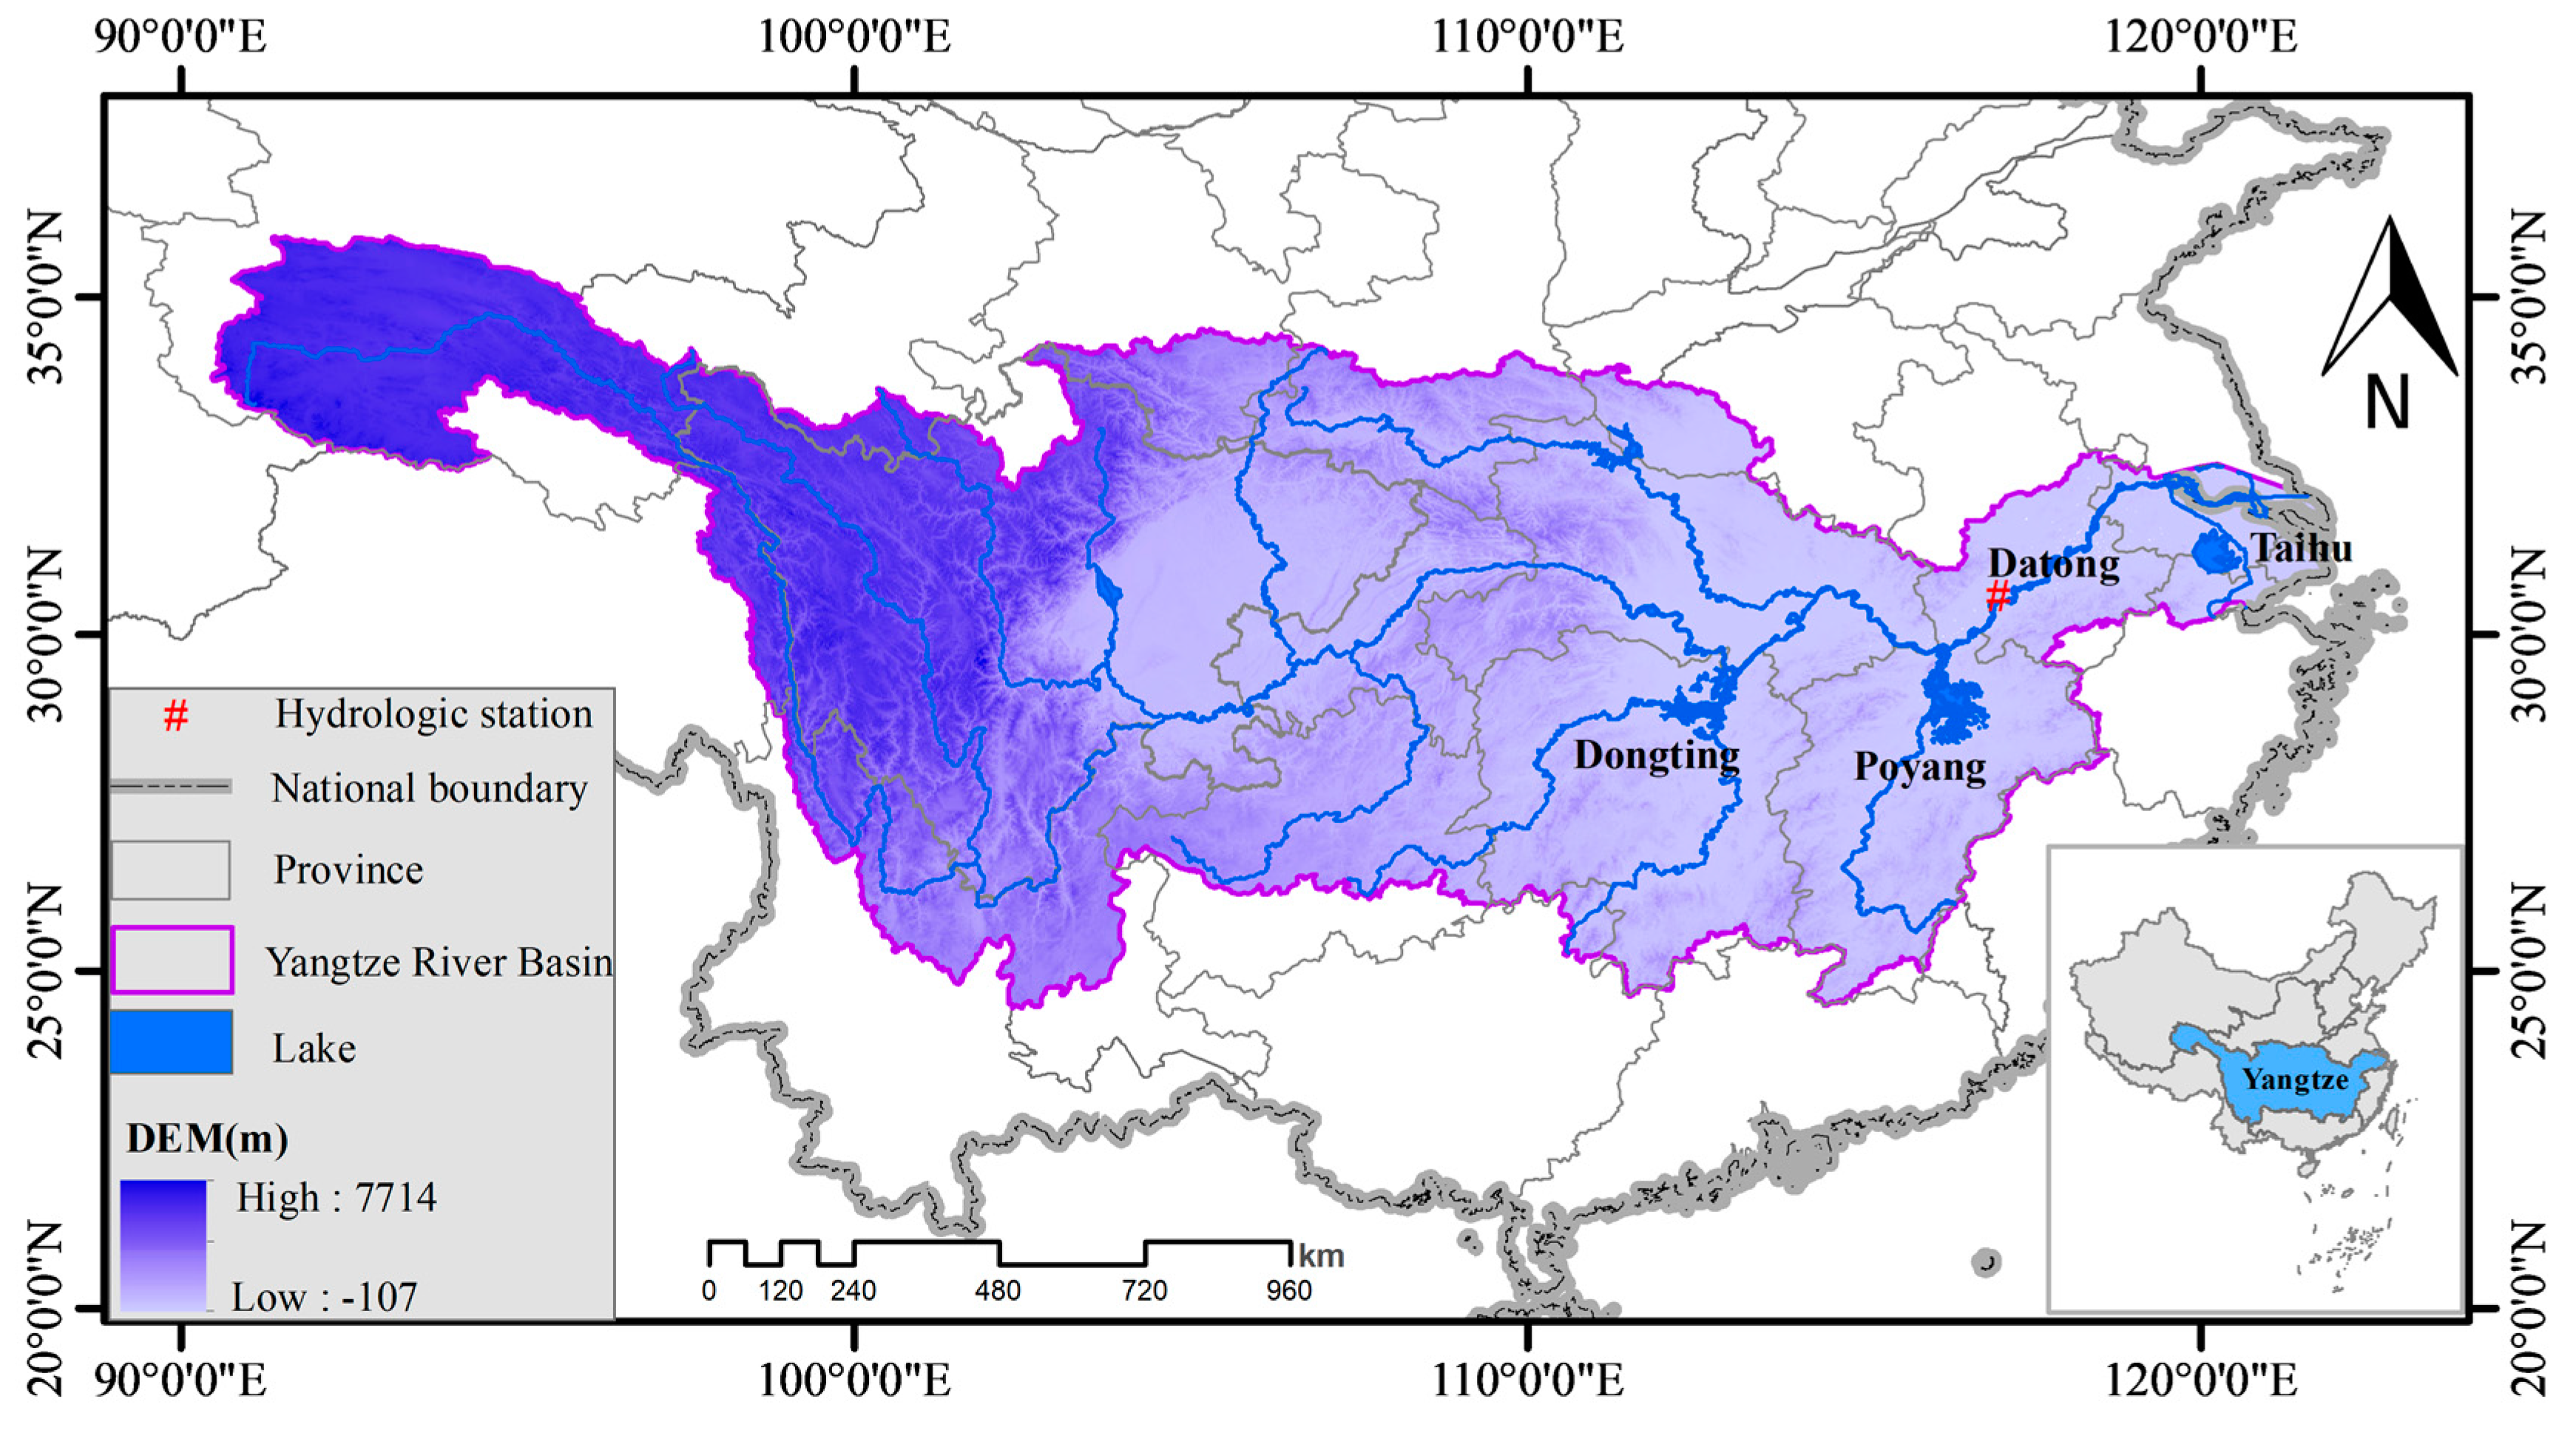
2.1. Study Area

The Yangtze River is the longest river in China; it has a drainage area of approximately 1,800,000 km2, occupies 20% of China’s territory [17], and sustains approximately 400 million people. It originates from the Tibetan Plateau at an average elevation of 4500 m, continues across 11 provinces of China from west to east, and eventually empties into the East China Sea near Shanghai (Figure 1). Three major water bodies are located in the eastern part of the basin: Dongting, Poyang and Taihu Lakes. The geographical environment of the YRB is complex, comprising a variety of landscapes, including plateaus, mountains, hills, basins and plains. The basin is in the area where tropical hot air masses and polar dry and cold air masses meet. Hence, remarkable seasonal characteristics, featuring periodic and non-periodic changes of warm–cold and wet–dry air, are exhibited. The average annual precipitation is approximately 110 cm, with maximum rainfall occurring in summer and autumn. Rainfall from May to October represents approximately 70–90% of the annual total. Precipitation is spatially and temporally unevenly distributed, which favors the formation of floods.

2.2. Data

2.2.1. GRACE Data

We used three gridded TWSA products based on the RL05 spherical harmonics from the Texas Center for Space Research (CSR), the Jet Propulsion Laboratory (JPL), and the German Research Centre for Geosciences (GFZ), which were provided by GRC Tellus Land [18] (details about the data processing for these datasets can be found in [19]). The monthly products with geographical grids of 1° × 1° used in this study cover the period from 2003 to 2014 with 11 months of missing data (June 2003, January 2011, June 2011, May 2012, October 2012, March 2013, August 2013, September 2013, February 2014, July 2014 and December 2014). All missing data were filled using the linear interpolation with the mean values before and after the missing month.

2.2.2. TRMM Data

Precipitation data are essential for studying regional floods. The Tropical Rainfall Measuring Mission (TRMM)’s Multi-satellite Precipitation Analysis (TMPA) combines precipitation estimates from multiple satellites and gauge analyses and provides a calibration-based precipitation product [20]. The TMPA 3B43 [21], which is a post-real-time and gauge-corrected research product with a spatial resolution of 0.25° × 0.25° and a monthly timescale, was used to evaluate TWSA and to analyze hydrological phenomena in the YRB.

2.2.3. Ancillary Data

The evapotranspiration (ET) product from the Moderate Resolution Imaging Spectro-radiometer (MODIS) product MOD16 [22] was used as an input for the water budget equation to evaluate the GRACE-derived terrestrial/total water storage change (TWSC). Monthly stream flow measurements at Datong hydrological station (Figure 1) were obtained from the Yangtze River Hydrological Bureau of China from 2003 to 2014 to estimate the water budget in combination with the TRMM and ET products, and to validate the flood potential index.

2.3. Methods

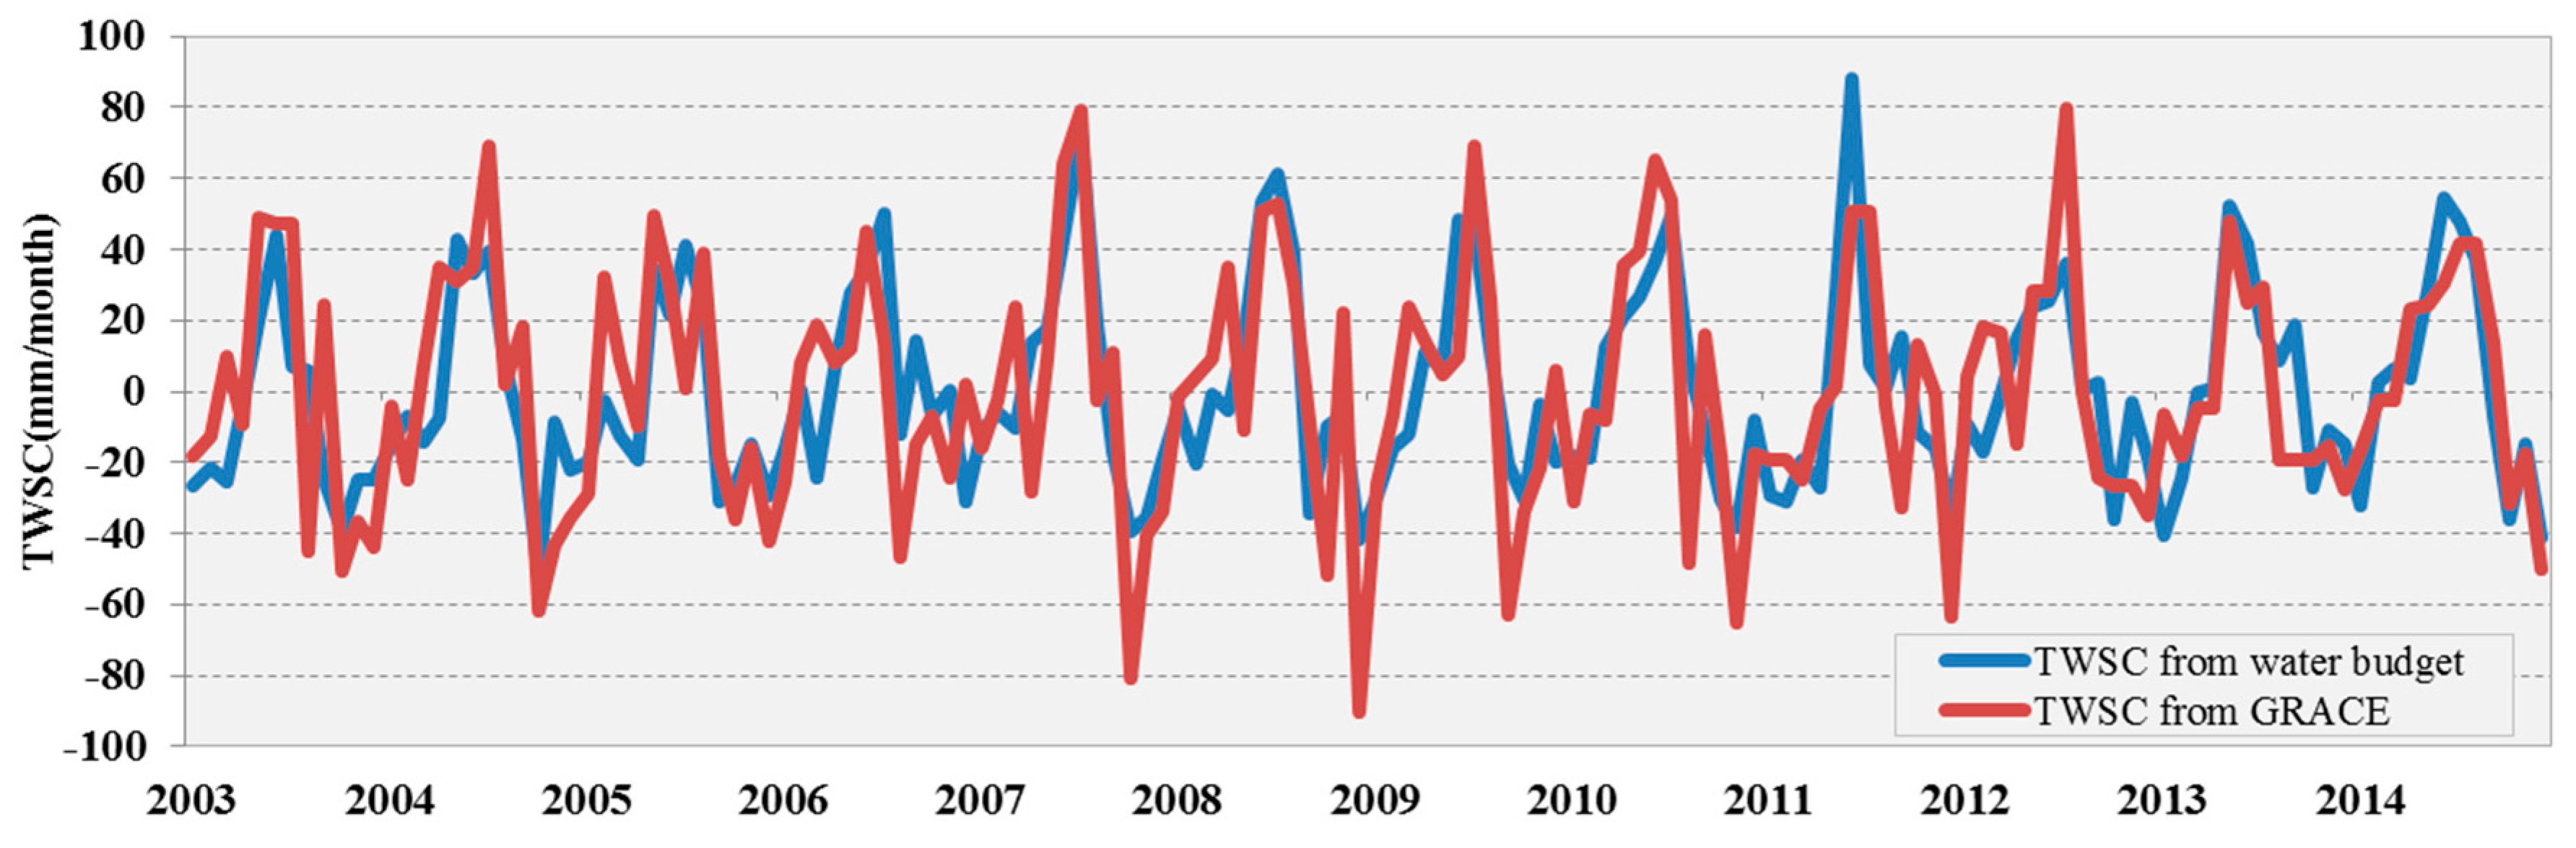
2.3.1. Evaluation of GRACE-Derived Total Water Storage Changes

It is important to evaluate the TWSC data before using them to resolve water-related issues. Most current studies apply the water budget estimates method to evaluate TWSC, obtained by using the water balance equation as follows:
d s / d t = P R E T
where ds/dt is the monthly TWS change; P is the monthly precipitation, R is the stream runoff at Datong station, and ET is the monthly evapotranspiration. In this study, P is obtained from the TRMM 3B43 data and ET is obtained from the MOD16 ET product, which is usually used in water budget estimates [1,23].
The TWS change is calculated from TWSA for a specific period t as follows [24]:
d s / d t = T W S A ( t ) T W S A ( t 1 ) t
It is worth mentioning that we evaluated the TWSC using the water budget under the assumption that no net groundwater flow occurred in the YRB during this period.

2.3.2. Flood Potential Index

The FPI was based on the GRACE-derived TWSA product, and is calculated as follows [14]:
S D E F ( t ) = S M A X S ( t 1 )
where S ( t 1 ) is the TWS of the previous month, S M A X is the maximum value of the historic storage anomaly time series, and the storage deficit S D E F is the highest allowable relative storage change for the coming month. The flood potential amount (FPA) is then obtained as follows:
F P A ( t ) = P M O N ( t ) S D E F ( t )
where P M O N is the monthly precipitation. The FPA accounts for incoming water that exceeds the storage potential of the current month and thus may result in flooding. Similar to the “bucket model” [14], flooding might occur when the FPA has a positive value. The FPI is obtained by normalizing the FPA as follows:
F P I = F P A ( t ) m a x [ F P A ( t ) ]
Here, the FPI value cannot be larger than 1; the closer it is to 1, the more likely a flood is to occur.

2.3.3. STL Decomposition

Inter-annual trends are extracted from the time series of TWSA, rainfall, discharge and FPI based on the non-parametric Seasonal and Trend decomposition using Loess (STL) approach, which is expressed as follows [25]:
h ( t ) = T ( t ) + S ( t ) + R ( t )
where h(t) is time series of variations, T(t) is trend, S(t) is seasonal, R(t) is residual. The STL method, based on locally weighted regression, is a robust and computationally efficient approach commonly used for detecting non-linear patterns in trend estimates. The detailed principles can be found in [25]. Previous studies have deconstructed the GRACE data for the characterization of the inter-annual variability using the STL method [5,26].

3. Results

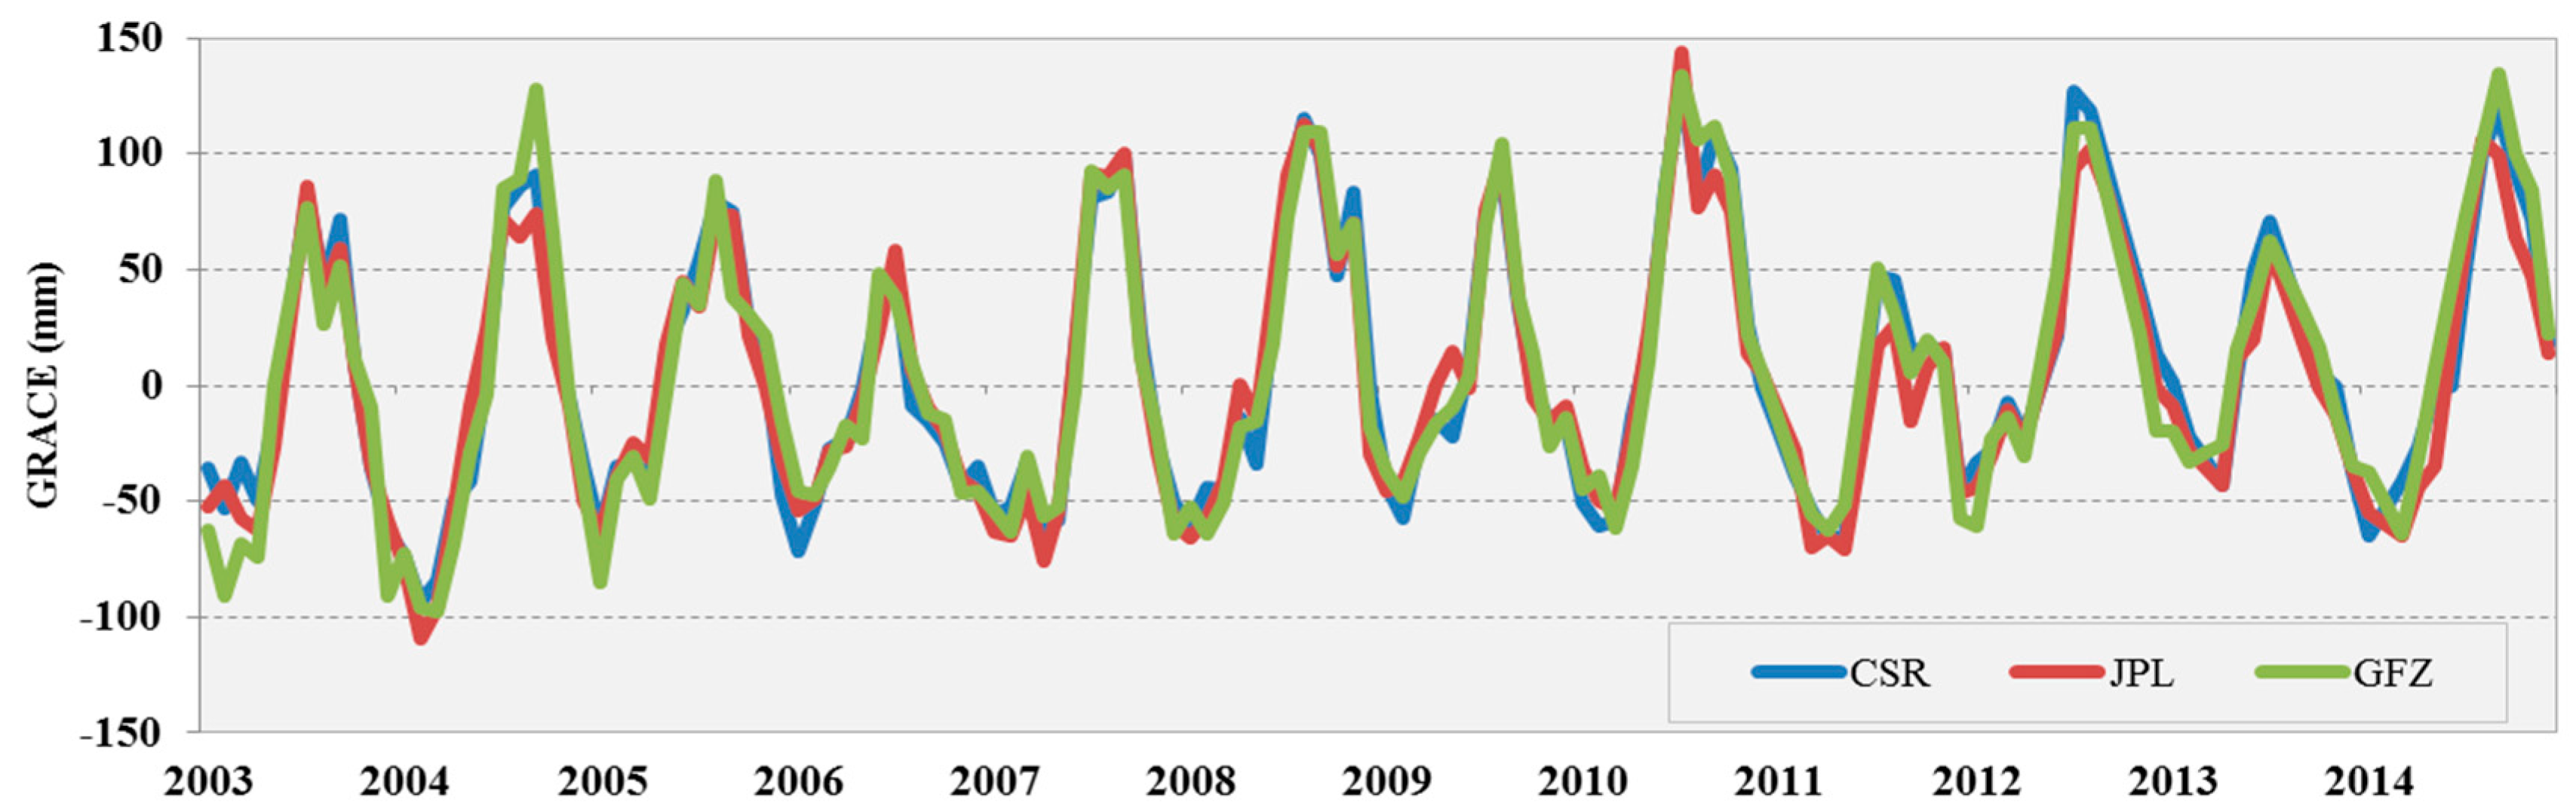
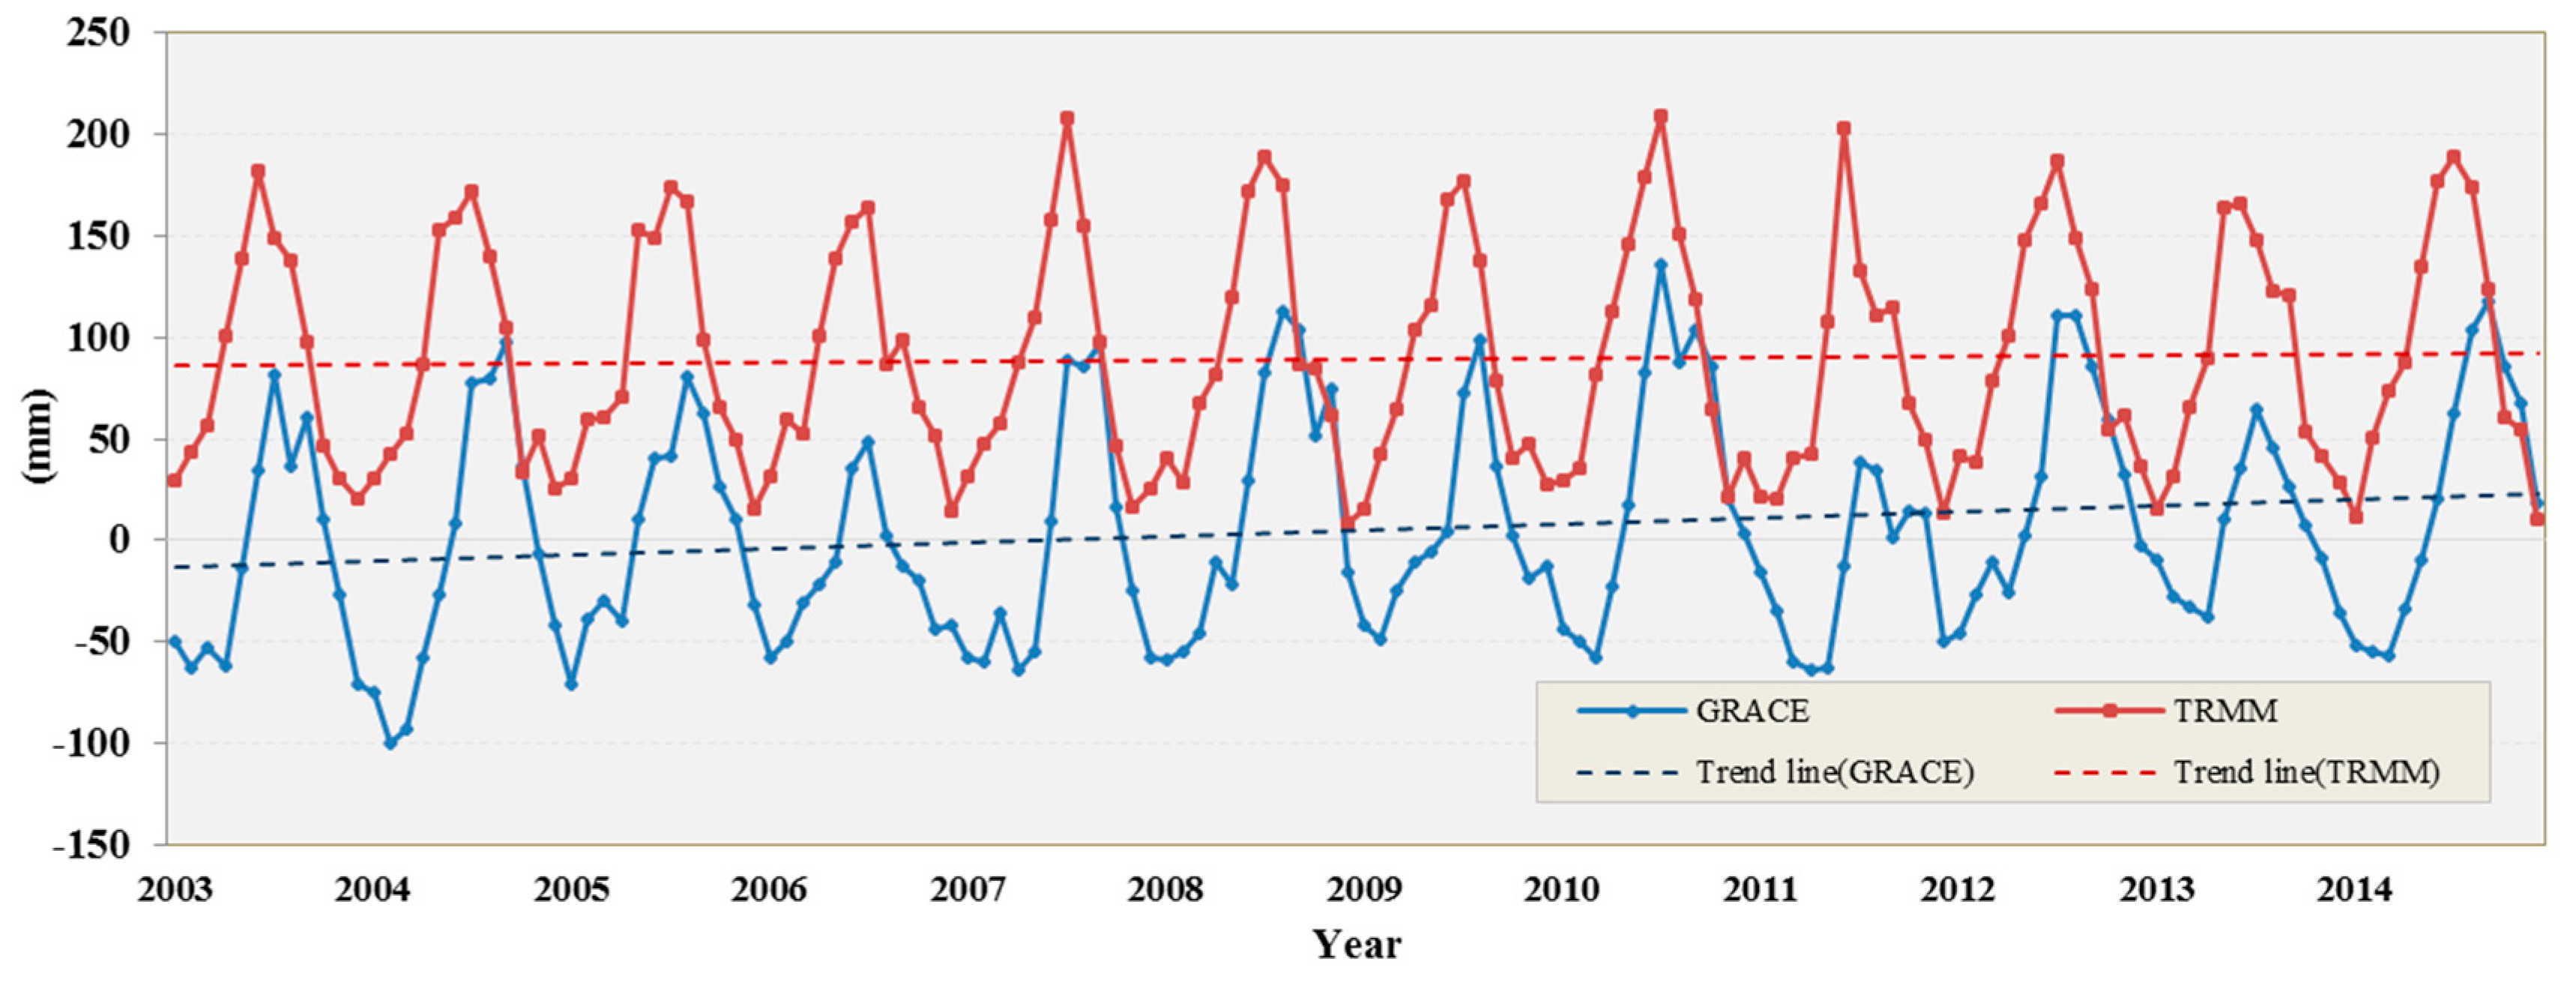
3.1. GRACE Data Analysis and Validation

When compared to each other, the TWSA time series (basin-average values, same hereinafter) derived from the three gridded products showed a high consistency with a mean correlation coefficient of approximately 0.95 (Figure 2). Overall, all three gridded products show similar accuracy although they were processed using different solutions. As a consequence, we used the averaged data from the three gridded releases in the following analysis.
Next, we evaluated the GRACE-derived TWSC (Equation (2)) against the ground-observed TWSC (Equation (1)) from a water budget with precipitation, discharge and ET (Figure 3). The GRACE-derived TWSC estimates are generally consistent with the water budget TWSC estimates from 2003 to 2014, with a correlation coefficient of 0.73. Both estimates are generally positive (total water storage surplus) from April to August and negative (total water storage deficit) in the remaining months (Figure 3), and TWSC derived from the water budget estimates is slightly lower in winter than the GRACE-derived TWSC. In general, the results demonstrated the validity of using GRACE to track the amplitude and timing of TWSC from water budget estimates within the YRB.

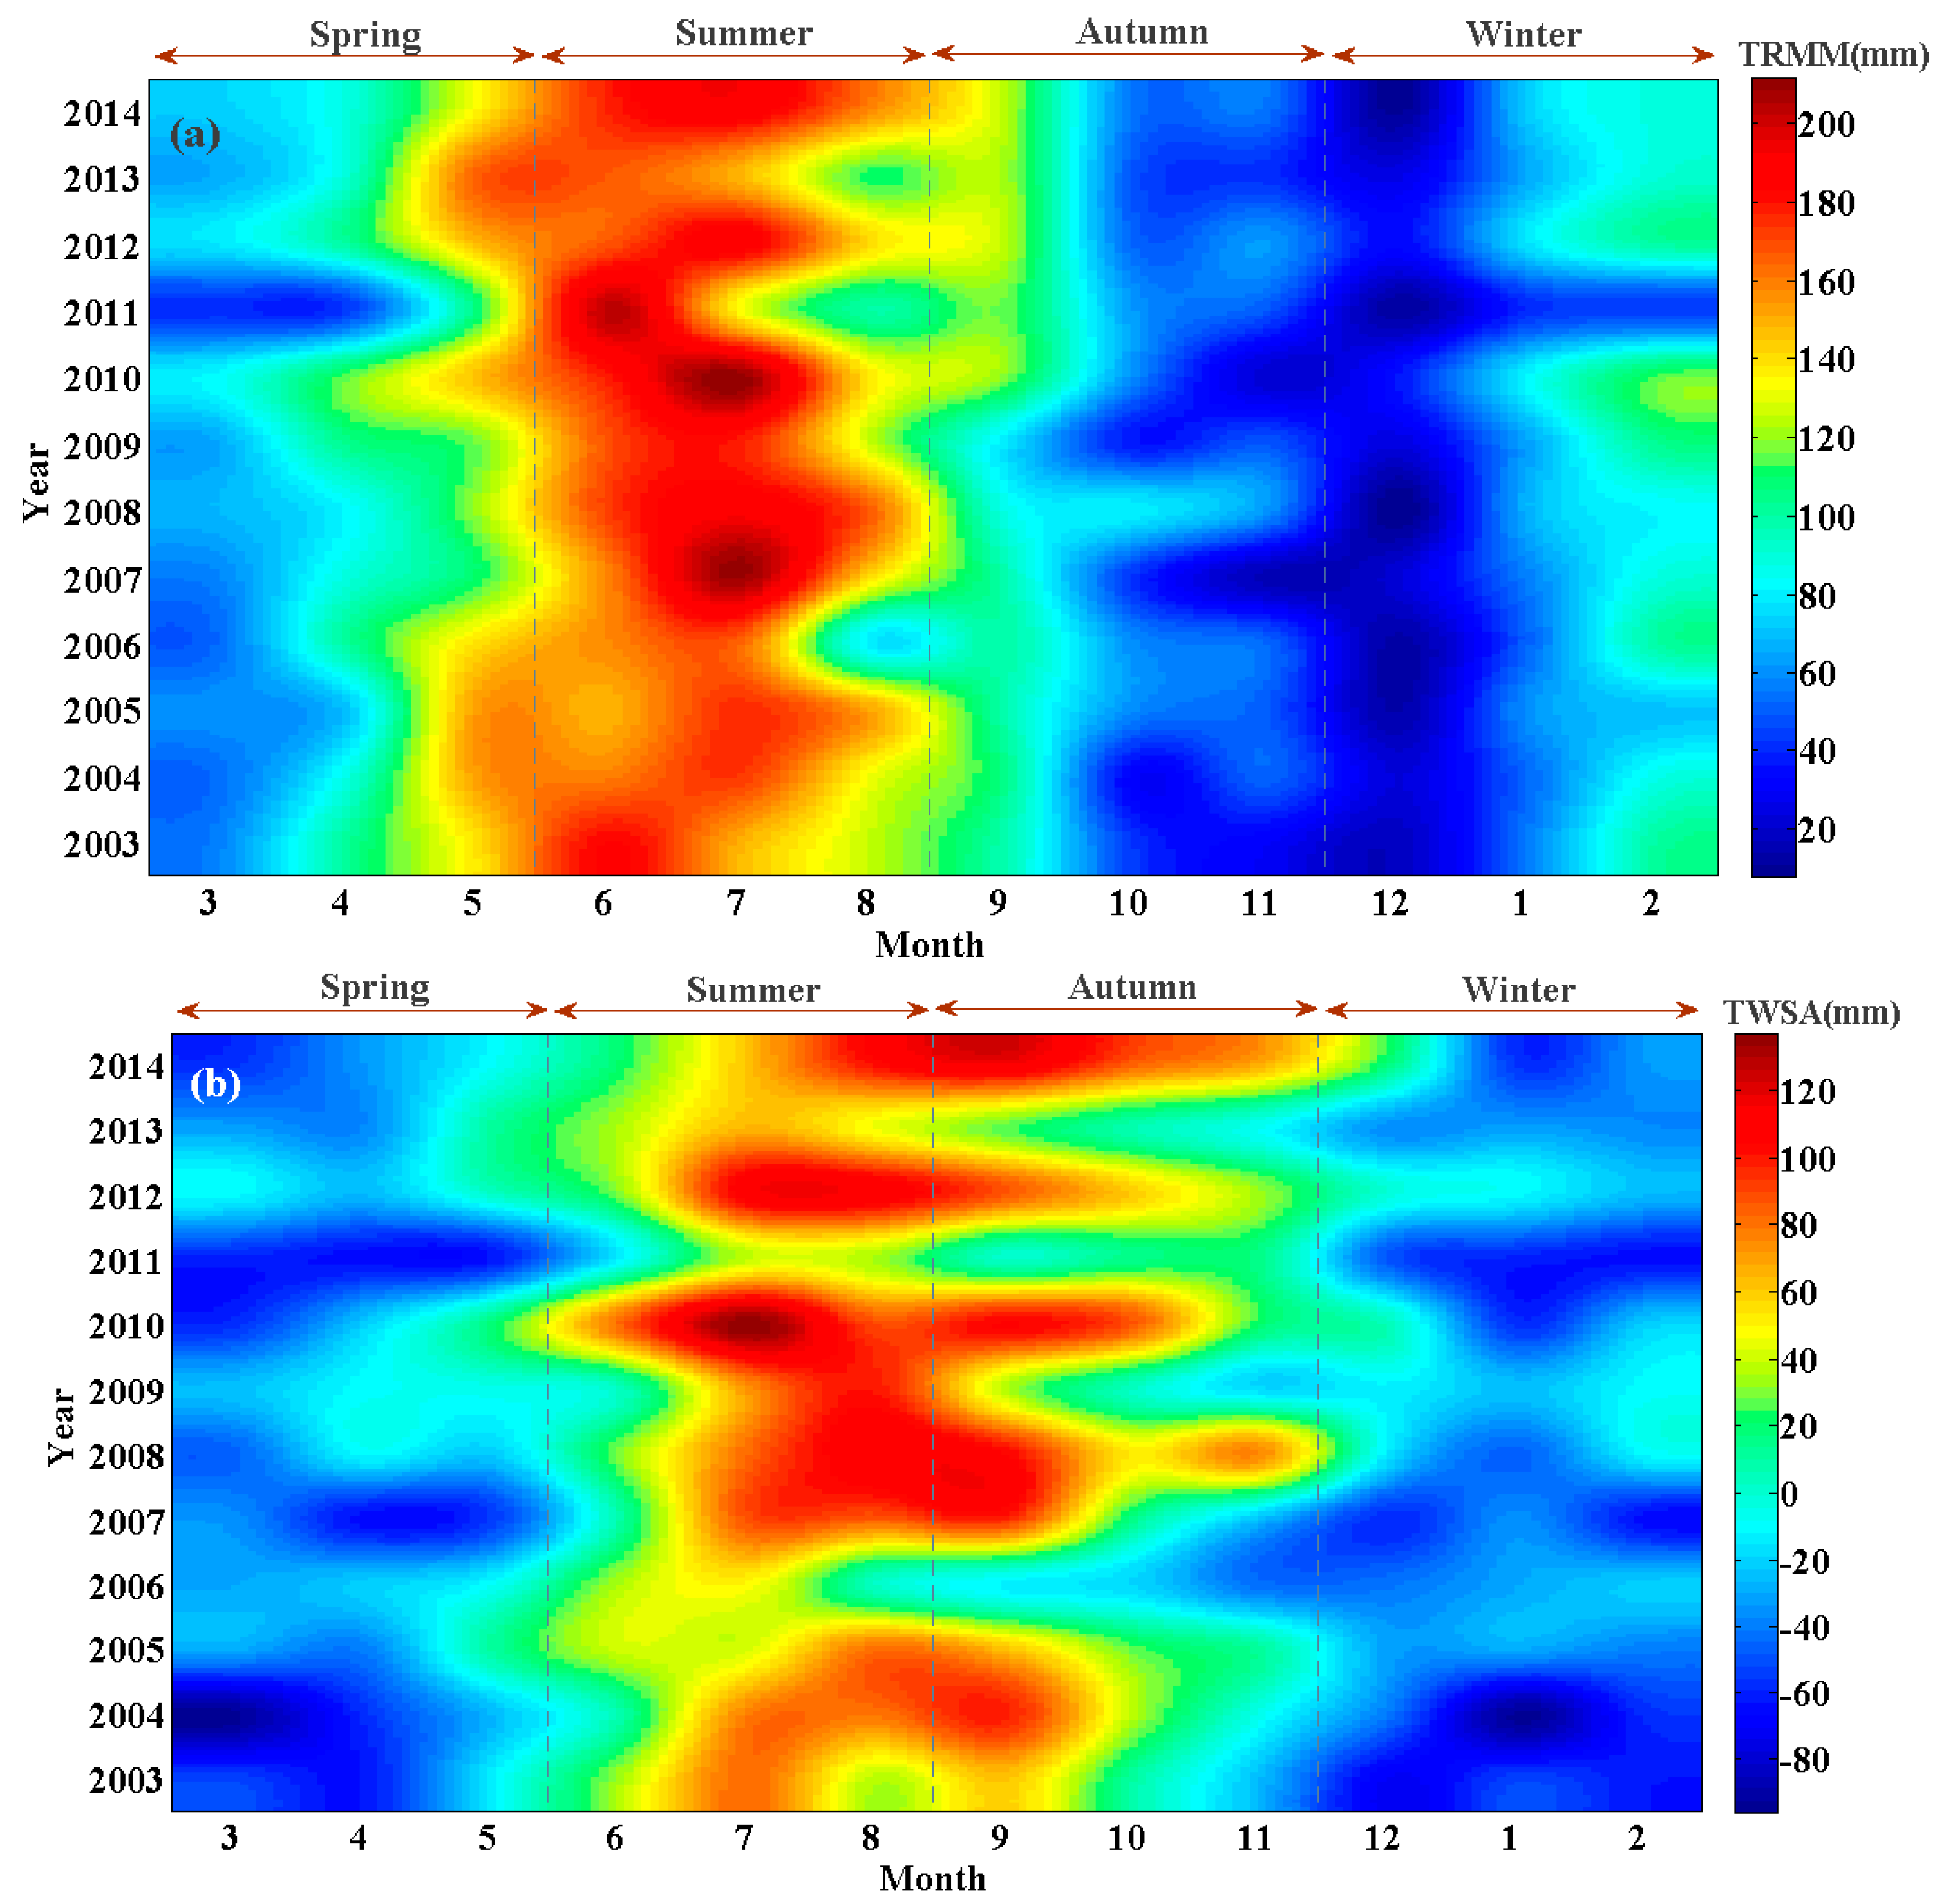
3.2. GRACE-Derived Terrestrial Water Storage Anomaly Analysis

The TWSA in the YRB increased at a rate of 3.04 mm/year from 2003 to 2014 (Figure 4), while the precipitation keeps stable nearly, with a slight growth of 0.52 mm/year. The TWSA and TRMM time series show marked seasonal characteristics, with summer peaks and winter troughs. Monthly rainfall is highly correlated to monthly anomalies of TWS at the basin scale due to large seasonal variations (R = 0.62 for all and R = 0.77 for inter-annual variations). Changes in rainfall induce variations in TWSA with a delay of one month for the basin. The noticeably different seasonal characteristics of TWS can be found in Figure 5, with summer generally positive (surplus) and winter negative (deficit). The TWSA increased from 2003 to 2014, matching the results shown in Figure 4. The monthly precipitation remained relatively stable over this 12-year period, with rainy summers and dry winters (Figure 5b).
In general, the spatial distribution of the TWSA decreased in the west and increased in the east from 2003 to 2014 (Figure 6). The maximum increase (approximately 20.08 mm/year) occurred in northern Jiangxi and eastern Hubei, while the strongest downtrend was found in the western Sichuan Province (minimum value −10.05 mm/year). Additionally, both the source and the outlet of the Yangtze River record a stable trend in TWSA, indicating that the basin overall had no notable decrease or increase during the study period.

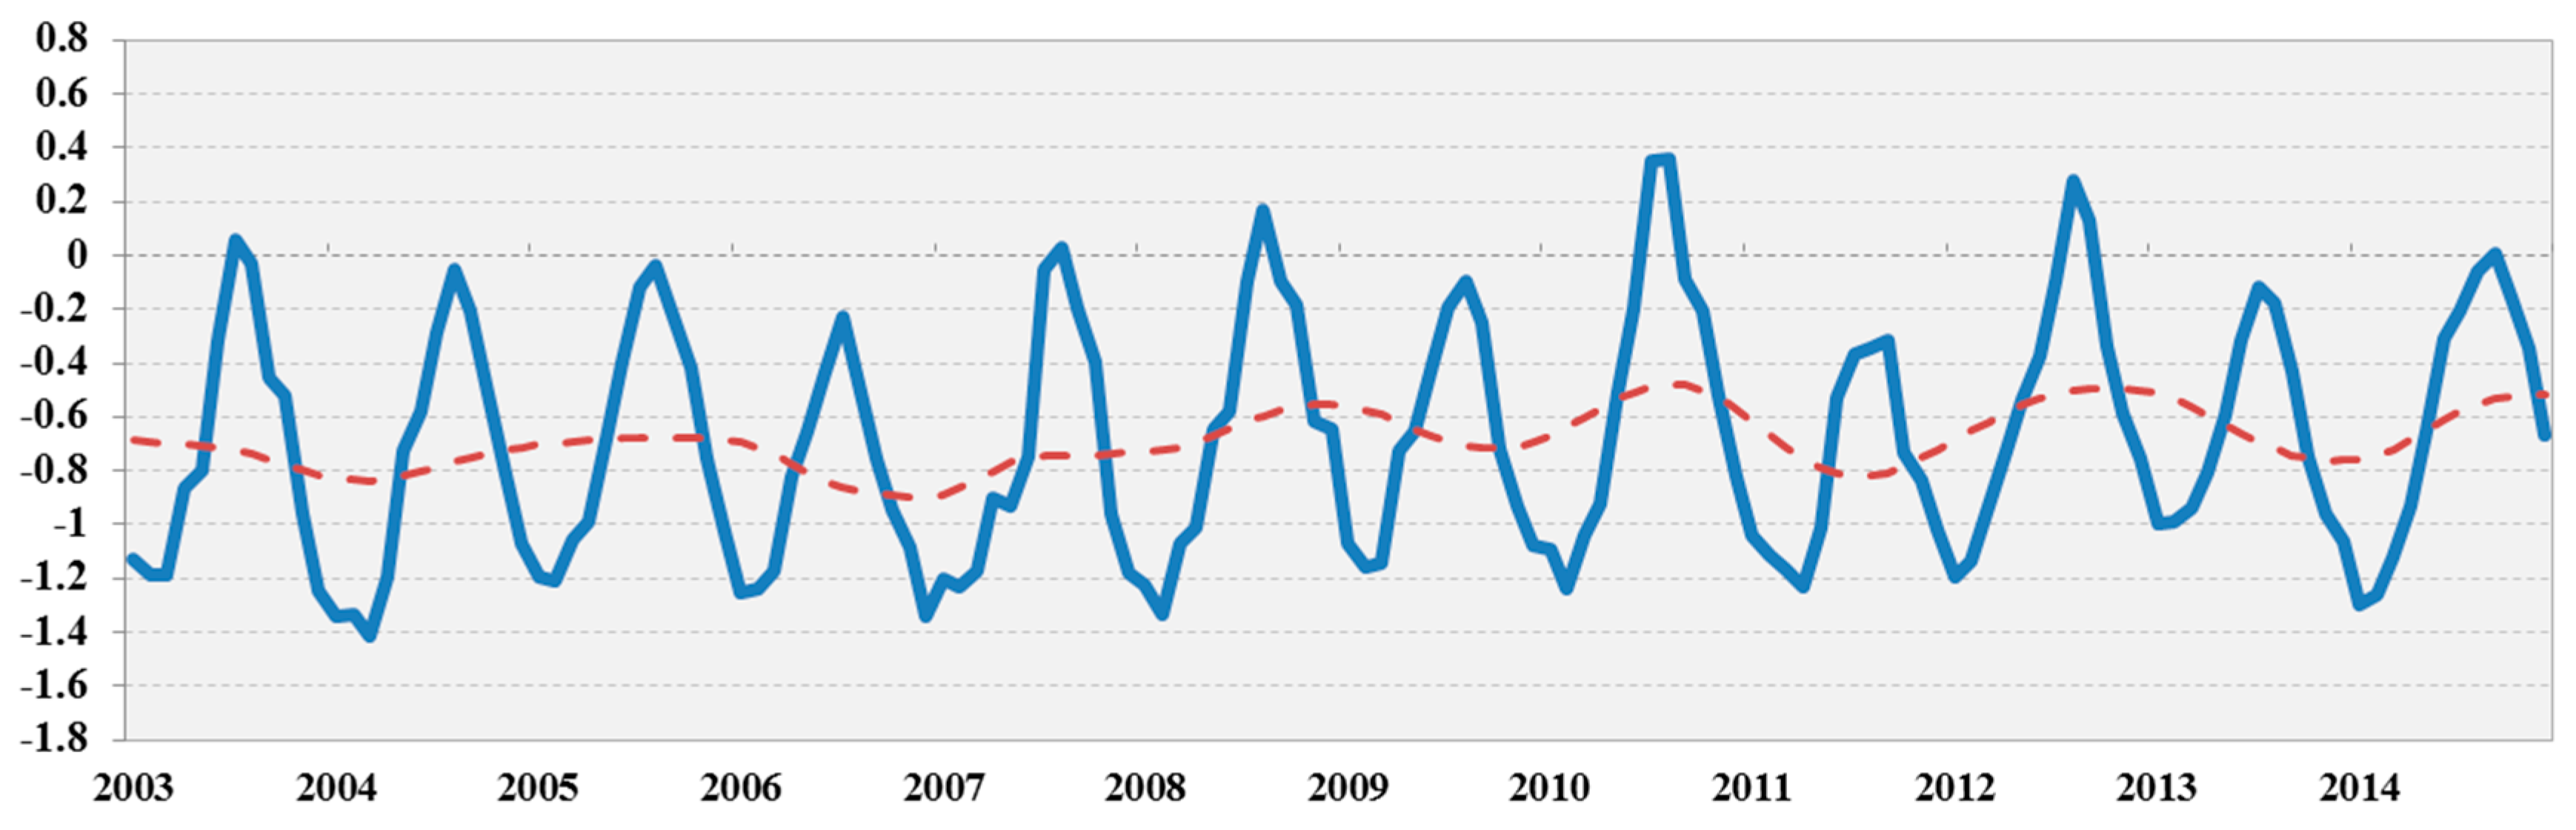
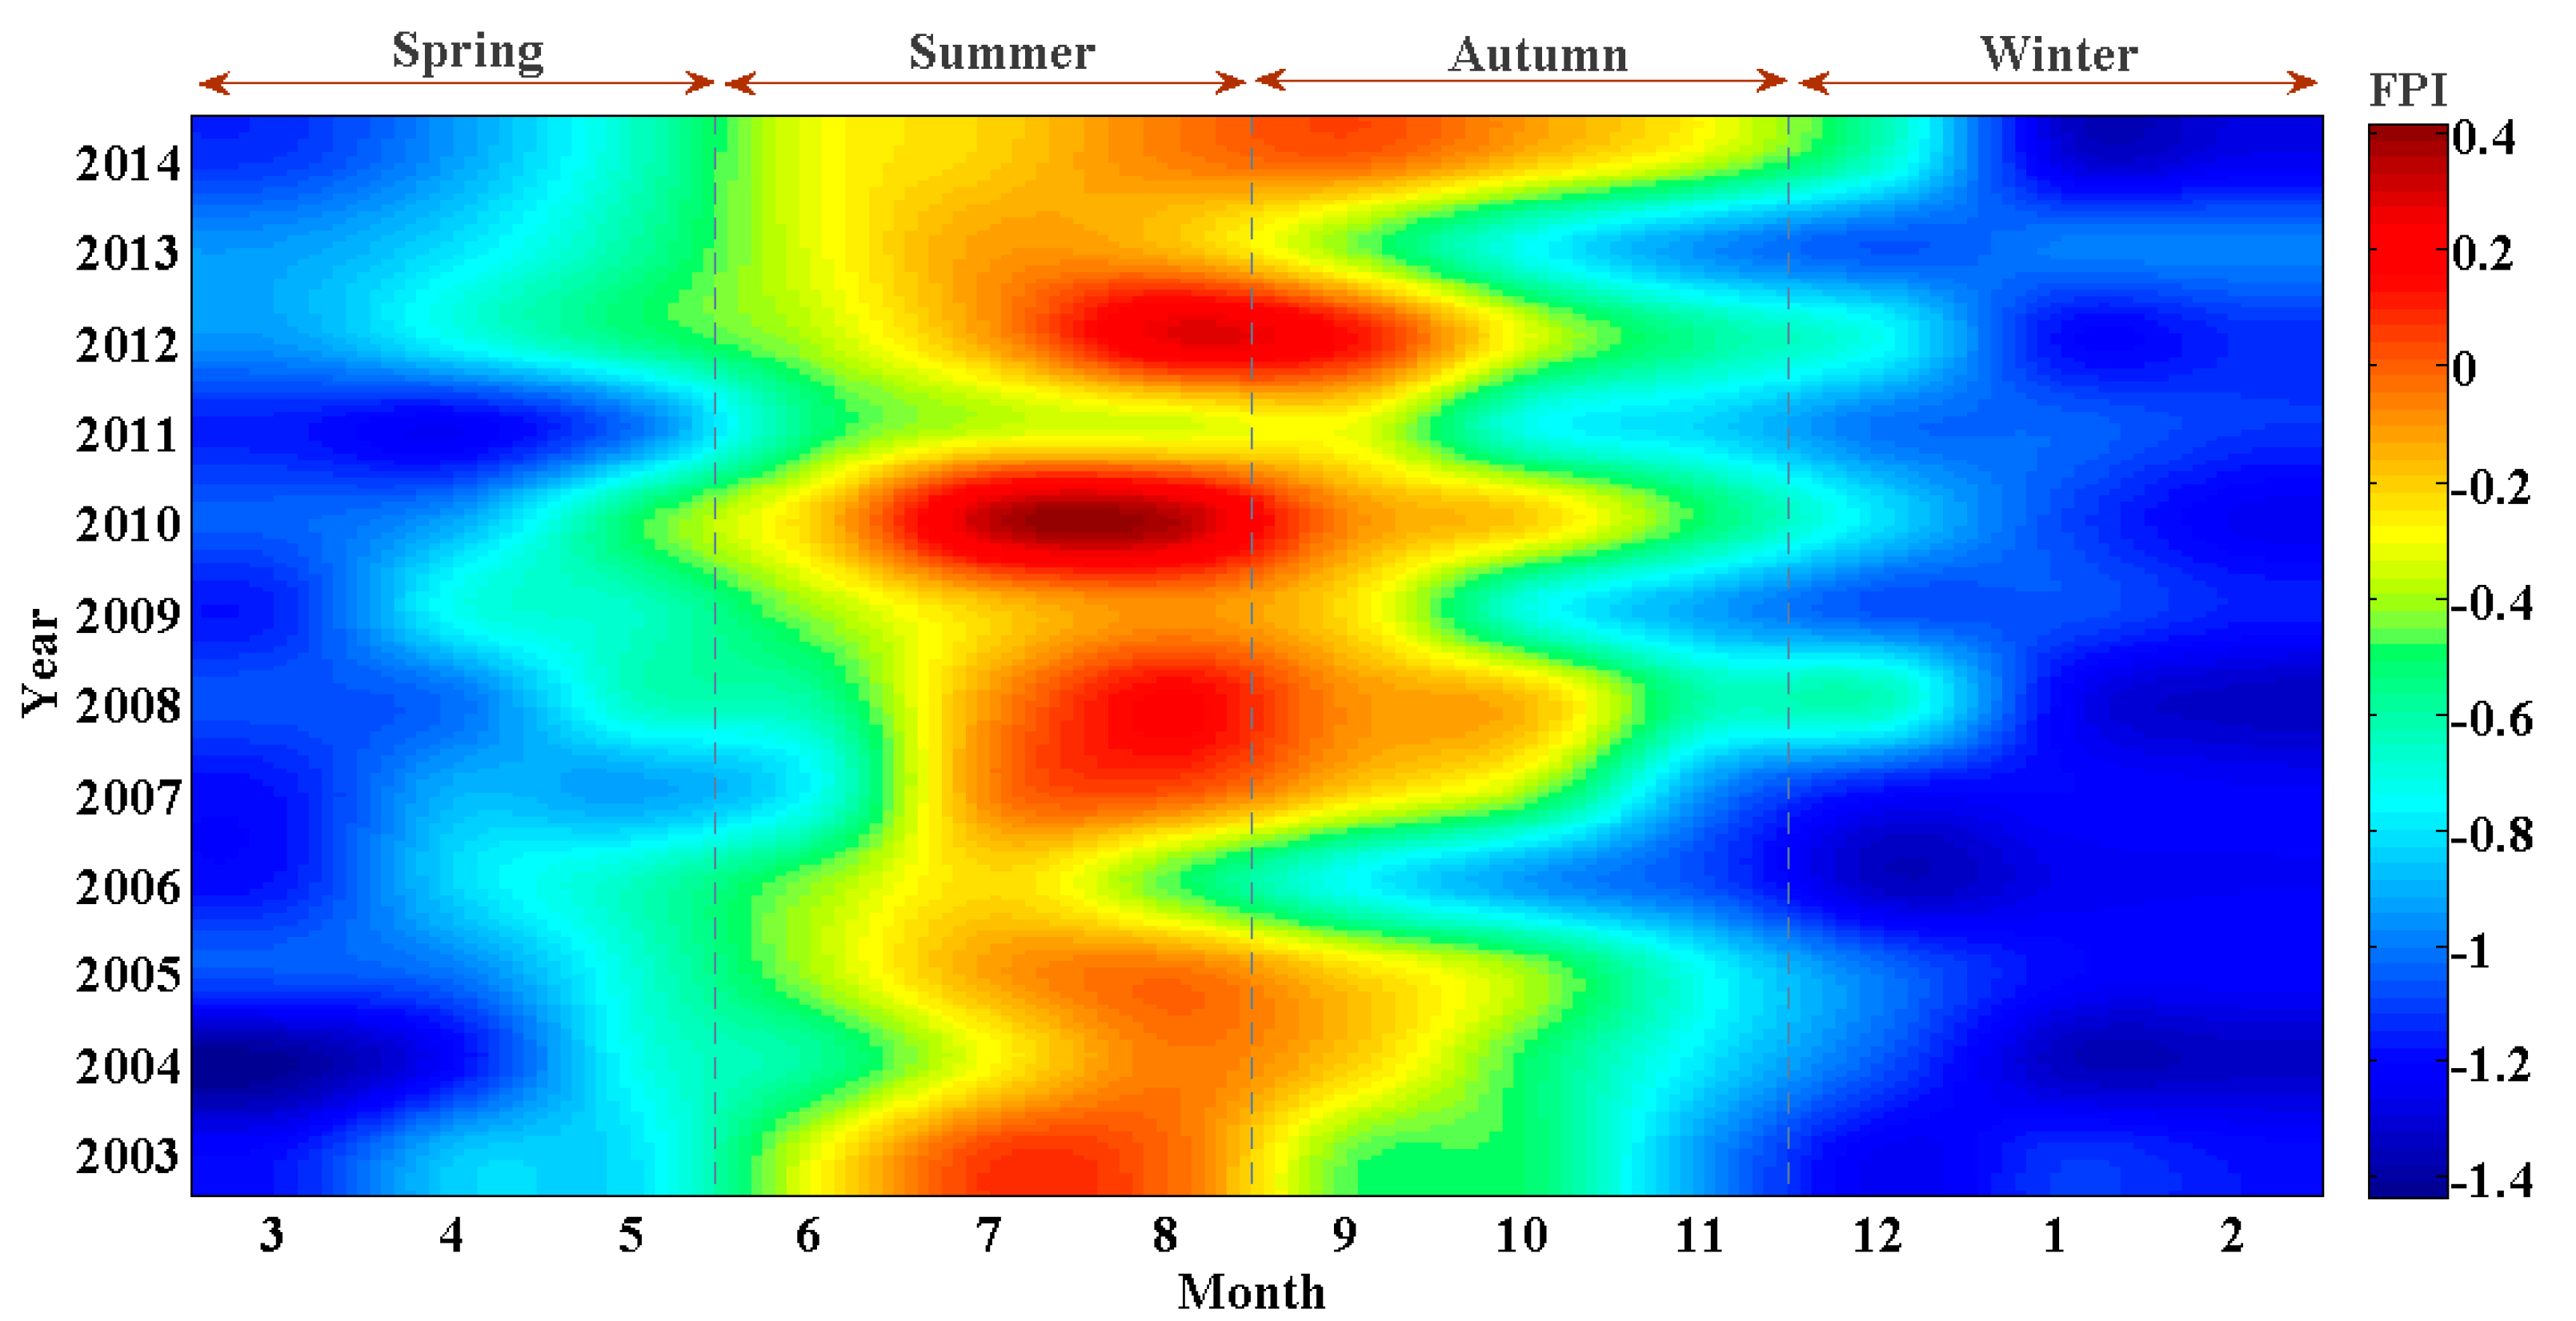
3.3. Flood Confirmation and Analysis

The FPI obtained by the TWSA and precipitation provides a direct indication of the flood potential. Figure 7 shows the overall flood potential and average FPI in the YRB. The FPI is characterized by a large seasonal cycle at basin scale and exhibits important inter-annual variability as a whole. A weak increase in the FPI during 2003–2014 can be seen as the red dotted line in Figure 7. It is more visual of strong seasonal characteristics of flooding in Figure 8, in which shows that almost all flood events occurred during the summer, followed by autumn, and nearly no floods in spring and winter. There is a slight increase from 2003 to 2014, which corresponds to Figure 7. The highest value of PFI is in 2010 summer, meaning that the most serious flood occurred in that time.
Figure 9 presents the inter-annual variations of rainfall (TRMM 3B43), TWSA, discharge and FPI in the YRB. FPI and GRACE TWSA show a similar tendency; peaks of discharge and rainfall are generally in phase, also consistent with FPI and TWSA. Minima/maxima of discharge occur before the minima/maxima of TWSA. Rainfall extremes appear before the discharge in phase. Moreover, the fluctuation of the four time series is weaker before 2009 than after. The scatterplots (Figure 10) between FPI and rainfall/discharge show a strong correlation in all four seasons. However, correlation of FPI-Rainfall is weaker than FPI-Discharge as the spots are more scattered. Six floods based on the definition of FPI are shown in Table 1, along with the associated hydro-meteorological values.
Larger FPI values suggest a higher flood severity and associated larger discharge and rainfall. The FPI peak in July 2010 is believed to reflect the most serious flood event that occurred during the study period, with the highest FPI, discharge and rainfall; this event also recorded higher percent of greater than monthly mean discharge and precipitation. The 2008 Flood shows a higher FPI of 0.17, whereas the discharge is lower and the precipitation is nearly higher, the same situation of percent of greater than monthly mean discharge and precipitation (Table 1). The positive FPI value indicates that a mild flood occurred in 2003, with higher discharge and lower precipitation than 2008. The 2014 event is special in that it happened in autumn, when the rainfall began to decline. Overall, the signatures of the 2010, 2012 and 2008 events with higher FPI appear more clearly on the inter-annual trend profiles of discharge and rainfall than the 2003, 2007 and 2014 events with lower FPI at the basin scale (Figure 9).
On the other hand, as the spatial distribution of FPI can reveal the flood development process, we selected the serious 2010 flood as a case study for spatial analysis (Figure 11). In which a dry–wet–dry pattern occurred from April to November 2010. In April and May, most of the region recorded a low FPI, because the TWSA has a deficit and the precipitation is low (Figure 5). After entering a wet spell from June onward, the basin developed a higher flood risk in the southeast, which extends to most of the basin in July and August. In September, the FPI of the basin declined because the wet spell ends, becoming mostly negative in October, and even lower in November, with a minimum FPI of approximately −6.22 in the lower reaches of the Yangtze River.

4. Discussion

4.1. GRACE Data Evaluation

The high correlation coefficients (mean correlation coefficient of approximately 0.95) obtained for the three gridded products demonstrate the reliability of GRACE data (Figure 2). Using water budget estimates represents one of the most practical ways to evaluate GRACE-derived TWS changes. The correlation coefficient of 0.73, determined for the water budget estimates of TWS changes and the GRACE-derived TWS changes in our study during the period from 2003 to 2014, appears to be similar to other results reported for the YRB in the literature. For example, Long [1] reported a correlation coefficient of 0.77 for these TWS changes during the 2003 to 2013 period. The small difference between the two correlation coefficients (0.73 vs. 0.77) may be attributed to the differences in the examined study periods and/or differences in scaling factors used in GRACE data processing. In addition, the slightly lower values of water budget estimates determined for TWSC than for GRACE-derived TWSC in winter may result from the underestimation of discharge in the water budget calculations as a result of ice and snow formation. The total water storage surplus observed from April to August and the deficit in the remaining months are most likely driven by the precipitation patterns in the YRB, where rainfall is heavier from April to September and the total water storage increases, therefore markedly as a result (Figure 3). Overall, the results demonstrate high confidence for using the GRACE data to assess the YRB.

4.2. GRACE-Derived TWSA Analysis over YRB

GRACE-derived TWSA increased at a rate of 3.04 mm/year, which indicates that the basin has become wetter in recent decades. This finding is in agreement with the results reported by Ding [27]. This increase is most likely caused by the combined effects of the monsoon climate and geological conditions, rather than precipitation, which remained fairly stable (Figure 4). The monthly TWSA and precipitation exhibit similar seasonal cycles (Figure 5), which means that precipitation is heavier in the summer and, as a result, the TWSA increases markedly in the later summer and early autumn. These outcomes indicate that precipitation is the dominant influence on seasonal features of TWSA. Variations in TWSA delay changes in rainfall by one month, and govern the transport processes in the hydrographic network, which are slowed down by the residence of water in the basin’s extensive floodplains.
In terms of the spatial distribution of TWSA’s growth rate, the results revealed that the upper reach of the basin became drier, while the middle and lower reaches become wetter (Figure 6) over time. These changes suggest that the mid-low reaches of the Yangtze River accumulated an increasing amount of water over the study period, indicating a large flood risk in the near future. In fact, these reaches have been the main flood-prone areas of the basin over the past decades [28]. Therefore, paying more attention to these areas is essential for successful flood mitigation in the YRB. Moreover, northern Jiangxi and eastern Hubei, which are located in the mid-low reaches of the YRB, display the highest increases in TWSA (approximately 20.08 mm/year) that may be caused by human activity. For example, Huang [29] has suggested that the Three Gorges Dam has played a critical role in this increase in TWS. Finally, both the source and the outlet of the basin remained stable, with no obvious increases or decreases over the examined time period.

4.3. Flood Analysis Using FPI over YRB

FPI can indicate the flood potential of a basin directly. For example, a weak increase in FPI (Figure 7) suggests a greater flood potential over the basin. In this work, summer was determined as the main season of flood occurrence (Figure 8), followed by autumn. These findings are in agreement with the results reported previously [30,31], which showed that summer is the main flooding season for the YRB. The main stream of the Yangtze River generally trends W–E, and corresponds to the direction of the rain band extension. The entire basin enters the rainy season at the same time as the summer monsoon produces increased rainfall. These changes result in the water level rising rapidly throughout the whole basin; and as the water storage capacity is surpassed, flood formation is induced.
The inter-annual variations (Figure 9) provide additional details of factors related to flood formation. Extremes in discharge occur before the extremes in TWSA as a result of the residence of water in the floodplains. Further, rainfall extremes appear before the discharge extremes, and this observation correlates with the convergence time lag in the basin. The fluctuations in these time series (GRACE, TRMM, discharge and FPI) are weaker before 2009 than after, thus indicating that extreme hydrological events are more frequent after 2009. In cases where satellite-derived products afford good accuracy, other factors such as global climate change and human activities can account for the discrepancies. The strong correlation between FPI and rainfall/discharge (Figure 10) indicates that flood events over the YRB can be confirmed using FPI. The fact that the correlation between FPI and rainfall was weaker than that between FPI and discharge may stem from the delay between FPI and rainfall.
According to the definition of FPI, positive values indicate increased flood potential, and consecutive monthly positive values can in fact be regarded as a likely flood event. Based on this definition, six floods were confirmed during 2003–2014 in the YRB (Table 1). The 2008 flood displayed a significantly lower percentage of discharge values greater than the monthly mean (3.67%) and nearly as higher a percentage of precipitation values greater than the monthly mean (23.12%), which originated most likely as a result of the monthly precipitation happening over a longer period, and providing thus sufficient time for infiltration into the subsurface and reducing any sharp increase in discharge. However, no atypical floods occurred in August 2008 according to the 2008 Bulletin of Flood and Drought Disasters in China [32], thus indicating that the FPI index can misjudge a situation involving high precipitation and TWSA aggregated over a long period as a flood. The positive FPI value (0.05) determined in July 2003 indicates that a mild flood has occurred in this month, with a higher percentage of discharge values greater than the monthly mean (18.50%) and lower percentage of precipitation values greater than the monthly mean (–14.96%). The negative value of percentage precipitation greater than the monthly mean evidences a rainfall deficit in a particular month, and suggests that the mild flood event in July 2003 was possibly induced by a sharp rise in precipitation over a short time, which resulted in a rapid increase in discharge. The 2014 flood has been reported by the 2014 Bulletin of Flood and Drought Disasters in China [33], which describes floods in the autumn of 2014. Additionally, it should be noted that floods with higher FPI can be featured more clearly on the inter-annual trend profiles of discharge and rainfall than floods with lower FPI (Figure 9), which means that FPI allows more reliable monitoring of severe floods than moderate/mild floods. This means, in fact, that it is not prudent to identify moderate/mild flood events based solely on FPI until some improvements can be made in FPI that will allow more accurate assessments of different levels of floods to be made.
The GRACE-derived FPI is capable of detecting flood potential and will be valuable for the improvement of flood predictions [11] as it can adequately record the characteristics of such events on large spatial and temporal scales, including seasonality (Figure 8). However, for some short-lived and small-extent floods which are currently not being detected by GRACE [34], the FPI appears to be less effective. In certain cases, the FPI may even misidentify long-duration precipitation events as floods due to the large TWSA, as occurred in the 2008 flood discussed above. In this case, rainfall occurrence with a smaller time scale (weekly or daily) should be studied. Large TWSAs caused by consecutive weekly or daily precipitation with low runoff would be excluded from the flood confirmation based on FPI. Furthermore, as FPI was first proposed in 2009 [14,35] and is therefore still fairly new to most researchers. As a consequence, FPI is associated with several challenges. For example, the maximum water storage is not accurate for short TWSA time series. Extending GRACE times series in order to optimize the maximum water storage represents a potentially feasible solution to this challenge. To this end, Long [11] and Zhang [17] created an extended TWSA time series using the artificial neural network (ANN) approach in order to examine long-term hydrological characteristics of TWSA. Moreover, it should be noted that this study considered only positive FPI values for flood identification, and it is possible that the negative values of FPI, which were ignored in this study, might indicate some small or short-duration floods. Therefore, improving and optimizing the theory and function of FPI are expected to facilitate more accurate assessment of floods in the future—this work is currently underway in our laboratory.

4.4. Hydrological Evaluation Based on GRACE Data

The initial TWS status is a critical factor affecting the formation of floods [14]. A high TWSA may imply that a large flood potential exists during the rainy season because the subsurface cannot store any additional water. GRACE data are useful for studying extreme problems at large scales, in particular, in fluvial rivers. For smaller scales, and especially for urban environmental studies, however, sufficient data derived from meteorological and hydrological stations can be more reliable for studying hydrological conditions. If such data were not available, more accurate TWSA data and/or other remote sensing data would be required. For example, the Sentinel-3 mission [35] provides surface reflectance data with high spatial and temporal resolution and, therefore, has the potential to allow more accurate monitoring of floods at small scales and in urban environments. At present, GRACE data are mainly applied to the study of hydrological extremes and terrestrial water storage in large regions, and for some parts of the world where hydrological records are in decline for economic and/or political reasons [36]. With the launch of the next generation GRACE Follow-on mission in 2017, which is projected to increase the spatial resolution to less than 50,000 km2 and the temporal resolution to weekly or biweekly [37], it is expected that GRACE data will be used more frequently to monitor and examine floods of different scales, instead of the time-consuming discharge and/or meteorological data obtained from hydro-meteorological stations, leading to considerable improvements of our knowledge of floods.

5. Conclusions

We analyzed hydrological conditions and identified previous flood events in the Yangtze River Basin using gravity data from the twin-satellite Gravity Recovery and Climate Experiment (GRACE) satellite mission, rainfall data from the Tropical Rainfall Measuring Mission (TRMM), and hydrological data from Datong station, China. We calculated the Terrestrial Water Storage Anomaly (TWSA) spatially and temporally from 2003 to 2014 and compared the results to other indicators of flood potential and rainfall occurrence, with the following conclusions:
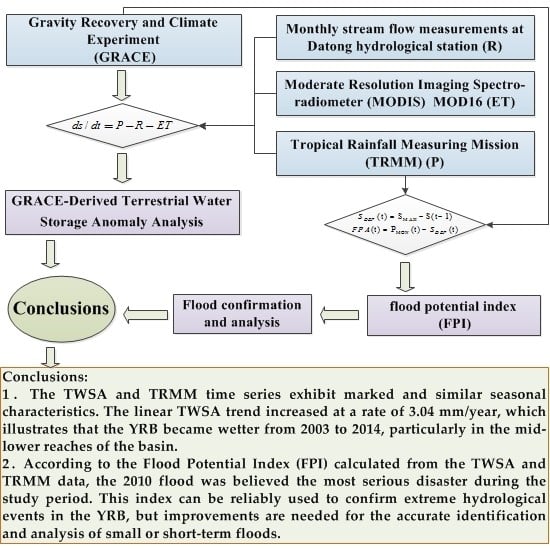
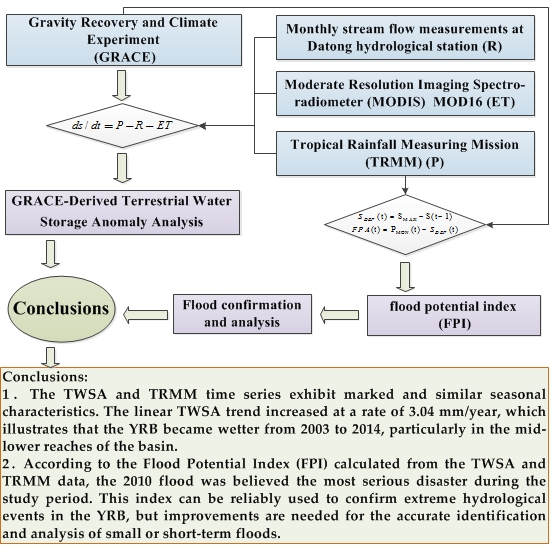
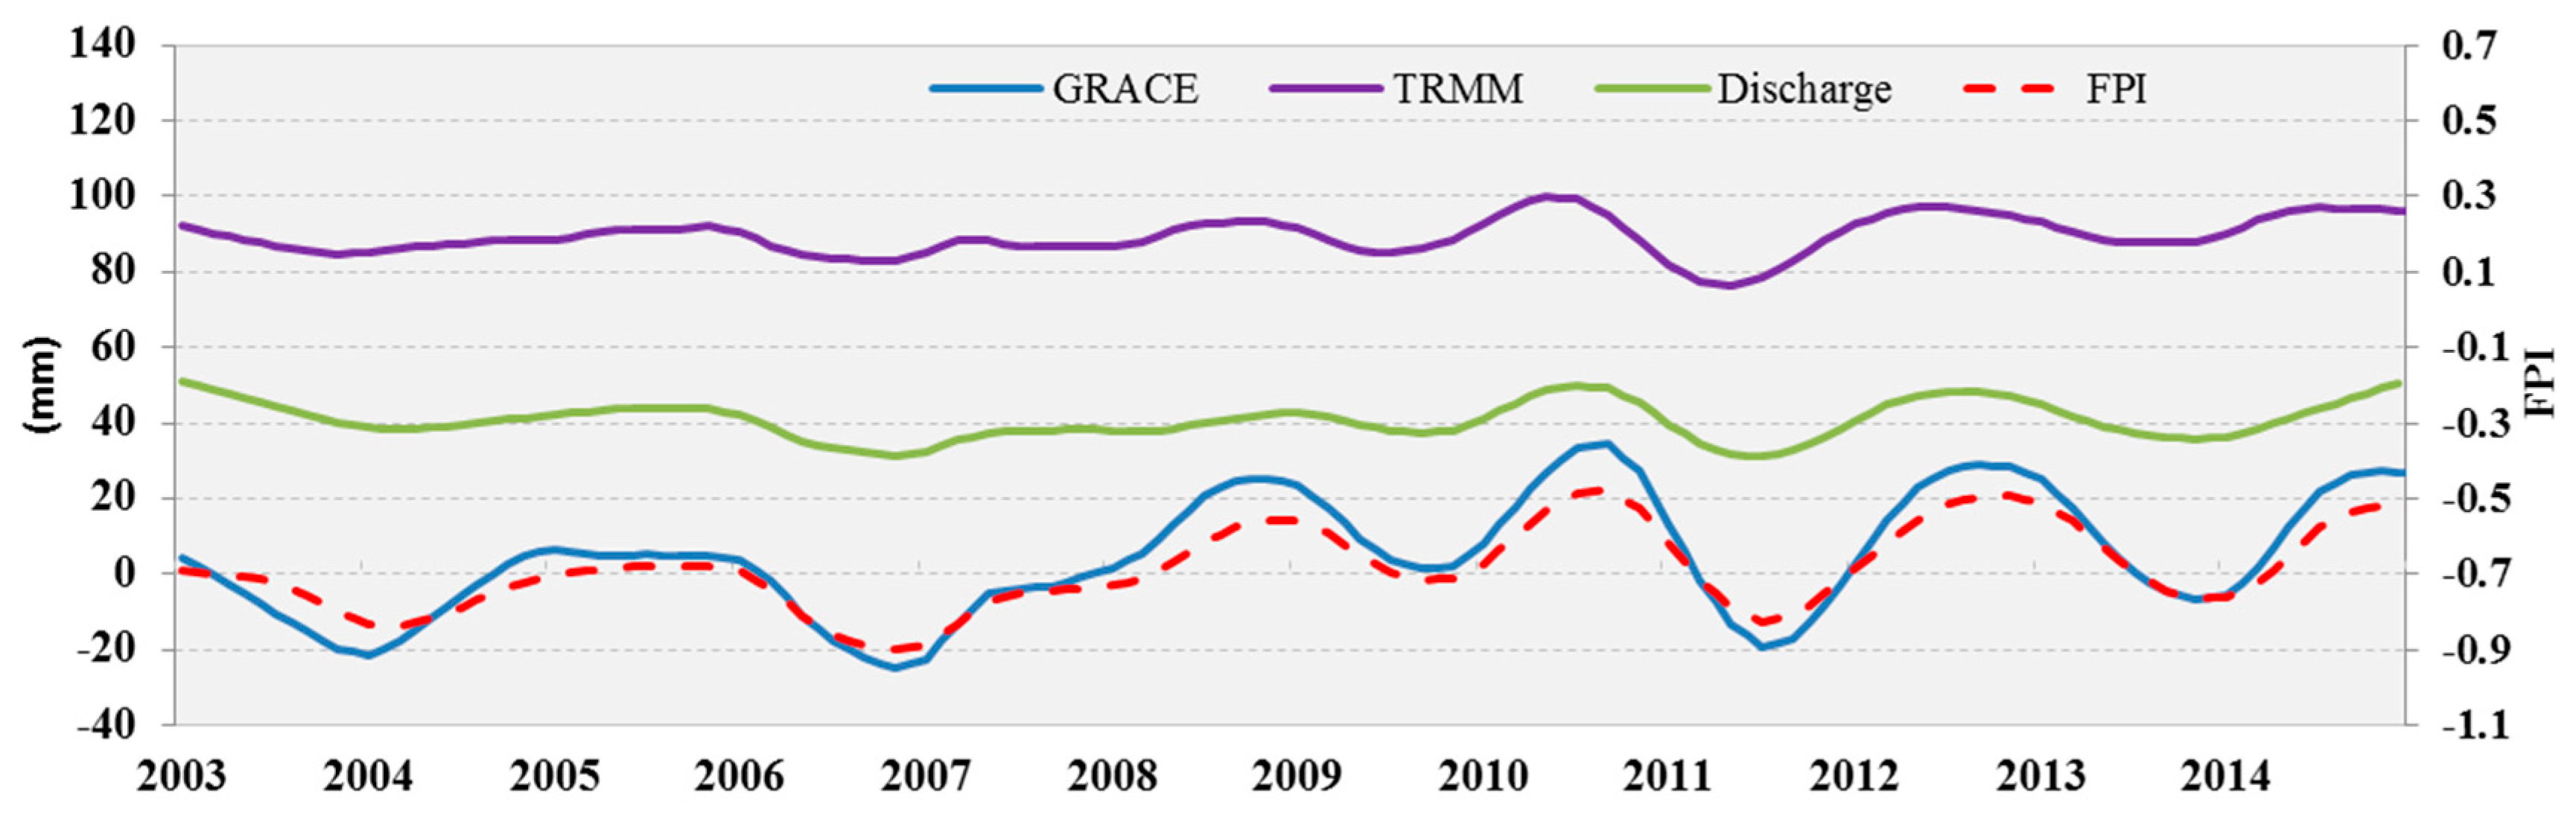
  • The TWSA and TRMM time series exhibit marked and similar seasonal characteristics, with summer peaks and winter troughs, which demonstrate that precipitation is likely the dominant cause of changes in the TWSA. The linear TWSA trend increased at a rate of 3.04 mm/year, which illustrates that the YRB became wetter from 2003 to 2014, particularly in the mid-lower reaches of the basin, where the maximum linear TWSA trend was 20.08 mm/year.
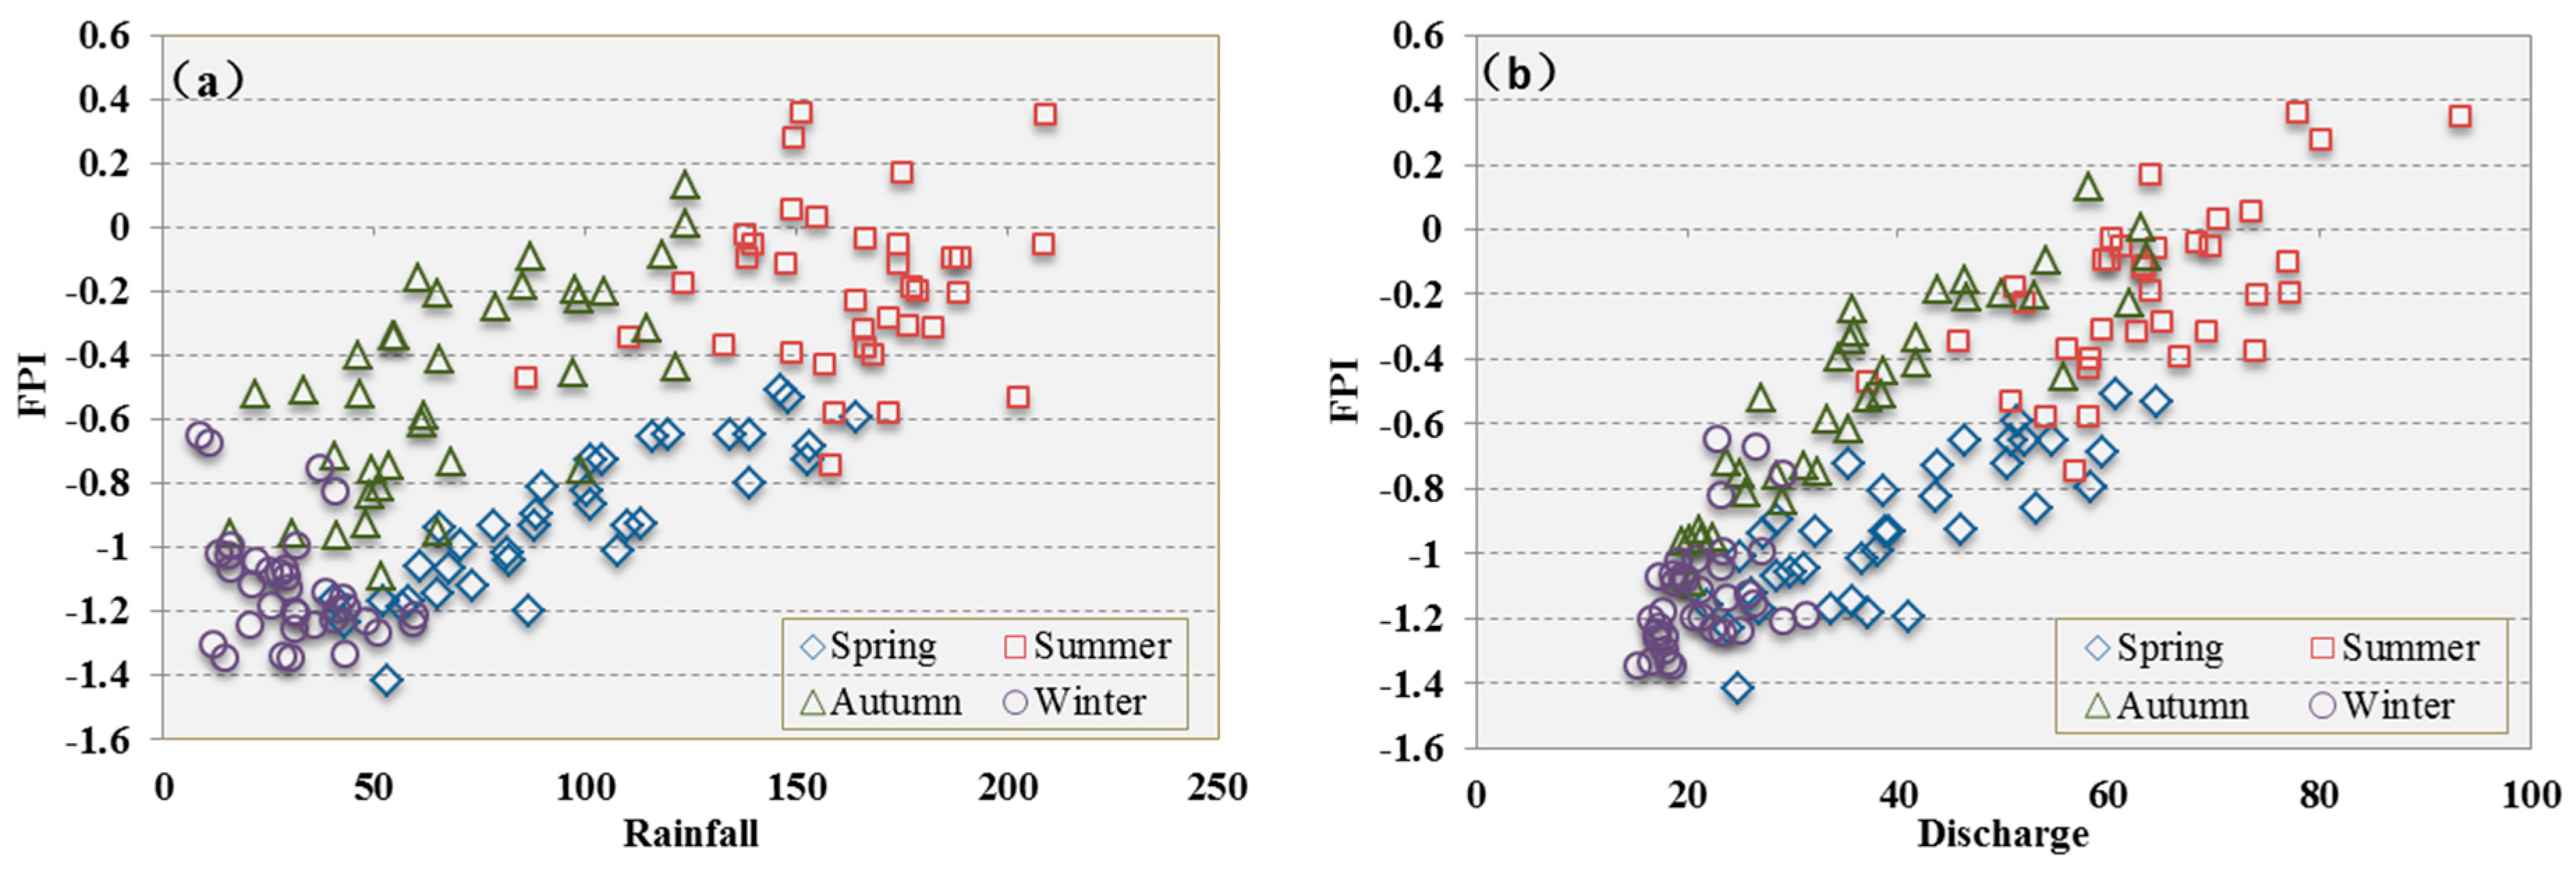
  • According to the Flood Potential Index (FPI) calculated from the TWSA and TRMM data, the 2010 flood was believed the most serious disaster during the study period, with the biggest FPI of 0.36, discharge of 93.32 mm, and rainfall of 209.03 mm, the percent of bigger than monthly mean discharge and precipitation also remain the larger value, 37.95% and 19.44%, respectively. This index can be reliably used to confirm extreme hydrological events in the YRB, but improvements are needed for the accurate identification and analysis of small or short-term floods.
GRACE-derived TWSA data is widely available and can be easily used to assess hydrological extremes in large-scale areas. They may be less accurate for assessing hydrological situations in smaller regions. However, the procedure proposed in this study is a good substitute source for meteorological and hydrological data for large areas where observation stations are rare or scarce, meaning that this methodology can evaluate hydrological states more efficiently and conveniently. Moreover, additional previous studies have claimed that GRACE data have great potential for the detection and analysis of extreme hydrological events and are valuable for the further improvement of flood prediction. With the development of next-generation GRACE satellites, monitoring TWS conditions and flood dynamics at different scales would be possible. On the other hand, although GRACE-derived FPI cannot identify flood events entirely accurately, it provides a useful reference for flood studies based on GRACE data. Future research should focus on improving the methodology for handling TWSA and FPI data in order to increase the spatial and temporal resolution of this approach.

Acknowledgments

This work was supported by the National Natural Science Foundation for Distinguished Young Scholars of China (Grant No. 41401479) and the Major Project of High-Resolution Earth Observation System. The authors would like to thank GRACE Tellus for providing the GLDAS data (http://grace.jpl.nasa.gov), hosted by the Goddard Earth Sciences Data and Information Services Center. GRACE land data were provided by the NASA MEaSUREs Program and are available at http://grace.jpl.nasa.gov. We thank the Goddard Space Flight Center of NASA for providing TRMM data and the China Meteorological Administration (http://data.cma.cn/) for providing the meteorological data of 150 stations. We also thank the Yangtze River Hydrological Bureau of China for the monthly streamflow time series from Datong hydrological station.

Author Contributions

Zhangli Sun and Xiufang Zhu conceived of the study and designed the experiments; Zhangli Sun performed the experiments; Jinshui Zhang and Yaozhong Pan analyzed the data; Zhangli Sun wrote the paper.

Conflicts of Interest

The authors declare no conflict of interest.

References

  1. Long, D.; Yang, Y.; Wada, Y.; Hong, Y.; Liang, W.; Chen, Y.; Yong, B.; Hou, A.; Wei, J.; Chen, L. Deriving scaling factors using a global hydrological model to restore grace total water storage changes for China’s yangtze river basin. Remote Sens. Environ. 2015, 168, 177–193. [Google Scholar] [CrossRef]
  2. Famiglietti, J.S. Remote sensing of terrestrial water storage, soil moisture and surface waters. State Planet Front. Chall. Geophys. 2004, 197–207. [Google Scholar] [CrossRef]
  3. Tapley, B.D.; Bettadpur, S.; Ries, J.C.; Thompson, P.F.; Watkins, M.M. Grace measurements of mass variability in the earth system. Science 2004, 305, 503–505. [Google Scholar] [CrossRef] [PubMed]
  4. Andersen, O.B.; Seneviratne, S.I.; Hinderer, J.; Viterbo, P. Grace-derived terrestrial water storage depletion associated with the 2003 european heat wave. Geophys. Res. Lett. 2005, 32. [Google Scholar] [CrossRef]
  5. Frappart, F.; Ramillien, G.; Ronchail, J. Changes in terrestrial water storage versus rainfall and discharges in the amazon basin. Int. J. Climatol. 2013, 33, 3029–3046. [Google Scholar] [CrossRef] [Green Version]
  6. Tong, J.; Qiang, Z.; Deming, Z.; Yijin, W. Yangtze floods and droughts (china) and teleconnections with enso activities (1470–2003). Quat. Int. 2006, 144, 29–37. [Google Scholar] [CrossRef]
  7. Xie, N.; Xin, J.; Liu, S. China’s regional meteorological disaster loss analysis and evaluation based on grey cluster model. Nat. Hazards 2013, 71, 1067–1089. [Google Scholar] [CrossRef]
  8. Joshi, N.; Baumann, M.; Ehammer, A.; Fensholt, R.; Grogan, K.; Hostert, P.; Jepsen, M.; Kuemmerle, T.; Meyfroidt, P.; Mitchard, E.; et al. A review of the application of optical and radar remote sensing data fusion to land use mapping and monitoring. Remote Sens. 2016, 8, 70. [Google Scholar] [CrossRef]
  9. Wang, S.; Zhou, F.; Russell, H. Estimating snow mass and peak river flows for the mackenzie river basin using grace satellite observations. Remote Sens. 2017, 9, 256. [Google Scholar] [CrossRef]
  10. Famiglietti, J.S.; Lo, M.; Ho, S.L.; Bethune, J.; Anderson, K.J.; Syed, T.H.; Swenson, S.C.; de Linage, C.R.; Rodell, M. Satellites measure recent rates of groundwater depletion in california’s central valley. Geophys. Res. Lett. 2011, 38. [Google Scholar] [CrossRef]
  11. Long, D.; Shen, Y.; Sun, A.; Hong, Y.; Longuevergne, L.; Yang, Y.; Li, B.; Chen, L. Drought and flood monitoring for a large karst plateau in southwest china using extended grace data. Remote Sens. Environ. 2014, 155, 145–160. [Google Scholar] [CrossRef]
  12. Chen, J.; Wilson, C.R.; Tapley, B.D. The 2009 exceptional amazon flood and interannual terrestrial water storage change observed by grace. Water Resour. Res. 2010, 46. [Google Scholar] [CrossRef]
  13. Tangdamrongsub, N.; Ditmar, P.G.; Steele-Dunne, S.C.; Gunter, B.C.; Sutanudjaja, E.H. Assessing total water storage and identifying flood events over tonle sap basin in cambodia using grace and modis satellite observations combined with hydrological models. Remote Sens. Environ. 2016, 181, 162–173. [Google Scholar] [CrossRef]
  14. Reager, J.T.; Famiglietti, J.S. Global terrestrial water storage capacity and flood potential using grace. Geophys. Res. Lett. 2009, 36. [Google Scholar] [CrossRef]
  15. Molodtsova, T.; Molodtsov, S.; Kirilenko, A.; Zhang, X.D.; VanLooy, J. Evaluating flood potential with grace in the united states. Nat. Hazards Earth Syst. Sci. 2016, 16, 1011–1018. [Google Scholar] [CrossRef]
  16. Zhang, Z.; Chao, B.F.; Chen, J.; Wilson, C.R. Terrestrial water storage anomalies of yangtze river basin droughts observed by grace and connections with enso. Glob. Planet. Chang. 2015, 126, 35–45. [Google Scholar] [CrossRef]
  17. Zhang, D.; Zhang, Q.; Werner, A.D.; Liu, X. Grace-based hydrological drought evaluation of the yangtze river basin, china. J. Hydrometeorol. 2016, 17, 811–828. [Google Scholar] [CrossRef]
  18. Grace Tellus Monthly Mass Grids—Land. Available online: http://grace.jpl.nasa.gov/ (accessed on 18 March 2017).
  19. Landerer, F.W.; Swenson, S.C. Accuracy of scaled grace terrestrial water storage estimates. Water Resour. Res. 2012, 48. [Google Scholar] [CrossRef]
  20. Huffman, G.J.; Bolvin, D.T.; Nelkin, E.J.; Wolff, D.B.; Adler, R.F.; Gu, G.; Hong, Y.; Bowman, K.P.; Stocker, E.F. The trmm multisatellite precipitation analysis (tmpa): Quasi-global, multiyear, combined-sensor precipitation estimates at fine scales. J. Hydrometeorol. 2007, 8, 38–55. [Google Scholar] [CrossRef]
  21. Precipitation Measurement Missions Trmm Data Downloads Level 3. Available online: https://pmm.nasa.gov/data-access/downloads/trmm (accessed on 3 March 2017).
  22. Mod16a2_monthly. Merra_gmao_1kmalb. Available online: http://files.ntsg.umt.edu/data/NTSG_Products/MOD16/MOD16A2_MONTHLY.MERRA_GMAO_1kmALB/ (accessed on 7 March 2017).
  23. Oliveira, P.T.S.; Nearing, M.A.; Moran, M.S.; Goodrich, D.C.; Wendland, E.; Gupta, H.V. Trends in water balance components across the brazilian cerrado. Water Resour. Res. 2014, 50, 7100–7114. [Google Scholar] [CrossRef]
  24. Long, D.; Longuevergne, L.; Scanlon, B.R. Uncertainty in evapotranspiration from land surface modeling, remote sensing, and grace satellites. Water Resour. Res. 2014, 50, 1131–1151. [Google Scholar] [CrossRef]
  25. Cleveland, R.B.; Cleveland, W.S.; Terpenning, I. STL: A seasonal-trend decomposition procedure based on loess. J. Off. Stat. 1990, 6, 3–33. [Google Scholar]
  26. Bergmann, I.; Ramillien, G.; Frappart, F. Climate-driven interannual ice mass evolution in greenland. Glob. Planet. Chang. 2012, 82–83, 1–11. [Google Scholar] [CrossRef]
  27. Yihui, D.; Guoyu, R.; Guangyu, S.; Peng, G.; Xunhua, Z.; Panmao, Z.; De’er, Z.; Zongci, Z.; Shaowu, W.; Huijun, W. China’s national assessment report on climate change (i): Climate change in china and the future trend. Adv. Clim. Chang. Res. 2007, 3, 1–5. [Google Scholar]
  28. Wang, Z.; Ding, Y. Climatic features of intraseasonal oscillations of summer rainfalls over mid-lower reaches of the yangtze river in the flood and drought years. J. Appl. Meteorol. Sci. 2008, 19, 710–715. [Google Scholar]
  29. Huang, M.Y.; Salama, D.I.S.; Krol, D.M.S.; Velde, D.I.R.V.D.; Hoekstra, P.D.I.A.Y.; Zhou, Y.; Su, P.D.Z. Analysis of long-term terrestrial water storage variations in the yangtze river basin. Hydrol. Earth Syst. Sci. 2013, 17, 1985–2000. [Google Scholar] [CrossRef]
  30. Zhang, Q.; Xu, C.-Y.; Jiang, T.; Wu, Y. Possible influence of enso on annual maximum streamflow of the yangtze river, china. J. Hydrol. 2007, 333, 265–274. [Google Scholar] [CrossRef]
  31. Zhang, Q.; Xu, C.-Y.; Zhang, Z.; Chen, Y.D.; Liu, C.-L.; Lin, H. Spatial and temporal variability of precipitation maxima during 1960–2005 in the yangtze river basin and possible association with large-scale circulation. J. Hydrol. 2008, 353, 215–227. [Google Scholar] [CrossRef]
  32. Office of State Flood Control and Drought Relief Headquarters; 2008 Bulletin of Flood and Drought Disaster in China; The Ministry of Water Resources of the People’s Repulbic of China: Beijing, China, 2009.
  33. Office of State Flood Control and Drought Relief Headquarters; The Ministry of Water Resources of the People’s Repulbic of China: Beijing, China, 2015.
  34. Dutt Vishwakarma, B.; Jain, K.; Sneeuw, N.; Devaraju, B. Mumbai 2005, bihar 2008 flood reflected in mass changes seen by grace satellites. J. Indian Soc. Remote Sens. 2013, 41, 687–695. [Google Scholar] [CrossRef]
  35. Donlon, C.; Berruti, B.; Buongiorno, A.; Ferreira, M.-H.; Féménias, P.; Frerick, J.; Goryl, P.; Klein, U.; Laur, H.; Mavrocordatos, C. The global monitoring for environment and security (gmes) sentinel-3 mission. Remote Sens. Environ. 2012, 120, 37–57. [Google Scholar] [CrossRef]
  36. Gleason, C.J.; Garambois, P.A.; Durand, M.T. Tracking river flows from space. Eos 2017, 98. [Google Scholar] [CrossRef]
  37. Famiglietti, J.S.; Rodell, M. Water in the balance. Science 2013, 340, 1300–1301. [Google Scholar] [CrossRef] [PubMed]
Figure 1. The Yangtze River Basin in China.
Remotesensing 09 01011 g001
Figure 2. Terrestrial Water Storage Anomaly time series for three gridded data products (Texas Center for Space Research, CSR; the Jet Propulsion Laboratory, JPL; and the German Research Centre for Geosciences, GFZ) in the Yangtze River Basin.
Remotesensing 09 01011 g002
Figure 3. Comparison of terrestrial water storage change (TWSC) in the Yangtze River Basin from 2003 to 2014, derived from Gravity Recovery and Climate Experiment (GRACE) data and water budget estimates.
Remotesensing 09 01011 g003
Figure 4. Time series and linear trends of the GRACE-derived terrestrial water storage anomaly (TWSA) and satellite precipitation product (TRMM) in the Yangtze River Basin.
Remotesensing 09 01011 g004
Figure 5. Seasonal characteristics of (a) monthly precipitation derived from TRMM-3B43 data and (b) the GRACE-derived terrestrial water storage anomaly (TWSA) in the Yangtze River Basin from 2003 to 2014.
Remotesensing 09 01011 g005
Figure 6. Spatial distribution of the linear trend of the terrestrial water storage anomaly (TWSA) in the Yangtze River Basin from August 2002 to March 2014.
Remotesensing 09 01011 g006
Figure 7. Time series of flood potential index (FPI, blue line) and associated inter-annual trends from Seasonal and Trend decomposition using Loess (STL) decomposition (red dotted line) of the Yangtze River Basin.
Remotesensing 09 01011 g007
Figure 8. Seasonal variations of flooding (flood potential index, FPI) in the Yangtze River Basin from 2003 to 2014.
Remotesensing 09 01011 g008
Figure 9. Time series of inter-annual variations of monthly rainfall from TRMM 3B43, GRACE-based TWSA, and monthly discharge from 2003-2014 in the Yangtze River Basin.
Remotesensing 09 01011 g009
Figure 10. Scatterplots between (a) monthly rainfall from TRMM 3B43 and FPI and (b) discharge from Datong station and FPI from 2003-2014 in the Yangtze River Basin.
Remotesensing 09 01011 g010
Figure 11. Spatial distribution of the flood potential index (FPI) for the Yangtze River Basin from April to November 2010.
Remotesensing 09 01011 g011
Table 1. Flood events identified by flood potential index and their associated hydro-meteorological values in the Yangtze River Basin.
No.TimeFPIDischarge/mm(Percent of Greater than Monthly Mean Discharge)Rainfall/mm(Percent of Greater than Monthly Mean Precipitation)
1July–August 20100.3693.32 (37.95%)209.03 (19.44%)
2August–September 20120.2880.10 (29.75%)149.30 (4.94%)
3August 20080.1764.00 (3.67%)175.17 (23.12%)
4July 20030.0573.64 (18.50%)148.82 (−14.96%)
5August 20070.0370.46 (14.13%)154.94 (8.91%)
6September 20140.0163.08 (27.27%)123.66 (17.38%)

