
Aboveground Biomass Estimation of Individual Trees in a Coastal Planted Forest Using Full-Waveform Airborne Laser Scanning Data


Abstract
:
1. Introduction
2. Methods
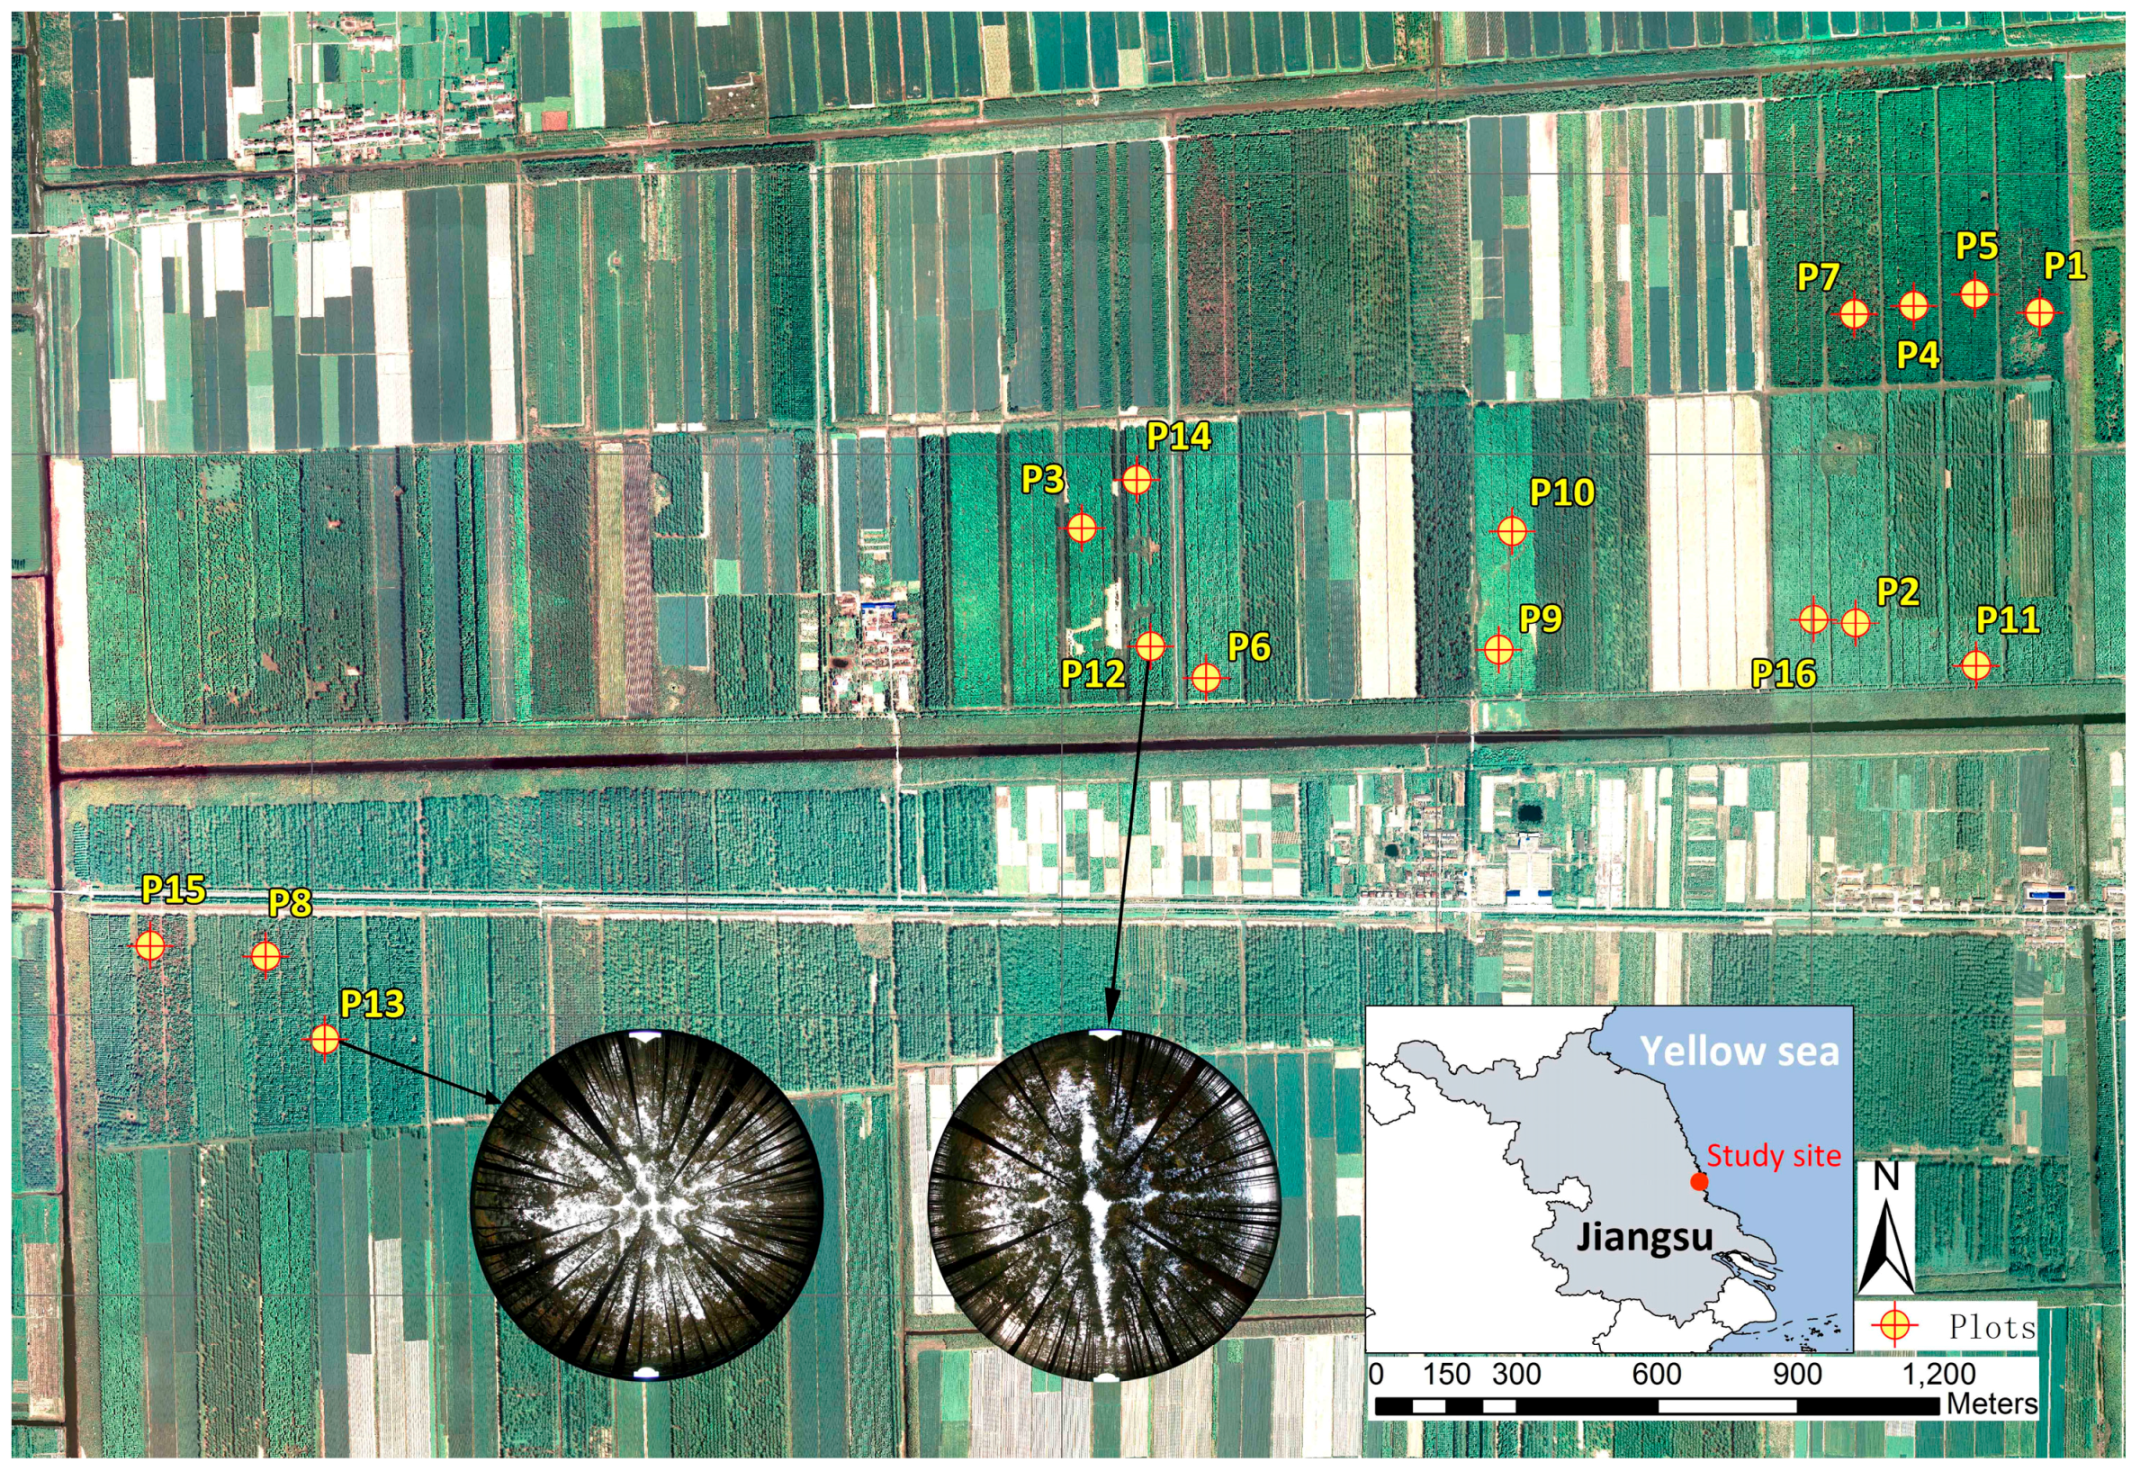
2.1. Study Area and Field Data
2.2. ALS Data
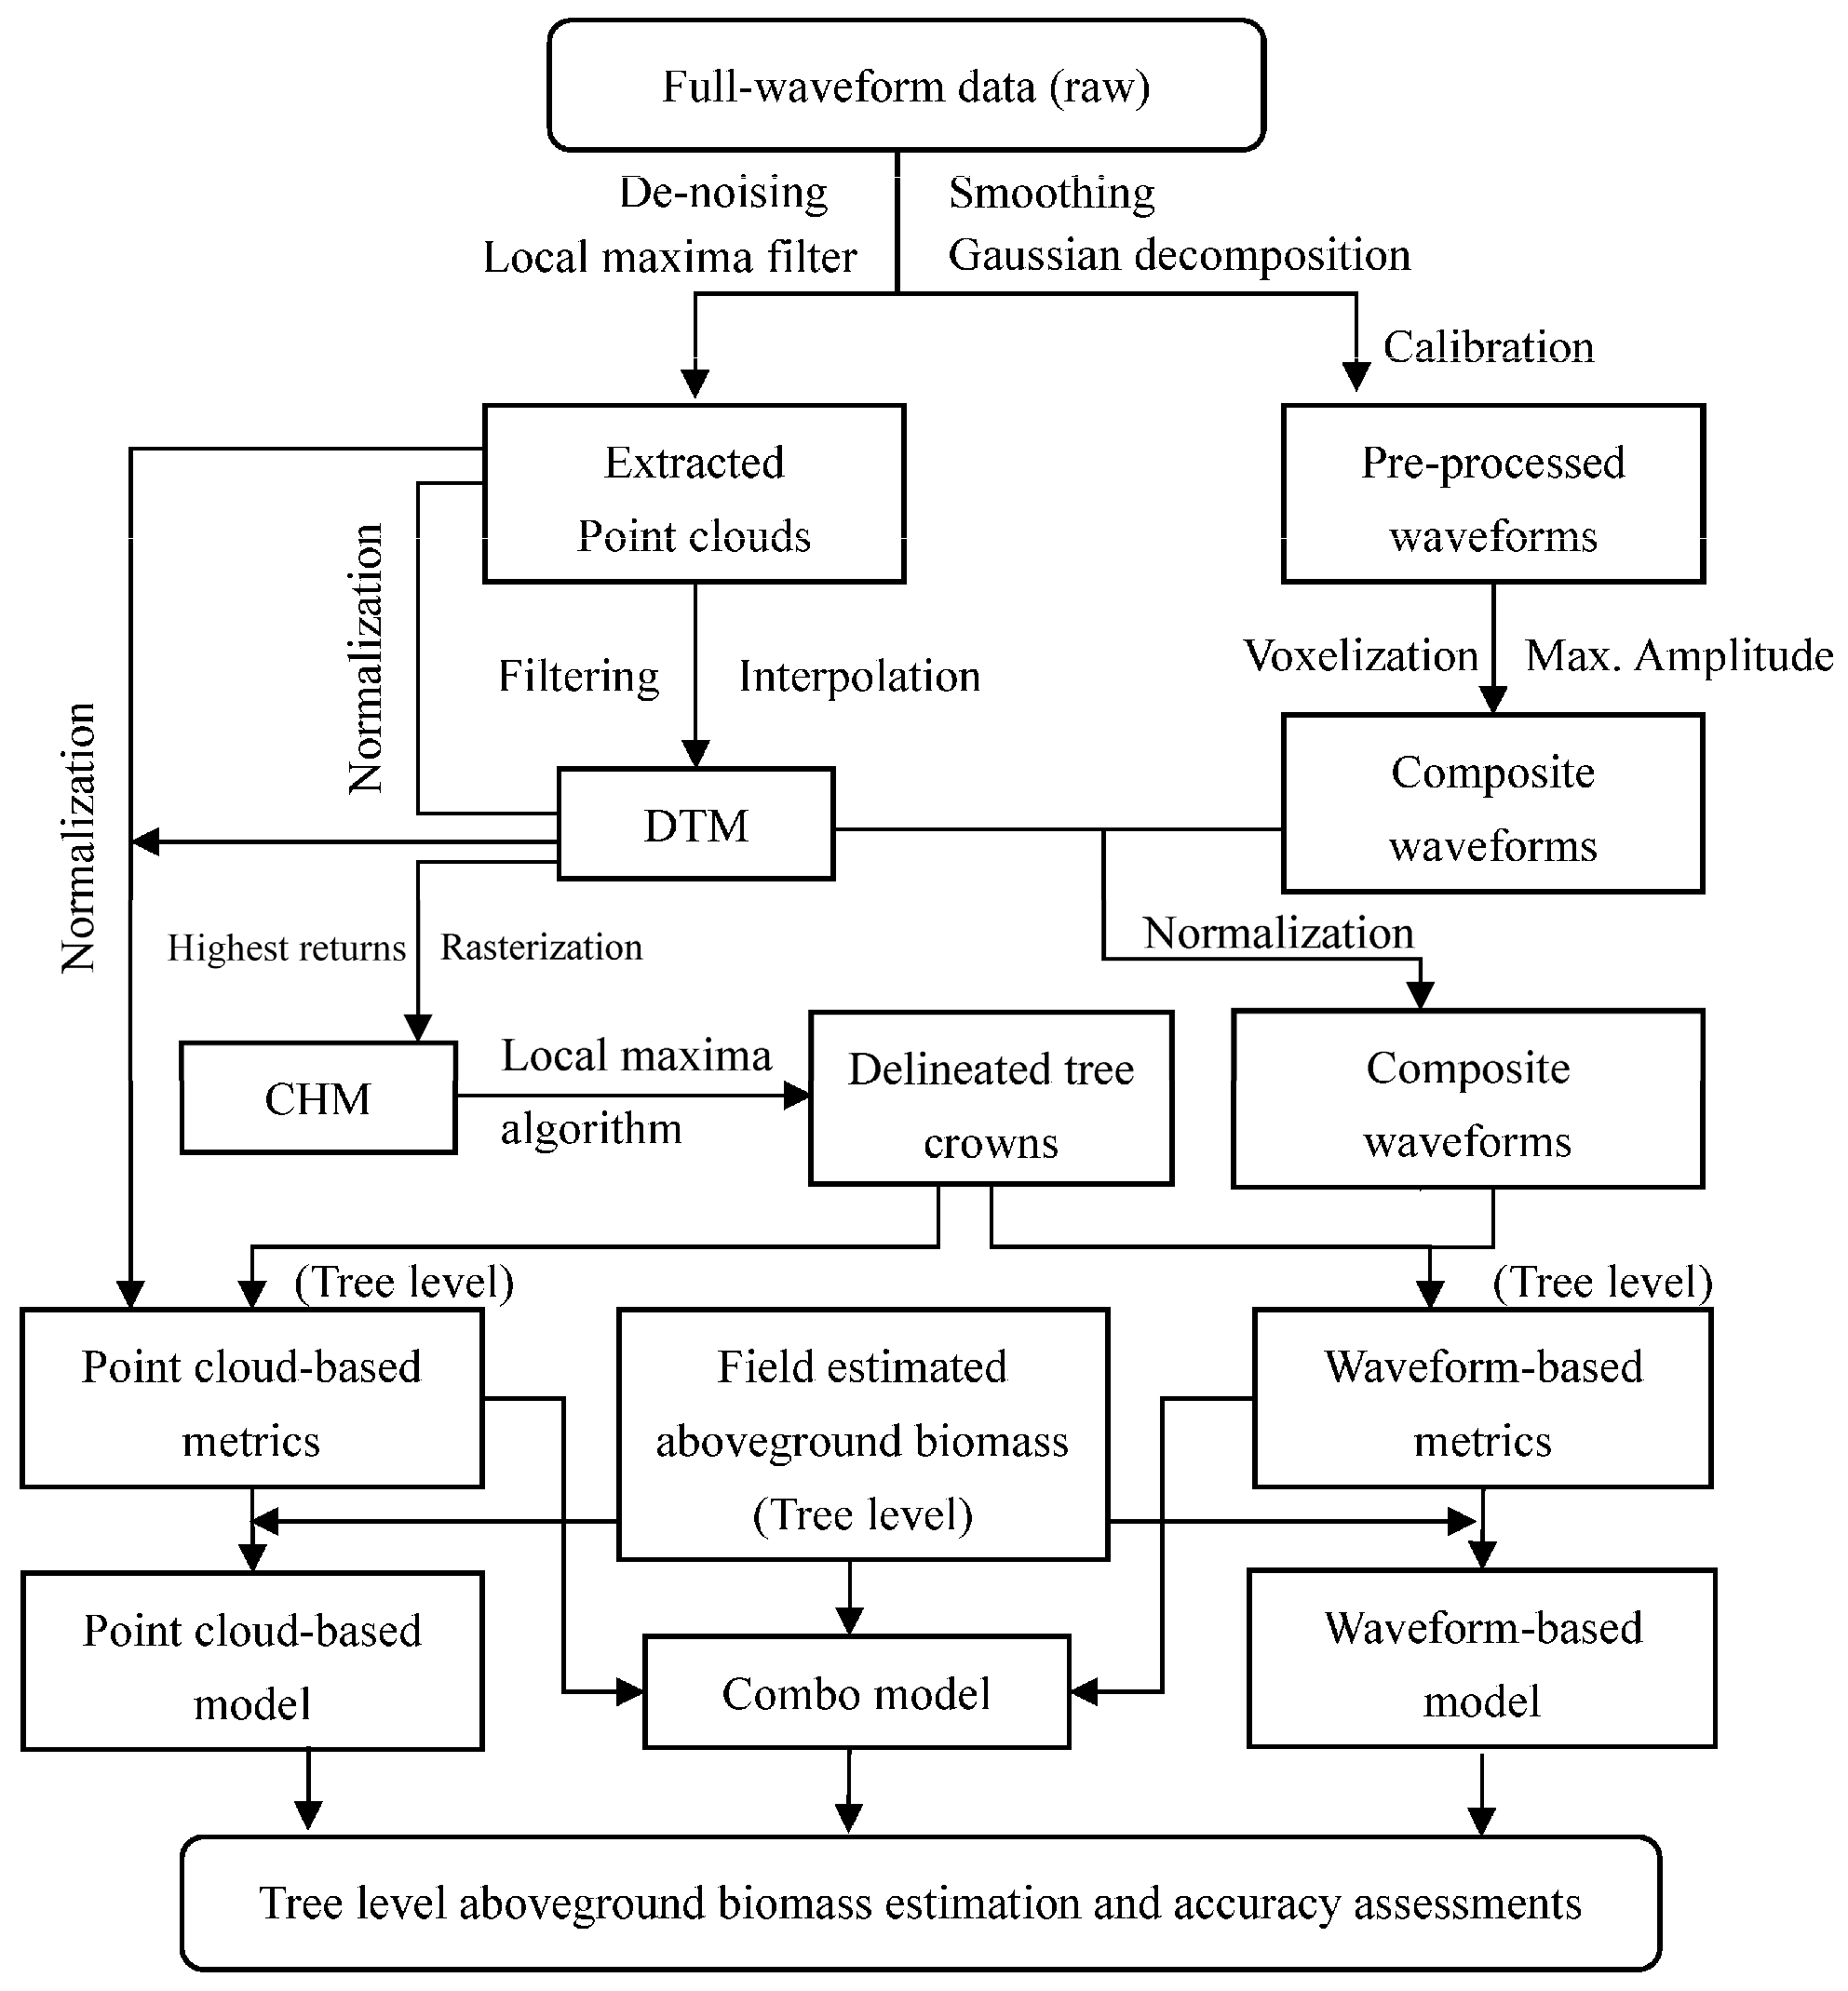
2.3. ALS Data Pre-Processing
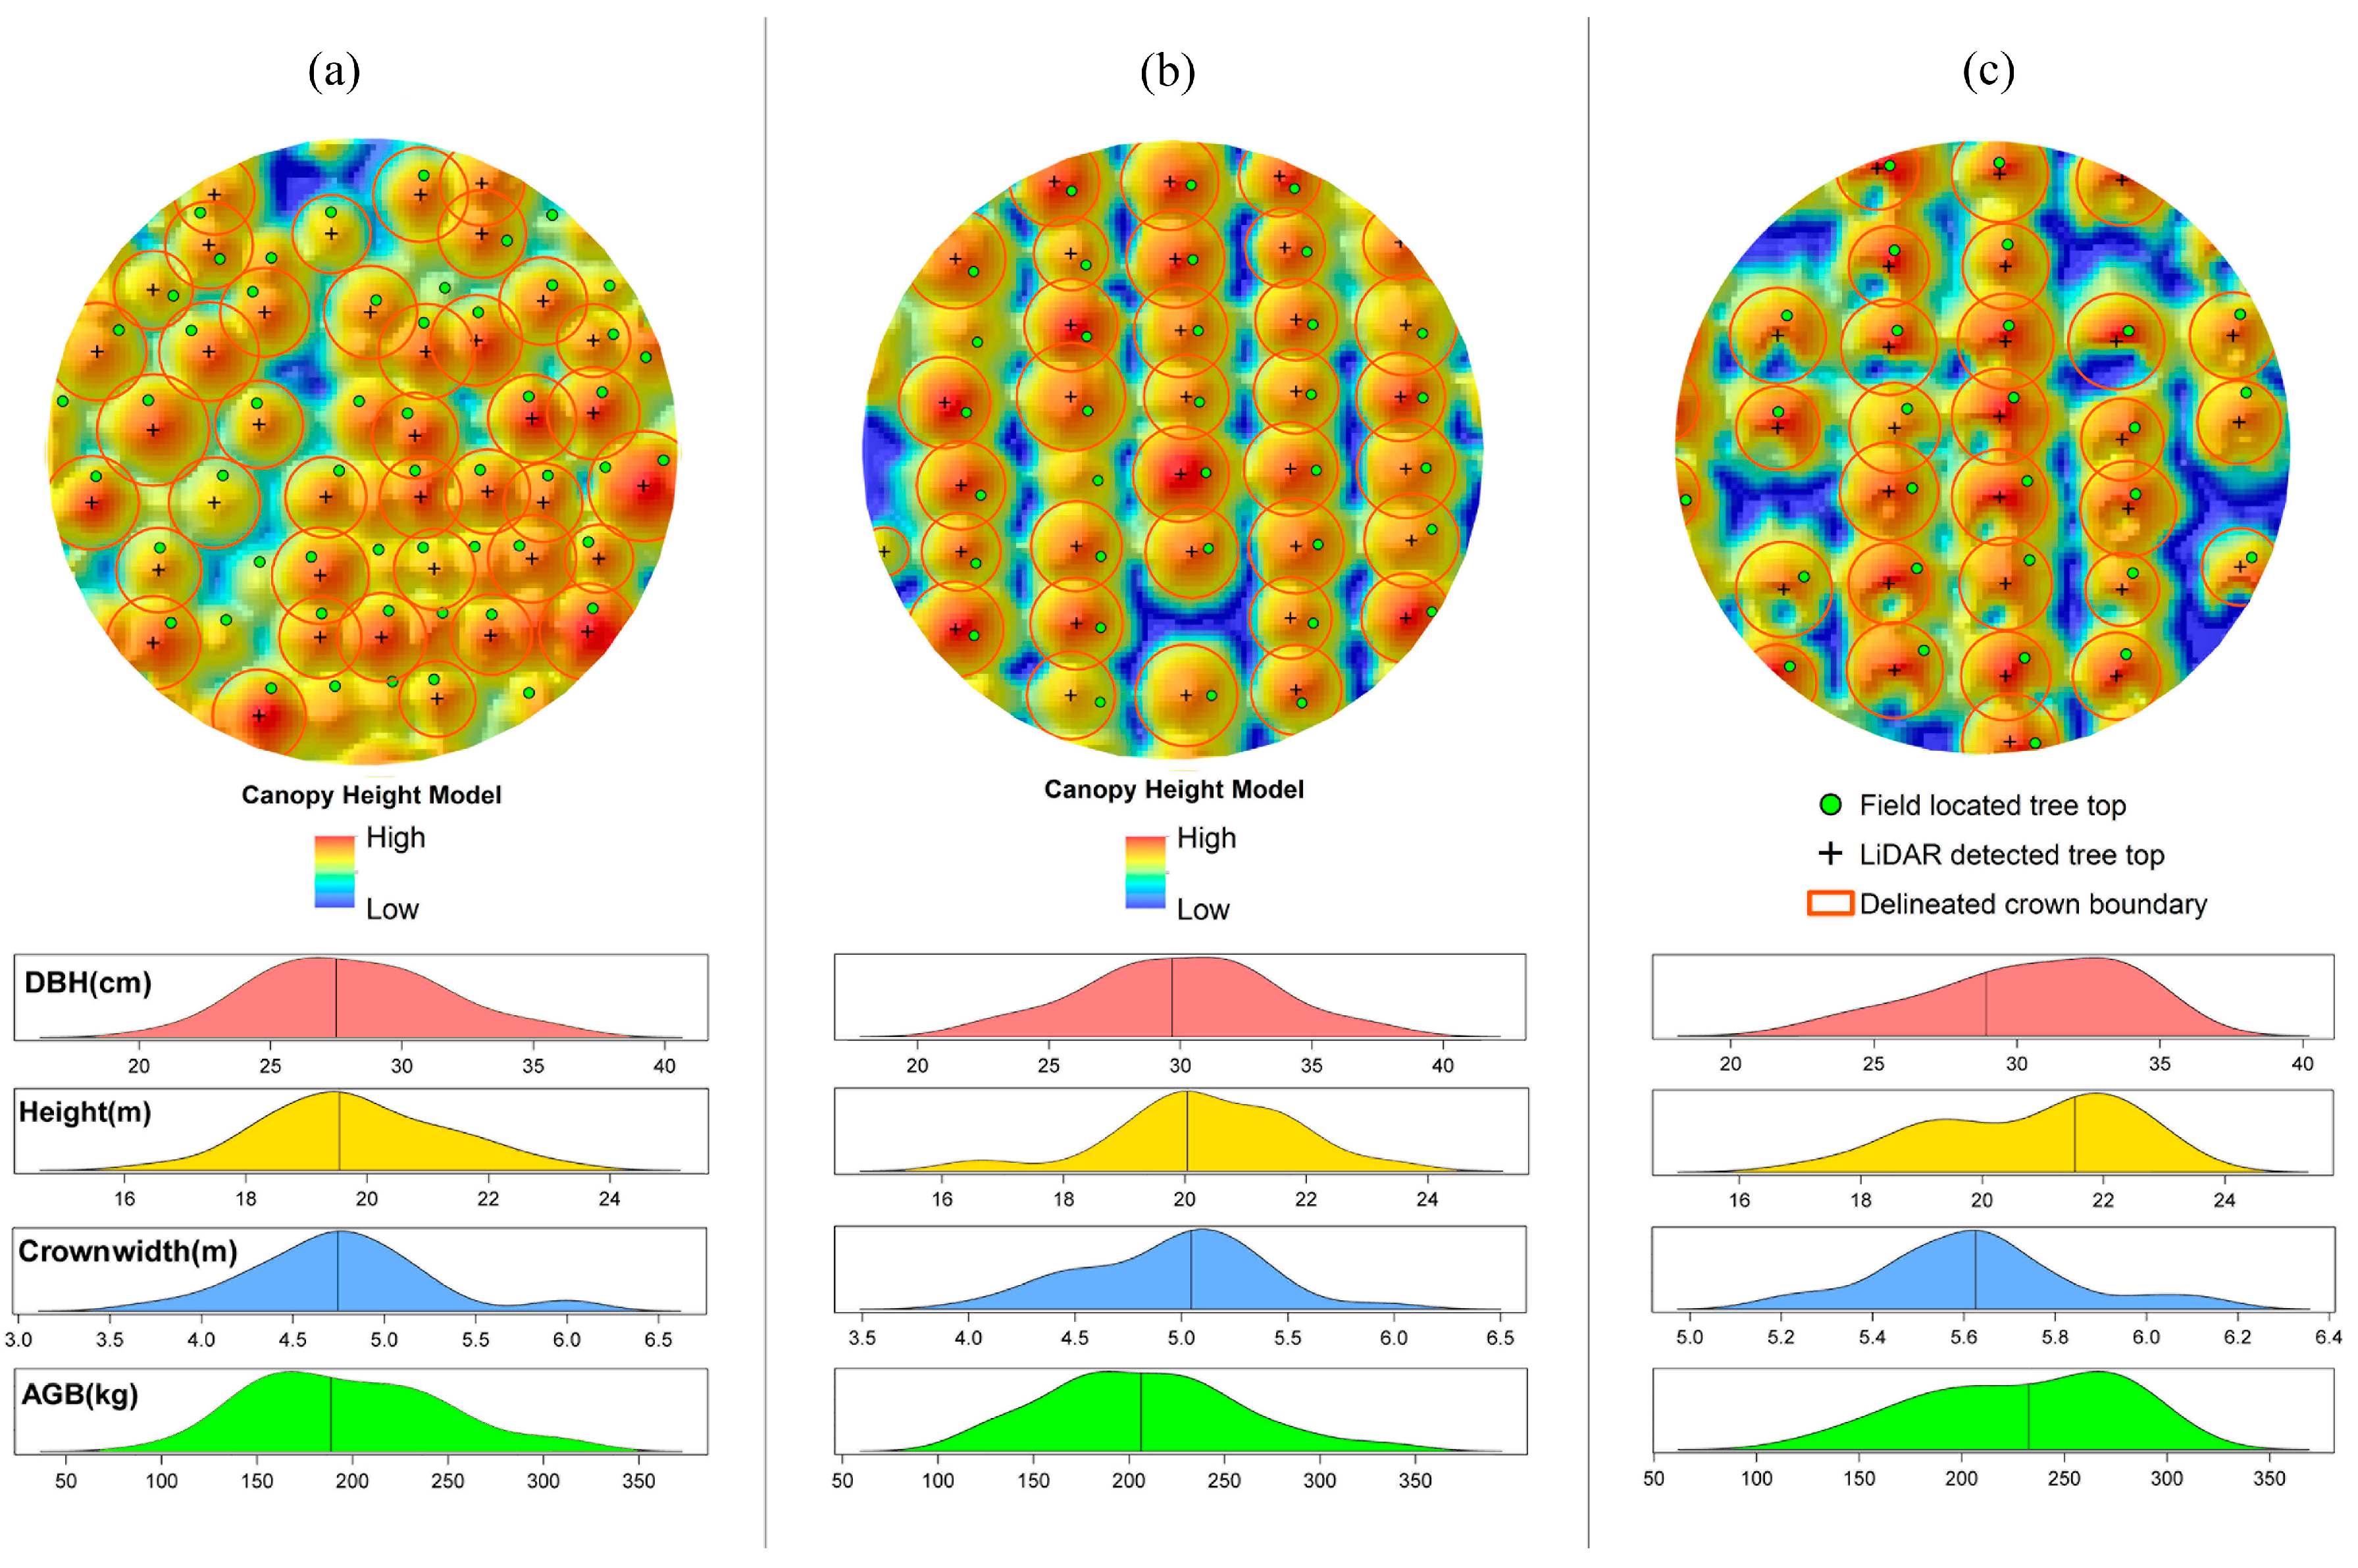
2.4. Individual Tree Detection
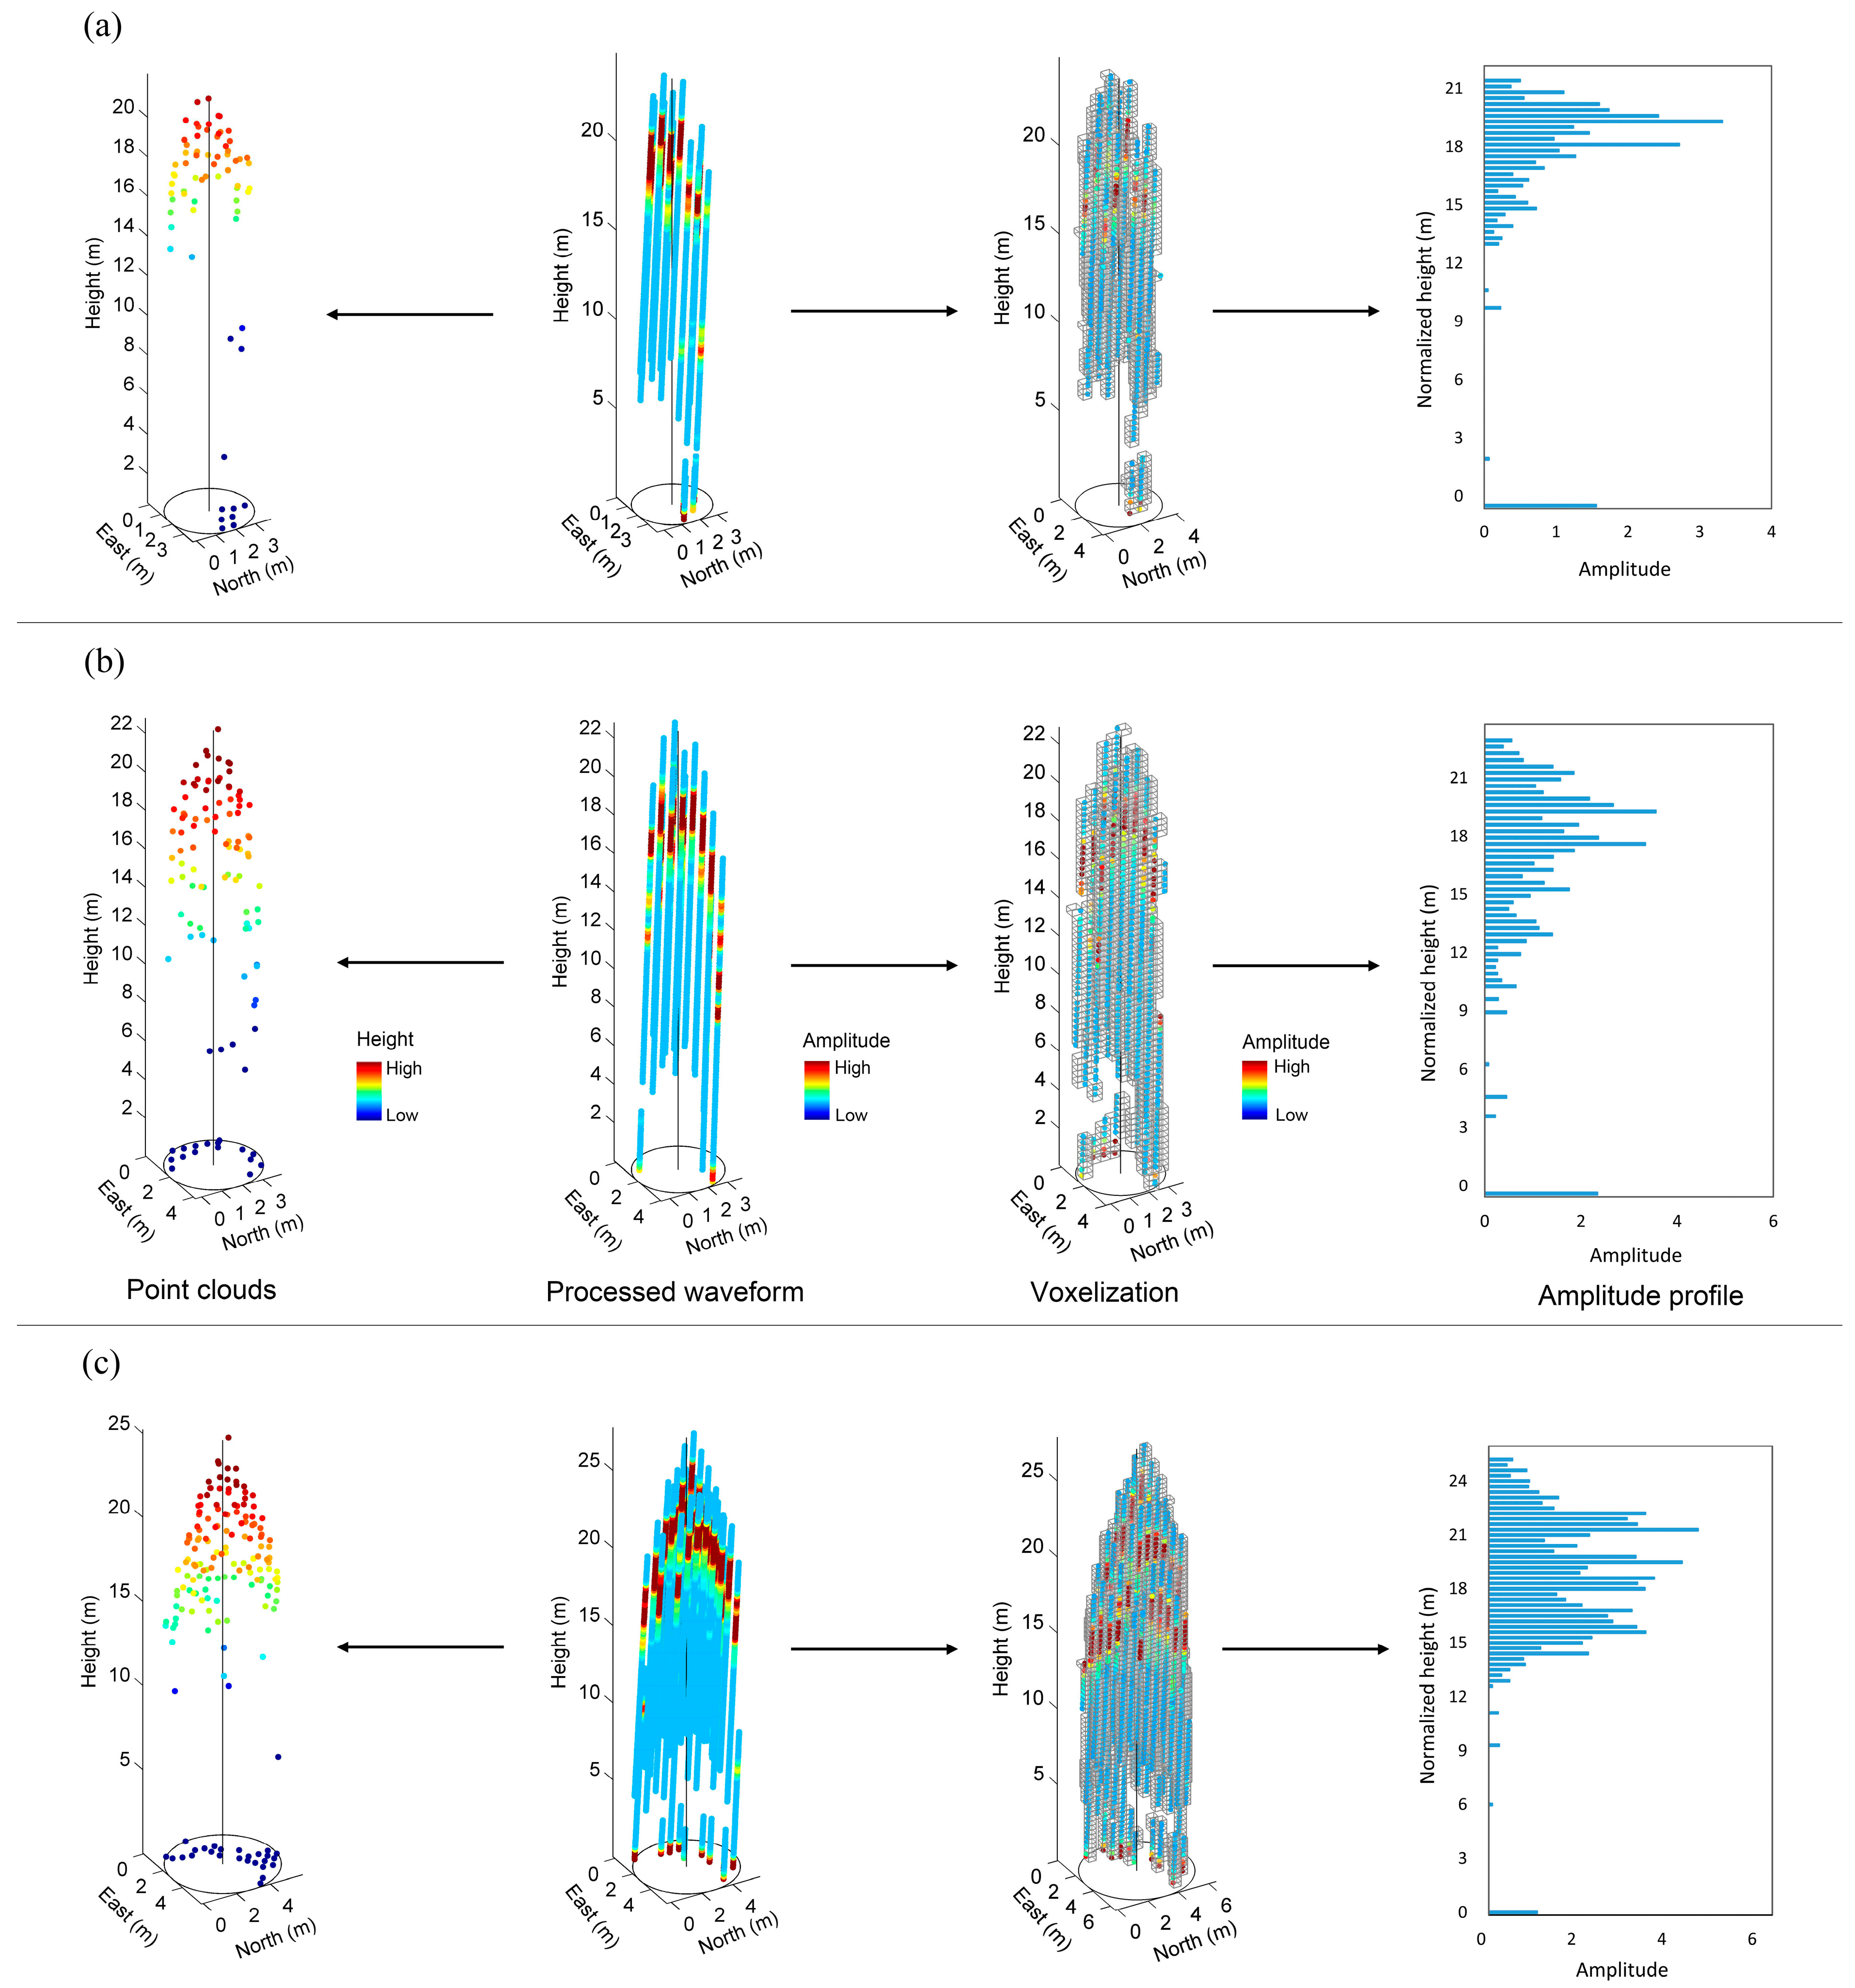
2.5. Point Cloud Metrics Calculation
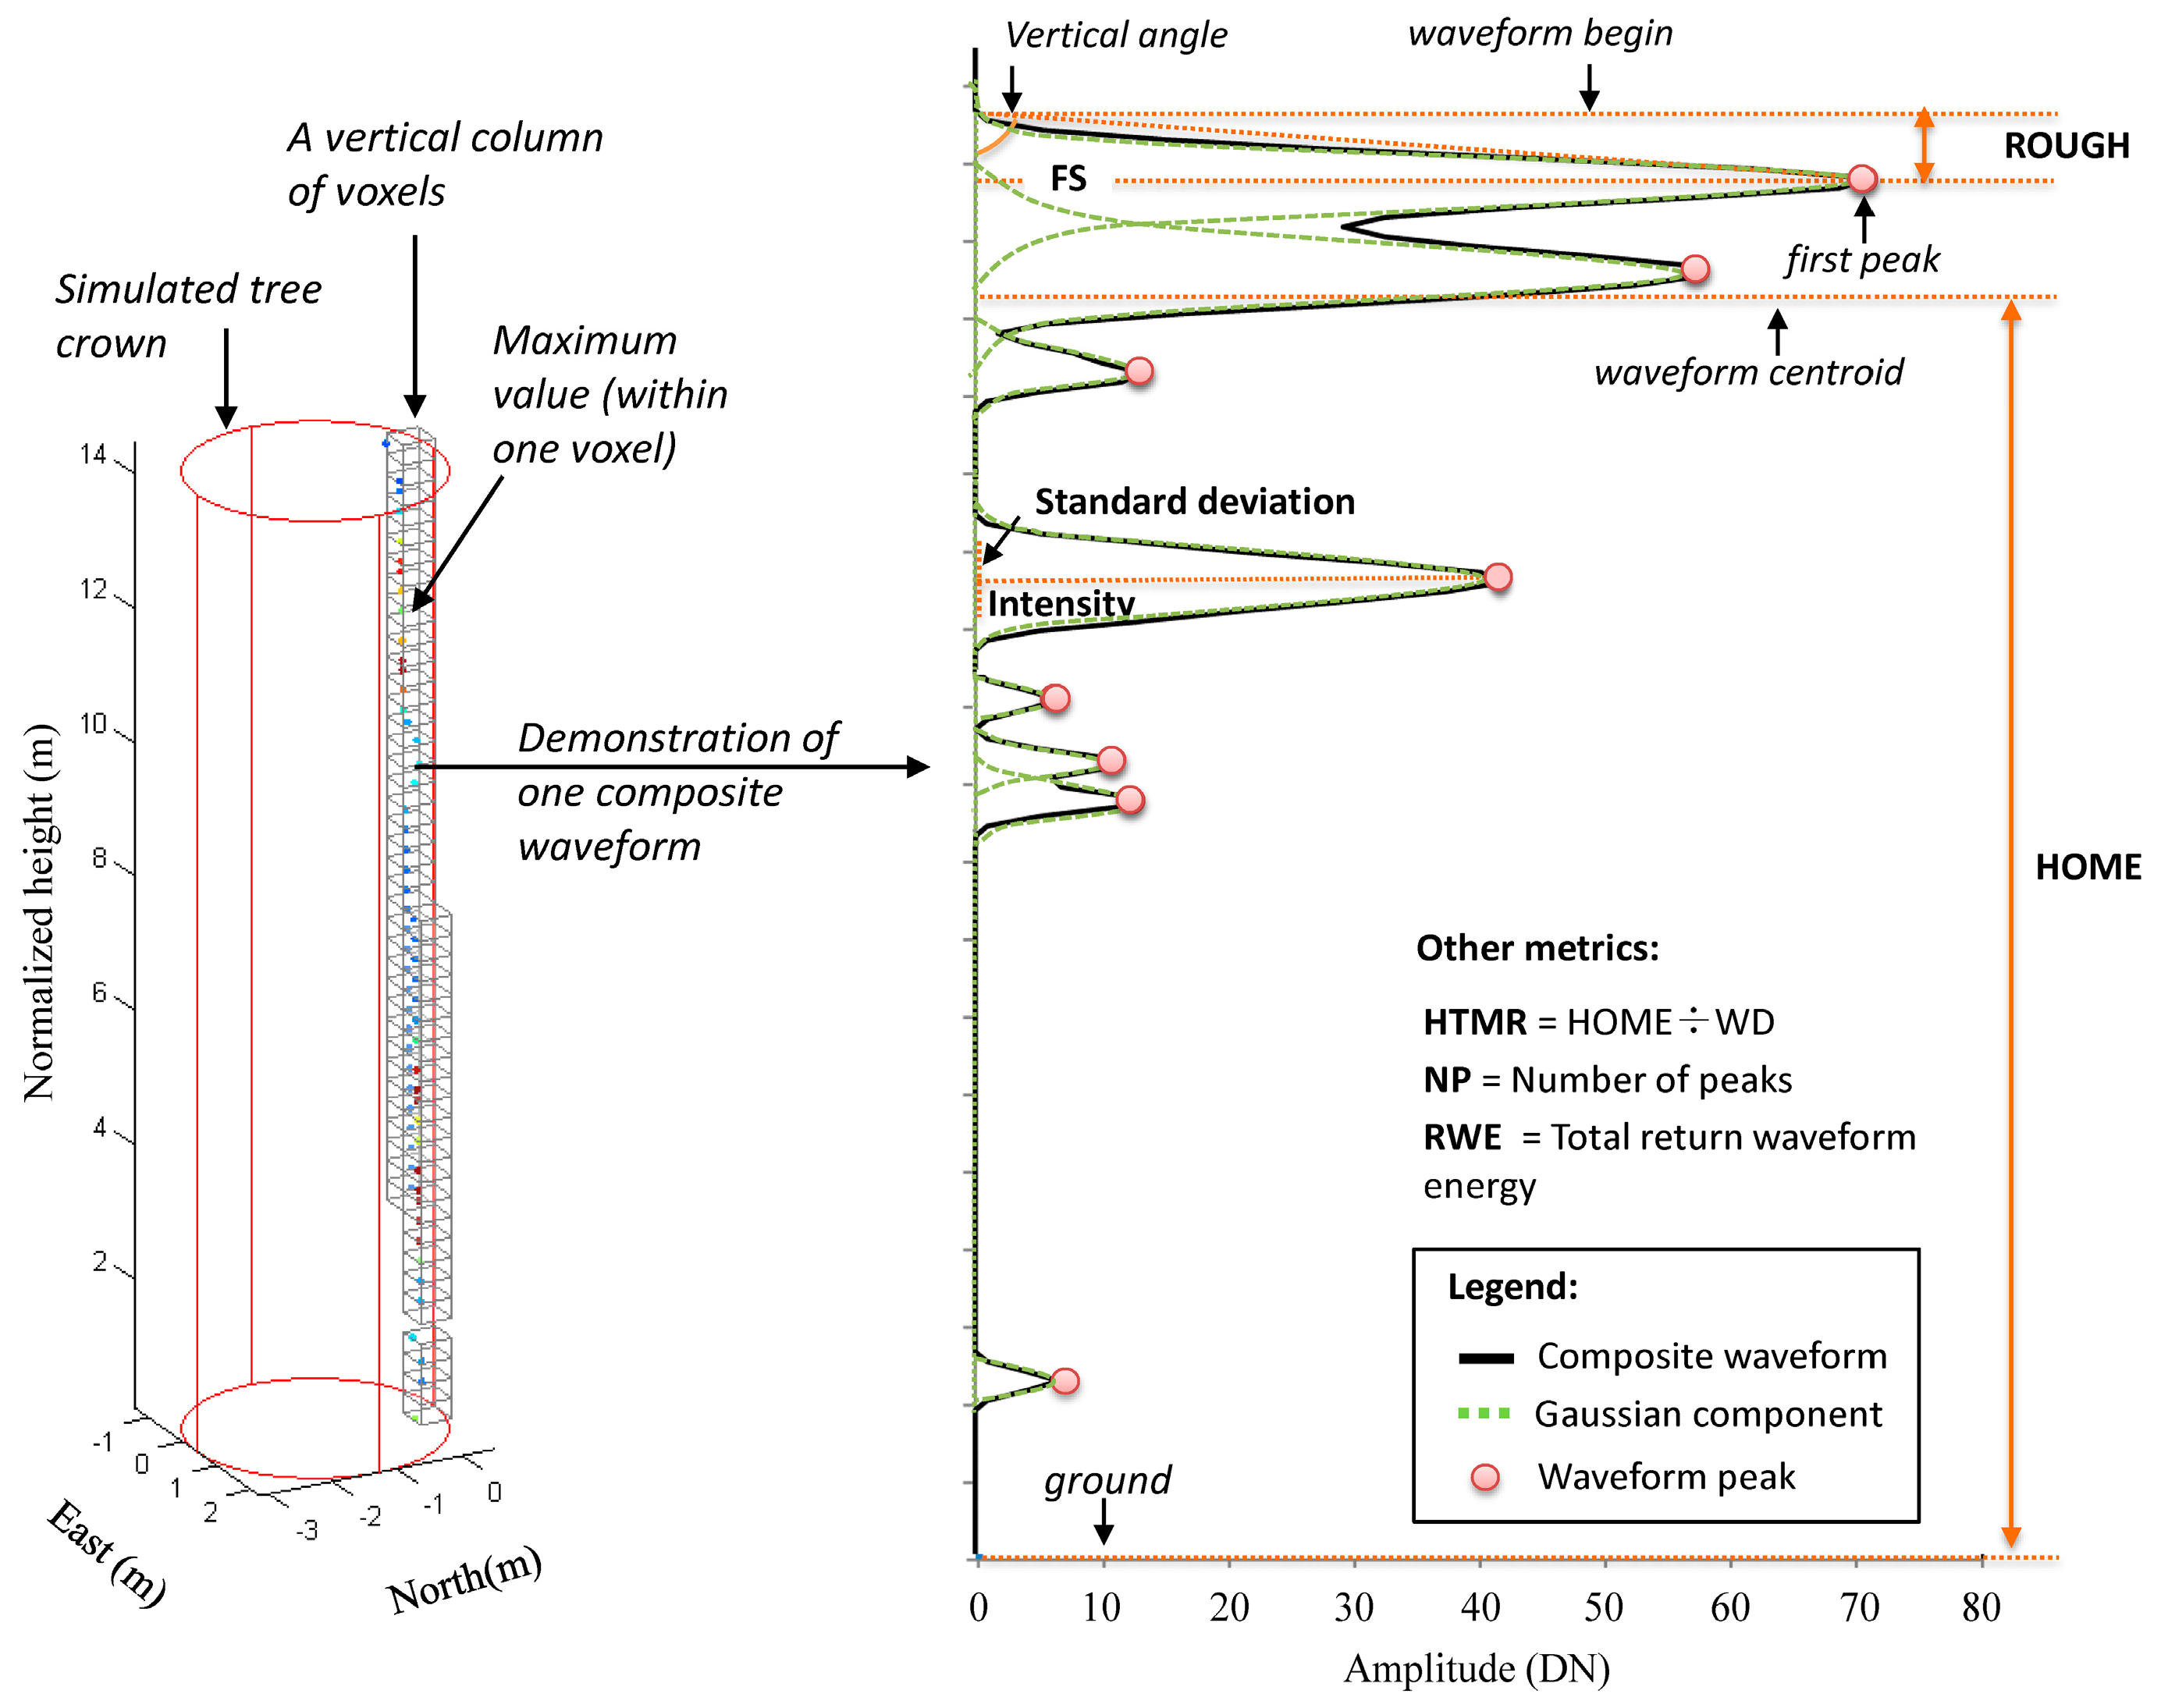
2.6. Waveform Metrics Calculation
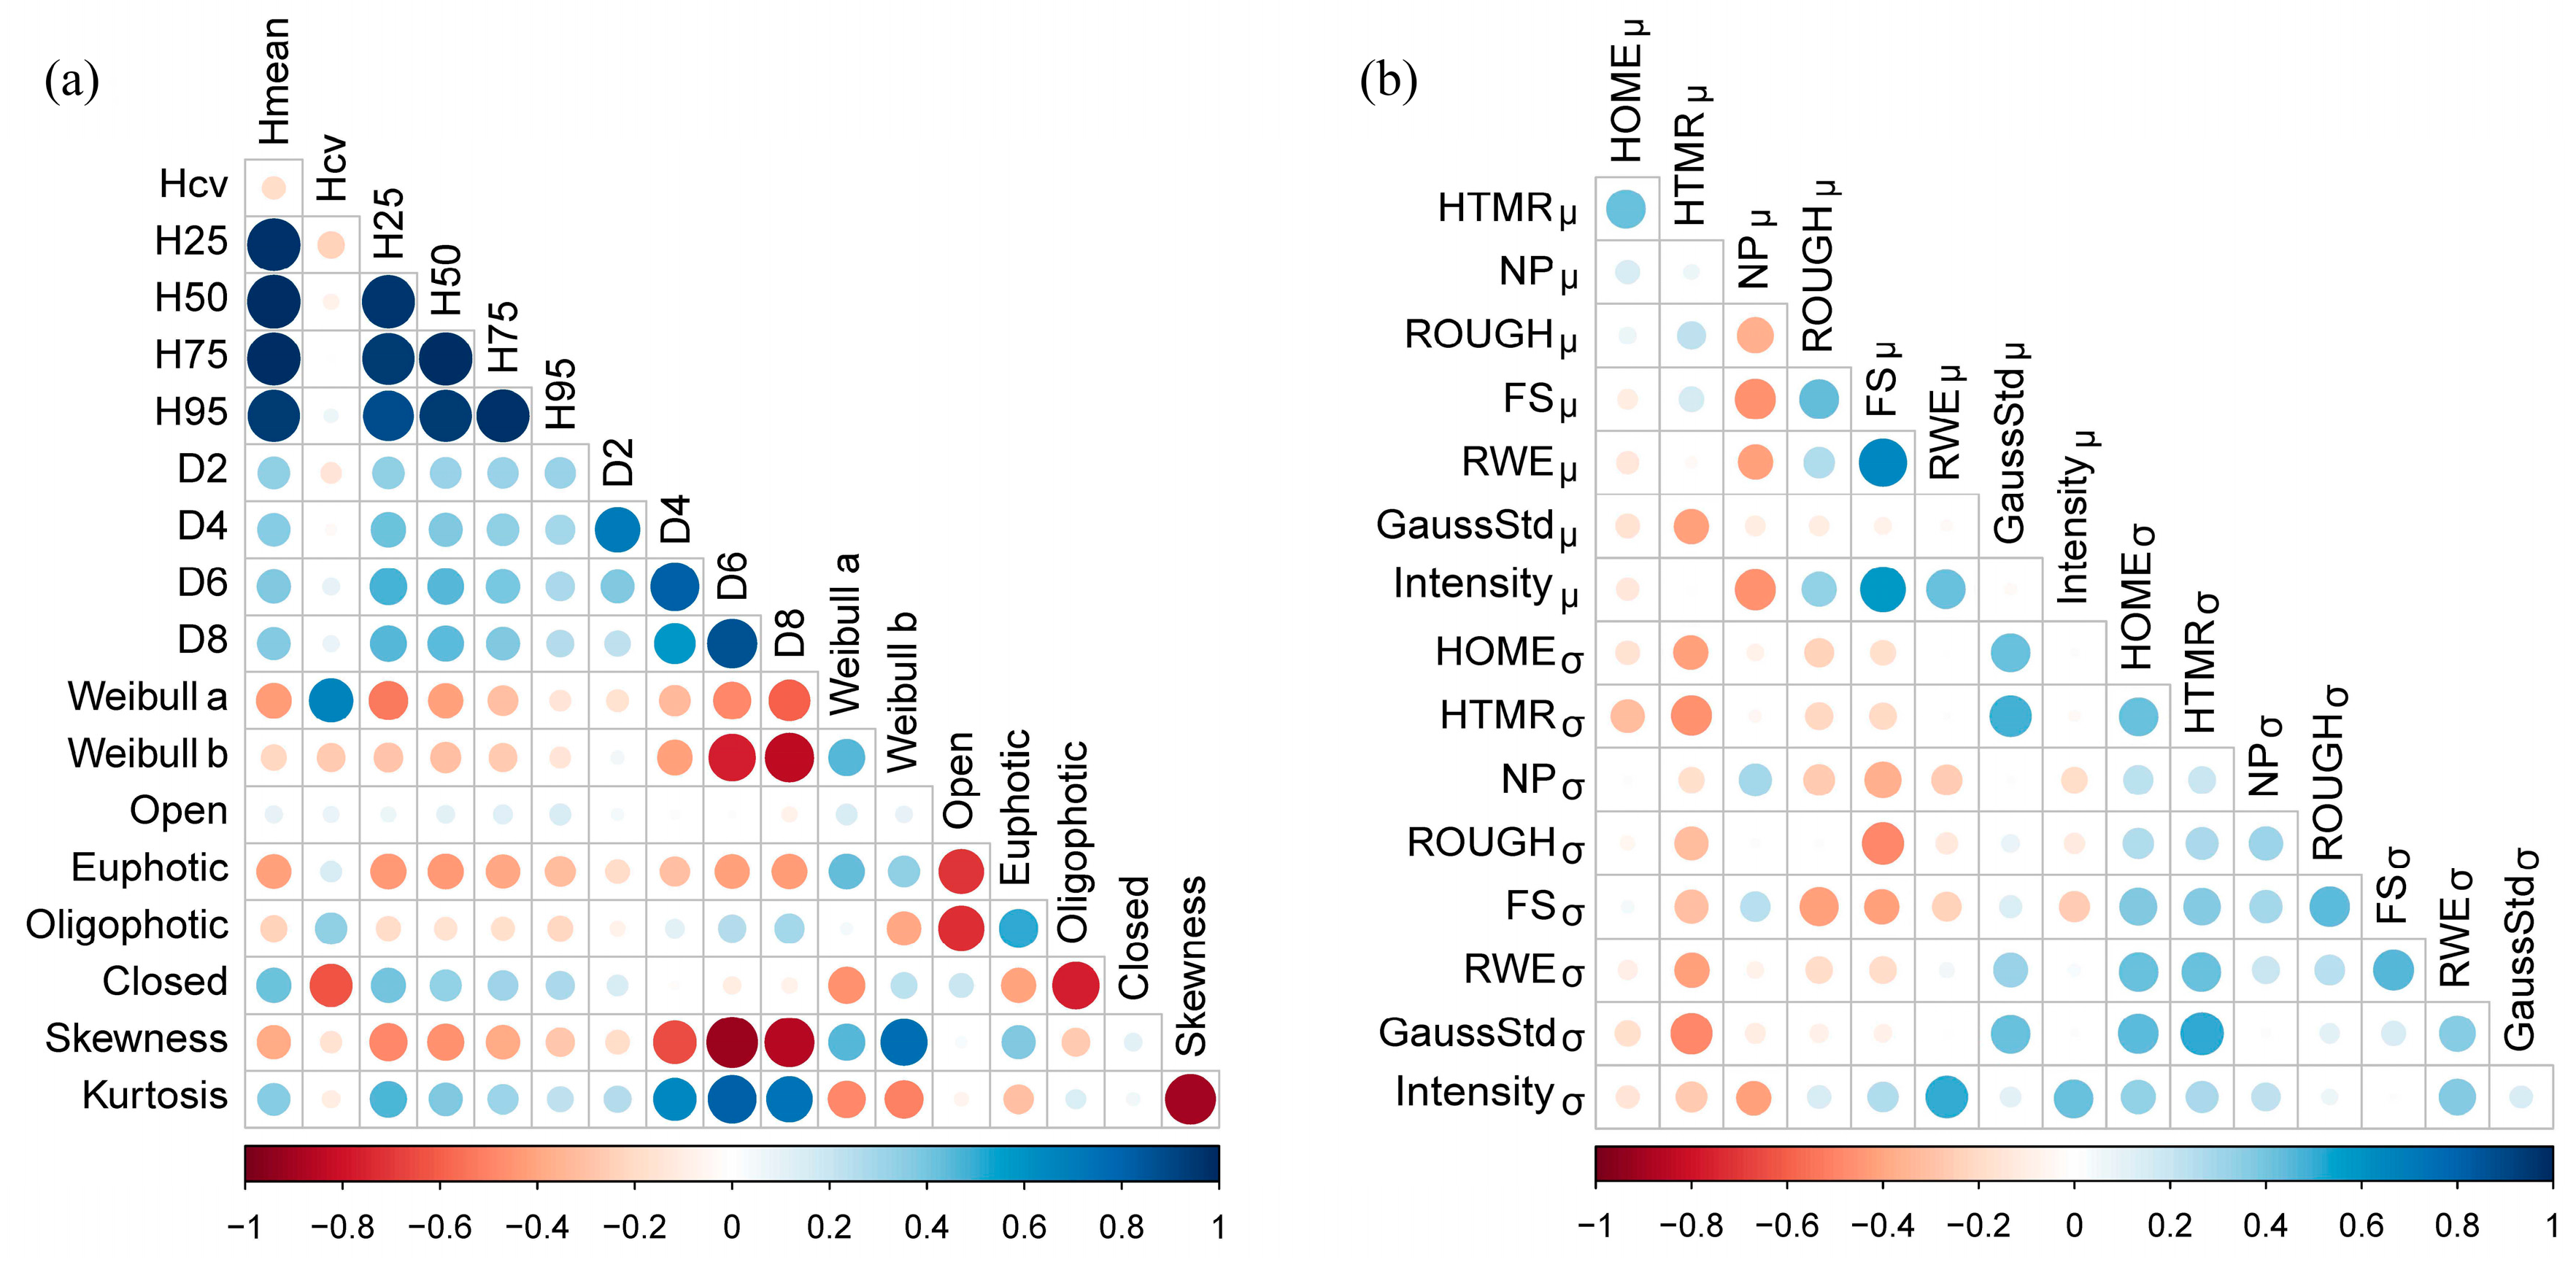
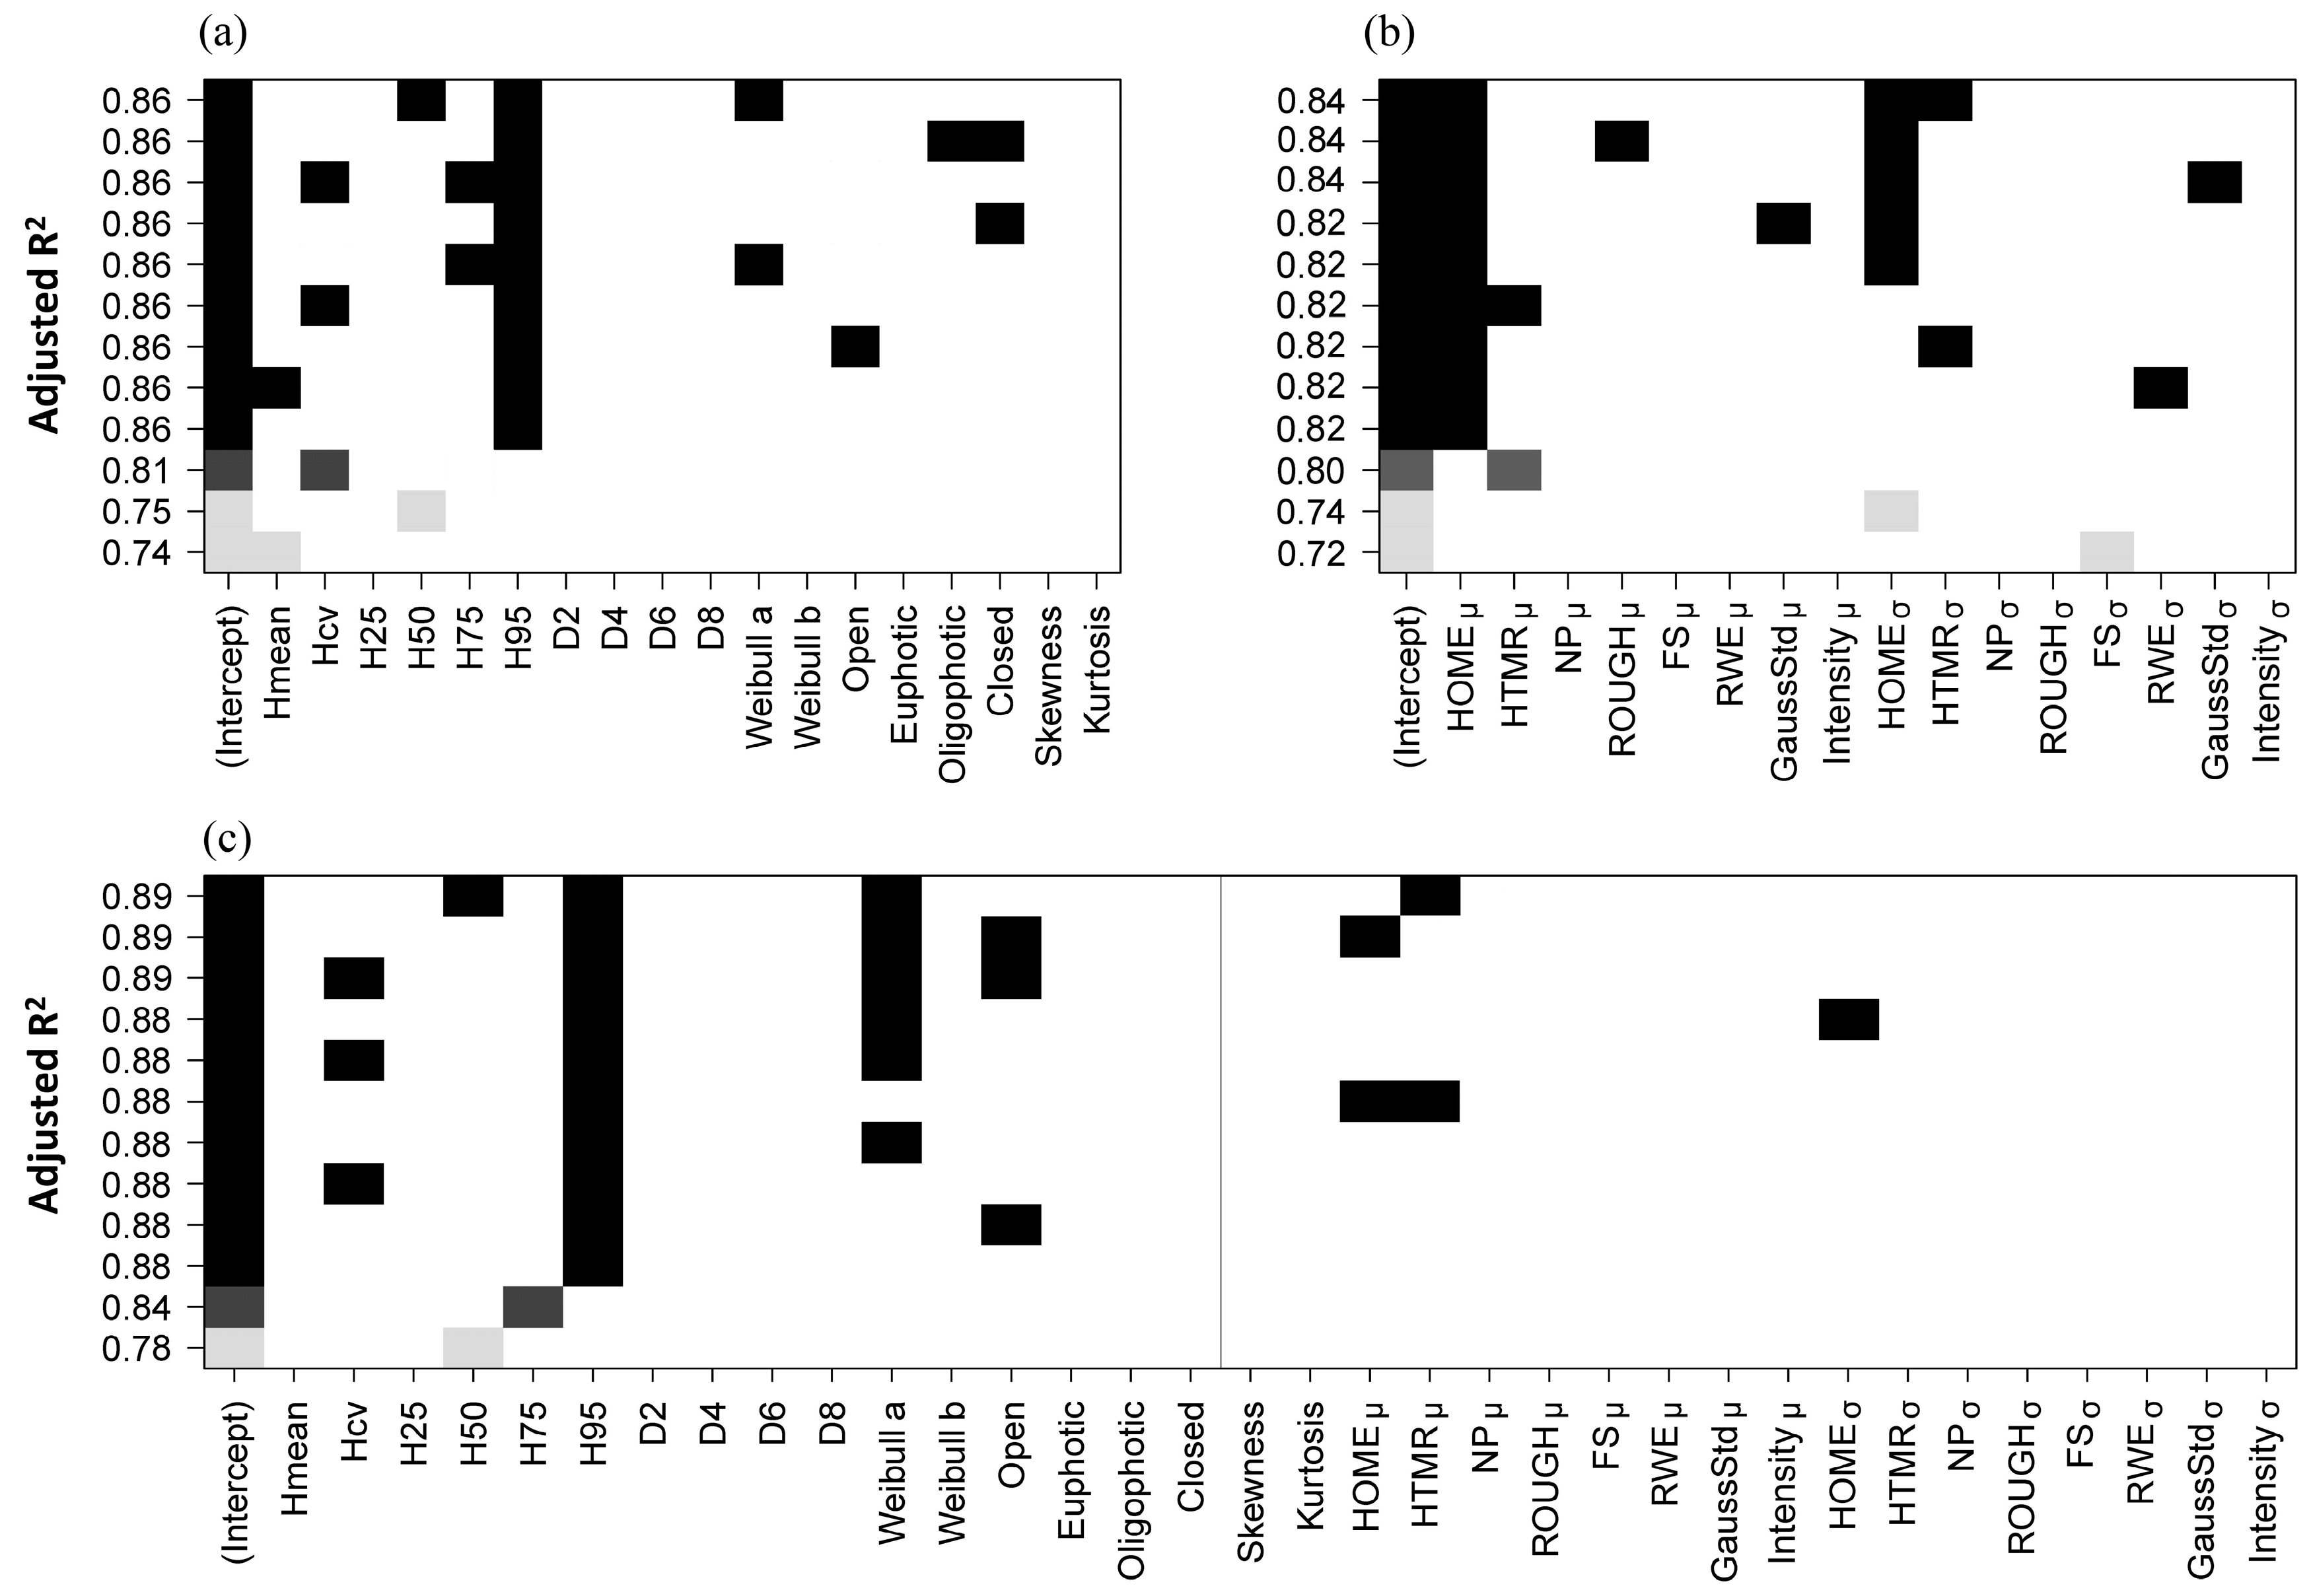
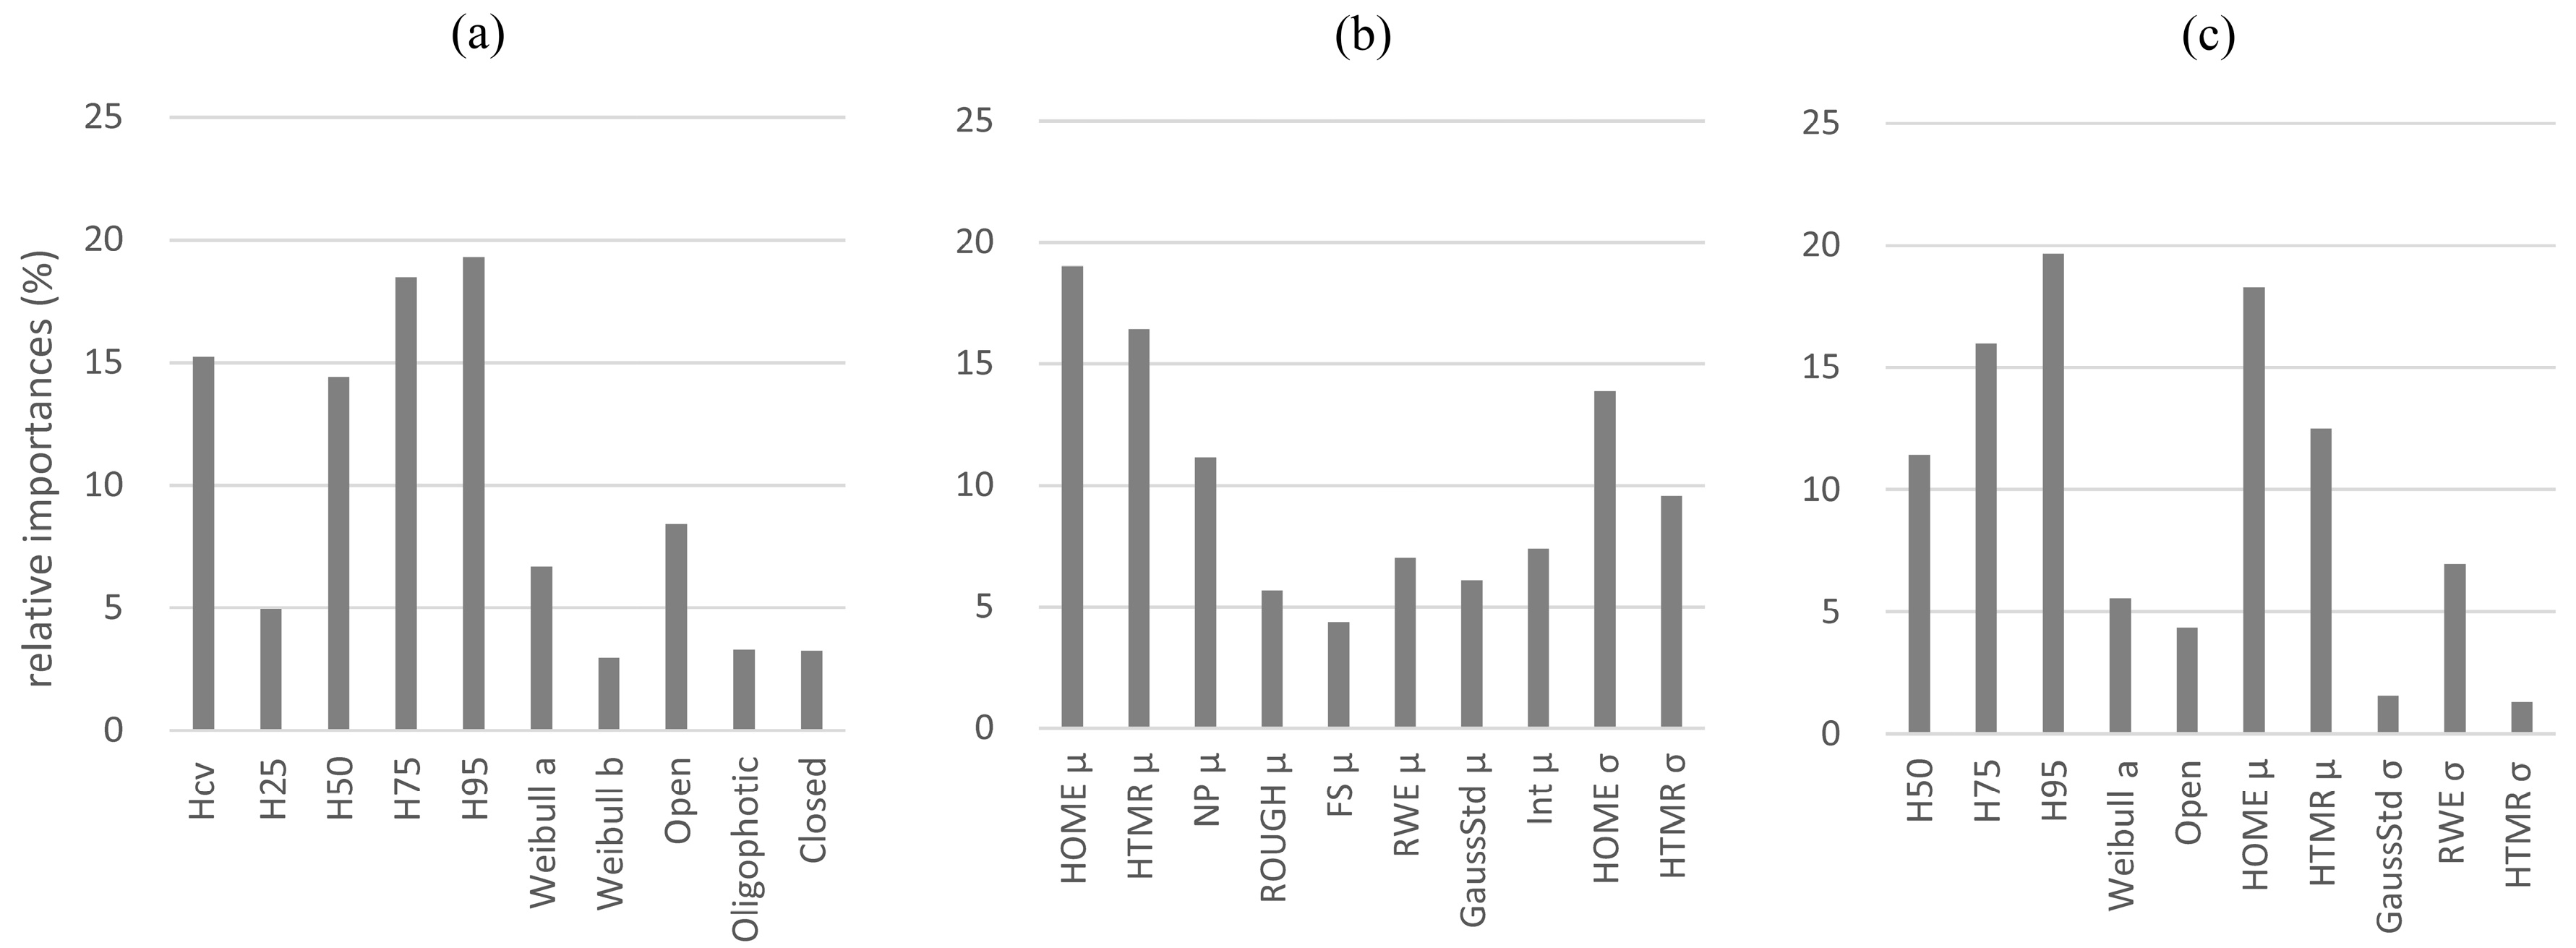
2.7. Metrics Selection and Regression Analysis
3. Results
4. Discussion
5. Conclusions
Acknowledgments
Author Contributions
Conflicts of Interest
References
- Brown, S.; Sathaye, J.; Cannell, M.; Kauppi, P. Mitigation of carbon emission to the atmosphere by forest management. Commonw. For. Rev. 1996, 75, 80–91. [Google Scholar]
- Dixon, R.K.; Brown, S.; Houghton, R.A.; Solomon, A.M.; Trexler, M.C.; Wisniewski, J. Carbon pools and flux of global forest ecosystems. Science 1994, 263, 185–190. [Google Scholar] [CrossRef] [PubMed]
- Food and Agriculture Organization of the United Nations (FAO). Global Forest Resources Assessment 2010; Forestry Department at FAO: Rome, Italy, 2010. [Google Scholar]
- Fang, J.Y.; Guo, Z.D.; Piao, S.L.; Chen, A.P. Terrestrial vegetation carbon sinks in China, 1981–2000. Sci. China Ser. D Earth Sci. 2007, 50, 1341–1350. [Google Scholar] [CrossRef]
- Pan, Y.; Birdsey, R.A.; Fang, J.; Houghton, R.; Kauppi, P.E.; Kurz, W.A.; Phillips, O.L.; Shvidenko, A.; Lewis, S.L.; Canadell, J.G.; et al. A Large and Persistent Carbon Sink in the World’s Forests. Science 2011, 333, 988–993. [Google Scholar] [CrossRef] [PubMed]
- Xu, X.; Li, K. Biomass carbon sequestration by planted forests in China. Chin. Geogr. Sci. 2010, 20, 289–297. [Google Scholar] [CrossRef]
- Li, J.; Hua, B.; Nolandb, T.L. Classification of Tree Species Based on Structural Features Derived from High Density LiDAR Data. Agric. For. Meteorol. 2013, 171, 104–114. [Google Scholar] [CrossRef]
- Lefsky, M.A.; Cohen, W.B.; Harding, D.J. LiDAR remote sensing of above-ground biomass in three biomes. Glob. Ecol. Biogeogr. 2002, 11, 393–399. [Google Scholar] [CrossRef]
- Lefsky, M.A.; Cohen, W.B.; Acker, S.A.; Parker, G.G.; Spies, T.A.; Harding, D. LiDAR Remote Sensing of the Canopy Structure and Biophysical Properties of Douglas-Fir Western Hemlock Forests. Remote Sens. Environ. 1999, 70, 339–361. [Google Scholar] [CrossRef]
- Drake, J.B.; Dubayah, R.O.; Clark, D.B.; Knox, R.G.; Blair, J.B.; Hofton, M.A.; Chazdon, R.L.; Weishampel, J.F.; Prince, S. Estimation of Tropical Forest Structural Characteristics Using Large-Footprint LiDAR. Remote Sens. Environ. 2002, 79, 305–319. [Google Scholar] [CrossRef]
- Lu, D.; Chen, Q.; Wang, G.; Moran, E.; Batistella, M.; Zhang, M.; Vaglio Laurin, G.; Saah, D. Aboveground Forest Biomass Estimation with Landsat and LiDAR Data and Uncertainty Analysis of the Estimates. Int. J. For. Res. 2012, 2012, 436537. [Google Scholar] [CrossRef]
- Hollaus, M.; Mücke, W.; Roncat, A.; Pfeifer, N.; Briese, C. Full-Waveform Airborne Laser Scanning Systems and Their Possibilities in Forest Applications. In Forestry Applications of Airborne Laser Scanning Concepts and Case Studies; Maltamo, M., Næsset, E., Vauhkonen, J., Eds.; Springer: New York, NY, USA, 2014; pp. 43–61. [Google Scholar]
- Cao, L.; Coops, N.C.; Innes, J.L.; Dai, J.; She, G. Mapping above- and below-Ground biomass components in subtropical forests using small-footprint LiDAR. Forests 2014, 5, 1356–1373. [Google Scholar] [CrossRef]
- Li, Y.; Andersen, H.E.; McGaughey, R. A comparison of statistical methods for estimating forest biomass from light detection and ranging data. West. J. Appl. For. 2008, 23, 223–231. [Google Scholar]
- Naesset, E.; Gobakken, T. Estimation of above- and below-ground biomass across regions of the boreal forest zone using airborne laser. Remote Sens. Environ. 2008, 112, 3079–3090. [Google Scholar] [CrossRef]
- Popescu, S.C. Estimating biomass of individual pine trees using airborne LiDAR. Biomass Bioenergy 2007, 31, 646–655. [Google Scholar] [CrossRef]
- Gleason, C.J.; Im, J. Forest biomass estimation from airborne LiDAR data using machine learning approaches. Remote Sens. Environ. 2012, 125, 80–91. [Google Scholar] [CrossRef]
- Hauglin, M.; Dibdiakova, J.; Gobakken, T.; Næsset, E. Estimating single-tree branch biomass of Norway spruce by airborne laser scanning. ISPRS J. Photogramm. Remote Sens. 2013, 79, 147–156. [Google Scholar] [CrossRef]
- Kankare, V.; Räty, M.; Yu, X.; Holopainen, M.; Vastaranta, M.; Kantola, T.; Hyyppä, J.; Hyyppä, H.; Alho, P.; Viitala, R. Single tree biomass modelling using airborne laser scanning. ISPRS J. Photogramm. Remote Sens. 2013, 85, 66–73. [Google Scholar] [CrossRef]
- Popescu, S.C.; Hauglin, M. Estimation of Biomass Components by Airborne Laser Scanning. In Forestry Applications of Airborne Laser Scanning: Concepts and Case Studies; Springer Science: New York, NY, USA, 2014; p. 294. [Google Scholar]
- Lindberg, E.; Olofsson, K.; Holmgren, J.; Olsson, H. Estimation of 3D vegetation structure from waveform and discrete return airborne laser scanning data. Remote Sens. Environ. 2012, 118, 151–161. [Google Scholar] [CrossRef]
- Wulder, M.A.; Bater, C.; Coops, N.C.; Hilker, T.; White, J.C. The role of LiDAR in sustainable forest management. For. Chron. 2008, 84, 807–826. [Google Scholar] [CrossRef]
- Næsset, E.; Økland, T. Estimating tree height and tree crown properties using airborne scanning laser in a boreal nature reserve. Remote Sens. Environ. 2002, 79, 105–115. [Google Scholar] [CrossRef]
- Richardson, J.J.; Moskal, L.M.; Kim, S. Modeling approaches to estimate effective leaf area index from aerial discrete-return LiDAR. Agric. For. Meteorol. 2009, 149, 1152–1160. [Google Scholar] [CrossRef]
- Coops, N.C.; Hilker, T.; Wulder, M.A.; St-Onge, B.; Newnham, G.J.; Siggins, A.; Trofymow, J.A. Estimating Canopy Structure of Douglas-Fir Forest Stands from Discrete-Return LiDAR. Trees Struct. Funct. 2007, 21, 295–310. [Google Scholar] [CrossRef]
- Parrish, C.E.; Jeong, I.; Nowak, R.D.; Smith, R.B. Empirical Comparison of Full-Waveform LiDAR Algorithms: Range Extraction and Discrimination Performance. Photogramm. Eng. Remote Sens. 2011, 77, 825–838. [Google Scholar] [CrossRef]
- Wagner, W.; Ullrich, A.; Ducic, V.; Melzer, T.; Studnicka, N. Gaussian decomposition and calibration of a novel small-footprint full-waveform digitising airborne laser scanner. ISPRS J. Photogramm. Remote Sens. 2006, 60, 100–112. [Google Scholar] [CrossRef]
- Mallet, C.; Bretar, F. Full-waveform topographic LiDAR: State-of-the-art. ISPRS J. Photogramm. Remote Sens. 2009, 64, 1–16. [Google Scholar] [CrossRef]
- Hancock, S.; Armston, J.; Li, Z.; Gaulton, R.; Lewis, P.; Disney, M.; Mark Danson, F.; Strahler, A.; Schaaf, C.; Anderson, K.; et al. Waveform LiDAR over vegetation: An evaluation of inversion methods for estimating return energy. Remote Sens. Environ. 2015, 164, 208–224. [Google Scholar] [CrossRef]
- Reitberger, J.; Peter, K.; Stilla, U. Analysis of full waveform LiDAR data for tree species classification. In International Archives of Photogrammetry, Remote Sensing and Spatial Information Sciences, 36 (Part 3); International Society of Photogrammetry and Remote Sensing (ISPRS): Bonn, Germany, 2006; pp. 228–233. [Google Scholar]
- Mallet, C.; Bretar, F.; Roux, M.; Soergel, U.; Heipke, C. Relevance assessment of full-waveform LiDAR data for urban area classification. ISPRS J. Photogramm. Remote Sens. 2011, 66, S71–S84. [Google Scholar] [CrossRef]
- Yao, W.; Krzystek, P.; Heurich, M. Tree species classification and estimation of stem volume and DBH based on single tree extraction by exploiting airborne full-waveform LiDAR data1. Remote Sens. Environ. 2012, 123, 368–380. [Google Scholar] [CrossRef]
- Duong, V.H. Processing and Application of ICESat Large Footprint Full Waveform Laser Range Data; Delft University of Technology: Delft, The Netherlands, 2010. [Google Scholar]
- Sumnall, M.J.; Hill, R.A.; Hinsley, S.A. Comparison of small-footprint discrete return and full waveform airborne LiDAR data for estimating multiple forest variables. Remote Sens. Environ. 2016, 173, 214–223. [Google Scholar] [CrossRef]
- Cao, L.; Coops, N.C.; Hermosilla, T.; Innes, J.L.; Dai, J.; She, G. Using Small-Footprint Discrete and Full-Waveform Airborne LiDAR Metrics to Estimate Total Biomass and Biomass Components in Subtropical Forests. Remote Sens. 2014, 6, 7110–7135. [Google Scholar] [CrossRef]
- Allouis, T.; Durrieu, S.; Vega, C.; Couteron, P. Stem volume and above-ground biomass estimation of individual pine trees from LiDAR data: Contribution of full-waveform signals. IEEE J. Sel. Top. Appl. Earth Obs. Remote Sens. 2013, 6, 924–934. [Google Scholar] [CrossRef]
- Wu, J.; Van Aardt, J.; Asner, G.P.; Knapp, D.; Erasmus, B.F.N. LiDAR Waveform-based woody and foliar biomass estimation in savanna environments. In Proceedings of the 9th International Conference on LiDAR Applications for Assessing Forest Ecosystems (Silvilaser), College Station, TX, USA, 14–16 October 2009; pp. 20–29.
- Zhou, D.; Pu, D.; Ge, Z.; Yan, J.; Ran, X.; Ruan, H.; Cao, G. Effects of nitrogen addition on soil fauna in poplar plantation with different ages in a coastal area of eastern China. Chin. J. Ecol. 2015, 34, 2553–2560. [Google Scholar]
- Song, Y.B.; Ding, Y.P.; Shen, F. The development and latest progress of JSCORS. Bull. Surv. Mapp. 2009, 2, 73–74. [Google Scholar]
- Ji, Y.; Zhang, J.; Kang, L. A study on biomass equations for Metasequoia glyptostroboides shelterbelt in the coastal agroforestry. J. Jiangsu For. Sci. Technol. 2015, 24, 1–4. [Google Scholar]
- Pang, Y.; Li, Z.Y.; Ju, H.B.; Liu, Q.W.; Si, L.; Li, S.M. LiCHy:CAF’s LiDAR,CCD and Hyperspectral Airborne Observation System. In Proceedings of the 13th International Conference on LiDAR Applications for Assessing Forest Ecosystems, Beijing, China, 9–11 October 2013; pp. 45–54.
- Reitberger, J.; Schnörr, C.; Krzystek, P.; Stilla, U. 3D segmentation of single trees exploiting full waveform LiDAR data. ISPRS J. Photogramm. Remote Sens. 2009, 64, 561–574. [Google Scholar] [CrossRef]
- Levenberg, K. A Method for the Solution of Certain Problems in Least Squares. Q. Appl. Math. 1944, 2, 164–168. [Google Scholar]
- Marquardt, D. An Algorithm for Least-Squares Estimation of Nonlinear Parameters. SIAM J. Appl. Math. 1963, 11, 431–441. [Google Scholar] [CrossRef]
- Rapidlasso, G. LAStools Rapid LiDAR Processing. Available online: http://rapidlasso.com/category/lastools/ (accessed on 12 August 2016).
- Vaughn, N.R.; Moskal, L.M.; Turnblom, E.C. Tree Species Detection Accuracies Using Discrete Point LiDAR and Airborne Waveform LiDAR. Remote Sens. 2012, 4, 377–403. [Google Scholar] [CrossRef]
- Reitberger, J.; Krzystek, P.; Stilla, U. Analysis of full waveform LiDAR data for the classification of deciduous and coniferous trees. Int. J. Remote Sens. 2008, 29, 1407–1431. [Google Scholar] [CrossRef]
- Wagner, W. Radiometric calibration of small-footprint full-waveform airborne laser scanner measurements: Basic physical concepts. ISPRS J. Photogramm. Remote Sens. 2010, 65, 505–513. [Google Scholar] [CrossRef]
- Höfle, B.; Pfeifer, N. Correction of laser scanning intensity data: Data and model-driven approaches. ISPRS J. Photogramm. Remote Sens. 2007, 62, 415–433. [Google Scholar] [CrossRef]
- Pang, Y.; Lefsky, M.; Sun, G.; Ranson, J. Impact of Footprint Diameter and Off-Nadir Pointing on the Precision of Canopy Height Estimates from Spaceborne LiDAR. Remote Sens. Environ. 2011, 115, 2798–2809. [Google Scholar] [CrossRef]
- Hermosilla, T.; Coops, N.C.; Ruiz, L.A.; Moskal, L.M. Deriving pseudo-vertical waveforms from small-footprint full-waveform LiDAR data. Remote Sens. Lett. 2014, 5, 332–341. [Google Scholar] [CrossRef]
- Bretar, F.; Pierrot-Deseilligny, M.; Roux, M. Solving the strip adjustment problem of 3D airborne LiDAR data. In Proceedings of the IEEE International Geoscience and Remote Sensing Symposium (IGARSS ’04), Anchorage, AK, USA, 20–24 September 2004; Volume 7, pp. 4734–4737.
- Popescu, S.C.; Wynne, R.H.; Nelson, R.H. Estimating plot-level tree heights with LiDAR: Local filtering with a canopy-height based variable window size. Comput. Electron. Agric. 2002, 37, 71–95. [Google Scholar] [CrossRef]
- Popescu, S.C.; Wynne, R.H. Seeing the trees in the forest: using LiDAR and multispectral data fusion with local filtering and variable window size for estimating tree height. Photogramm. Eng. Remote 2004, 70, 589–604. [Google Scholar] [CrossRef]
- Popescu, S.C.; Wynne, R.H.; Nelson, R.H. Measuring individual tree crown diameter with LiDAR and assessing its influence on estimating forest volume and biomass. Can. J. Remote Sens. 2003, 29, 564–577. [Google Scholar] [CrossRef]
- McGaughey, R.J. FUSION/LDV: Software for LiDAR Data Analysis and Visualization; United States Department of Agriculture Forest Service: Seattle, WA, USA, 2015. [Google Scholar]
- Xu, M.; Harrington, T.B. Foliage biomass distribution of loblolly pine as affected by tree dominance crown size and stand characteristics. Can. J. For. Res. 1998, 28, 887–892. [Google Scholar] [CrossRef]
- Bailey, R.L.; Dell, T.R. Quantifying diameter distributions with the Weibull distribution. For. Sci. 1973, 19, 97–104. [Google Scholar]
- Neuenschwander, A. Mapping vegetation structure in a wooded savanna at Freeman Ranch, TX using airborne waveform LiDAR. In Proceedings of the 12th International Conference on LiDAR Applications for Assessing Forest Ecosystems (SilviLaser), Vancouver, BC, Canada, 16–19 September 2012; pp. 42–53.
- Ranson, K.J.; Sun, G.; Kovacs, K.; Kharuk, V.I. Landcover attributes from ICESat GLAS data in central Siberia. In Proceedings of the IEEE International Geoscience and Remote Sensing Symposium (IGARSS ’04), Anchorage, AK, USA, 20–24 September 2004; pp. 753–756.
- Sun, G.; Ranson, K.J.; Kimes, D.S.; Blair, J.B.; Kovacs, K. Forest vertical structure from GLAS: An evaluation using LVIS and SRTM data. Remote Sens. Environ. 2008, 112, 107–117. [Google Scholar] [CrossRef]
- Harding, D.J. ICESat waveform measurements of within-footprint topographic relief and vegetation vertical structure. Geophys. Res. Lett. 2005, 32, L21S10. [Google Scholar] [CrossRef]
- Wulder, M.A.; White, J.C.; Bater, C.W.; Coops, N.C.; Hopkinson, C.; Chen, G. LiDAR plots—A new large-area data collection option: Context, concepts, and case study. Can. J. Remote Sens. 2014, 38, 600–618. [Google Scholar] [CrossRef]
- Lu, Y.; Coops, N.C.; Bolton, D.K.; Wang, T.; Wang, G. Comparing Stem Volume Predictions of Coastal Douglas-Fir Stands in British Columbia Using a Simple Physiological Model and LiDAR Remote Sensing. For. Sci. 2015, 61, 1–11. [Google Scholar] [CrossRef]
- Sprugel, D.G. Correcting for Bias in Log-Transformed Allometric Equations. Ecology 1983, 64, 209–210. [Google Scholar] [CrossRef]
- Lumley, T. Regression Subset Selection. Available online: http://cran.r-project.org/web/packages/leaps/leaps.pdf (accessed on 3 May 2016).
- LeBreton, J.M.; Tonidandel, S. Multivariate relative importance: Extending relative weight analysis to multivariate criterion spaces. J. Appl. Psychol. 2008, 93, 329–345. [Google Scholar] [CrossRef] [PubMed]
- Johnson, J. A Heuristic Method for Estimating the Relative Weight of Predictor Variables in Multiple Regression. Multivar. Behav. Res. 2000, 35, 21–50. [Google Scholar] [CrossRef] [PubMed]
- Akaike, H. A new look at the statistical model identification. IEEE Trans. Autom. Control 1974, 19, 716–723. [Google Scholar] [CrossRef]
- Vauhkonen, J.; Maltamo, M.; McRoberts, R.E.; Næsset, E. Introduction to Forestry Applications of Airborne Laser Scanning. In Forestry Applications of Airborne Laser Scanning: Concepts and Case Studies; Springer: New York, NY, USA, 2014; p. 294. [Google Scholar]
- Nelson, R.; Valenti, M.A.; Short, A.; Keller, C. A multiple resource inventory of Delaware using airborne laser data. Bioscience 2003, 53, 981–992. [Google Scholar] [CrossRef]
- Cao, L.; Coops, N.C.; Innes, J.L.; Dai, J.; Ruan, H.; She, G. Tree species classification in subtropical forests using small-footprint full-waveform LiDAR data. Int. J. Appl. Earth Obs. Geoinf. 2016, 49, 39–51. [Google Scholar] [CrossRef]
- Zavitkovski, J. Ground vegetation biomass, production, and efficiency of energy utilization in some Northern Wisconsin forest ecosystems. Ecology 1976, 57, 694–706. [Google Scholar] [CrossRef]
- Breidenbach, J.; Astrup, R. The Semi-Individual Tree Crown Approach. In Forestry Applications of Airborne Laser Scanning: Concepts and Case Studies; Springer: Dordrecht, Netherlands, 2014; pp. 113–133. [Google Scholar]
- Breidt, F.J. Simulation estimation of quantiles from a distribution with known mean. J. Comput. Graph. Stat. 2004, 13, 487–498. [Google Scholar] [CrossRef]
- Muss, J.D.; Mladenoff, D.J.; Townsend, P.A. Remote Sensing of Environment A pseudo-waveform technique to assess forest structure using discrete LiDAR data. Remote Sens. Environ. 2011, 115, 824–835. [Google Scholar] [CrossRef]

| Biomass Components | Equations (kg) | R2 |
|---|---|---|
| Stem biomass (WS) | ln WS = −3.09 + 0.83∙ln(DBH2∙H) | 0.98 |
| Branch biomass (WB) | ln WB = −3.21 + 0.68∙ln(DBH2∙H) | 0.97 |
| Foliage biomass (WF) | ln WF = −2.90 + 0.54∙ln(DBH2∙H) | 0.91 |
| Plot ID | Individual Tree Characteristics | Plot Characteristics | ||||||
|---|---|---|---|---|---|---|---|---|
| DBH | h | CW | WA-T | N | GB | hL | WA-P | |
| (cm) (±SD) | (m) (±SD) | (m) (±SD) | (kg) (±SD) | (ha−1) | (m2·ha−1) | (m) | (Mg·ha−1) | |
| 1 | 19.68 ± 3.11 | 17.29 ± 2.18 | 4.56 ± 0.43 | 126.97 ± 41.87 | 411 | 16.91 | 18.19 | 51.42 |
| 2 | 20.36 ± 1.81 | 17.77 ± 1.27 | 4.69 ± 0.47 | 122.72 ± 19.60 | 456 | 21.77 | 19.66 | 70.34 |
| 3 | 21.78 ± 2.57 | 18.77 ± 1.81 | 4.64 ± 0.38 | 164.09 ± 55.16 | 522 | 26.20 | 19.73 | 86.50 |
| 4 | 21.62 ± 1.60 | 18.66 ± 1.13 | 4.62 ± 0.45 | 140.24 ± 19.73 | 372 | 18.53 | 18.26 | 57.20 |
| 5 | 23.27 ± 2.05 | 19.82 ± 1.44 | 4.95 ± 0.40 | 196.22 ± 57.96 | 378 | 23.58 | 21.08 | 84.26 |
| 6 | 23.03 ± 2.23 | 19.65 ± 1.57 | 5.19 ± 0.51 | 163.06 ± 28.97 | 456 | 27.40 | 19.44 | 91.14 |
| 7 | 25.46 ± 1.63 | 21.36 ± 1.15 | 4.36 ± 0.55 | 202.59 ± 24.46 | 598 | 20.03 | 21.68 | 68.99 |
| 8 | 25.83 ± 1.60 | 21.62 ± 1.12 | 4.51 ± 0.27 | 229.05 ± 46.46 | 356 | 26.20 | 23.06 | 97.92 |
| 9 | 26.63 ± 2.09 | 22.18 ± 1.47 | 4.81 ± 0.36 | 231.18 ± 44.39 | 389 | 27.24 | 23.07 | 103.25 |
| 10 | 26.87 ± 1.74 | 22.34 ± 1.22 | 4.83 ± 0.32 | 227.12 ± 50.23 | 442 | 29.20 | 22.27 | 106.31 |
| 11 | 26.83 ± 1.69 | 22.32 ± 1.19 | 5.23 ± 0.48 | 129.01 ± 26.99 | 778 | 30.78 | 20.38 | 102.63 |
| 12 | 27.52 ± 1.80 | 22.80 ± 1.27 | 4.76 ± 0.48 | 210.69 ± 48.42 | 706 | 36.38 | 21.42 | 127.21 |
| 13 | 27.42 ± 1.55 | 22.73 ± 1.09 | 4.38 ± 0.70 | 240.48 ± 25.02 | 512 | 28.98 | 20.43 | 99.16 |
| 14 | 26.84 ± 2.96 | 22.33 ± 2.08 | 4.92 ± 0.56 | 231.54 ± 42.47 | 744 | 33.55 | 22.34 | 121.00 |
| 15 | 28.42 ± 1.93 | 23.58 ± 1.53 | 4.87 ± 0.59 | 262.71 ± 32.53 | 543 | 34.20 | 23.28 | 129.69 |
| 16 | 32.43 ± 1.82 | 26.26 ± 1.28 | 4.94 ± 0.57 | 352.79 ± 36.79 | 556 | 37.61 | 26.83 | 156.88 |
| Metrics | Description |
|---|---|
| Point cloud metrics a | |
| Percentile heights (H25, H50, H75 and H95) | The percentiles of the canopy height distributions (25th, 50th, 75th and 95th). |
| Canopy return density (D2, D4, D6 and D8) | The proportion of points above the quantiles (20th, 40th, 60th and 80th) to total number of points. |
| Coefficient of variation of heights (Hcv) | Coefficient of variation of heights of all points. |
| Skewness and Kurtosis of heights (i.e., Hskewness and Hkurtosis) | The skewness and kurtosis of the heights of all points. |
| α and β parameter of Weibull distribution (i.e., Weibullα and Weibullβ) | The α and β parameter of the Weibull distribution fitted to foliage density profile. |
| Open and Closed gap zones of Canopy volume models (CVM) (i.e., Open and Closed) | The empty voxels located above and below the canopy respectively. |
| Euphotic and Oligophotic zones of CVM (i.e., Euphotic and Oligophotic) | The voxels located within an uppermost percentile (65%) of all filled grid cells of that column, and voxels located below the point in the profile. |
| Waveform metrics b | |
| Height of median energy (HOME) | The distance from waveform centroid to the ground. |
| Height to median ratio (HTMR) | HOME divided by the distances from waveform beginning to the ground. |
| Number of peaks (NP) | The number of detected peaks within each waveform. |
| Roughness of outermost canopy (ROUGH) | The distance from the waveform beginning to the first peak. |
| Front slope angle (FS) | The vertical angles from waveform beginning to the first peak of canopy return energies. |
| Return waveform energy (RWE) | The total received energy, i.e., the area below the waveform between beginning and end. |
| Standard deviation of Gaussian component (GaussStd) | Mean of the standard deviation of Gaussian components within one waveform. |
| Intensity of Gaussian component (Intensity) | Mean of the intensity of Gaussian components within one waveform. |
| Num. of Trees a | Correct n (%) | Omission n (%) | Commission n (%) |
|---|---|---|---|
| 658 | 563 (85.6%) | 95 (14.4%) | 53 (8.1%) |
| Models | Parameters and Coefficients | Adj-R2 a | RMSE | rRMSE (%) |
|---|---|---|---|---|
| Models with point cloud metrics | ||||
| WA-P | exp (−3.20 + 2.78lnH95 + 0.07lnHcv) × 1.027 | 0.86 *** | 12.13 | 6.01 |
| Models with waveform metrics | ||||
| WA-W | exp (−2.08 + 2.43lnHOMEμ − 0.91lnHTMRμ + 0.16lnHOMEσ) × 1.033 | 0.84 *** | 19.69 | 9.75 |
| Models with point cloud and waveform metrics | ||||
| WA-C | exp (−3.24 + 2.86lnH95 + 0.06lnHcv − 0.08lnHOMEμ + 0.02lnHTMRμ) × 1.026 | 0.89 *** | 11.81 | 5.66 |
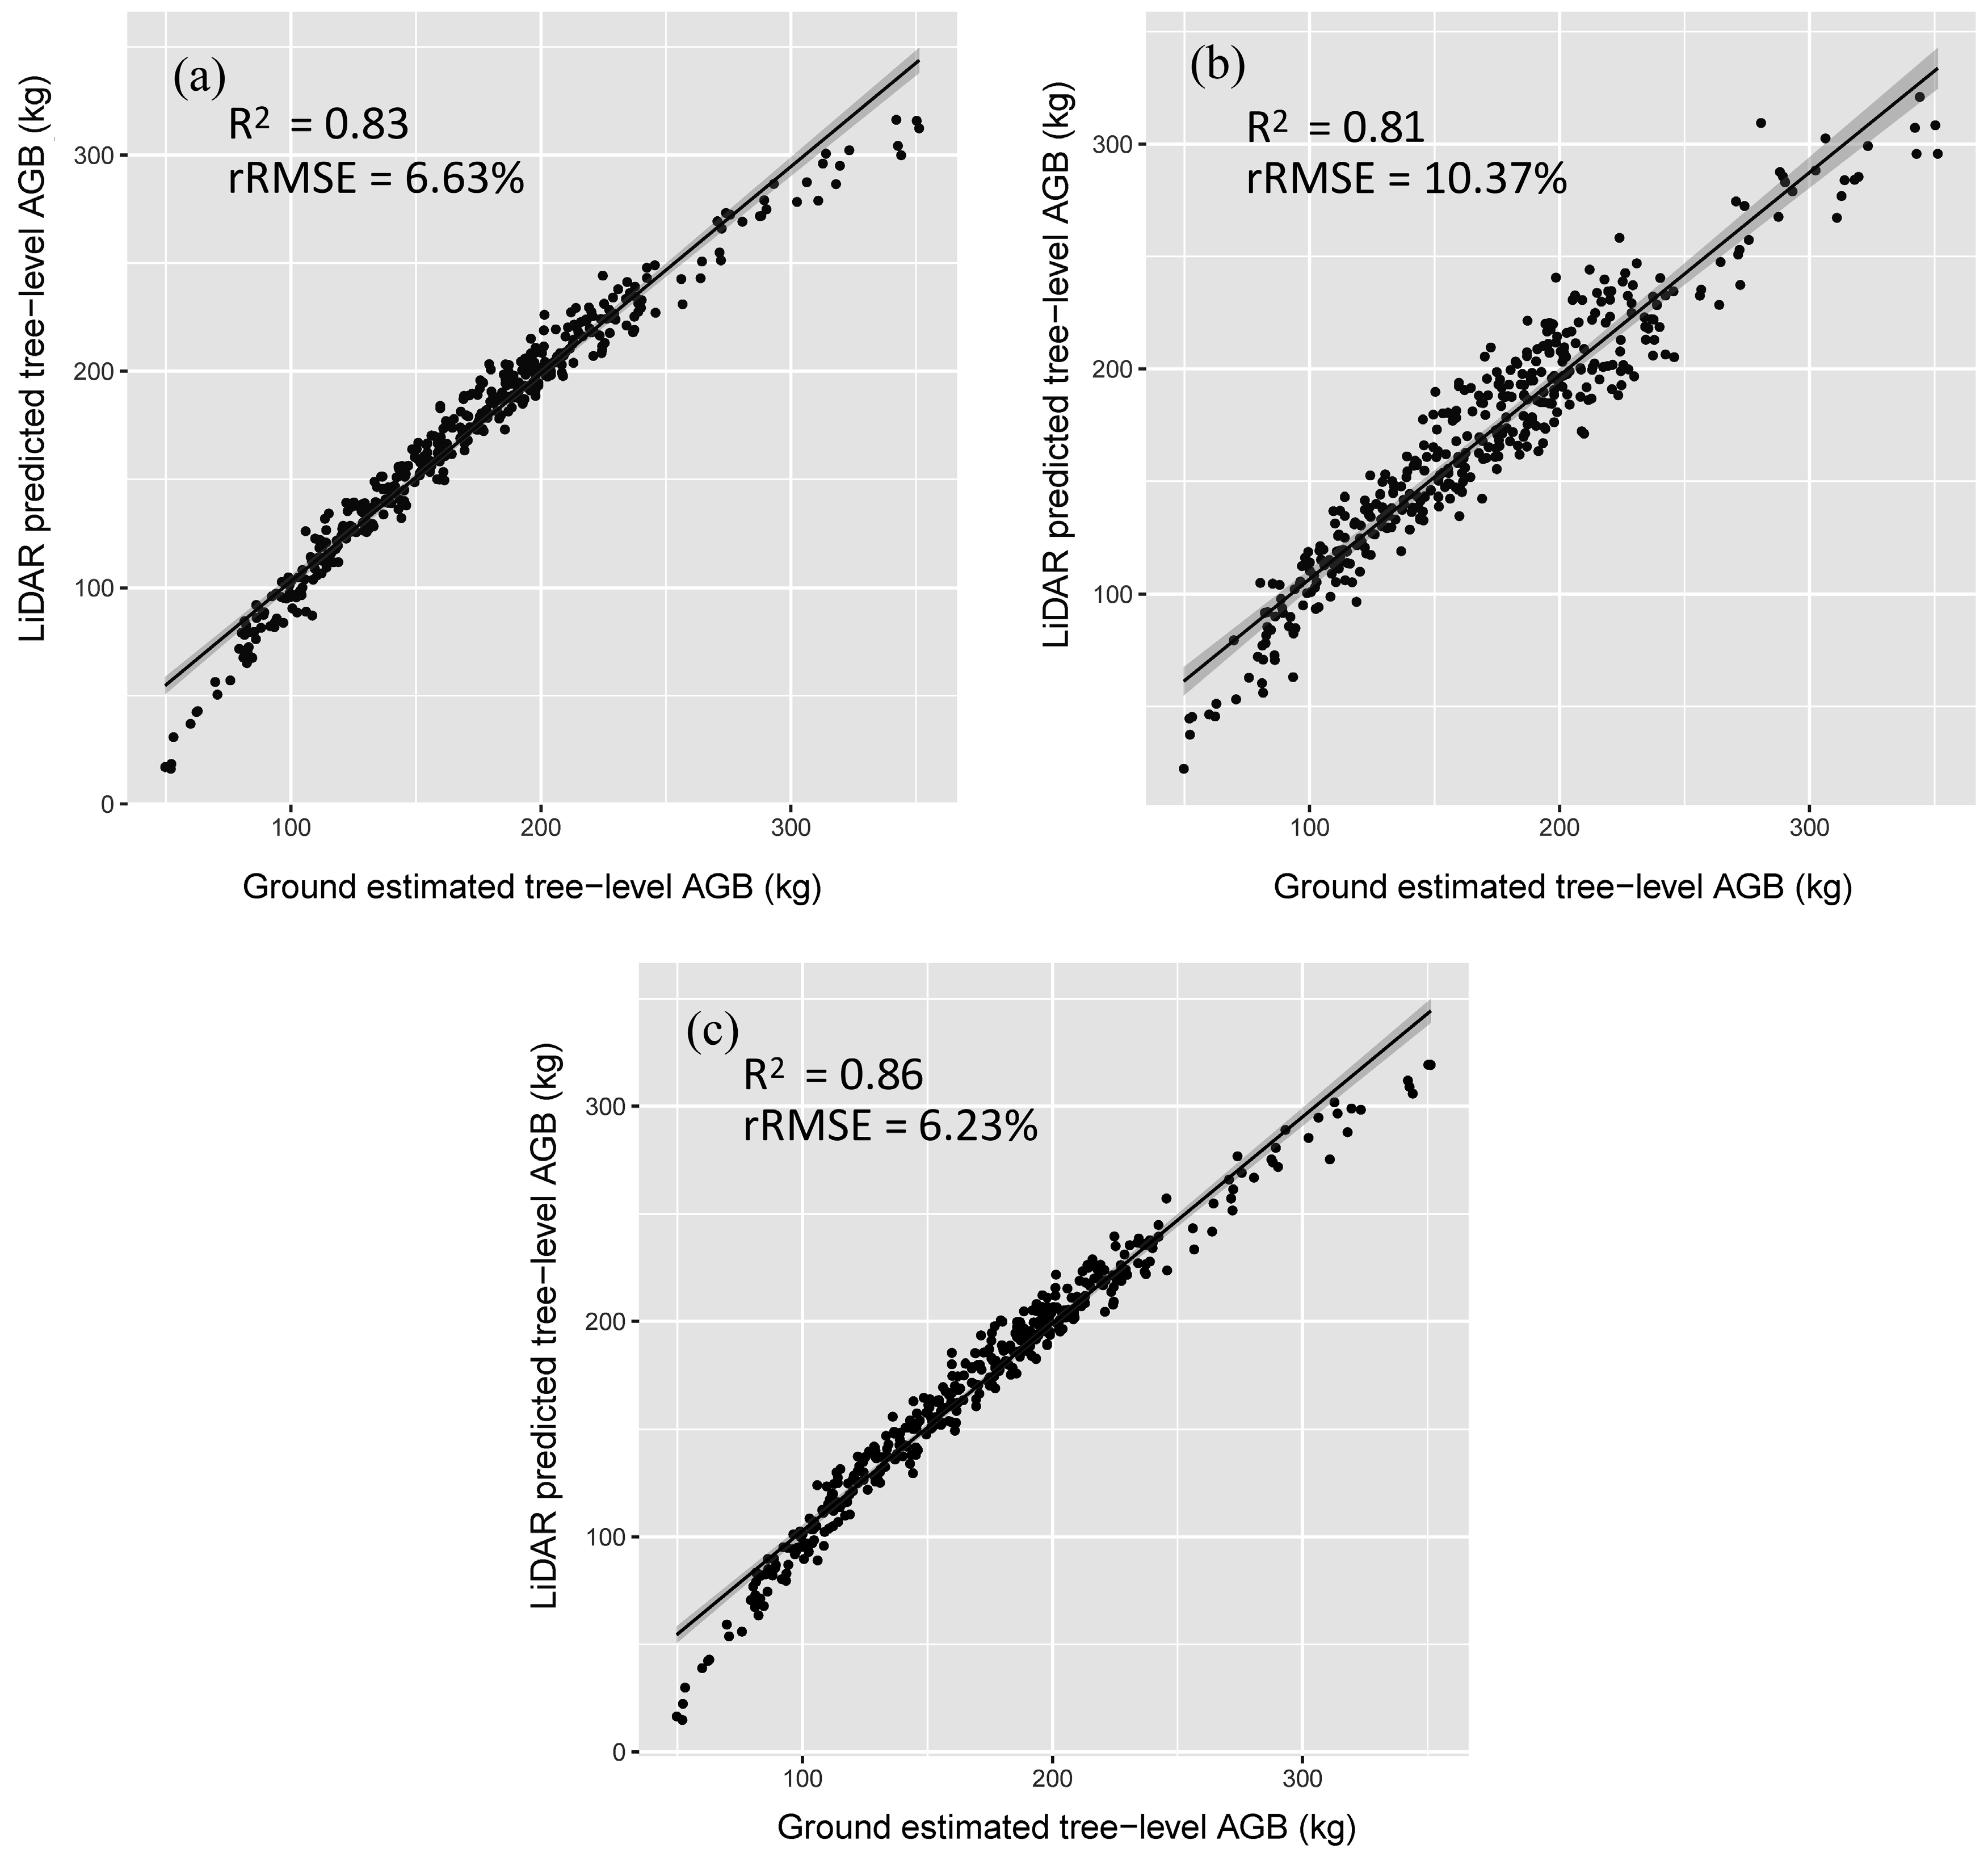
| Variables | R2 | RMSE | Differences in Cross-Validation | ||
|---|---|---|---|---|---|
| Mean a | Std. Dev. | Range | |||
| WA-F | 0.83 | 11.17 | 0.12 NS | 12.57 | −51.14–28.51 |
| WA-W | 0.81 | 17.46 | 0.05 NS | 20.46 | −64.82–76.08 |
| WA-C | 0.86 | 10.49 | 0.19 NS | 11.91 | −43.60–29.22 |
© 2016 by the authors; licensee MDPI, Basel, Switzerland. This article is an open access article distributed under the terms and conditions of the Creative Commons Attribution (CC-BY) license (http://creativecommons.org/licenses/by/4.0/).
Share and Cite
Cao, L.; Gao, S.; Li, P.; Yun, T.; Shen, X.; Ruan, H. Aboveground Biomass Estimation of Individual Trees in a Coastal Planted Forest Using Full-Waveform Airborne Laser Scanning Data. Remote Sens. 2016, 8, 729. https://doi.org/10.3390/rs8090729
Cao L, Gao S, Li P, Yun T, Shen X, Ruan H. Aboveground Biomass Estimation of Individual Trees in a Coastal Planted Forest Using Full-Waveform Airborne Laser Scanning Data. Remote Sensing. 2016; 8(9):729. https://doi.org/10.3390/rs8090729
Chicago/Turabian StyleCao, Lin, Sha Gao, Pinghao Li, Ting Yun, Xin Shen, and Honghua Ruan. 2016. "Aboveground Biomass Estimation of Individual Trees in a Coastal Planted Forest Using Full-Waveform Airborne Laser Scanning Data" Remote Sensing 8, no. 9: 729. https://doi.org/10.3390/rs8090729
APA StyleCao, L., Gao, S., Li, P., Yun, T., Shen, X., & Ruan, H. (2016). Aboveground Biomass Estimation of Individual Trees in a Coastal Planted Forest Using Full-Waveform Airborne Laser Scanning Data. Remote Sensing, 8(9), 729. https://doi.org/10.3390/rs8090729