1. Introduction
A large amount of cloudy pixels in remote sensing data corrupts the accuracy of the retrieved parameters based on spectral reflectance for the MODerate Resolution Imaging Spectroradiometer (MODIS) band, such as land cover classification, Normalized Difference Vegetation Index (NDVI), and albedo, and obstructs the fusing of multi-source data. Thus, retrieval of reflectance of pixels under clouds is particularly necessary for most remote sensing land applications.
To retrieve data from bad pixels, multiple methods using image processing have been proposed. These existing methods can be divided into three categories: (1) spatial-based methods; (2) spectral-based methods; and (3) temporal-based methods [
1].
Specifically, a few representative spatial-based methods include interpolation based on various mathematical methods (e.g., bilinear, nearest neighbor, and cubic convolution), globe fitting, and Within-Class Globe Fitting (WCGF). Without spatial heterogeneity, spatial-based methods may only be effective when restoring cloudy pixels in a very small area, and their accuracy is unsatisfactory.
Owing to the poor applicability and uncertain accuracy of spatial-based methods, several spectral-based methods have been proposed. Wang et al. were able to retrieve the Aqua MODIS band 6 data using the relationship between MODIS bands 6 and 7, which makes skillful use of the similarity between Aqua MODIS and Terra MODIS [
2]. Subsequently, many methods have been proposed on the basis of Wang and coworkers’ work, e.g., Histogram Matching and Local Least Squares Fitting (HMLLSF) and Within-Class Local Fitting (WCLF) [
3,
4]. Furthermore, to optimize the use of multispectral information, Gladcova et al. proposed a new quantitative image-restoration method that considers the correlation among MODIS bands 1–7 [
5]. Li et al. retrieved Aqua MODIS band 6 data by fitting the relationship between Aqua MODIS band 6 and the other six bands using robust m-estimator multi-regression, which effectively optimizes the driving data samples [
6]. Shen et al. restored Aqua MODIS band 6 data using adaptive spectrum-weighted sparse Bayesian dictionary learning with the other six bands [
7]. These methods made the best of other available spectral information and observations at neighboring locations around the target pixels in a corrupted spectral band. However, all spectral channels within the shortwave spectrum will be polluted by clouds when it is cloudy, which means there will not be sufficient complementary information to reconstruct a cloudy pixel; therefore, these methods are not applicable to cloudy pixels.
To retrieve bad pixels with clouds, a temporal-based method has been proposed that uses consecutive observations of the same spectral band at the same location to reconstruct bad pixels when complementary spectral information is lacking. Lin et al. proposed replacing the missing image using optimal information from the same region in a referenced image when the time interval between the missing image and the referenced image is short enough [
1]. The method appeared to demonstrate better results than a method proposed by the joint U.S. Geological Survey (USGS) Landsat team to reconstruct data gaps in SLC-off images (i.e., images taken when the Scan Line Corrector (SLC) is not available) [
8]; however, the result of this method depends greatly on the selected sampling, and therefore its accuracy is uncertain. In addition, Li et al. proposed multitemporal dictionary learning algorithms and expanded on their K-SVD and Bayesian counterparts to reconstruct bad pixels [
9]. These methods reconstruct remote sensing data based on mathematical methods, which may result in the incredible accuracy.
The aforementioned methods deal with bad pixels using computer graphics/image processing methods; however, they have several disadvantages from the viewpoint of quantitative remote sensing: (1) since these methods are based on mathematical and empirical methods, a physical infrastructure is lacking; (2) because of the lack of a physical infrastructure, the applicable range of the methods is very narrow; and (3) quantitative remote sensing evaluations are lacking for these methods, leading to uncertainty in the accuracy of the methods. These disadvantages are the reasons why these methods have not yet been widely used to retrieve spectral reflectance for sensor’s band of cloudy pixels in quantitative remote sensing research. Regrettably, only a few methods (e.g., bilinear and histogram matching) are widely used for resampling and interpolation in quantitative remote sensing.
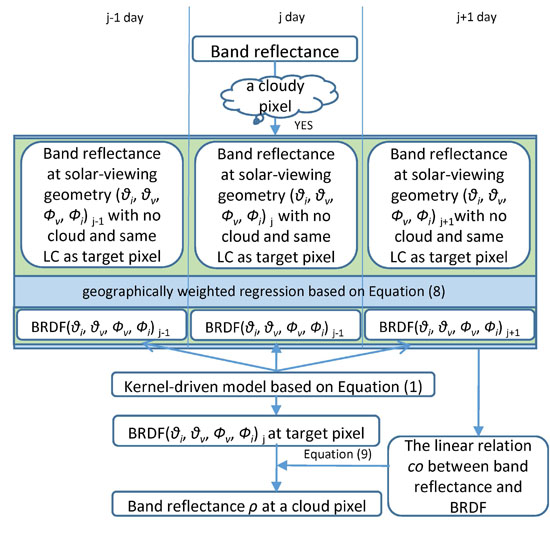
Therefore, determining a method to retrieve the spectral surface reflectance for the sensor’s band of cloudy pixels with sufficient accuracy and quality to be used to retrieve high-level land surface parameters is of urgent priority. However, few works reconstruct the spectral reflectance for sensor’s band of cloudy pixels. In reality, quantitative remote sensing research involves multiple theories and technology which can deal with cloudy pixels with higher accuracy than that of the methods in the field of image processing. First, the Bidirectional Reflectance Distribution Function (BRDF) can describe the land-surface reflective anisotropy very accurately [
10,
11]. In addition, the land cover is usually stable over short periods (e.g., a week or a month). If the land surface is stable, its BRDF is relatively unchanged in its spatial distribution in the reflective direction and shifts only in magnitude within a short period [
12]. Based on this, Shuai et al. fused Landsat 5 reflectance at 30-m resolution and MODIS BRDF at 500-m resolution to retrieve Landsat albedo at 30-m resolution in a snow-free area [
13]. Franch et al. derived the Landsat surface albedo and daily MODIS land surface albedo based on Vermote–Justice–Bréon (VJB) method [
14,
15]. In addition, some early companion studies made use of the fusion of multi-source data to improve the spatio-temporal resolution of the land surface albedo [
16,
17]. Based on these studies, the reflectance data can be used to derive the albedo data using BRDF parameters, and in theory, the spectral reflectance for sensor’s band of cloudy pixels can be retrieved by fitting a relative of the spectral reflectance for sensor’s band and the corresponding BRDF from the cloud-free and neighboring pixels. The method proposed in this study retrieves spectral reflectance for MODIS band based on a multitude of driving data that have a spatio-temporal mismatch with respect to the target data; however, such driving data do not exist to derive the albedo. Therefore, a scheme to decrease the error from the spatial mismatches between the driving data and target data is required. The proposed method introduces Tobler’s First Law (TFL), which defines all attribute values on a geographic surface as being related to each other, with closer values being more strongly related than farther values. All geographical studies are confronted with the problem of spatial heterogeneity, which has been identified in many studies [
18]. Subsequently, numerous local or location-based spatial analysis methods have been developed to address this problem over the past two decades, including the geographically weighted regression (GWR) method [
19]. Theoretically, GWR can solve the problem of spatial heterogeneity while retrieving land surface parameters. In addition, several studies have used GWR to address spatial heterogeneity while retrieving precipitation data [
20,
21]. Accordingly, this study introduces GWR to address errors arising from spatial heterogeneity while fitting spatial data.
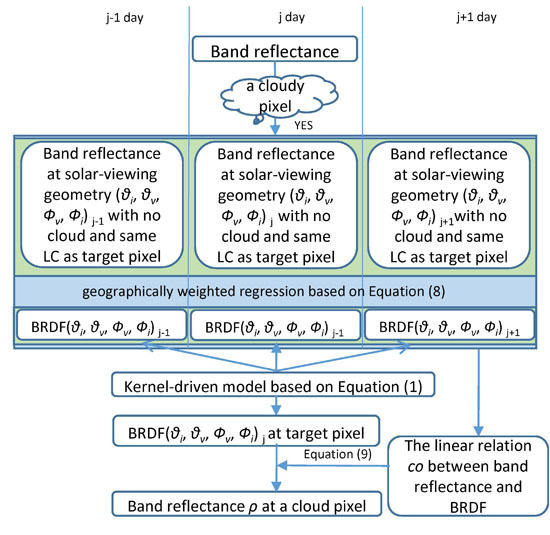
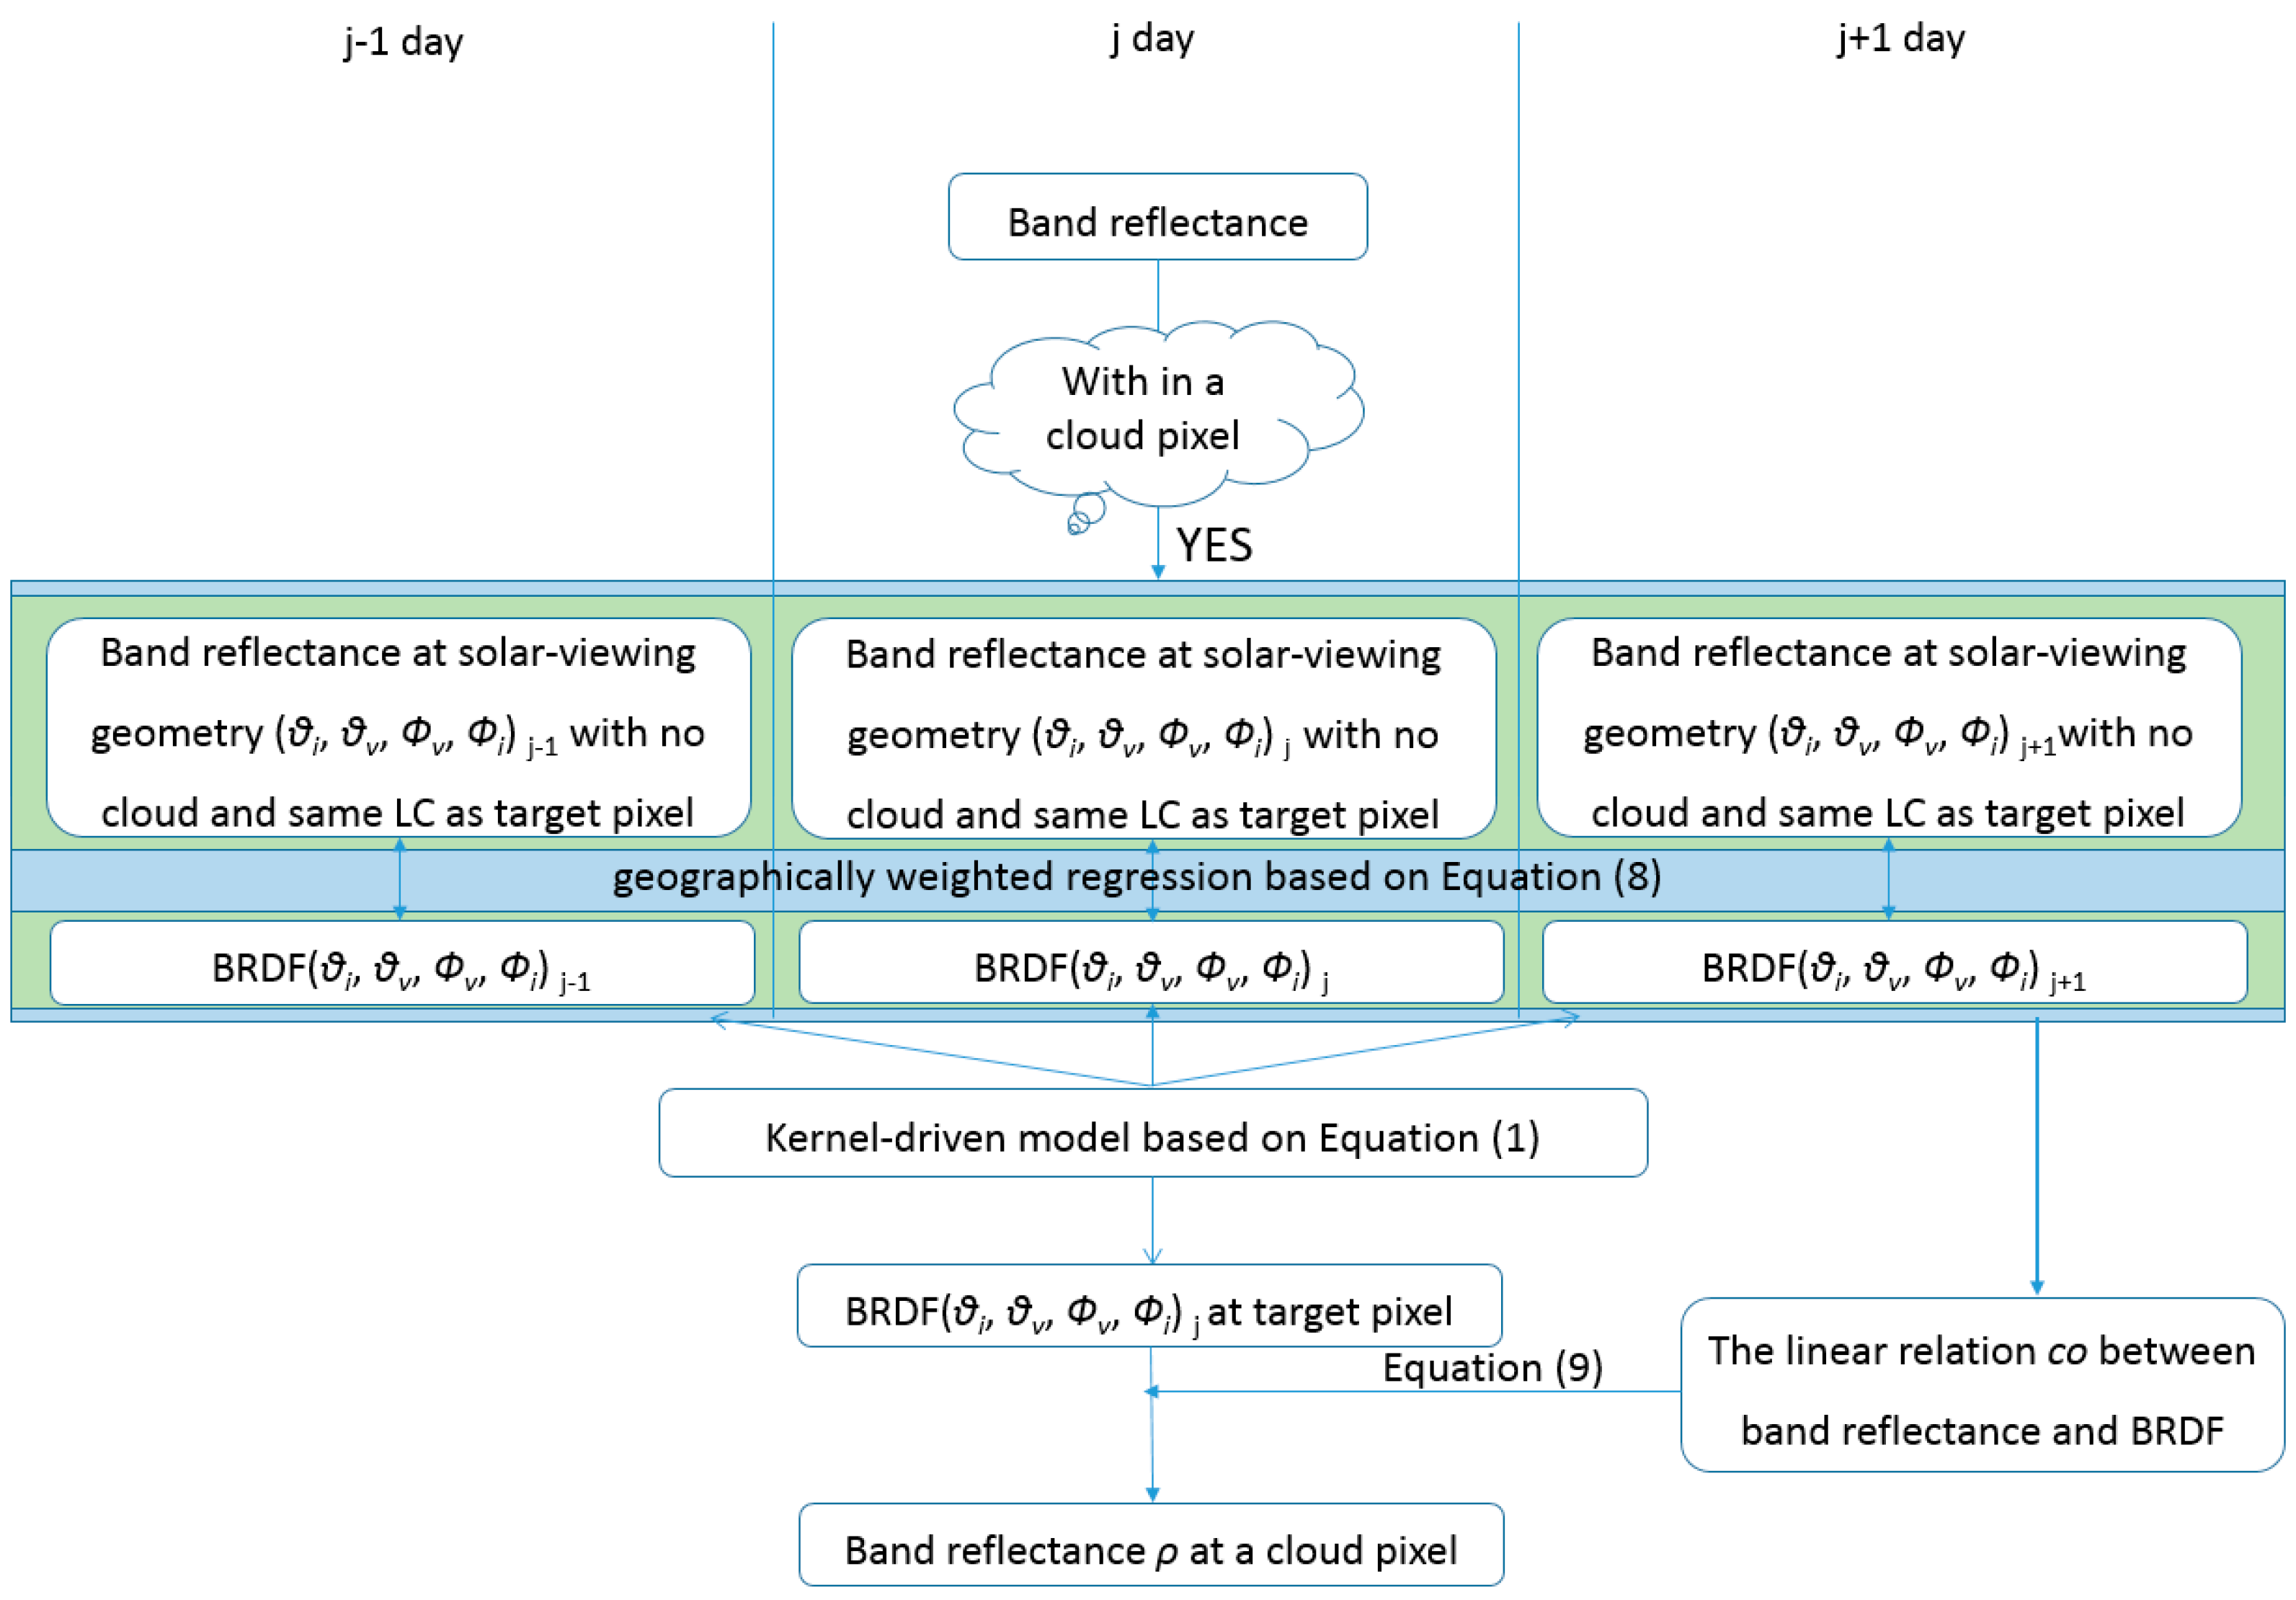
With the aim of retrieving spectral reflectance for MODIS the band of cloudy pixels with a higher accuracy, this study made use of multi-temporal data extracted from MODIS observations (e.g., spectral reflectance for MODIS band and solar-viewing geometry) and the MODIS BRDF (MCD43A1 V005) to retrieve MODIS surface reflectance (MOD09GA) of cloudy pixels based on GWR. Compared with other existing methods, the proposed method offers several improvements, i.e., the method: (1) applies an algorithm that retrieves land surface albedo to retrieve the spectral reflectance for MODIS band of cloudy pixels, which improves the accuracy and applicability of the method compared with existing methods; (2) constructs sample reflectance pairs from the observed data and the data calculated with the BRDF to eliminate errors from the anisotropic bidirectional reflectance distribution of a land surface; (3) introduces GWR and optimizes the samples of the driving data to eliminate the error arising from spatial heterogeneity; and (4) includes a more comprehensive evaluation scheme with the criterion of quantitative remote sensing to ensure that the results have sufficient precision. An experiment was conducted in the Heihe River Basin to validate the method.
Section 2 introduces the theoretical basis and the details of the procedure to derive the Terra MODIS data.
Section 3 introduces the study area and the data. In
Section 4, the results of applying the proposed method to the study area are described.
Section 5 proposes a comprehensive evaluation scheme and discusses the accuracy of the proposed method by comparing it with other methods (e.g., WCGF, Lin, and VJB).
Section 6 discusses the limitations of the proposed method and future improvements to enhance it.
3. Study Area and Data
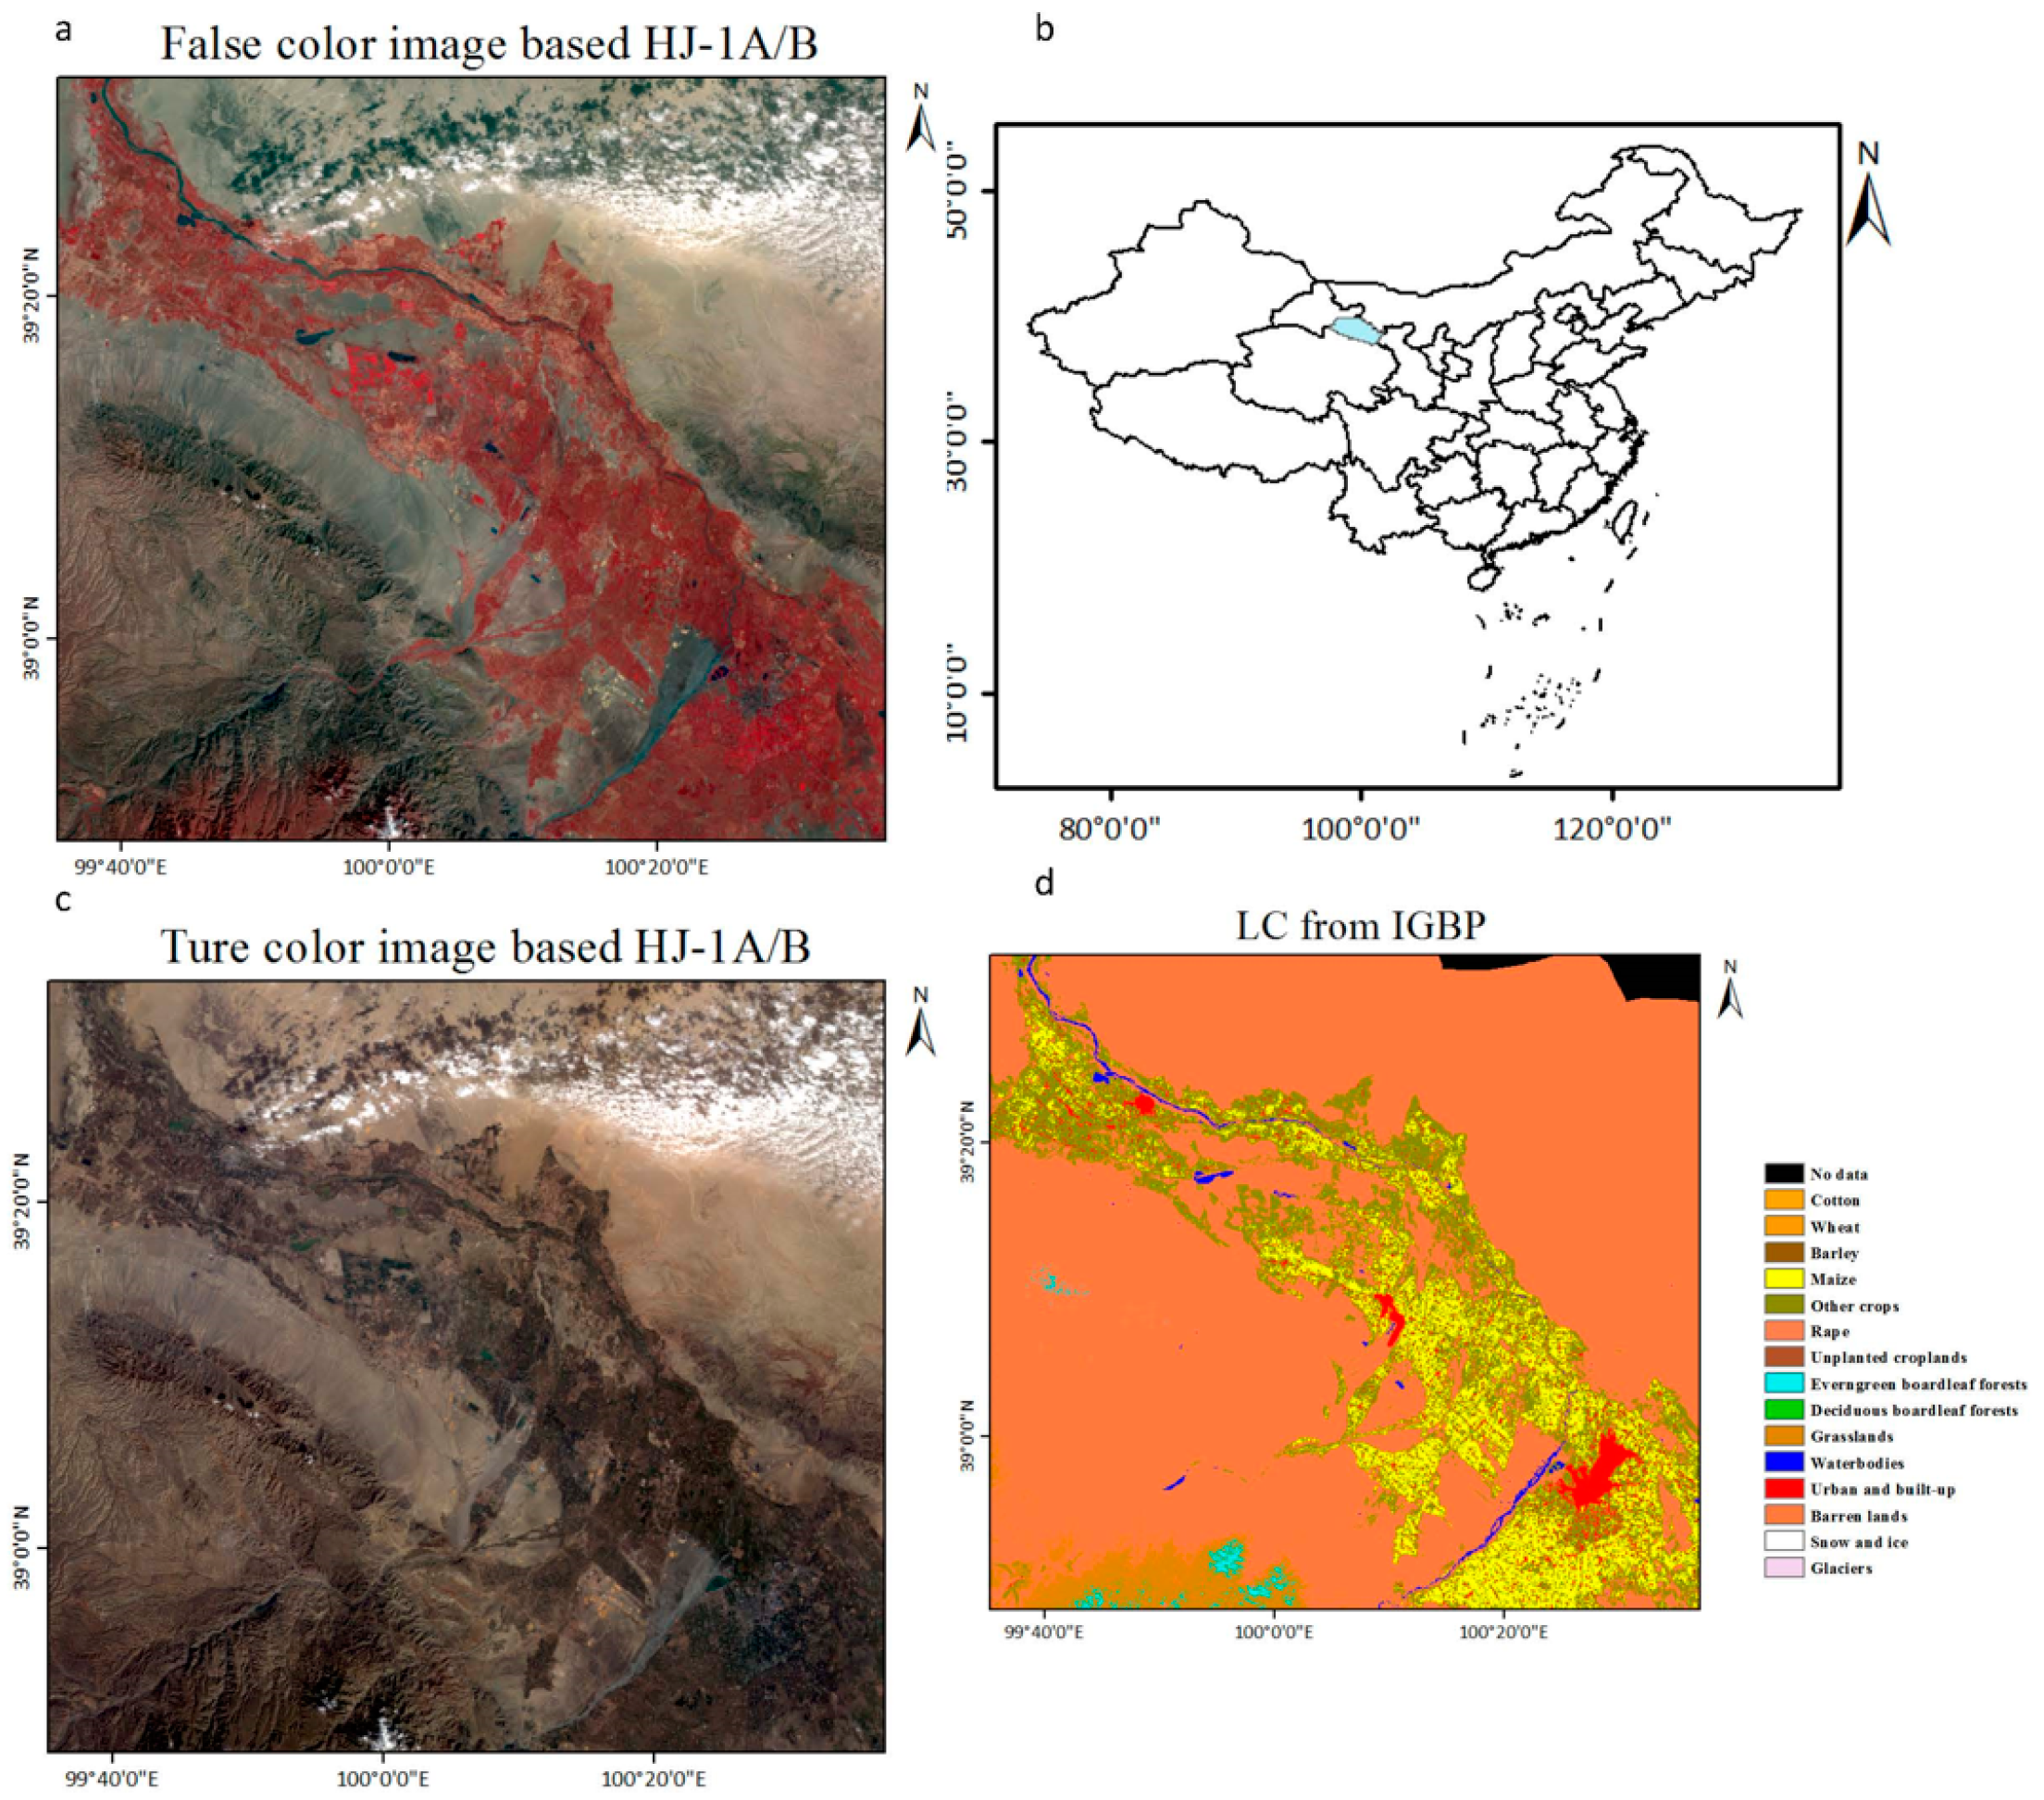
The Heihe River Basin is an inland river basin in China and has great elevation difference and temperature difference between day and night. It contains various types of ecosystems and land cover, making it an ideal natural watershed for comprehensive research in hydrology, phenology, and climate (
Figure 2). Hence, this region was selected as the study area because numerous scientific experiments have been conducted in the region, providing sufficient remote sensing data and ground measurements for our study [
24,
25]. Moreover, our team has also conducted considerable research and we have a deeper understanding of this region.
In addition, two MODIS datasets were used in the experiment. One is the MODIS land surface reflectance (MOD09GA), which has a 1-day temporal resolution and a 500-m spatial resolution; the other is the BRDF of MODIS (MCD43A1), which has an 8-day temporal resolution and a 500-m spatial resolution and is used to construct the linear relationship between the observed reflectance and that the reflectance calculated with the BRDF.
Based on the International Geosphere-Biosphere Program (IGBP) [
26,
27], HJ-1A/B [
28] land cover data are divided into 15 classes (i.e., cotton, wheat, barley, maize, other crops, rape, unplanted crops, evergreen broadleaf forests, deciduous broadleaf forests, grasslands, waterbodies, urban/built-up, barren lands, snow/ice, and glaciers), and neglected land cover types are not present in the Heihe River Basin. For spatial matching with MODIS data, HJ-1A/B land cover data are upscaled from 30 m to 500 m depending on the main class at 500-m MODIS pixel, and the HJ-1A/B land cover data can indicate the distinguishing land covers of the MODIS pixels very well.
4. Results
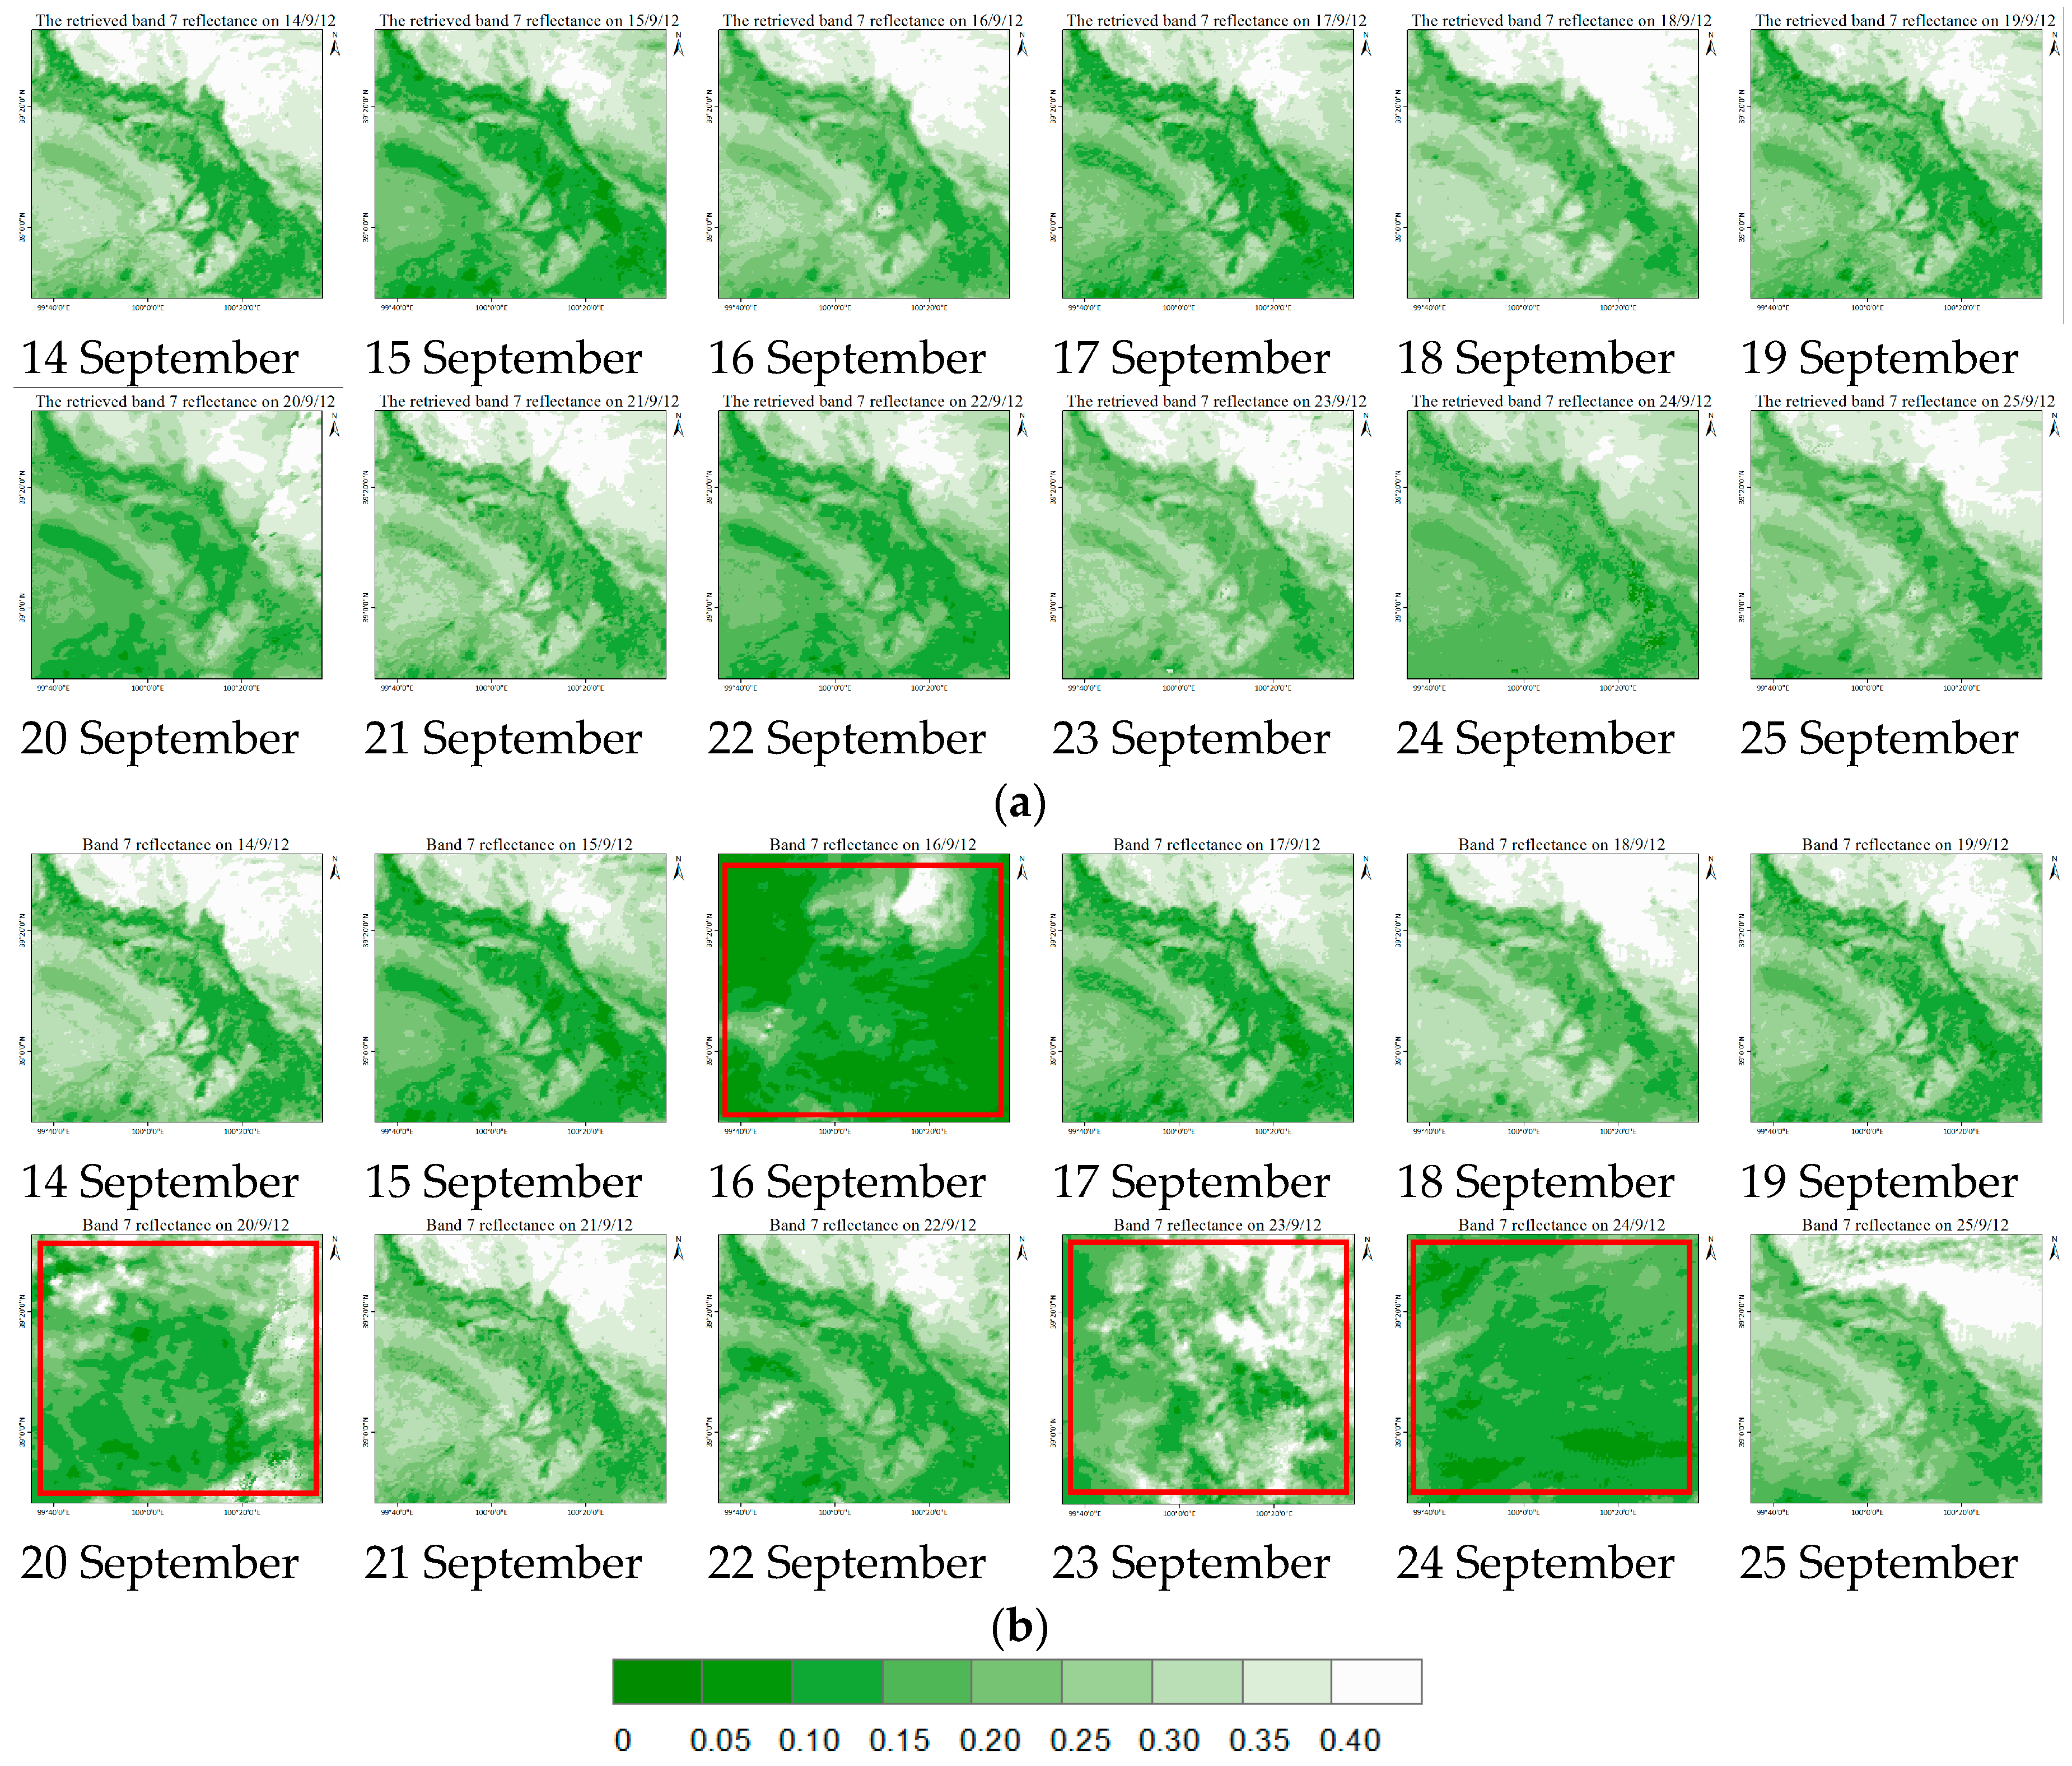
Based on the proposed method, an experiment was conducted in the Heihe River Basin. The proposed method was used for the cloudy pixels in the TERRA MODIS MOD09GA data. Moreover, we retrieved the Terra MODIS band 7 reflectance with clouds on the Heihe River Basin for 14–25 September 2012 (
Figure 3).
The retrieved band 7 reflectances show similar spatial distributions from 14 September to 25 September 2012, which means that the dataset has good quality and continuity through time, and the retrieved reflectance identifies the variation in the spatial distribution of the land surface according to the seasonal variations in the phenology. By contrast, the band 7 reflectance observed by MODIS displayed different spatial distributions owing to clouds (e.g., the data on 16, 20, 22, 23, 24, and 25 September 2012), which means that the effective observation is discontinuous. In particular, the observations on 16, 20, 23, and 24 September were completely covered with clouds; however, the corresponding retrieved data show a reasonable spatial and temporal distribution, as shown in
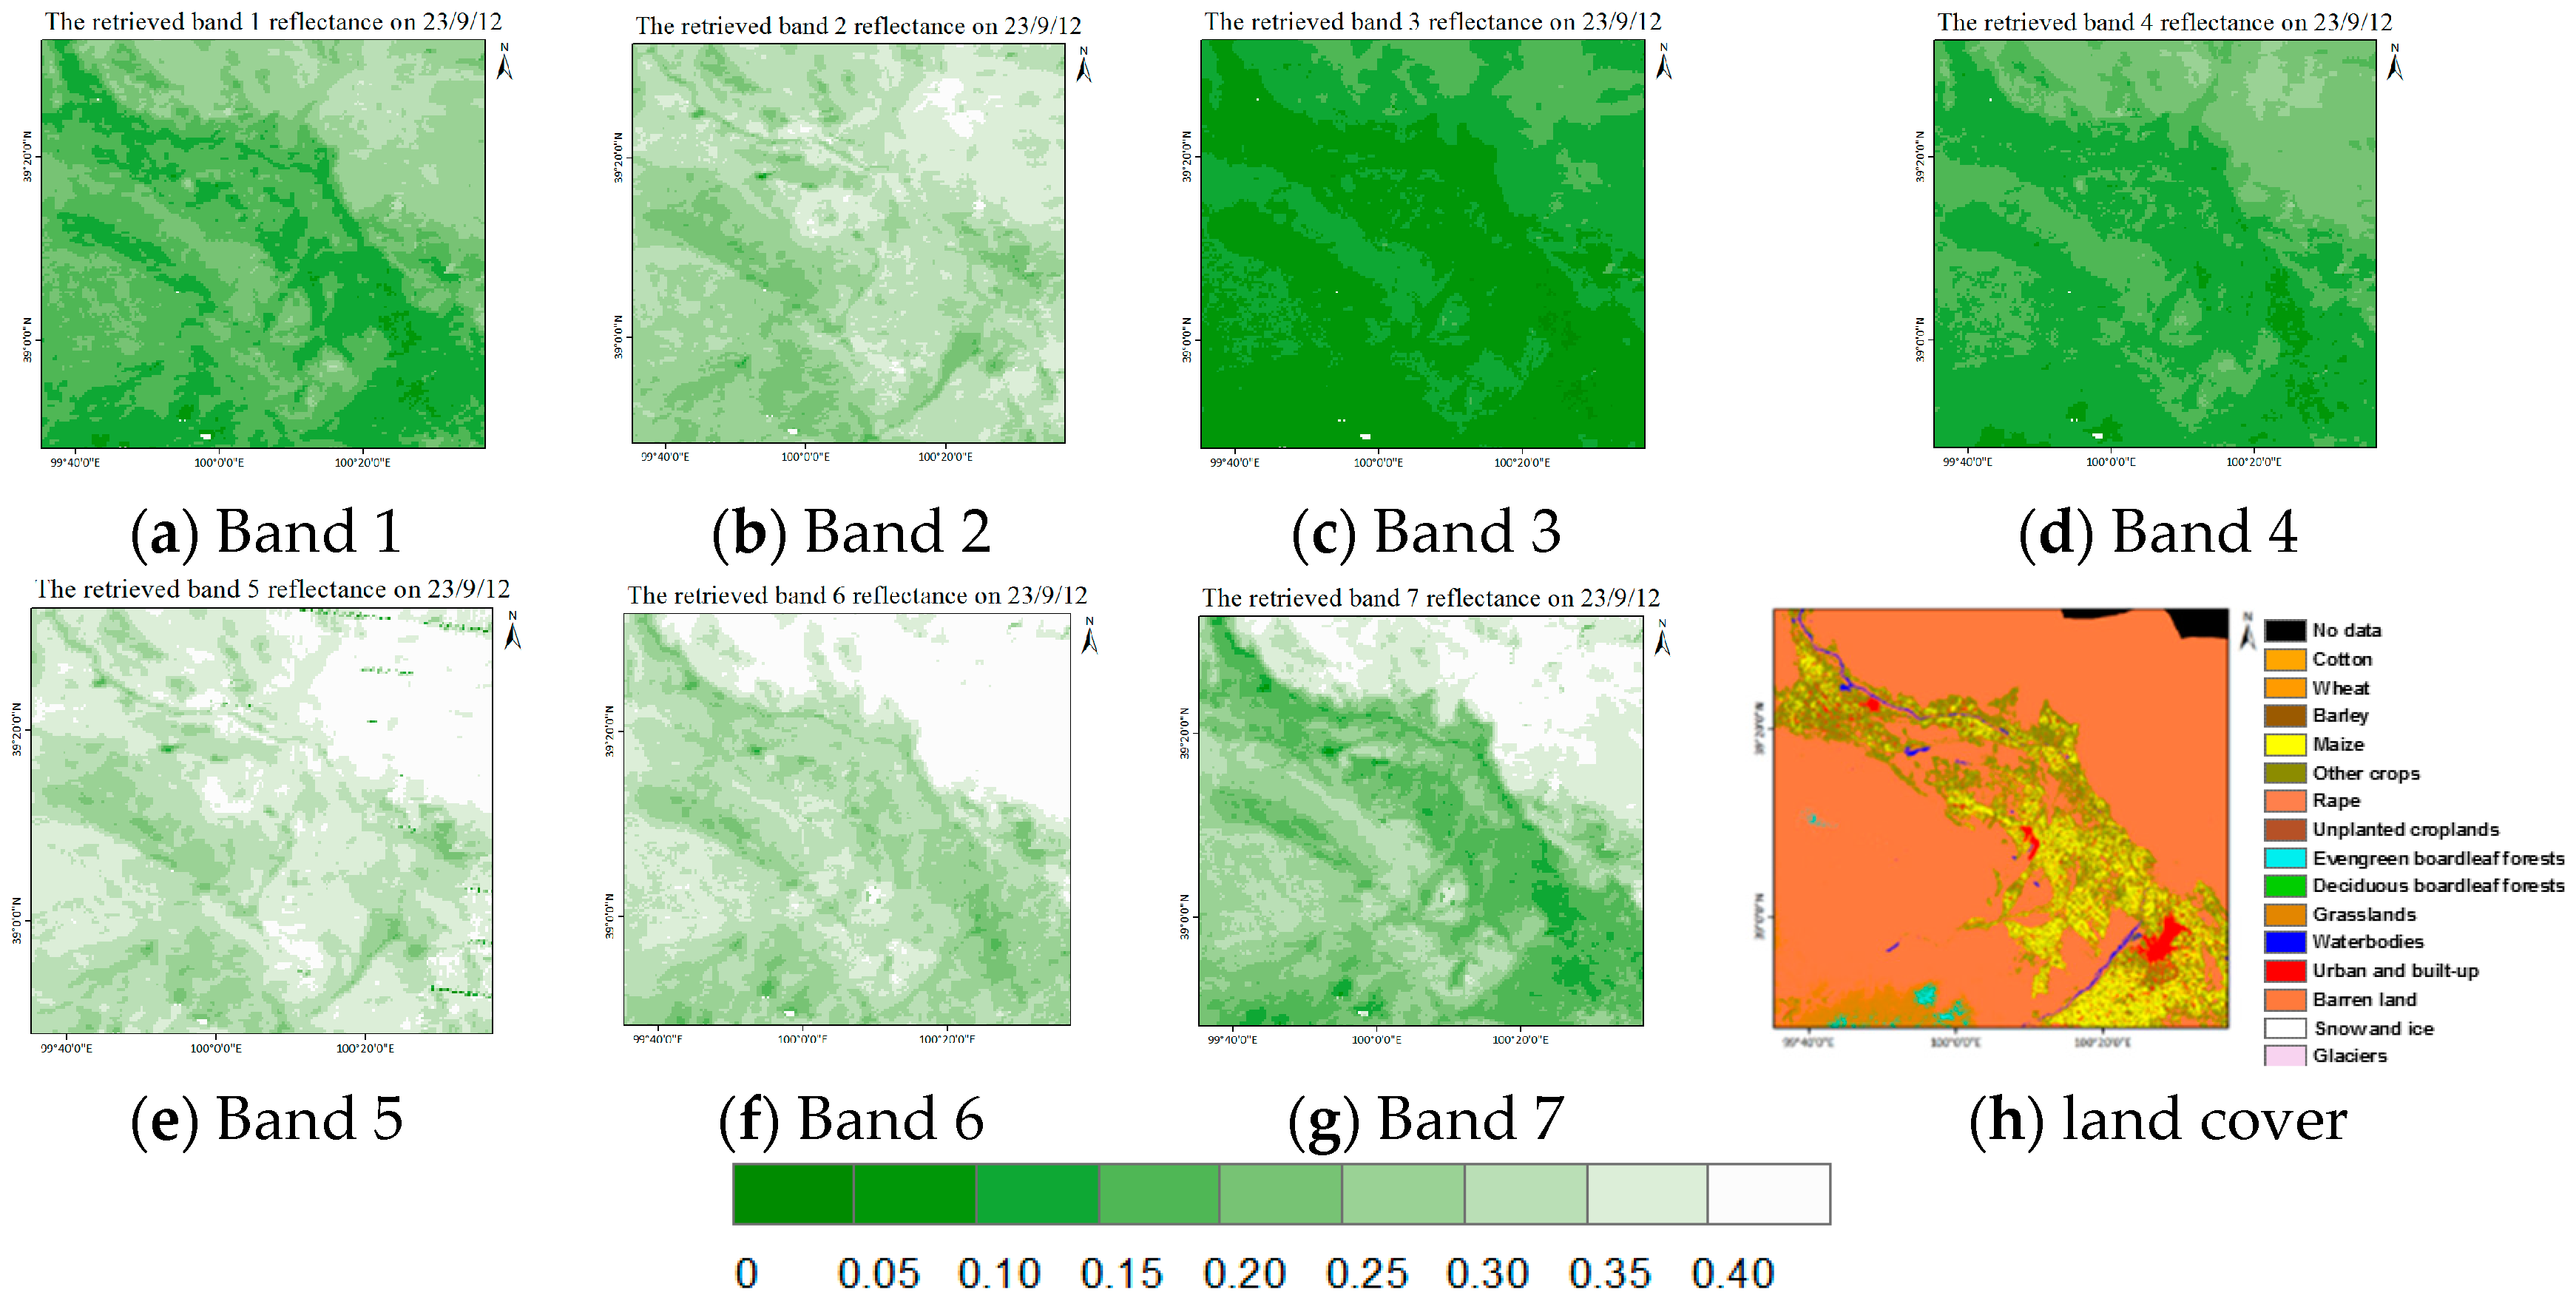
Figure 4 (the retrieved band 1–7 reflectance on 23 September 2012 was randomly selected as an example).
Based on
Figure 3, the band 7 observation on 23 September 2012 was masked by clouds completely; therefore, the band 1–6 reflectance should have also been completely masked due to the optical reflection characteristics of clouds.
Figure 4 shows that the retrieved spectral reflectance for MODIS band (
Figure 3a–g) had a reasonable spatial distribution compared with the land cover in Figur 3h. Therefore, the retrieved reflectance appears to be valid and close to the true value.
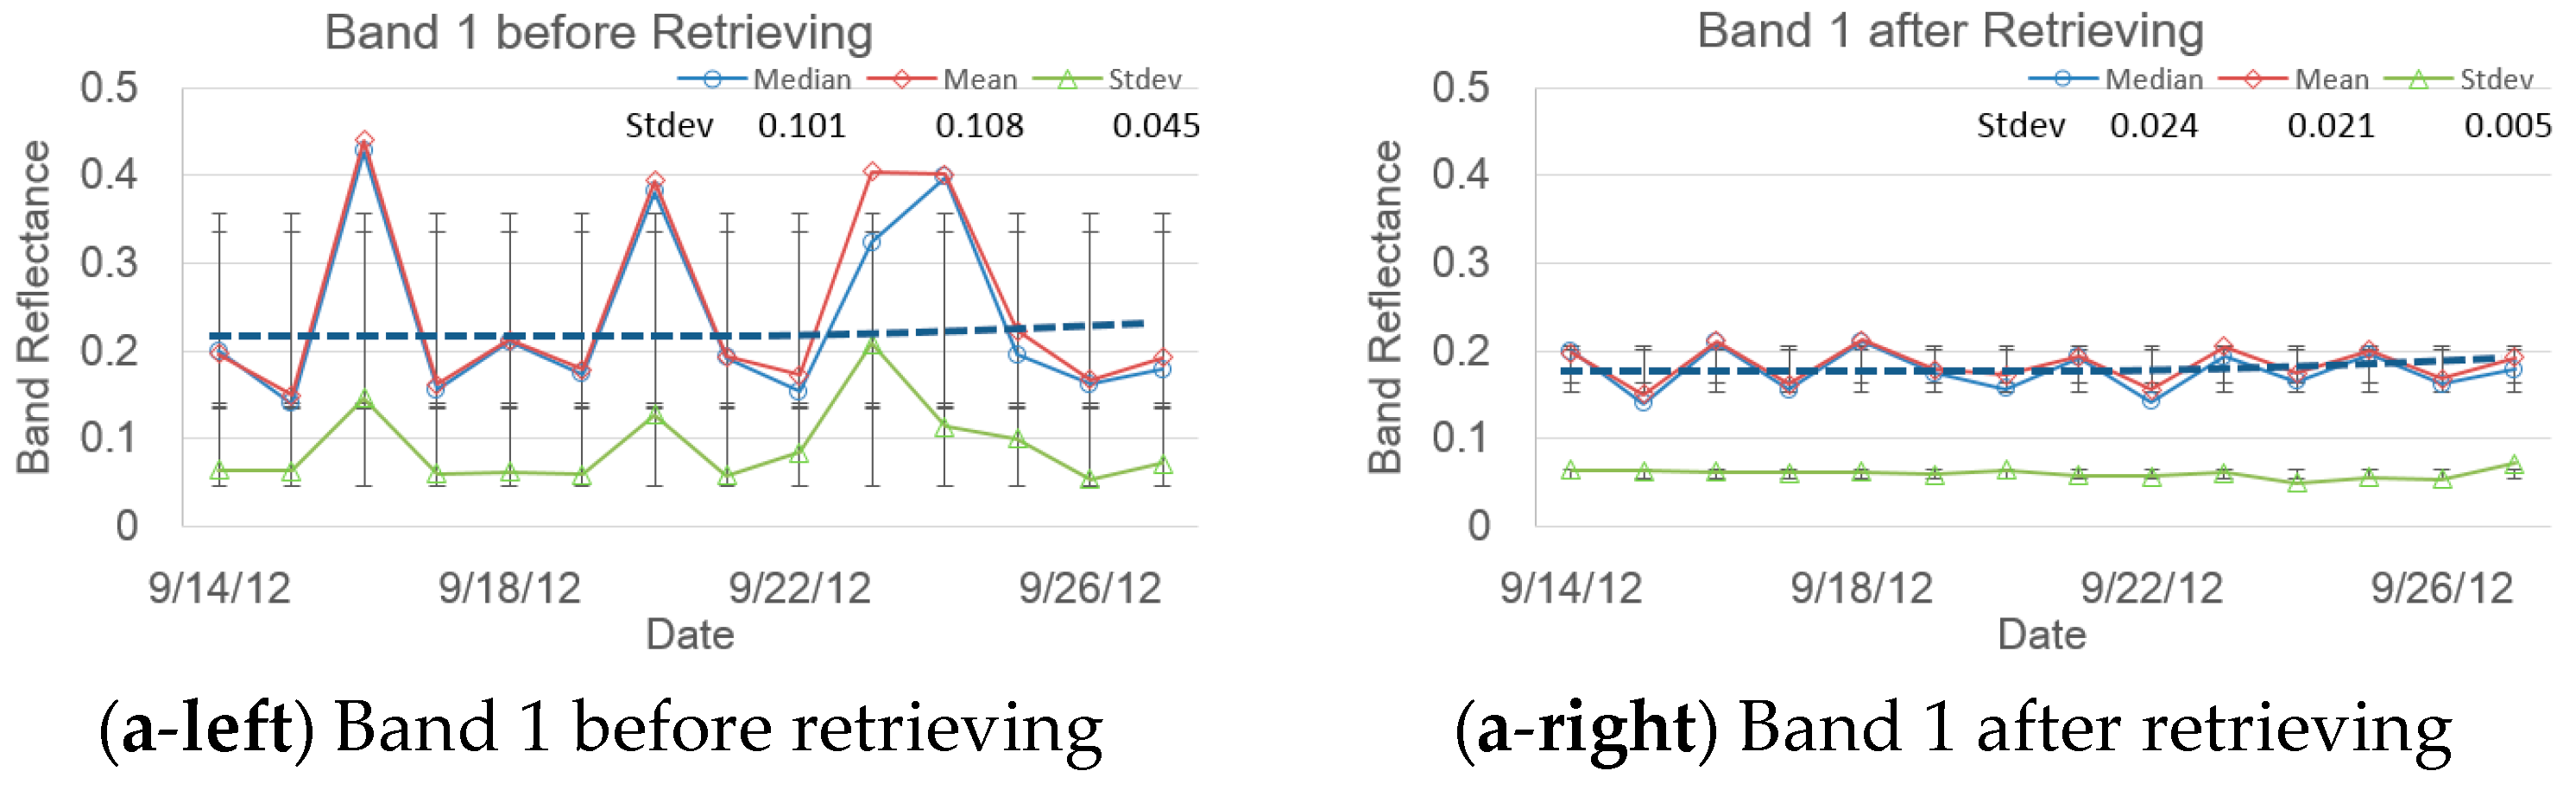
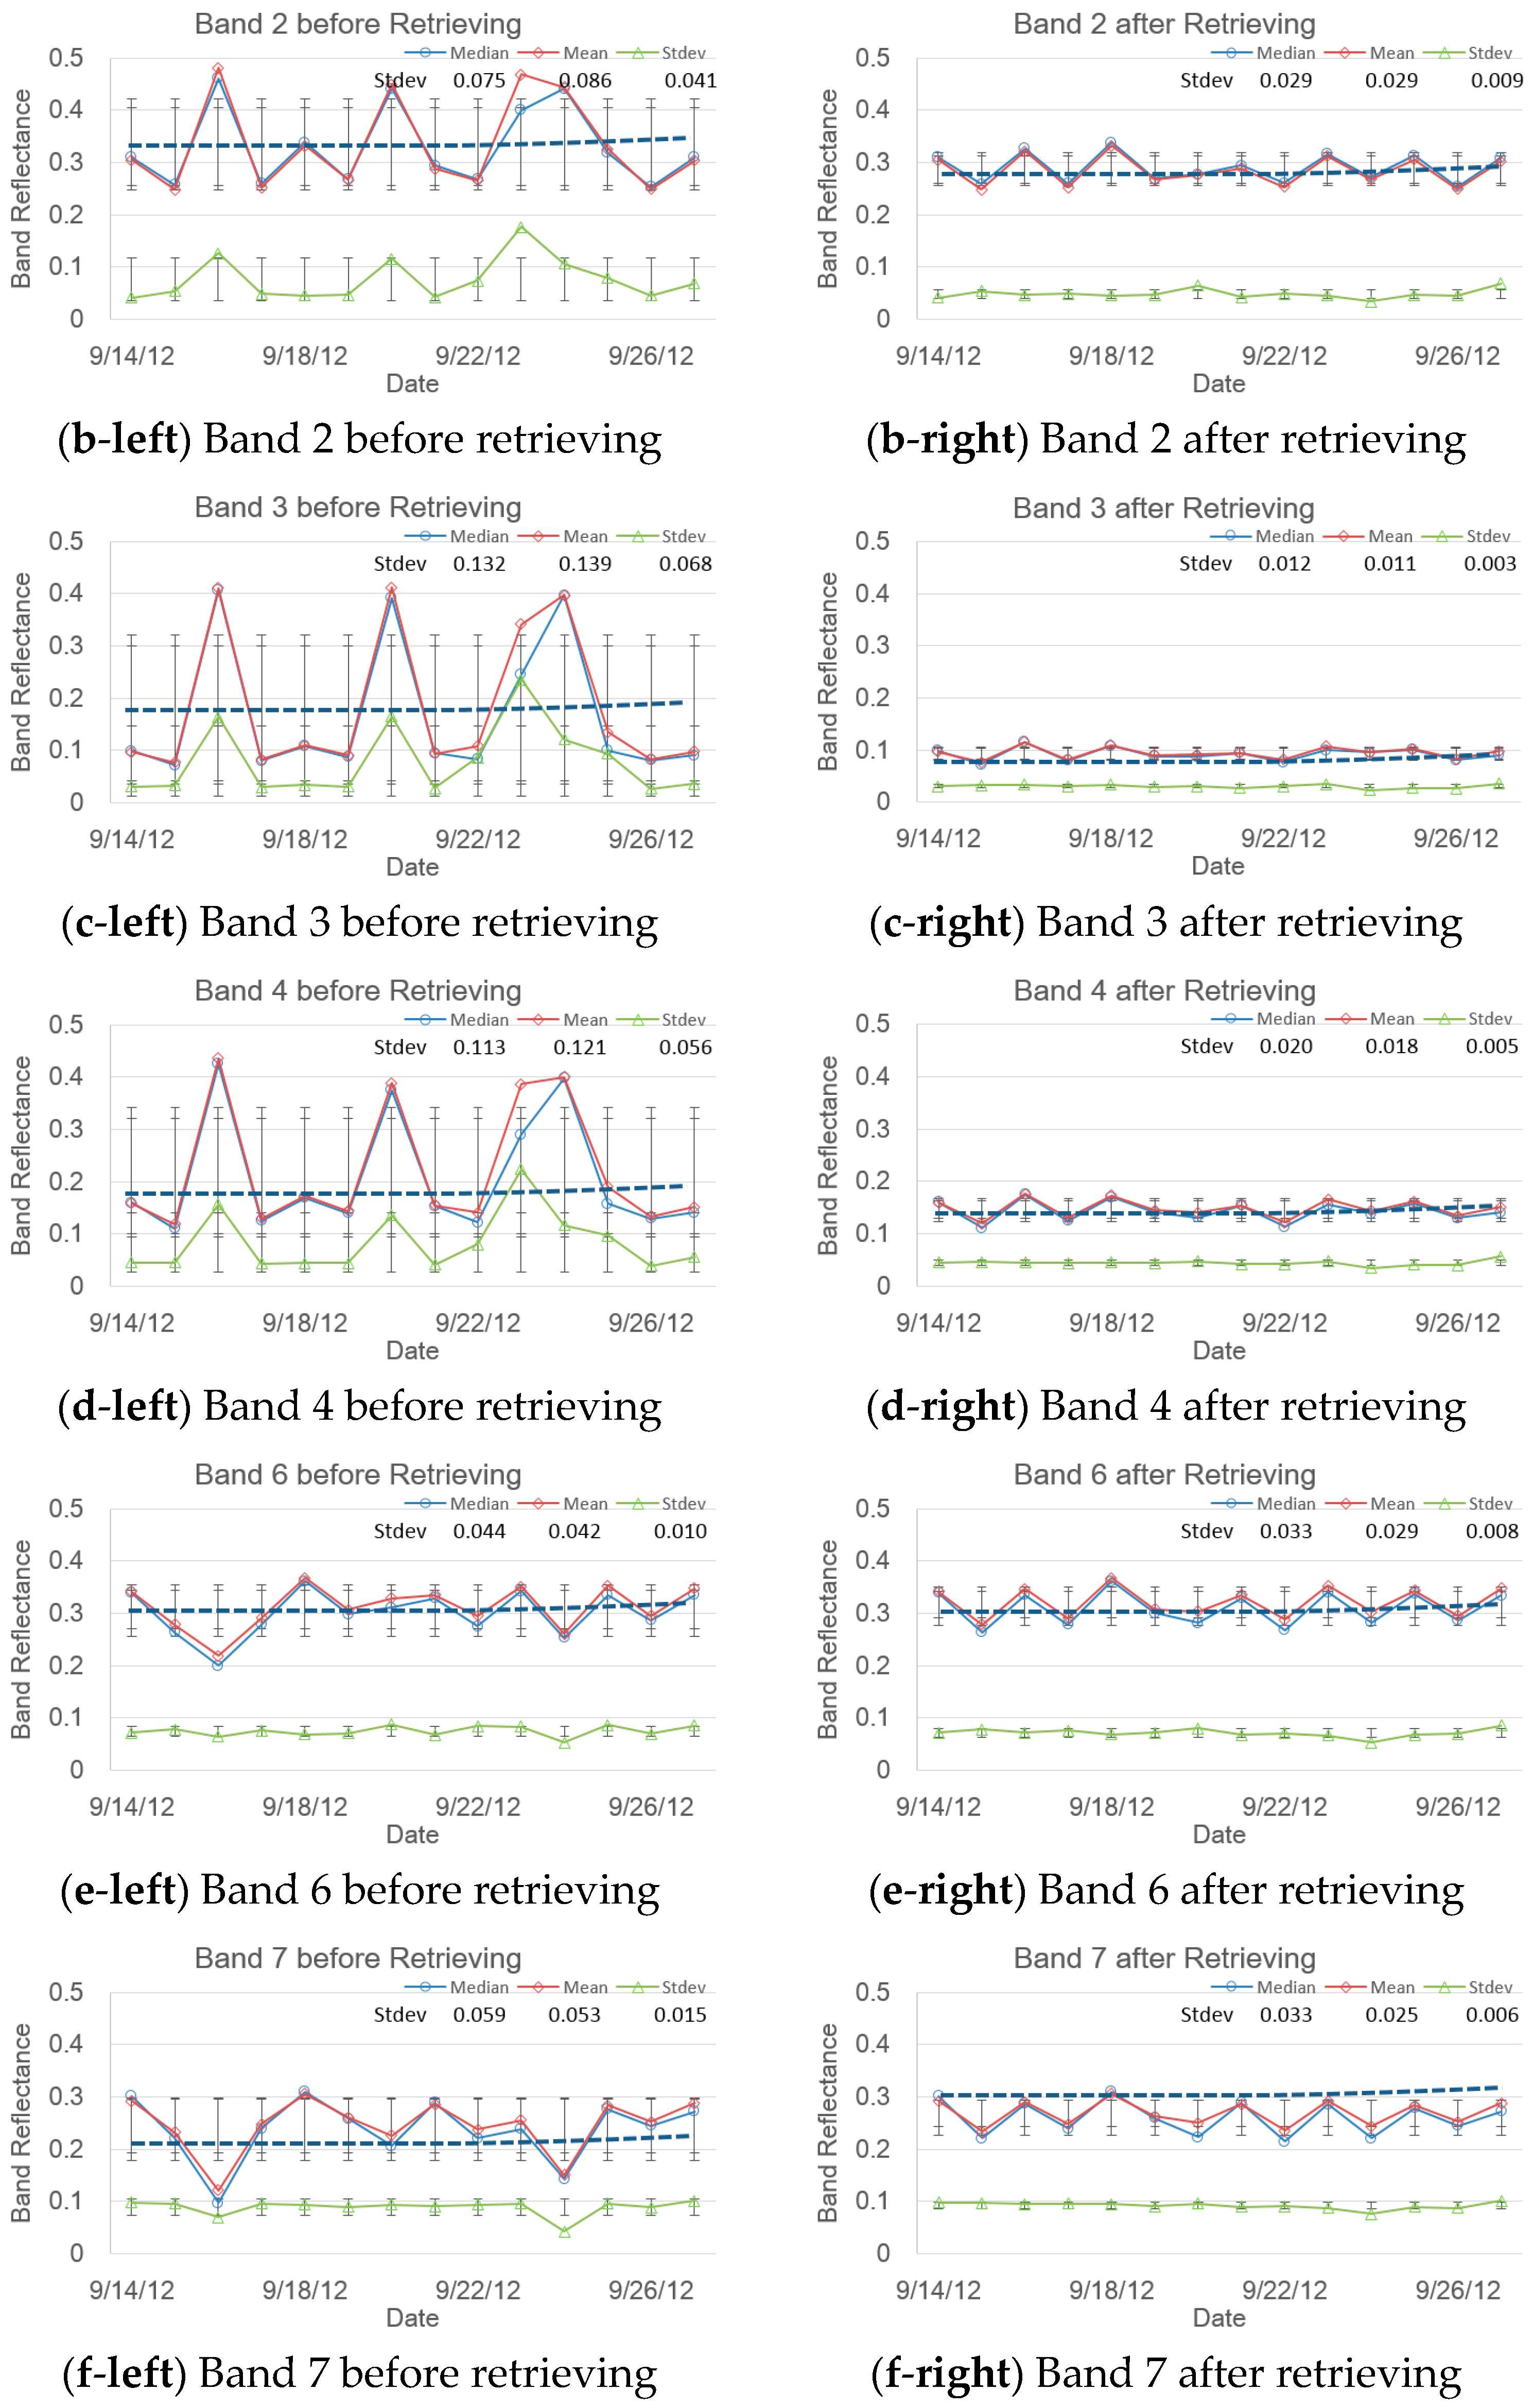
To further analyze the improved results of the proposed method, two time series from 14 September to 27 September 2012 (the observed and the retrieved values) were constructed and compared. Based on
Figure 3, the spectral reflectance for MODIS band included clouds at different levels on all days, resulting in a dramatic fluctuation in the statistical indices (e.g., the median, mean, and standard deviation) through time. However, the reflectance values of bands 1, 2, 3, 4, 6, and 7 are expected to be stable in September, judging from the phenological rule. Therefore, a trend of slow growth will appear as the chlorophyll in the vegetation as well as the soil moisture decrease, as shown by the blue trendline in
Figure 5.
In
Figure 5, the time series of the statistical indexes of the retrieved data are smoother than those of the observed data and closer to the blue trendline. This is because the observed data are influenced by the clouds, causing singularities in, and greater volatility of, the observations. This shows that the proposed method is very effective for retrieving the reflectance of cloudy pixels. The time series of the statistical indexes of the retrieved reflectance (e.g., the median, mean, and standard deviation) still show slight fluctuations, possibly because the land surface BRDF varies with varying solar-viewing geometry and the solar-viewing geometry of the spectral reflectance for MODIS band is different on each day [
29]. However, all the retrieved spectral reflectance for MODIS band had a reasonable spatial distribution that was the same as that of the land cover data with a slightly fluctuating and smoothly increasing trend, which is appropriate and in accordance with the phenological rule.
5. Validation and Discussion
From
Section 4, qualitative analysis shows that the results of the proposed method are rational. However, no improvement over the results of the other methods is shown. Therefore, in
Section 5, a complete validating scheme for determining the accuracy and improvement of the proposed method is discussed.
5.1. Validation and the Robustness of the Proposed Method
Although the effectiveness of the proposed method has been demonstrated, a quantitative validation is still necessary to show the extent to which the proposed method improves the results, because it is important that the accuracy of the proposed method should be able to satisfy the precision requirements for quantitative remote sensing.
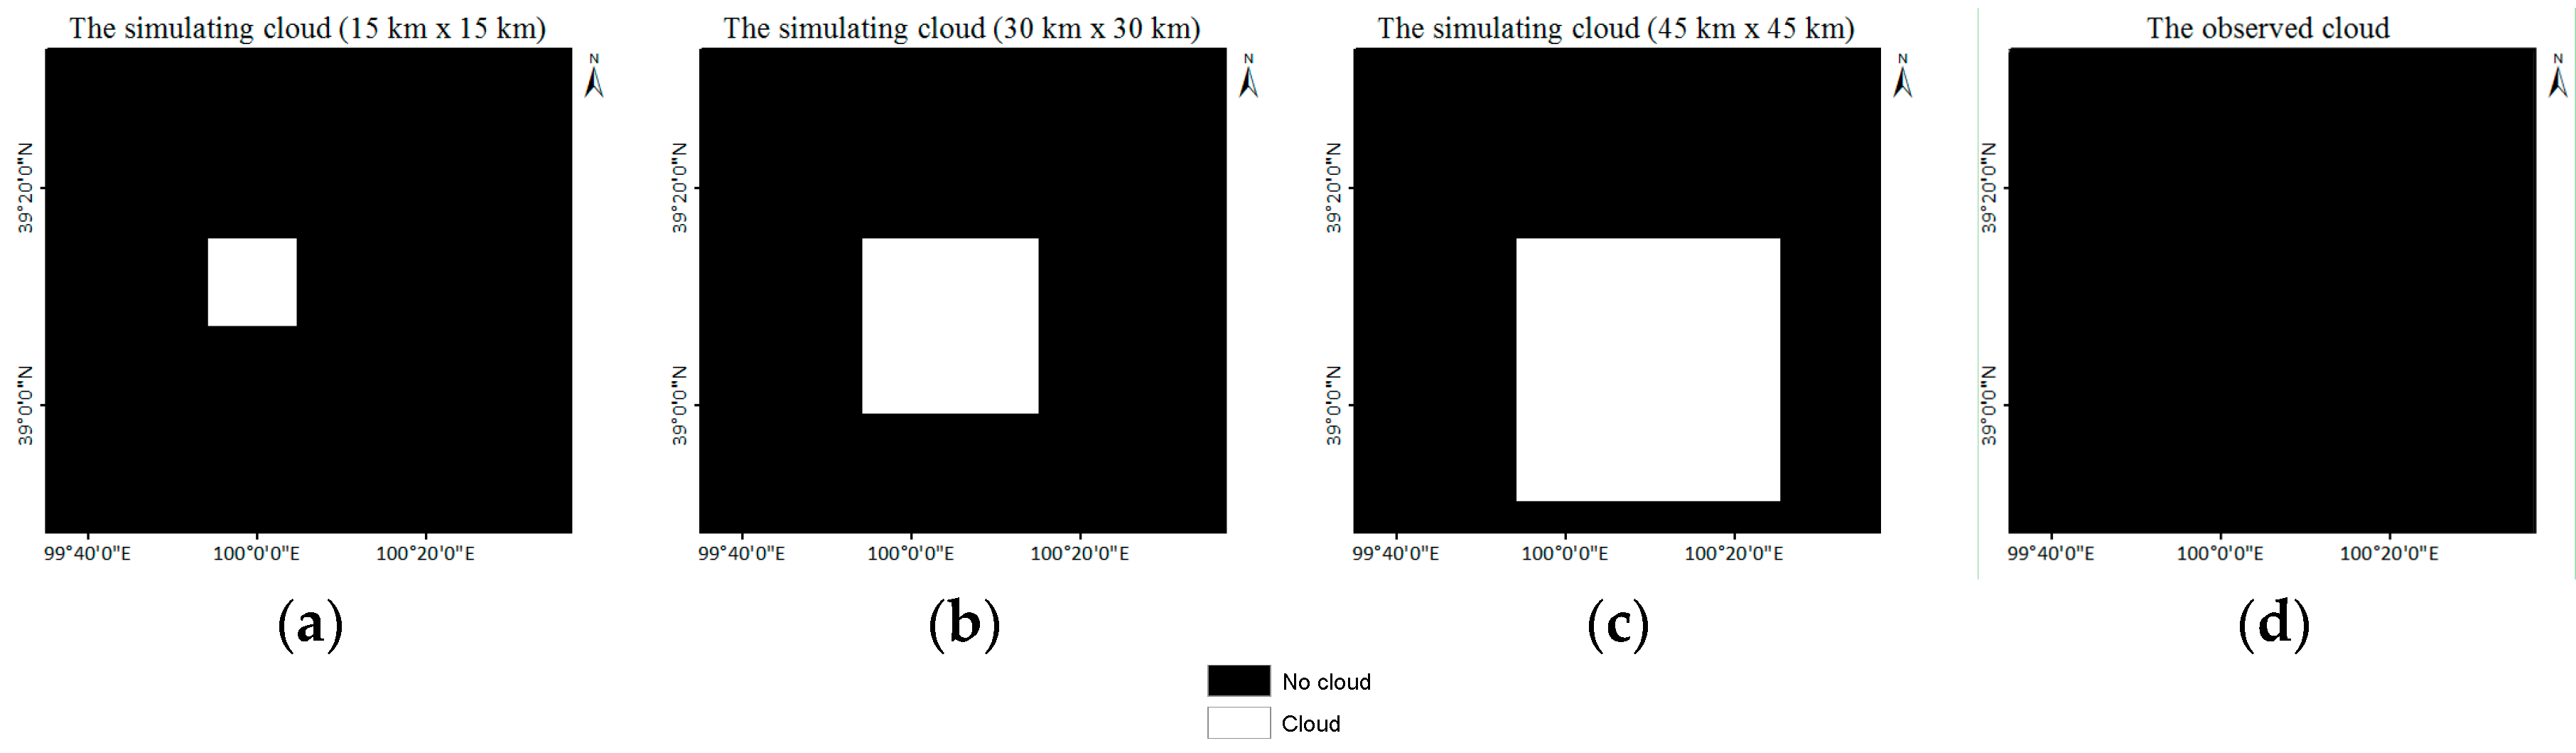
To validate the precision of the proposed method and to check its robustness, a scheme comprising two parts was drawn: First, acquiring the validation data. For this purpose, three simulated cloudy areas were constructed in the study area (
Figure 6) with different ranges (Simulation a (S-a): 15 km × 15 km; Simulation b (S-b): 30 km × 30 km; and Simulation c (S-c): 45 km × 45 km); furthermore, the reflectance at the no-cloud pixels within the simulating cloudy area was selected as validation data on 19 September 2012. Then, four methods, i.e., WCGF as the classic spatial-based method, Lin’s method as the classic temporal-based method, VJB method as the semi-empirical method, and the proposed method, were used on the three simulated cloudy areas separately based on the MCD09GA data on 19 September 2012.
Figure 7 shows the results from the four methods based on the simulated cloud areas presented in
Figure 6b in order to validate the precision of the proposed method. The results from WCGF show the worst spatial distribution among the four methods, while the other three methods had a similar spatial distribution. The red square encompasses both the simulated cloud region and the no-cloud region, and unreasonable spatial variations in the magnitude appear along the boundary of the simulated cloud region and the no-cloud region when using WCGF. Meanwhile, the spatial distribution of the result obtained from the proposed method and VJB method appears to be more similar to the MODIS reflectance than the result obtained from Lin’s method (the red square area in
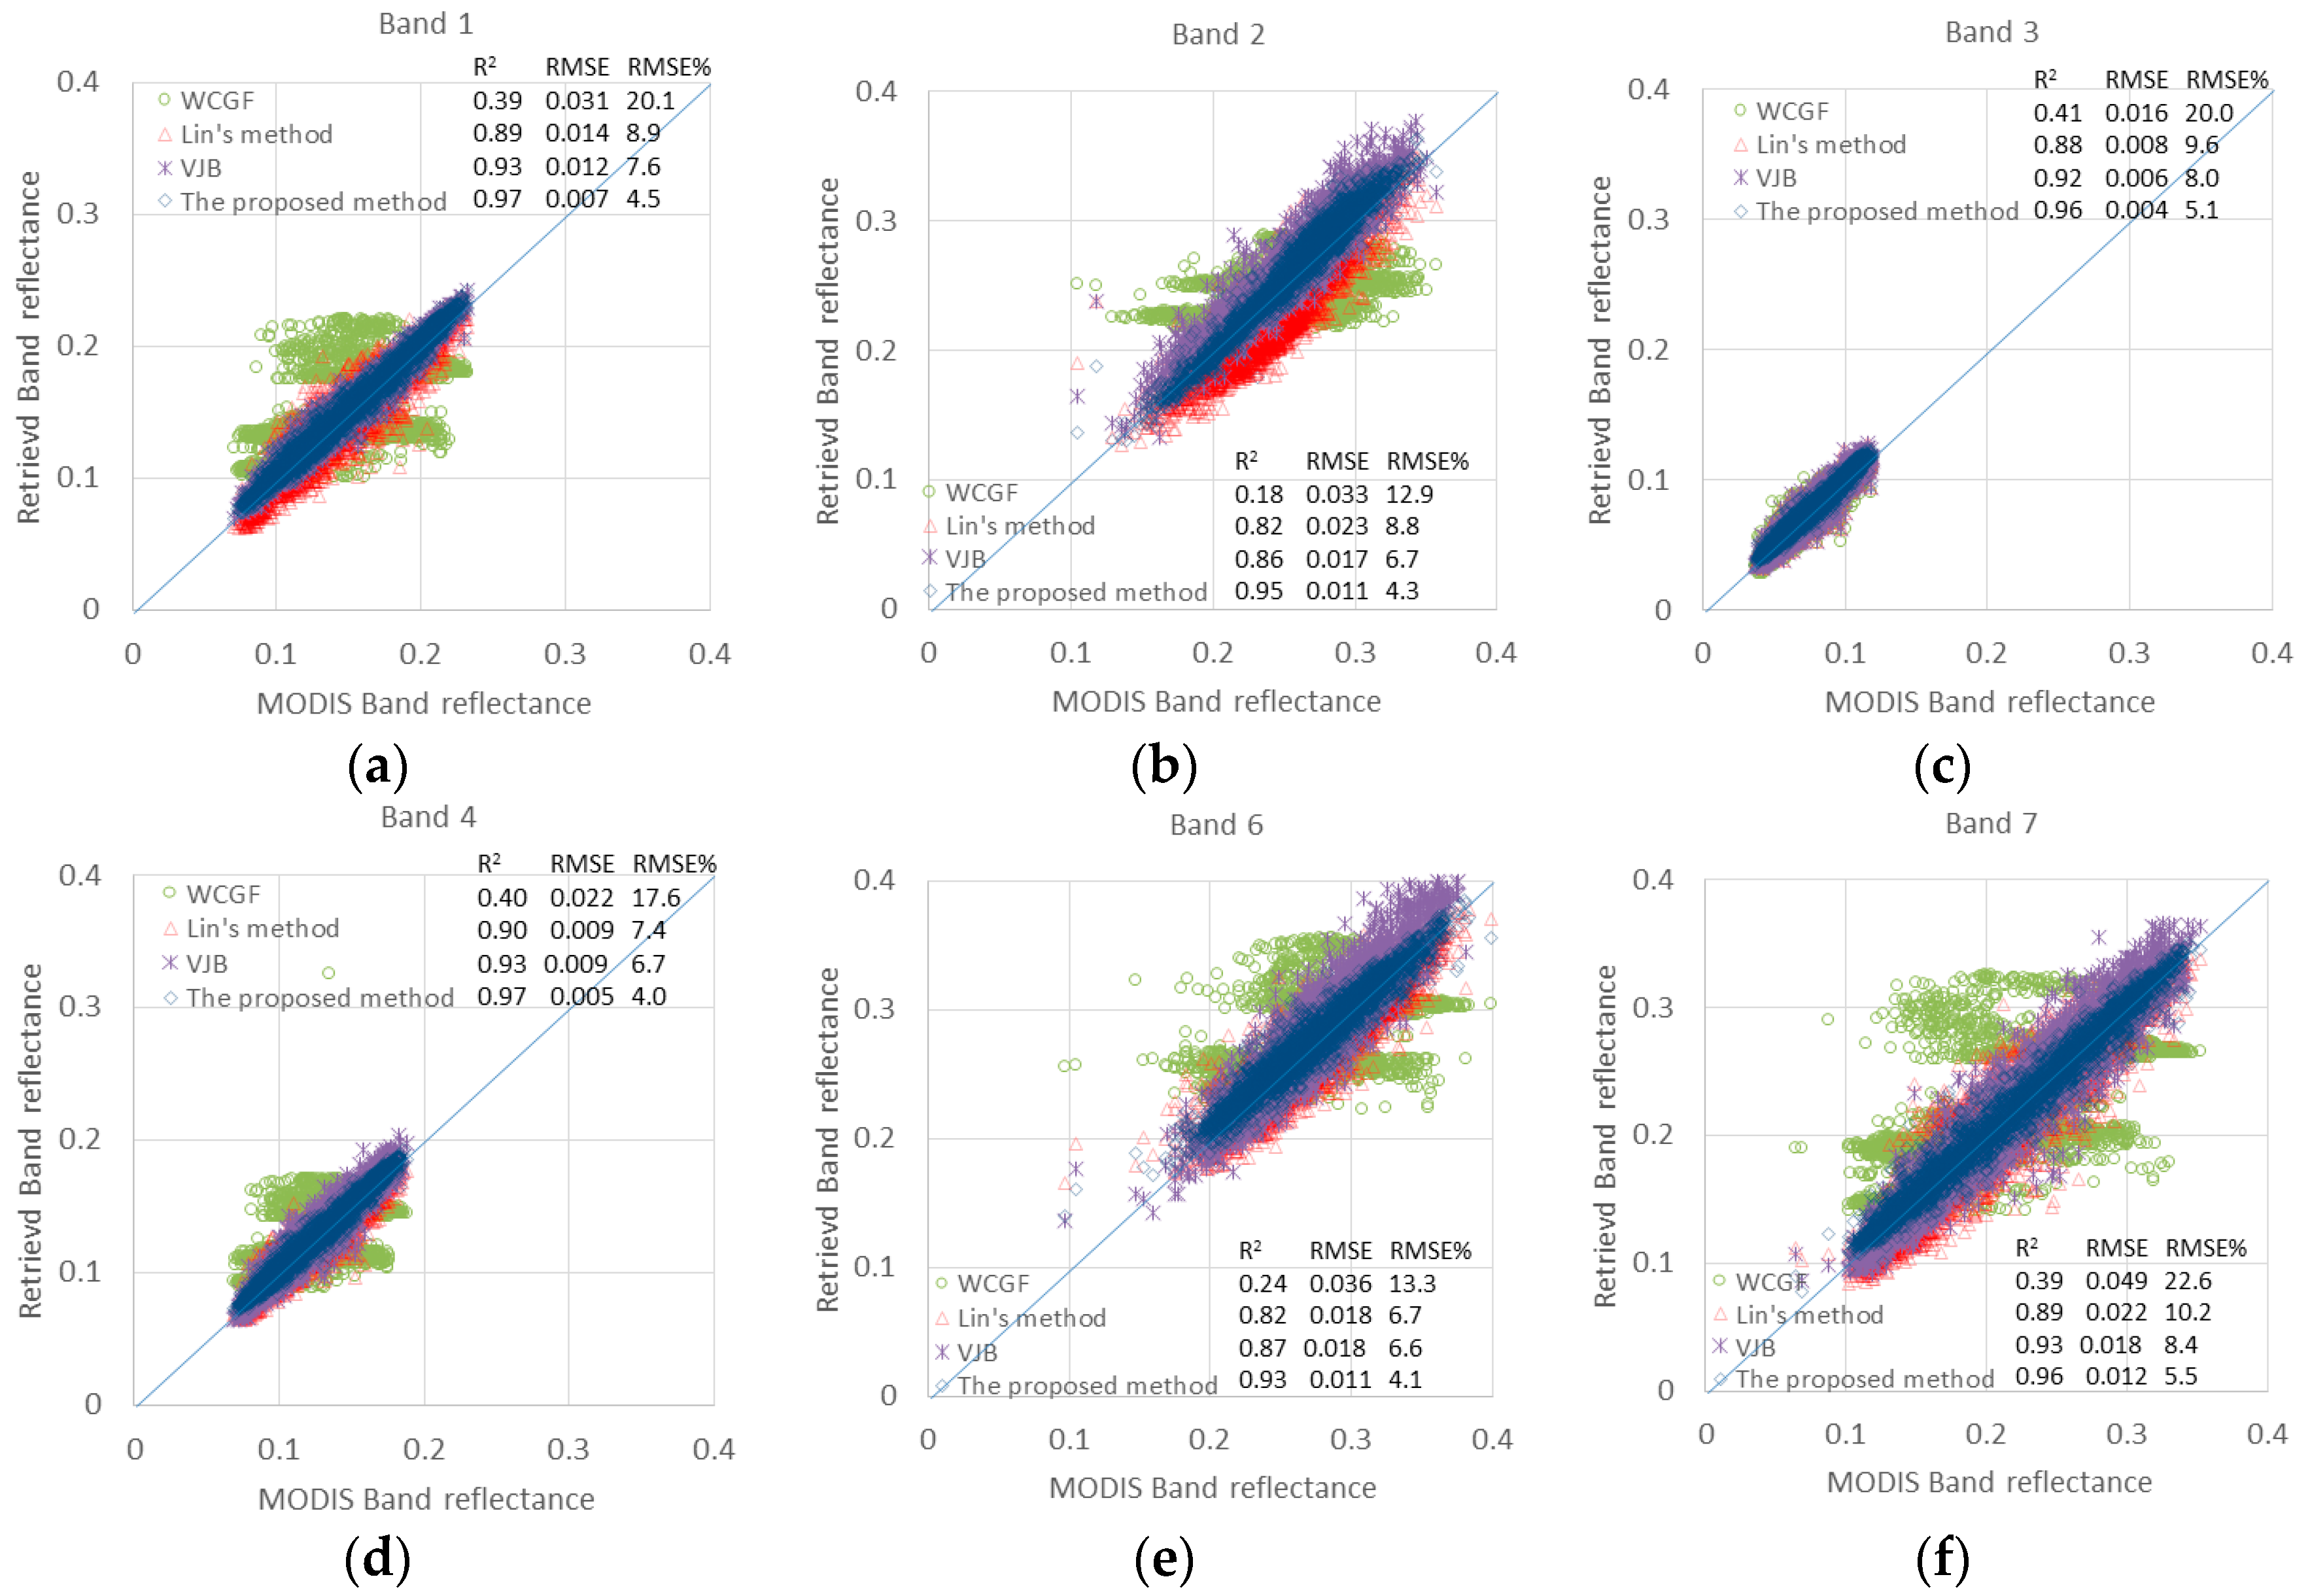
Figure 7). Statistics on the precision of the four methods are shown in
Figure 8.
Based on the statistics from the 2D scattering plots in
Figure 8, the R
2 and RMSE values show that the proposed method is the most accurate method among all four methods; the VJB method is second best after the proposed method; Lin’s method shows intermediate performance; and WCGF performs the worst.
This conclusion also provides an analysis of the advantages of the proposed method compared with other methods. WCGF does not consider the spatial distribution in the cloudy area and only replaces the value of the cloudy pixel by averaging the value of the neighboring pixels without clouds but with the same land cover as that of the cloudy pixel; this leads to an unreasonable variation in the magnitude and spatial distribution. Compared to WCGF, Lin’s method accounts for the spatial distribution in the cloudy area by constructing a gradient field based on the optimal multi-temporal data without clouds at the same location as the cloudy pixel and smooths the variation in the magnitude along the boundary of the simulated cloud area and the no-cloud area. This leads to a result that is more reasonable and accurate than WCGF, as shown in
Figure 7 and
Figure 8. However, a critical disadvantage of Lin’s method is that the BRDF of the land surface is ignored, and the BRDF leads to a variation in the spatial distribution of MODIS data observed at different times due to varying solar-viewing geometries. Therefore, we can see that the spatial distribution of the results from Lin’s method shows less similarity with the distribution of MODIS data than the proposed method in the red square area in
Figure 7 and
Figure 8. The disadvantages of the two previous methods are considered and addressed by the proposed method, thereby increasing the accuracy of the proposed method.
Meanwhile, the VJB method can also be used for directly retrieving the spectral reflectance of the cloudy pixels in MODIS bands 1, 2, 3, 4, 6, and 7 based on the fact that the empirical database of BRDF is driven by the same MODIS reflectance that is used in the proposed method. Furthermore, the results produced by the VJB method are less robust than those produced by the proposed method; however, we still believe that VJB method’s theoretical basis is reasonable because it is similar to that of the proposed method which assumes that the variation of reflectance observed by direct effect of BRDF and the BRDF’s imperfection for describing the anisotropic reflectance of land surface. VJB assumes that the variation of reflectance observed by the sensor is caused by daily direct effects in a short time. The proposed method adds to the VJB method a local fitting scheme that uses GWR to take spatial heterogeneity into account. In addition, the proposed method’s specialized design (e.g., the use of a local fitting scheme based on GWR) can ensure higher accuracy than the VJB method. The results produced by the VJB method show two conclusions: (1) the VJB method is better than both WCGF and Lin’s method, which provides a strong theoretical basis for VJB having a wider range of application and better accuracy than methods based on pure mathematics; and (2) the VJB method is not as good as the proposed method, which means that VJB needs to be adjusted and redesigned for retrieving the spectral reflectance of cloudy pixels in the MODIS bands, an adjustment that the proposed method has already made (through, e.g., introducing spatiotemporal samples, designing the scheme of local fitting, adopting GWR).
However, this comparison does not ensure that the accuracy of the proposed method meets the requirements for retrieving high-level land surface parameters with high accuracy because the robustness of the method still needs to be checked. Therefore, the retrievals based on the simulated cloudy areas in
Figure 6 (S-a: 15 km × 15 km and S-c: 45 km × 45 km) were compared with the results in
Figure 7 in order to check the precision of the methods on a different cloudy area (
Table 1).
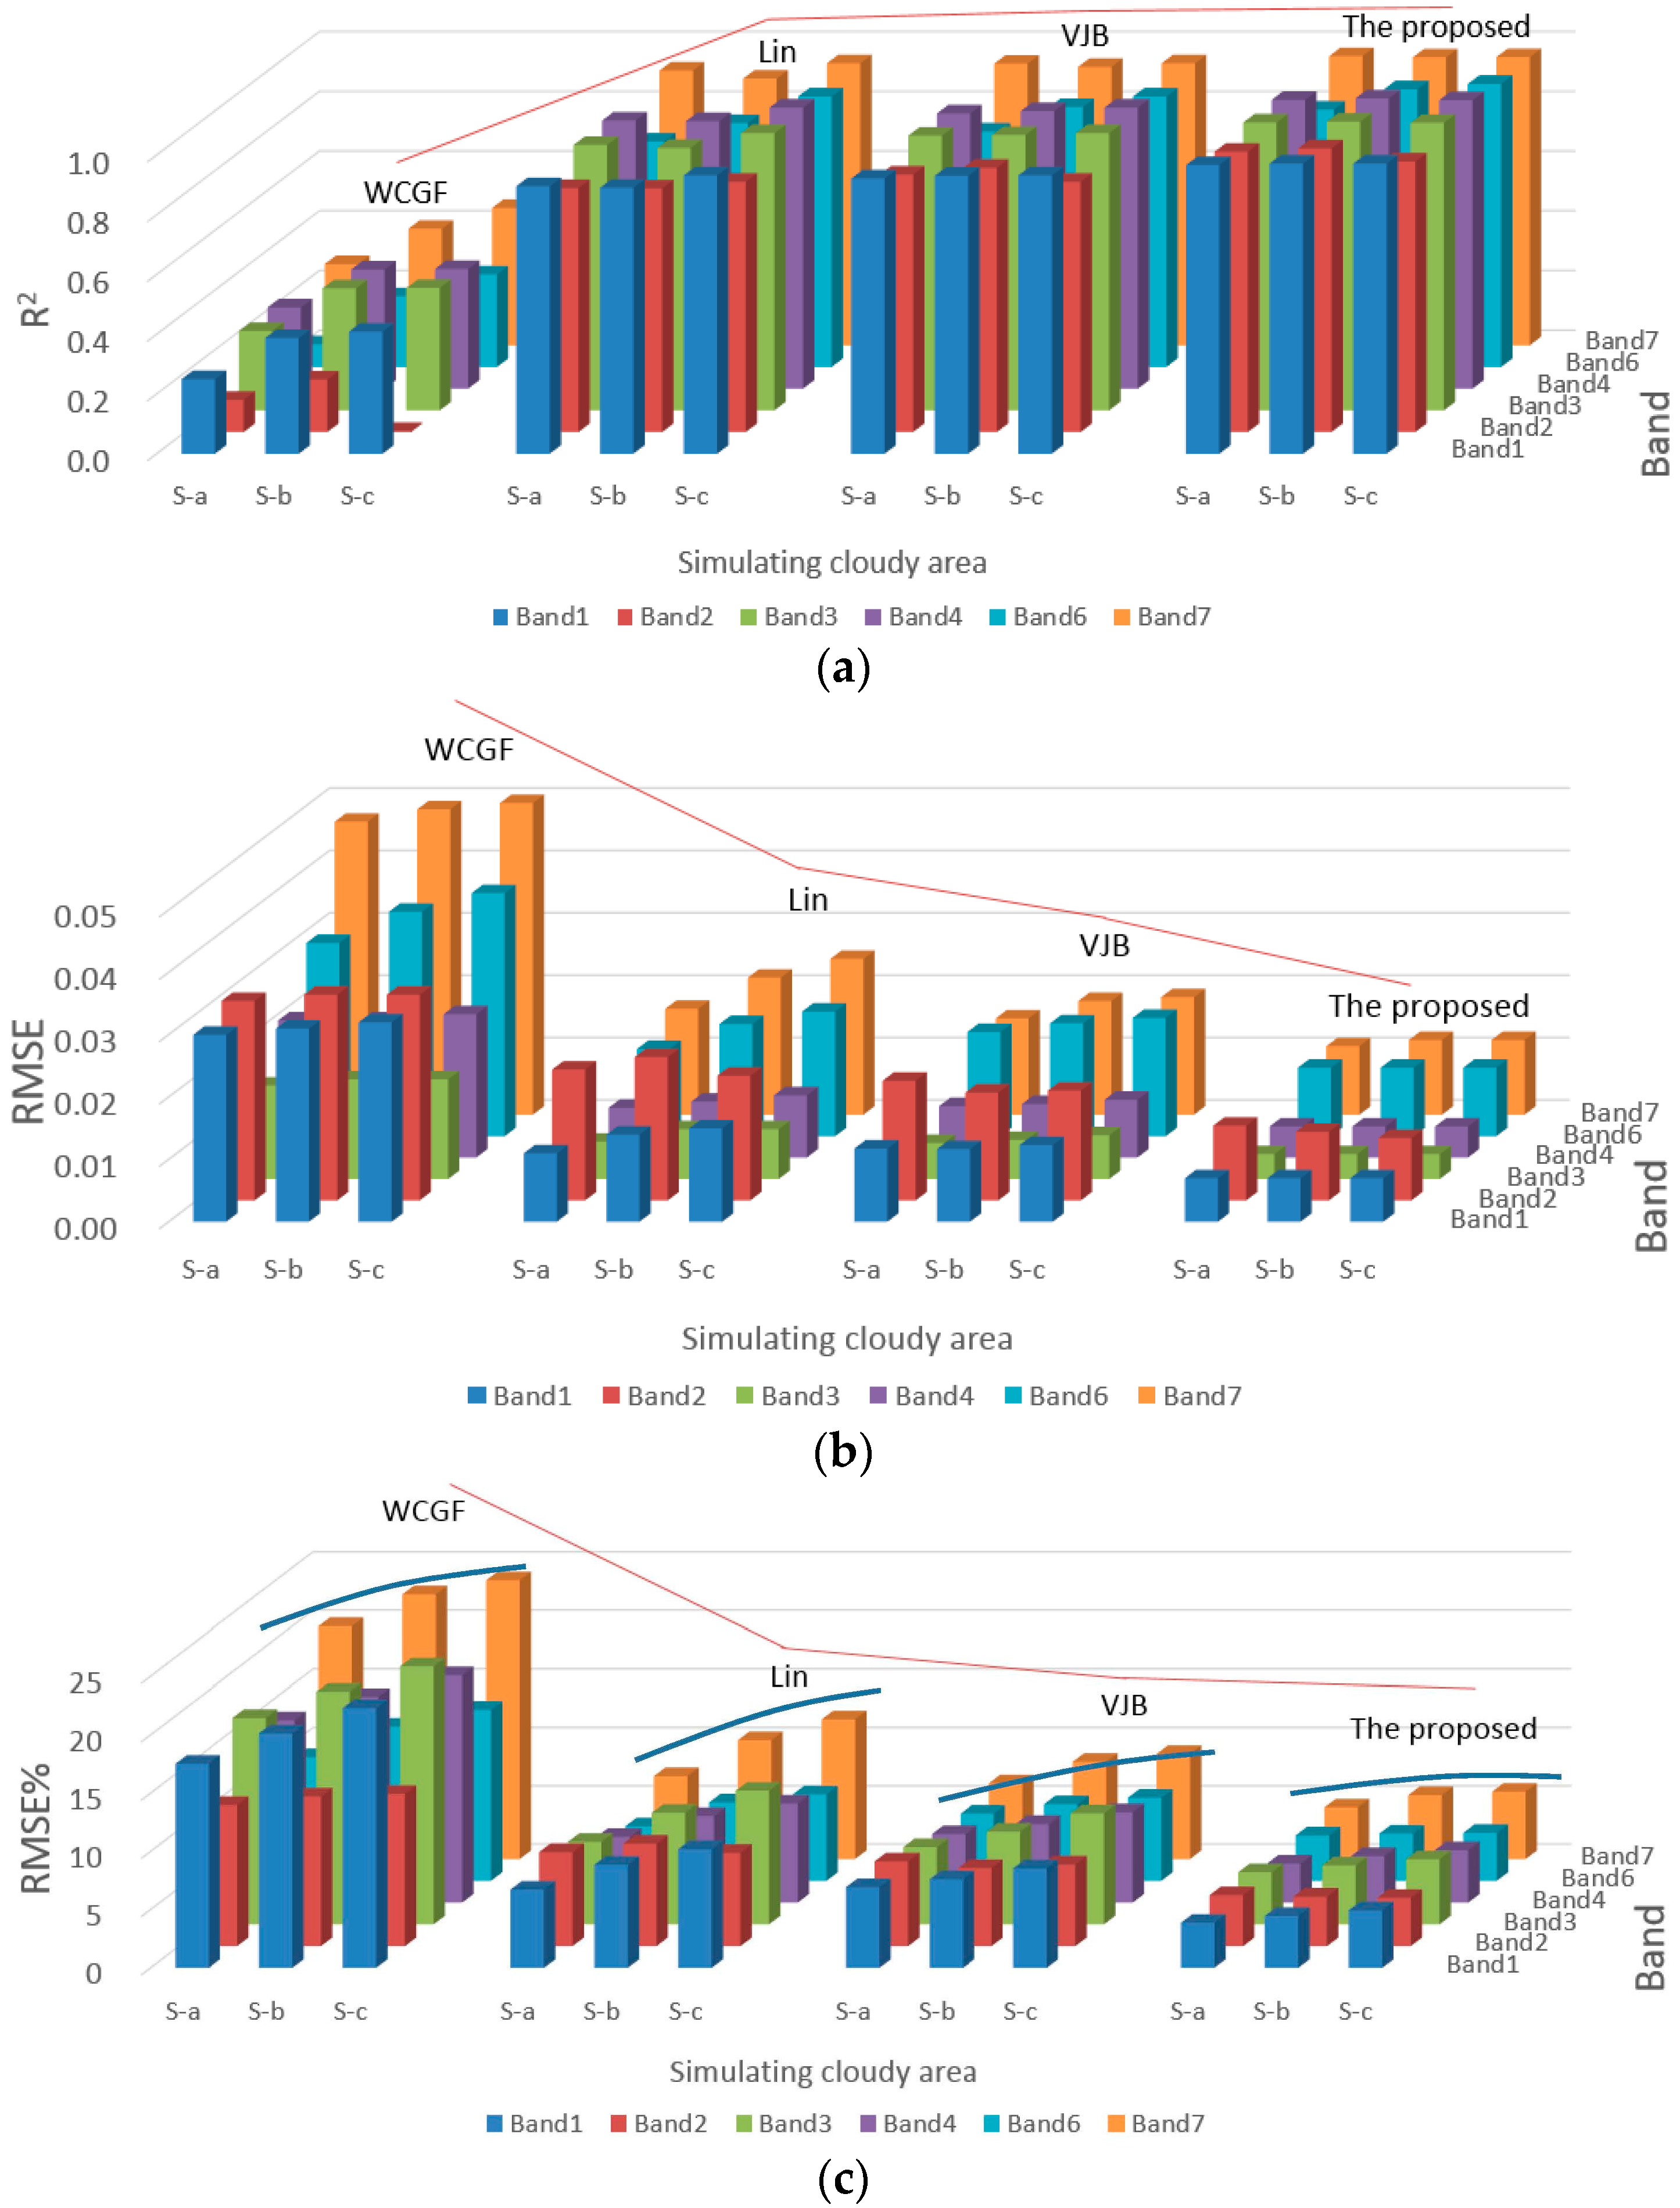
To analyze and compare the results more intuitively, the values in the columns of
Table 1 were plotted in
Figure 9. The proposed method shows the best accuracy in terms of all statistical indices for different simulated cloudy areas and bands. In addition, the retrieval precision at different MODIS bands from the proposed method shows a better stability than the other three methods, which appear to experience a severe drop in their retrieval precision. The blue curves in
Figure 9c highlight the trend of RMSE with enlarging simulated cloudy area and shows the minimal variation in the precision of the proposed method.
Table 1 and
Figure 9 demonstrate that the results from the proposed method has the best and most stable precision of the four methods and that the statistical accuracy (e.g., R
2, RMSE, and RMSE%) do not significantly diminish with larger simulated cloudy areas, which means that the proposed method is very robust owing to its physical mechanism and strict retrieving control. Furthermore, other methods based on mathematical statistics may not be stable in enlarged cloudy area.
5.2. Retrieving White-Sky Albedo of Cloudy Pixels
Based on the previous section, the proposed method is expected to have a very good accuracy; however, the target of this study is to retrieve spectral reflectance for MODIS band that can be used to derive high-level land surface parameters with high accuracy. Therefore, a test was conducted to retrieve the band white-sky albedo based on the spectral reflectance for MODIS band with the original reflectance and the reflectance retrieved by the proposed method for 12–27 September 2012. The algorithm to retrieve the band white-sky albedo is given in the Algorithm for MODIS Bidirectional Reflectance Anisotropies of the Land Surface (AMBRALS).
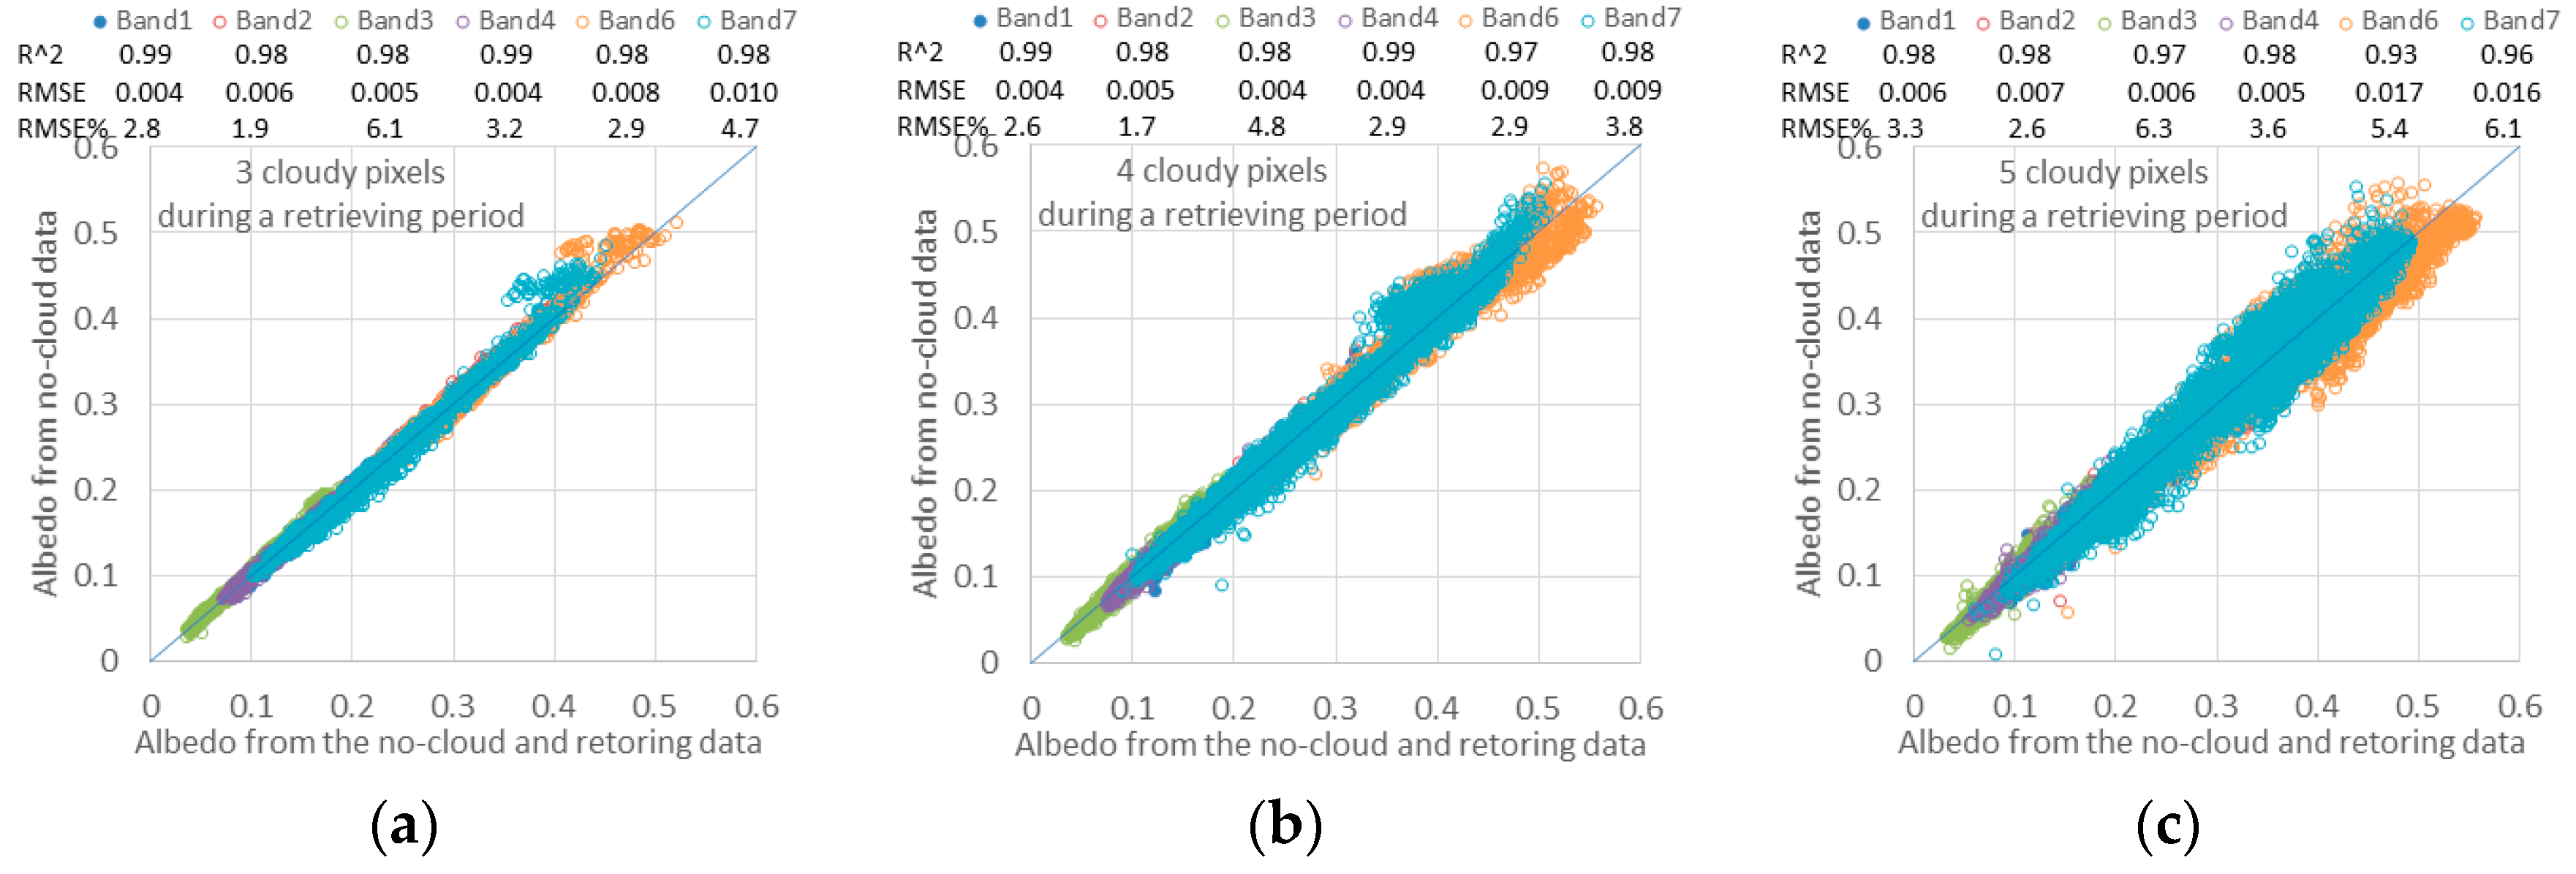
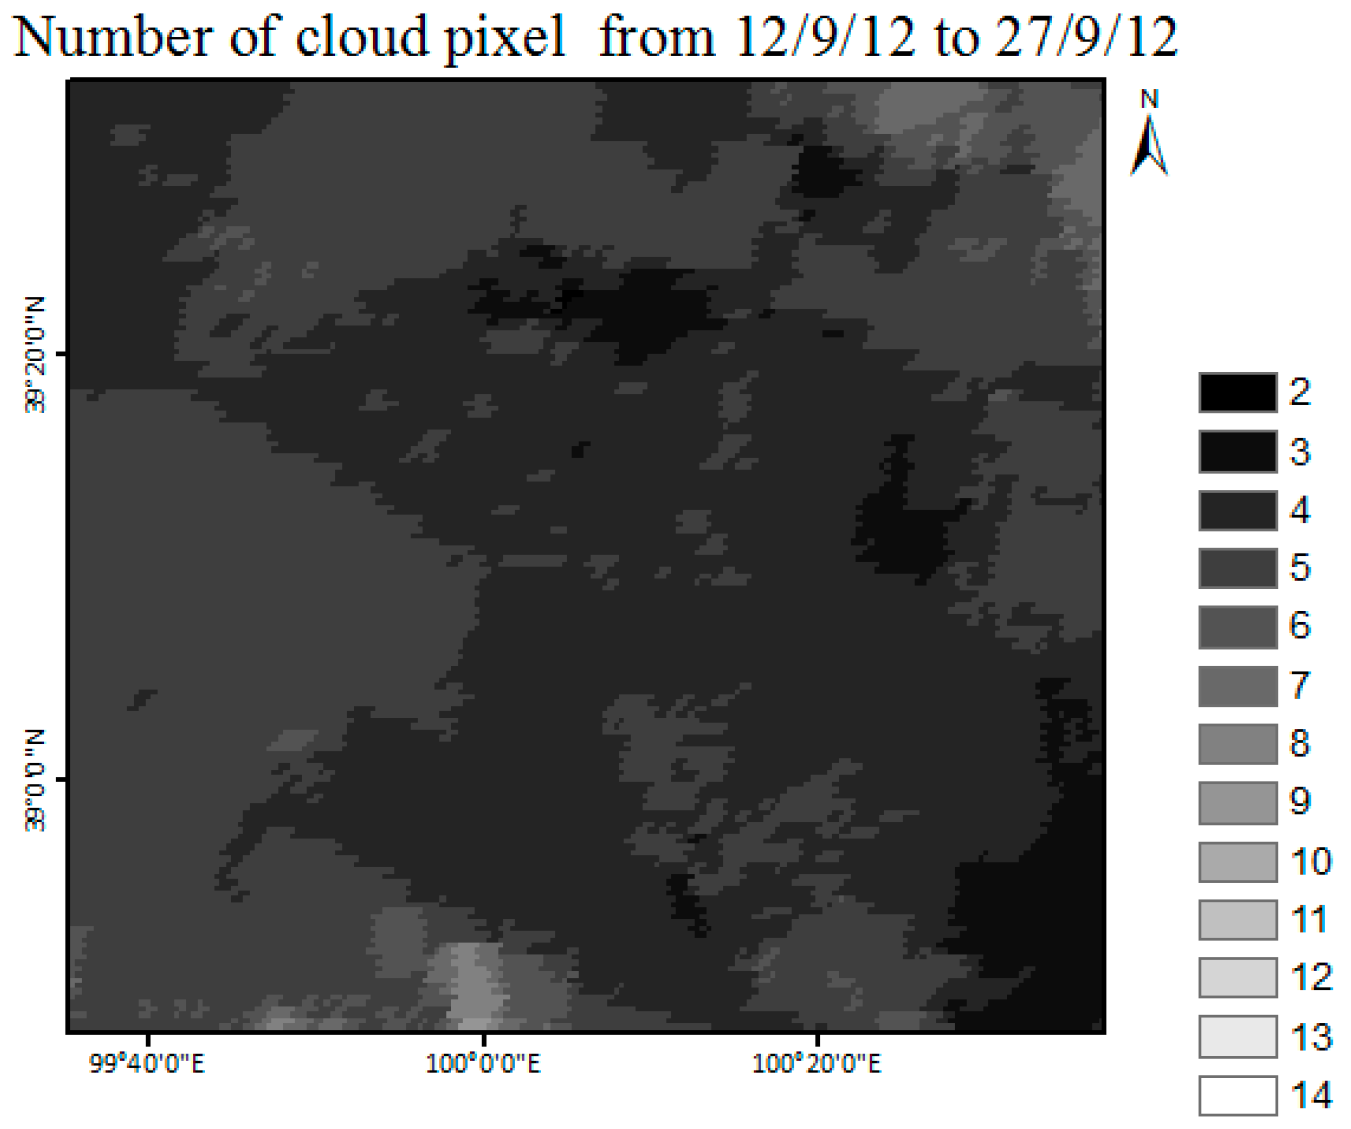
Based on the statistics of the accumulation of cloudy pixels shown in
Figure 10, 2D scattering plots of the spectral albedo for the MODIS band retrieved by no-cloud data and the mixed data that include no-cloud and restored cloudy pixels are shown according to the different numbers (e.g., 3, 4, and 5) of cloudy pixels during the retrieval period (
Figure 11). Pixels with different numbers, 3–5, account for approximately 80% of the total pixels. From
Figure 11, the worst RMSE% is approximately 6% and the best RMSE% is less than 2%.
The result is shown in
Figure 12, assuming that the albedo retrieved using the no-cloud data is the true value and converting the spectral albedo for the MODIS band to shortwave albedo. With the restored cloudy data, which were used when the number of cloudy pixels increased from 2 to 5 (accounting for approximately 80% of the total area), the precision of the retrieved albedo shows fluctuations in the RMSE% from 0.9% to 3.9% and R
2 from 97% to 98%. The total precision of the method is high, with a total RMSE% of 3.1% and a total bias% of 2.0%. Considering the condition of the six restored cloudy data used to retrieve the albedo, the worst precision of the retrieved albedo is with an RMSE% of 7.7% and an R
2 of 94%; however, the total RMSE% of 3.6% and total bias% of 2.2% are still very accurate and stable, because the conditions of the six restored cloudy data used to retrieve the albedo only account for approximately 6% of the total.
Comparing earlier studies on albedo retrieval, Miguel et al. have shown that most of the retrieved NIR broadband albedos meet the 10% accuracy (bias) requirement; therefore, 10% accuracy is considered the threshold for judging the level of accuracy of a retrieval method [
30]. Franch et al. validated the improved VJB method and acquired an overall RMSE of 7% [
15], which is better than an RMSE of 0.024 or 12% acquired by Shuai and coworkers’ method [
13]. Therefore, the retrieved spectral albedo for MODIS band based on the spectral reflectance for MODIS band retrieved using the proposed method is relatively more accurate. The white-sky albedo retrieved using the restored cloudy MODIS data shows very good precision and completely satisfies all statistical indices; therefore, the proposed method can retrieve the spectral reflectance for MODIS band of cloudy pixels with better precision than other methods (e.g., WCGF, Lin’s method, and VJB method) and has sufficiently good accuracy to be used to retrieve high-level land surface parameters (e.g., the albedo).
6. Conclusions
In this study, we not only proposed an algorithm to retrieve the spectral reflectance for MODIS band of cloudy pixels with sufficient precision to be used for quantitative remote sensing retrieval but also applied the improved method (e.g., Shuai [
13] and Franch [
15]) to solve the new problems related to clouds. The proposed method considers the following key factors when retrieving the reflectance of cloudy pixels: (1) determining the anisotropic reflectance of the land surface; (2) eliminating errors from spatial heterogeneities between the data samples; and (3) evaluating the precision of the proposed method based on a more comprehensive evaluation scheme. To address these three issues, the proposed method considers the anisotropic reflectance of the land surface and introduces the BRDF to calculate the spectral reflectance of each sample based on the solar-viewing geometry, which eliminates the errors from the anisotropic reflectance. The theoretical basis of this method is similar to that of the existing algorithms (e.g., Shuai) in which the sample pixels are matched with the target pixel in space. The proposed method uses a no-cloud pixel as a sample to model the cloudy pixel, which leads to a spatial mismatch between the sample pixels and the target pixel; therefore, GWR was used to optimize the samples and eliminate errors due to spatial heterogeneity. Finally, a comprehensive scheme was conducted to evaluate the results of the proposed method in comparison with other methods, and the retrieved spectral reflectance for MODIS band was used to retrieve the land surface albedo. The results were validated and good accuracy was demonstrated. The proposed method introduces the idea of quantitative remote sensing and geographical theory to address cloudy pixels, and the validation shows that the proposed method has a better accuracy than other methods and can meet the accuracy requirements for quantitative retrievals.
Even though the proposed method improved the accuracy effectively, some deficiencies exist. One deficiency is that the spectral reflectance within the shortwave band is subject to atmospheric conditions (e.g., the aerosol optical depth and water vapor), and the different spectral reflectances are affected by these conditions in varying degree, which will in turn reduce the accuracy. Another deficiency is that the proposed method cannot retrieve spectral reflectance accurately while an event is happening (e.g., rain and/or snow) because the BRDF data does not have sufficient temporal resolution. Finally, validation should be conducted for other sensors, such as Enhanced Thematic Mapper (ETM) data, to further prove the superior applicability of the proposed method. These issues will be addressed in our future work.


