
Landsat Imagery Spectral Trajectories—Important Variables for Spatially Predicting the Risks of Bark Beetle Disturbance

 , ,
, ,
Abstract
:
1. Introduction
2. Data and Methods
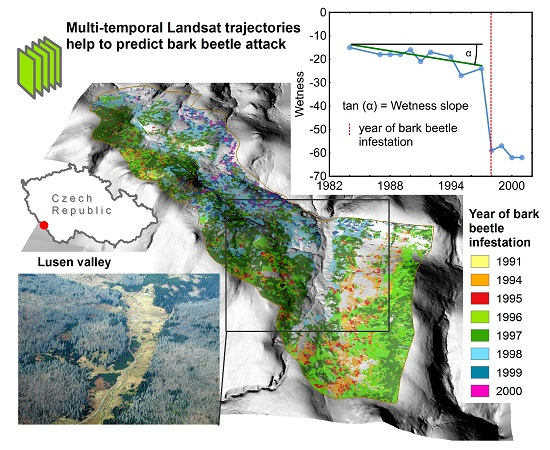
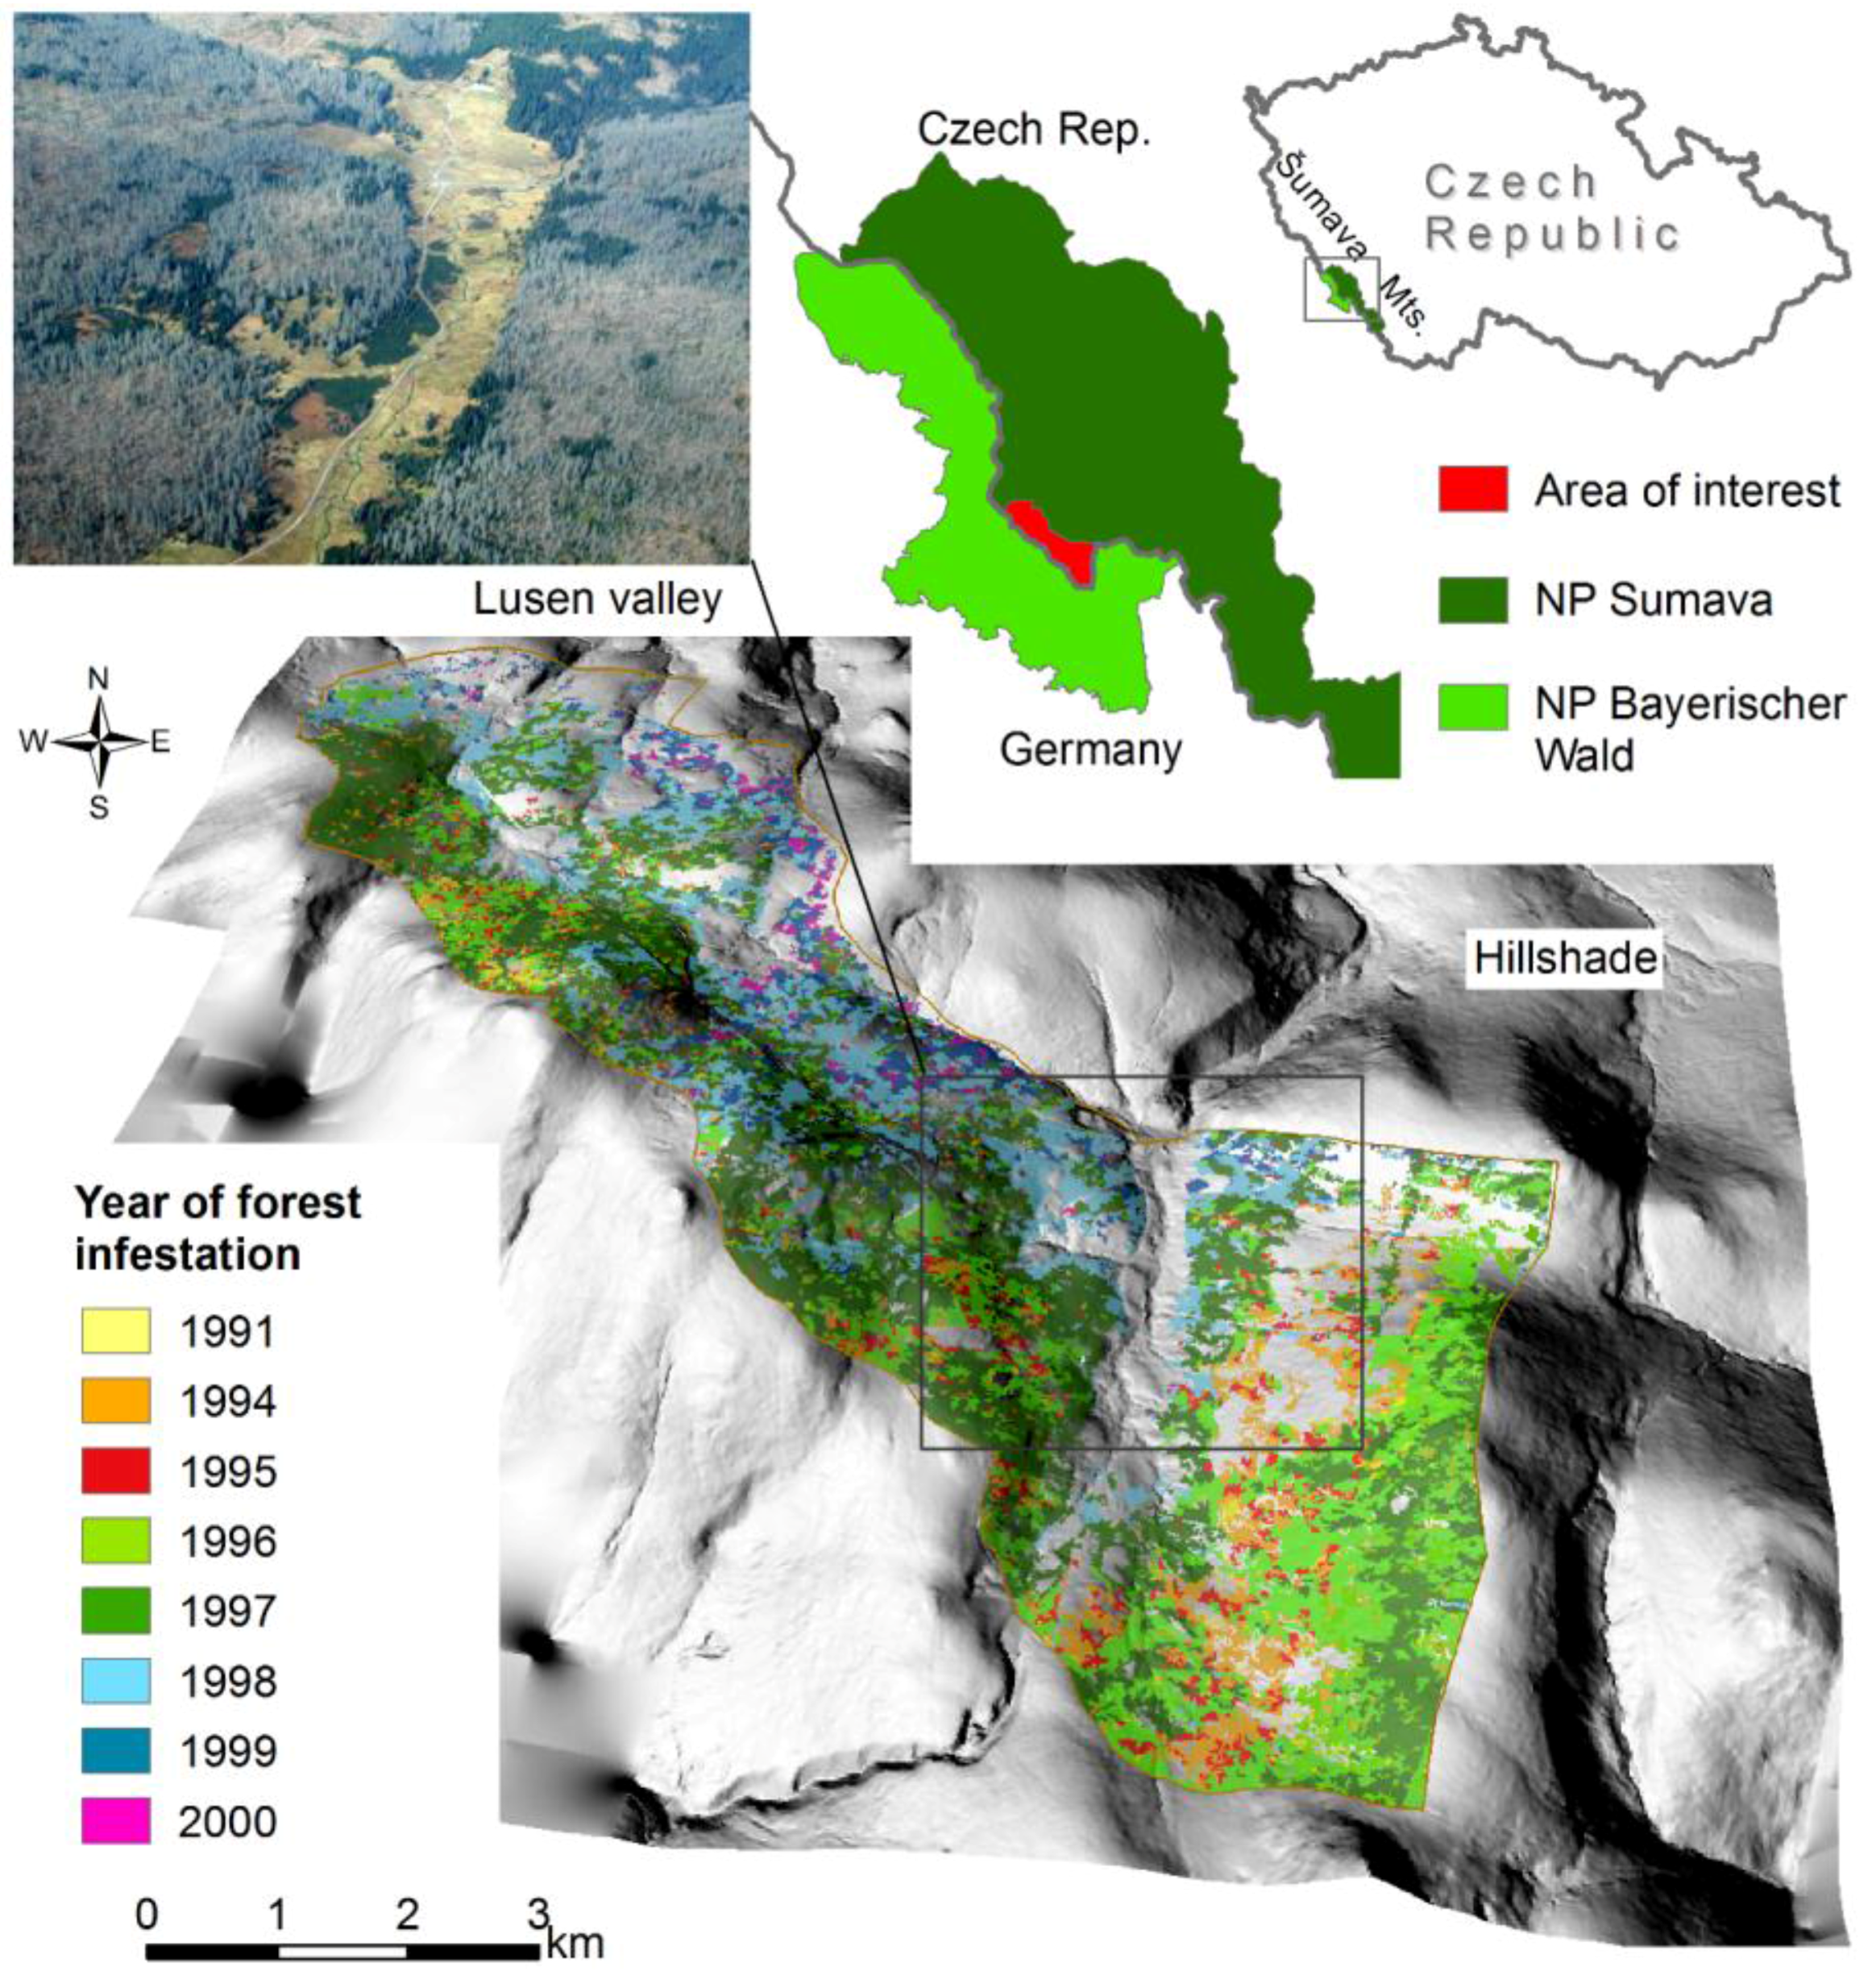
2.1. Study Area
2.2. Aerial and Satellite Data
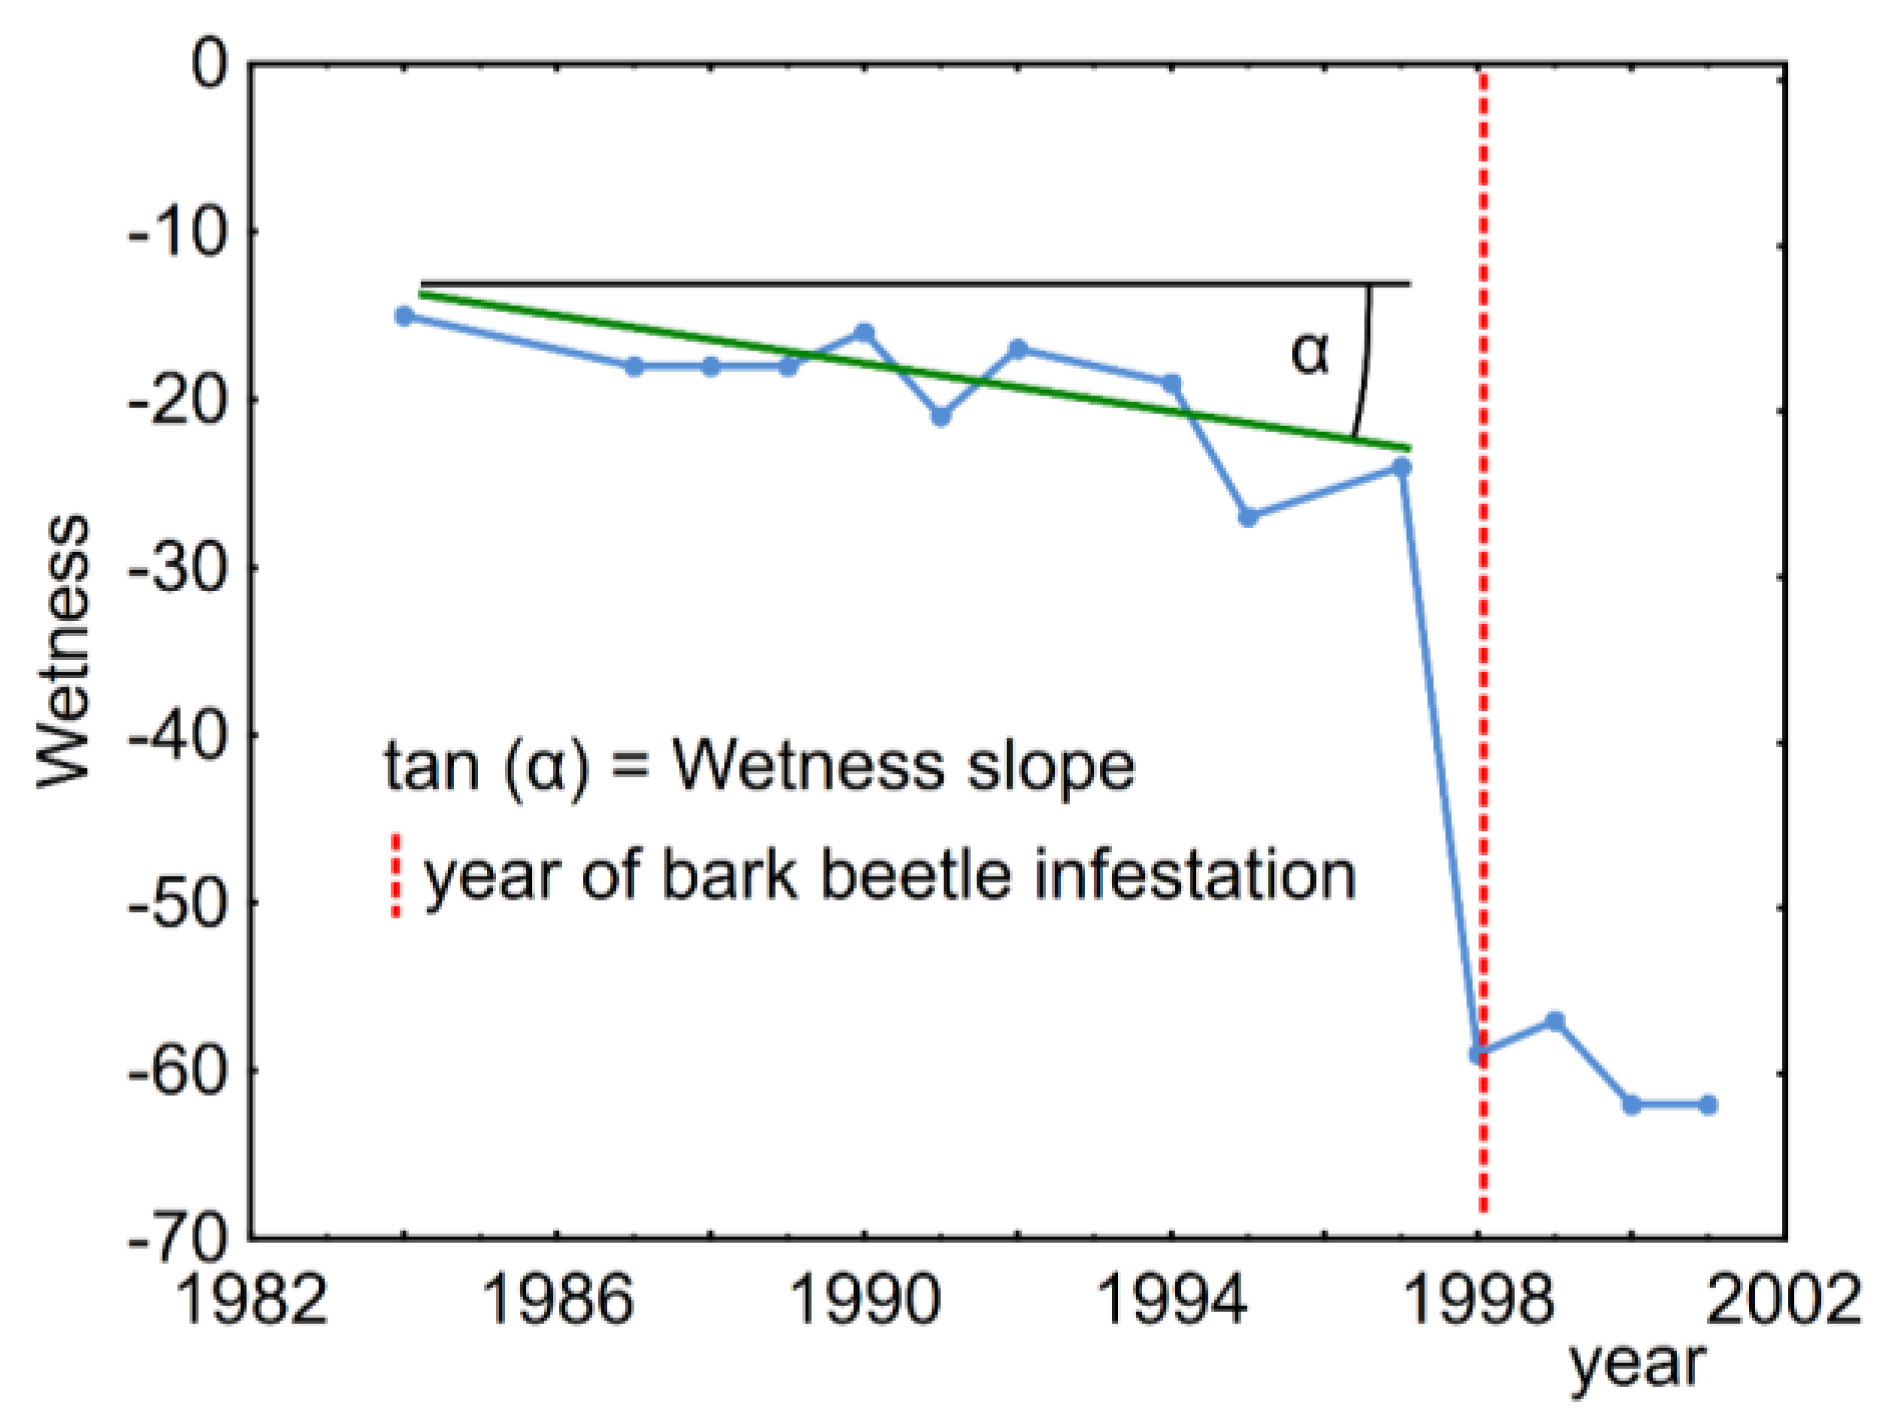
2.3. Spectral Trajectories
2.4. Environmental Predictors of Bark Beetle Infestation
2.5. Statistical Models
2.6. Multimodel Inference
2.7. Predictions
3. Results
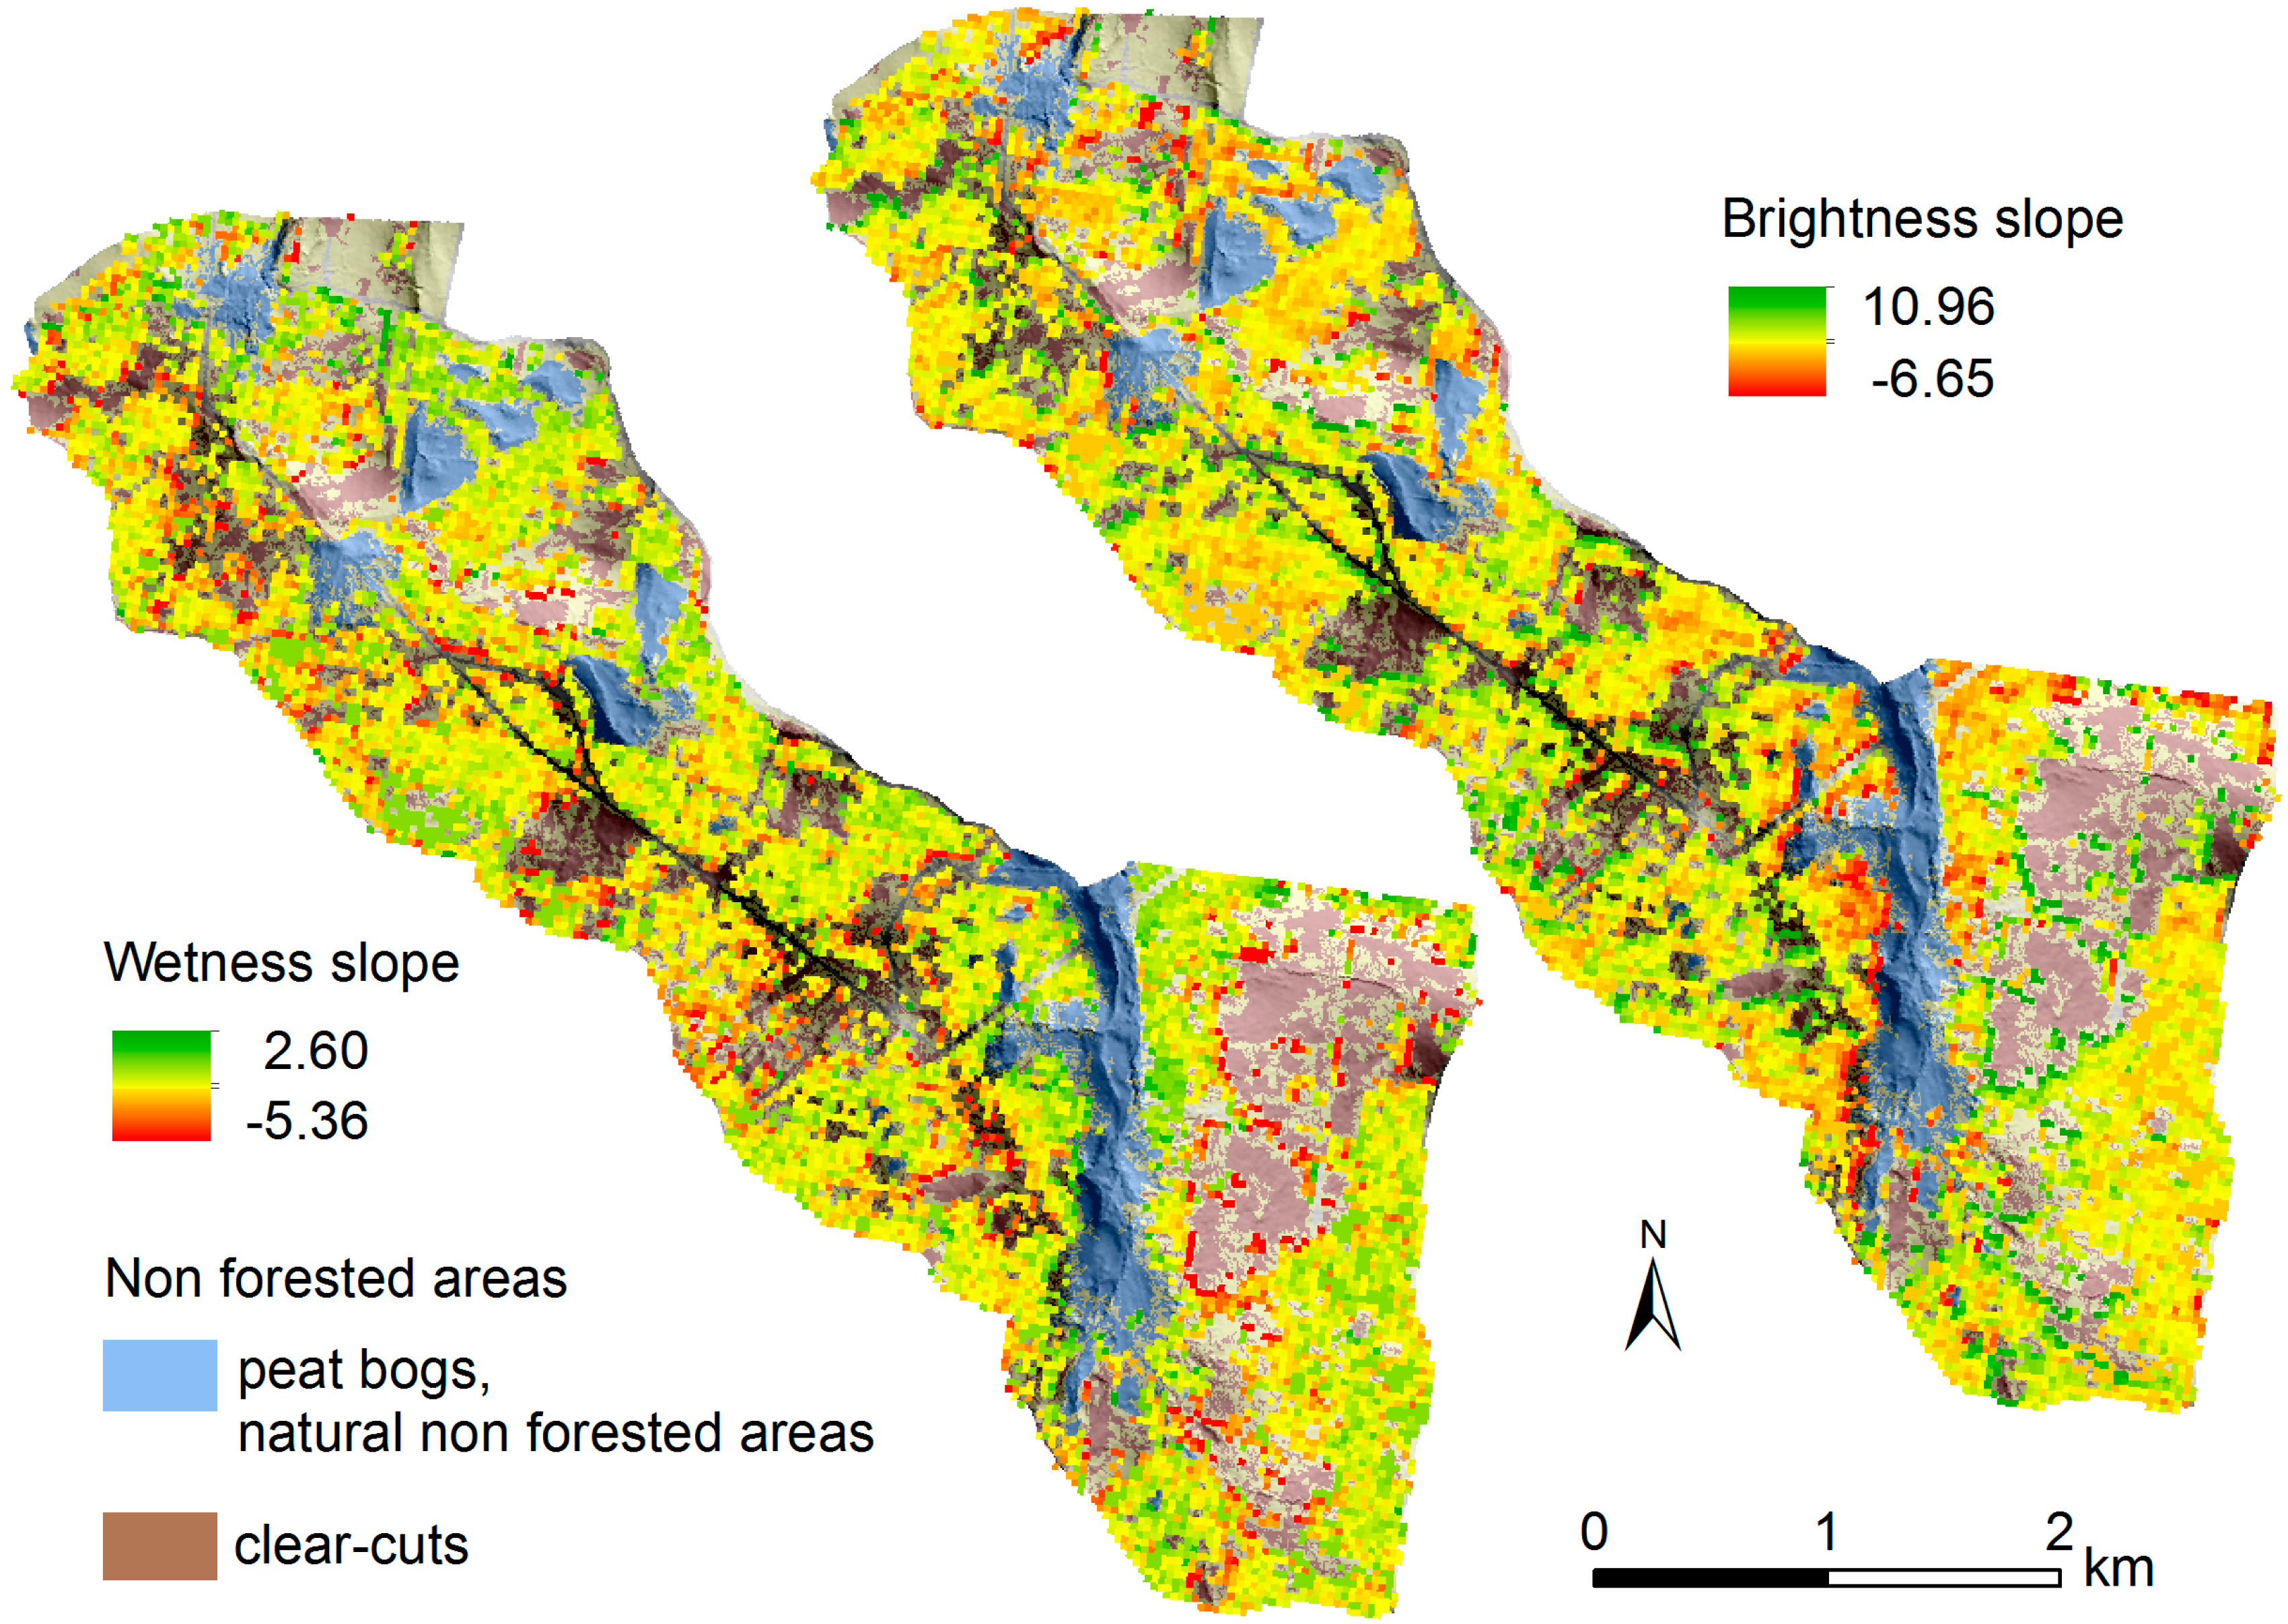
3.1. Pre-Disturbance Forest Condition
3.2. Predictors of Bark Beetle Infestation
3.3. Model Predictions
4. Discussion
4.1. Spectral Indices Reflecting the Forest Health Change
4.2. Pre-Disturbance Forest Conditions
4.3. Spectral Trajectories
4.4. Risk of Bark Beetle Infestation and Model Predictions
5. Conclusions
Acknowledgments
Author Contributions
Conflicts of Interest
Appendix A
A1. Predictor Importance Weights

| Year | Wet-sl | Dir-Source | D-Clear-Cut | D-Natur-Edg | Dg-Natur | AGE | Density | Edaphic | Geol-Wet | HLI | TWI | Legend |
|---|---|---|---|---|---|---|---|---|---|---|---|---|
| 1994 | 0.99 | 1.00 | 1.00 | 0.96 | 0.52 | 0.65 | 0.36 | 1.00 | 0.98 | 1.00 | 0.62 | ≤0.2 |
| 1995 | 0.68 | 0.09 | 0.33 | 0.52 | 0.56 | 0.36 | 0.48 | 0.01 | 0.39 | 0.84 | 0.65 | 0.21–0.40 |
| 1996 | 1.00 | 0.07 | 0.37 | 1.00 | 1.00 | 0.67 | 0.30 | 1.00 | 1.00 | 0.70 | 1.00 | 0.41–0.60 |
| 1997 | 1.00 | 0.95 | 0.48 | 0.29 | 1.00 | 1.00 | 1.00 | 1.00 | 0.54 | 0.74 | 1.00 | 0.61–0.80 |
| 1998 | 1.00 | 1.00 | 0.26 | 1.00 | 0.30 | 0.29 | 0.37 | 0.99 | 0.29 | 0.55 | 0.61 | 0.81–1.00 |
| 1999 | 0.99 | 0.45 | 0.68 | 0.34 | 0.86 | 0.31 | 0.94 | 0.47 | 0.48 | 0.29 | 0.30 | |
| 2000 | 0.26 | 0.01 | 0.95 | 0.32 | 0.38 | 0.26 | 0.32 | 0.01 | 0.37 | 0.67 | 0.44 |
| Year | Bright-sl | Dir-Source | D-Clear-Cut | D-Natur-Edg | Dg-Natur | AGE | Density | Edaphic | Geol-Wet | HLI | TWI | Legend |
|---|---|---|---|---|---|---|---|---|---|---|---|---|
| 1994 | 0.90 | 1.00 | 1.00 | 0.96 | 0.52 | 0.71 | 0.35 | 1.00 | 0.98 | 1.00 | 0.62 | ≤0.2 |
| 1995 | 0.27 | 0.07 | 0.29 | 0.55 | 0.59 | 0.36 | 0.49 | 0.01 | 0.38 | 0.86 | 0.65 | 0.21–0.40 |
| 1996 | 1.00 | 0.14 | 0.39 | 1.00 | 1.00 | 0.67 | 0.32 | 1.00 | 1.00 | 0.82 | 1.00 | 0.41–0.60 |
| 1997 | 0.33 | 0.99 | 0.36 | 0.29 | 1.00 | 1.00 | 1.00 | 1.00 | 0.69 | 0.94 | 1.00 | 0.61–0.80 |
| 1998 | 0.36 | 1.00 | 0.26 | 1.00 | 0.27 | 0.28 | 0.33 | 0.99 | 0.35 | 0.71 | 0.59 | 0.81–1.00 |
| 1999 | 0.29 | 0.22 | 0.74 | 0.34 | 0.84 | 0.31 | 0.93 | 0.67 | 0.46 | 0.32 | 0.28 | |
| 2000 | 0.28 | 0.01 | 0.95 | 0.32 | 0.38 | 0.27 | 0.32 | 0.01 | 0.37 | 0.67 | 0.44 |
| Year | Dir-Source | D-Clear-Cut | D-Natur-Edg | Dg-Natur | AGE | Density | Edaphic | Geol-Wet | HLI | TWI | Legend |
|---|---|---|---|---|---|---|---|---|---|---|---|
| 1994 | 1.00 | 1.00 | 0.98 | 0.56 | 0.77 | 0.33 | 1.00 | 0.97 | 1.00 | 0.61 | ≤0.2 |
| 1995 | 0.07 | 0.29 | 0.55 | 0.59 | 0.36 | 0.49 | 0.01 | 0.38 | 0.86 | 0.65 | 0.21–0.40 |
| 1996 | 0.16 | 0.68 | 1.00 | 1.00 | 0.60 | 0.33 | 1.00 | 1.00 | 0.88 | 1.00 | 0.41–0.60 |
| 1997 | 0.99 | 0.35 | 0.29 | 1.00 | 1.00 | 1.00 | 1.00 | 0.69 | 0.94 | 1.00 | 0.61–0.80 |
| 1998 | 1.00 | 0.26 | 1.00 | 0.27 | 0.28 | 0.32 | 0.99 | 0.35 | 0.72 | 0.59 | 0.81–1.00 |
| 1999 | 0.22 | 0.74 | 0.34 | 0.84 | 0.31 | 0.92 | 0.68 | 0.46 | 0.33 | 0.28 | |
| 2000 | 0.01 | 0.95 | 0.32 | 0.38 | 0.27 | 0.32 | 0.01 | 0.37 | 0.67 | 0.44 |
A2. Predictive Power of the Remote Sensing Variables
| 1994 | 1995 | 1996 | 1997 | 1998 | 1999 | 2000 | |
|---|---|---|---|---|---|---|---|
| 1994 | - | 0.09 | 0.00 | 0.00 | 0.00 | 0.00 | 0.00 |
| 1995 | 0.00 | - | 0.00 | 0.00 | 0.00 | 0.81 | 0.93 |
| 1996 | 0.00 | 0.31 | - | 0.01 | 0.00 | 0.86 | 0.03 |
| 1997 | 0.00 | 0.01 | 0.00 | - | 0.00 | 0.00 | 0.04 |
| 1998 | 0.00 | 0.01 | 0.00 | 0.00 | - | 0.04 | 0.46 |
| 1999 | 0.00 | 0.09 | 0.00 | 0.00 | 0.01 | - | 0.41 |
| 2000 | 0.00 | 0.59 | 0.02 | 0.42 | 0.49 | 0.36 | - |
References
- Frelich, L.E. Forest Dynamics and Disturbance Regimes; Cambridge University Press: Cambridge, UK, 2002. [Google Scholar]
- Waring, R.H.; Running, S.W. Forest Ecosystems: Analysis at Multiple Scales, 3rd ed.; Elsevier: San Diego, CA, USA, 2007. [Google Scholar]
- Seidl, R.; Schelhaas, M.-J.; Lexer, M.J. Unraveling the drivers of intensifying forest disturbance regimes in Europe. Glob. Chang. Biol. 2011, 17, 2842–2852. [Google Scholar] [CrossRef]
- Schelhaas, M.J.; Nabuurs, G.J.; Schuck, A. Natural disturbances in the European forests in the 19th and 20th centuries. Glob. Chang. Biol. 2003, 9, 1620–1633. [Google Scholar] [CrossRef]
- Seidl, R.; Schelhaas, M.-J.; Rammer, W.; Verkerk, P.J. Increasing forest disturbances in Europe and their impact on carbon storage. Nat. Clim. Chang. 2014, 4, 806–810. [Google Scholar] [CrossRef] [PubMed]
- Wild, J.; Kopecký, M.; Svoboda, M.; Zenáhlíková, J.; Edwards-Jonášová, M.; Herben, T. Spatial patterns with memory: Tree regeneration after stand-replacing disturbance in Picea abies mountain forests. J. Veg. Sci. 2014, 25, 1327–1340. [Google Scholar] [CrossRef]
- Čada, V.; Morrissey, R.C.; Michalová, Z.; Bače, R.; Janda, P.; Svoboda, M. Frequent severe natural disturbances and non-equilibrium landscape dynamics shaped the mountain spruce forest in central Europe. For. Ecol. Manag. 2016, 363, 169–178. [Google Scholar] [CrossRef]
- Svoboda, M.; Janda, P.; Nagel, T.A.; Fraver, S.; Rejzek, J.; Bače, R. Disturbance history of an old-growth sub-alpine Picea abies stand in the Bohemian Forest, Czech Republic. J. Veg. Sci. 2012, 23, 86–97. [Google Scholar] [CrossRef]
- Seidl, R.; Rammer, W.; Jäger, D.; Lexer, M.J. Impact of bark beetle (Ips typographus L.) disturbance on timber production and carbon sequestration in different management strategies under climate change. For. Ecol. Manag. 2008, 256, 209–220. [Google Scholar] [CrossRef]
- Lambert, N.J.; Ardo, J.; Rock, B.N.; Vogelmann, J.E. Spectral characterization and regression-based classification of forest damage in Norway spruce stands in the Czech Republic using Landsat Thematic Mapper data. Int. J. Remote Sens. 1995, 16, 1261–1287. [Google Scholar] [CrossRef]
- Rullan-Silva, C.D.; Olthoff, A.E.; Delgado de la Mata, J.A.; Pajares-Alonso, J.A. Remote monitoring of forest insect defoliation. A review. For. Syst. 2013, 22, 377–391. [Google Scholar] [CrossRef]
- Kauth, R.J.; Thomas, G.S. The tasselled cap—A graphic description of the spectral-temporal development of agricultural crops as seen by Landsat. In Proceedings of the Symposium Machine Processing of Remotely Sensed Data, West Lafayette, IN, USA, 29 June–1 July 1976; pp. 41–51.
- Crist, E.P.; Cicone, R.C. Application of the Tasseled Cap concept to simulated thematic mapper data. Photogramm. Eng. Remote Sens. 1984, 50, 343–352. [Google Scholar]
- Skakun, R.S.; Wulder, M.A.; Franklin, S.E. Sensitivity of the thematic mapper enhanced wetness difference index to detect mountain pine beetle red-attack damage. Remote Sens. Environ. 2003, 86, 433–443. [Google Scholar] [CrossRef]
- Wulder, M.A.; White, J.C.; Bentz, B.; Alvarez, M.F.; Coops, N.C. Estimating the probability of mountain pine beetle red-attack damage. Remote Sens. Environ. 2006, 101, 150–166. [Google Scholar] [CrossRef]
- Coops, N.C.; Waring, R.H.; Wulder, M.A.; White, J.C. Prediction and assessment of bark beetle-induced mortality of lodgepole pine using estimates of stand vigor derived from remotely sensed data. Remote Sens. Environ. 2009, 113, 1058–1066. [Google Scholar] [CrossRef]
- Lausch, A.; Heurich, M.; Gordalla, D.; Dobner, H.-J.; Gwillym-Margianto, S.; Salbach, C. Forecasting potential bark beetle outbreaks based on spruce forest vitality using hyperspectral remote-sensing techniques at different scales. For. Ecol. Manag. 2013, 308, 76–89. [Google Scholar] [CrossRef]
- Overbeck, M.; Schmidt, M. Modelling infestation risk of Norway spruce by Ips typographus (L.) in the Lower Saxon Harz Mountains (Germany). For. Ecol. Manag. 2012, 266, 115–125. [Google Scholar] [CrossRef]
- Netherer, S.; Nopp-Mayr, U. Predisposition assessment systems (PAS) as supportive tools in forest management—Rating of site and stand-related hazards of bark beetle infestation in the High Tatra Mountains as an example for system application and verification. For. Ecol. Manag. 2005, 207, 99–107. [Google Scholar] [CrossRef]
- Dutilleul, P.; Nef, L.; Frigon, D. Assessment of site characteristics as predictors of the vulnerability of Norway spruce (Picea abies Karst.) stands to attack by Ips typographus L. (Col., Scolytidae). J. Appl. Entomol. 2000, 124, 1–5. [Google Scholar] [CrossRef]
- Lausch, A.; Fahse, L.; Heurich, M. Factors affecting the spatio-temporal dispersion of Ips typographus (L.) in Bavarian Forest National Park: A long-term quantitative landscape-level analysis. For. Ecol. Manag. 2011, 261, 233–245. [Google Scholar] [CrossRef]
- Lausch, A.; Heurich, M.; Fahse, L. Spatio-temporal infestation patterns of Ips typographus (L.) in the Bavarian Forest National Park, Germany. Ecol. Indic. 2013, 31, 73–81. [Google Scholar] [CrossRef]
- Wulder, M.A.; Franklin, S.E. Understanding Forest Disturbance and Spatial Pattern: Remote Sensing and GIS Approaches; CRC Press, Taylor & Francis Group: Boca Raton, FL, USA, 2007. [Google Scholar]
- Bjørnstad, O.N.; Økland, B. Synchrony and geographical variation of the spruce bark beetle (Ips typographus) during a non-epidemic period. Popul. Ecol. 2003, 45, 213–219. [Google Scholar] [CrossRef]
- Brůna, J.; Wild, J.; Svoboda, M.; Heurich, M.; Müllerová, J. Impacts and underlying factors of landscape-scale, historical disturbance of mountain forest identified using archival documents. For. Ecol. Manag. 2013, 305, 294–306. [Google Scholar] [CrossRef]
- Aakala, T.; Kuuluvainen, T.; Wallenius, T.; Kauhanen, H. Tree mortality episodes in the intact Picea abies-dominated taiga in the Arkhangelsk region of northern European Russia. J. Veg. Sci. 2011, 22, 322–333. [Google Scholar] [CrossRef]
- Schroeder, L.M.; Weslien, J.; Lindelöw, Å.; Lindhe, A. Attacks by bark- and wood-boring Coleoptera on mechanically created high stumps of Norway spruce in the two years following cutting. For. Ecol. Manag. 1999, 123, 21–30. [Google Scholar] [CrossRef]
- Seidl, R.; Müller, J.; Hothorn, T.; Bässler, C.; Heurich, M.; Kautz, M. Small beetle, large-scale drivers: How regional and landscape factors affect outbreaks of the European spruce bark beetle. J. Appl. Ecol. 2015, 53, 530–540. [Google Scholar] [CrossRef] [PubMed]
- Wang, J.; Sammis, T.W.; Gutschick, V.P.; Gebremichael, M.; Dennis, S.O.; Harrison, R.E. Review of satellite remote sensing use in forest health studies. Open Geogr. J. 2010, 3, 28–42. [Google Scholar] [CrossRef]
- Wulder, M.A.; Masek, J.G.; Cohen, W.B.; Loveland, T.R.; Woodcock, C.E. Opening the archive: How free data has enabled the science and monitoring promise of Landsat. Remote Sens. Environ. 2012, 122, 2–10. [Google Scholar] [CrossRef]
- Kennedy, R.E.; Yang, Z.; Cohen, W.B. Detecting trends in forest disturbance and recovery using yearly Landsat time series: LandTrendr—Temporal segmentation algorithms. Remote Sens. Environ. 2010, 114, 2897–2910. [Google Scholar] [CrossRef]
- Cohen, W.B.; Yang, Z.; Kennedy, R. Detecting trends in forest disturbance and recovery using yearly Landsat time series: TimeSync—Tools for calibration and validation. Remote Sens. Environ. 2010, 114, 2911–2924. [Google Scholar] [CrossRef]
- Kennedy, R.E.; Andréfouët, S.; Cohen, W.B.; Gómez, C.; Griffiths, P.; Hais, M.; Healey, S.P.; Helmer, E.H.; Hostert, P.; Lyons, M.B.; et al. Bringing an ecological view of change to Landsat-based remote sensing. Front. Ecol. Environ. 2014, 12, 339–346. [Google Scholar] [CrossRef]
- Pflugmacher, D.; Cohen, W.B.; Kennedy, R.E. Using Landsat-derived disturbance history (1972–2010) to predict current forest structure. Remote Sens. Environ. 2012, 122, 146–165. [Google Scholar] [CrossRef]
- Kennedy, R.E.; Yang, Z.; Cohen, W.B.; Pfaff, E.; Braaten, J.; Nelson, P. Spatial and temporal patterns of forest disturbance and regrowth within the area of the Northwest Forest Plan. Remote Sens. Environ. 2012, 122, 117–133. [Google Scholar] [CrossRef]
- Meddens, A.J.H.; Hicke, J.A.; Vierling, L.A.; Hudak, A.T. Evaluating methods to detect bark beetle-caused tree mortality using single-date and multi-date Landsat imagery. Remote Sens. Environ. 2013, 132, 49–58. [Google Scholar] [CrossRef]
- Senf, C.; Pflugmacher, D.; Wulder, M.A.; Hostert, P. Characterizing spectral–temporal patterns of defoliator and bark beetle disturbances using Landsat time series. Remote Sens. Environ. 2015, 170, 166–177. [Google Scholar] [CrossRef]
- Meigs, G.W.; Kennedy, R.E.; Cohen, W.B. A Landsat time series approach to characterize bark beetle and defoliator impacts on tree mortality and surface fuels in conifer forests. Remote Sens. Environ. 2011, 115, 3707–3718. [Google Scholar] [CrossRef]
- Cohen, W.B.; Yang, Z.; Stehman, S.V.; Schroeder, T.A.; Bell, D.M.; Masek, J.G.; Huang, C.; Meigs, G.W. Forest disturbance across the conterminous United States from 1985 to 2012: The emerging dominance of forest decline. For. Ecol. Manag. 2016, 360, 242–252. [Google Scholar] [CrossRef]
- Hais, M.; Kennedy, R.; Braaten, J.; Pflugmacher, D. Landsat spectral trajectories may aid in detecting precursors to spruce bark beetle outbreak. Unpublished Manuscript. 2016. [Google Scholar]
- Neuhäuslová, Z. (Ed.) The Map of Potential Natural Vegetation of the Šumava National Park; Explanatory Text; Suppl. 1/2001; Silva Gabreta: Vimperk, Czech Republic, 2001.
- Fischer, H.S.; Winter, S.; Lohberger, E.; Jehl, H.; Fischer, A. Improving transboundary maps of potential natural vegetation using statistical modeling based on environmental predictors. Folia Geobot. 2013, 48, 115–135. [Google Scholar] [CrossRef]
- Heurich, M.; Reinelt, A.; Fahse, L. Die buchdruckermassenvermehrung im nationalpark bayerischer wald. In Waldentwicklung im Bergwald nach Wind, und Borkenkäferbefall; Bayer, Staatsforstverwaltung Wiss. Reihe: Grafenau, Germany, 2001; Volume 14, pp. 9–48. [Google Scholar]
- Skuhravý, V. Lýkožrout Smrkový Ips typographus (L.) a Jeho Kalamity; Agrospoj: Praha, Czech Republic, 2002. [Google Scholar]
- Hais, M.; Jonášová, M.; Langhammer, J.; Kučera, T. Comparison of two types of forest disturbance using multitemporal Landsat TM/ETM+ imagery and field vegetation data. Remote Sens. Environ. 2009, 113, 835–845. [Google Scholar] [CrossRef]
- Nováková, M.H.; Edwards-Jonášová, M. Restoration of Central-European mountain Norway spruce forest 15 years after natural and anthropogenic disturbance. For. Ecol. Manag. 2015, 344, 120–130. [Google Scholar] [CrossRef]
- Zeppenfeld, T.; Svoboda, M.; DeRose, R.J.; Heurich, M.; Müller, J.; Čížková, P.; Starý, M.; Bače, R.; Donato, D.C. Response of mountain Picea abies forests to stand-replacing bark beetle outbreaks: Neighbourhood effects lead to self-replacement. J. Appl. Ecol. 2015, 52, 1402–1411. [Google Scholar] [CrossRef]
- Canty, M.J.; Nielsen, A.A.; Schmidt, M. Automatic radiometric normalization of multitemporal satellite imagery. Remote Sens. Environ. 2004, 91, 441–451. [Google Scholar] [CrossRef]
- Schroeder, T.A.; Cohen, W.B.; Song, C.; Canty, M.J.; Yang, Z. Radiometric correction of multi-temporal Landsat data for characterization of early successional forest patterns in western Oregon. Remote Sens. Environ. 2006, 103, 16–26. [Google Scholar] [CrossRef]
- Cohen, W.B.; Spies, T.A.; Fiorella, M. Estimating the age and structure of forests in a multi-ownership landscape of western Oregon, U.S.A. Int. J. Remote Sens. 1995, 16, 721–746. [Google Scholar] [CrossRef]
- Bonneau, L.R.; Shields, K.S.; Civco, D.L. Using Satellite Images to Classify and Analyze the Health of Hemlock Forests Infested by the Hemlock Woolly Adelgid. Biol. Invasions 1999, 1, 255–267. [Google Scholar] [CrossRef]
- Wulder, M.A.; Skakun, R.S.; Kurz, W.A.; White, J.C. Estimating time since forest harvest using segmented Landsat ETM+ imagery. Remote Sens. Environ. 2004, 93, 179–187. [Google Scholar] [CrossRef]
- Jin, S.; Sader, S.A. Comparison of time series tasseled cap wetness and the normalized difference moisture index in detecting forest disturbances. Remote Sens. Environ. 2005, 94, 364–372. [Google Scholar] [CrossRef]
- Jakuš, R. A method for the protection of spruce stands againstIps typographus by the use of barriers of pheromone traps in north-eastern Slovakia. Anz. Schädlingskd Pflanzenschutz Umweltschutz 1998, 71, 152–158. [Google Scholar] [CrossRef]
- Matějka, K. Forest Altitudinal Zones with Dominant Norway Spruce in the Czech Republic. Available online: http://www.infodatasys.cz/public/Lesnik21_2014km.pdf (accessed on 25 May 2016).
- Randuška, D. Forest typology in Czechoslovakia. In Application of Vegetation Science to Forestry. Handbook of Vegetation Science; Jahn, G., Ed.; Dr. W. Junk Publication: The Hague, The Netherlands, 1982; Volume 12, pp. 147–178. [Google Scholar]
- Tüxen, R. Die Heutige Potentielle Natürliche Vegetation Als Gegenstand der Vegetationskartierung; Zentralstelle für Vegetationskartierung: Remagen, Germany, 1956. [Google Scholar]
- Viewegh, J.; Kusbach, A.; Mikeska, M. Czech forest ecosystem classification. J. For. Sci. 2003, 49, 85–93. [Google Scholar]
- McCune, B.; Keon, D. Equations for potential annual direct incident radiation and heat load. J. Veg. Sci. 2002, 13, 603–606. [Google Scholar] [CrossRef]
- Matějka, K. Hodnocení Přirozenosti Lesů NP Šumava (Evaluation of Naturalness of Forests in the Šumava National Park); Report for the Ministry of Environment; Ministry of Environment: Prague, Czech Republic, 2014.
- Zuur, A.F.; Ieno, E.N.; Elphick, C.S. A protocol for data exploration to avoid common statistical problems. Methods Ecol. Evol. 2010, 1, 3–14. [Google Scholar] [CrossRef]
- Gelman, A.; Su, Y.-S. Data Analysis Using Regression and Multilevel/Hierarchical Models; Cambridge University Press: Cambridge, UK, 2015. [Google Scholar]
- R Development Core Team. R: A Language and Environment for Statistical Computing; R Foundation for Statistical Computing: Vienna, Austria, 2014. [Google Scholar]
- Burnham, K.P.; Anderson, D.R.; Huyvaert, K.P. AIC model selection and multimodel inference in behavioral ecology: Some background, observations, and comparisons. Behav. Ecol. Sociobiol. 2011, 65, 23–35. [Google Scholar] [CrossRef]
- Grueber, C.E.; Nakagawa, S.; Laws, R.J.; Jamieson, I.G. Multimodel inference in ecology and evolution: Challenges and solutions. J. Evol. Biol. 2011, 24, 699–711. [Google Scholar] [CrossRef] [PubMed]
- Symonds, M.R.E.; Moussalli, A. A brief guide to model selection, multimodel inference and model averaging in behavioural ecology using Akaike’s information criterion. Behav. Ecol. Sociobiol. 2011, 65, 13–21. [Google Scholar] [CrossRef]
- Bartoń, K. MuMIn: Multi-Model Inference; R Package Version 1.15; Bartoń: Krakow, Poland, 2016. [Google Scholar]
- Fawcett, T. An introduction to ROC analysis. Pattern Recognit. Lett. 2006, 27, 861–874. [Google Scholar] [CrossRef]
- Fielding, A.H.; Bell, J.F. A review of methods for the assessment of prediction errors in conservation presence/absence models. Environ. Conserv. 1997, 24, 38–49. [Google Scholar] [CrossRef]
- Robin, X.; Turck, N.; Hainard, A.; Tiberti, N.; Lisacek, F.; Sanchez, J.-C.; Müller, M. pROC: An open-source package for R and S+ to analyze and compare ROC curves. BMC Bioinform. 2011, 12. [Google Scholar] [CrossRef] [PubMed]
- Yoshida, Y.; Joiner, J.; Tucker, C.; Berry, J.; Lee, J.-E.; Walker, G.; Reichle, R.; Koster, R.; Lyapustin, A.; Wang, Y. The 2010 Russian drought impact on satellite measurements of solar-induced chlorophyll fluorescence: Insights from modeling and comparisons with parameters derived from satellite reflectances. Remote Sens. Environ. 2015, 166, 163–177. [Google Scholar] [CrossRef]
- Rock, B.N.; Vogelmann, J.E.; Williams, D.L.; Vogelmann, A.F.; Hoshizaki, T. Remote Detection of forest damage. Bioscience 1986, 36, 439–445. [Google Scholar] [CrossRef]
- Collins, J.B.; Woodcock, C.E. An assessment of several linear change detection techniques for mapping forest mortality using multitemporal Landsat TM data. Remote Sens. Environ. 1996, 56, 66–77. [Google Scholar] [CrossRef]
- Dantas de Paula, M.; Groeneveld, J.; Huth, A. The extent of edge effects in fragmented landscapes: Insights from satellite measurements of tree cover. Ecol. Indic. 2016, 69, 196–204. [Google Scholar] [CrossRef]
- Kopácek, J.; Veselý, J.; Stuchlík, E. Sulphur and nitrogen fluxes and budgets in the Bohemian Forest and Tatra Mountains during the Industrial Revolution (1850–2000). Hydrol. Earth Syst. Sci. 2001, 5, 391–406. [Google Scholar] [CrossRef]
- Šantrůčková, H.; Šantrůček, J.; Šetlík, J.; Svoboda, M.; Kopáček, J. Carbon isotopes in tree rings of Norway spruce exposed to atmospheric pollution. Environ. Sci. Technol. 2007, 41, 5778–5782. [Google Scholar] [CrossRef] [PubMed]
- Polák, T.; Cudlín, P.; Moravec, I.; Albrechtová, J. Macroscopic indicators for the retrospective assessment of Norway spruce crown response to stress in the Krkonoše Mountains. Trees 2007, 21, 23–35. [Google Scholar] [CrossRef]
- Wermelinger, B. Ecology and management of the spruce bark beetle Ips typographus—A review of recent research. For. Ecol. Manag. 2004, 202, 67–82. [Google Scholar] [CrossRef]
- Bytnerowicz, A.; Badea, O.; Barbu, I.; Fleischer, P.; Frączek, W.; Gancz, V.; Godzik, B.; Grodzińska, K.; Grodzki, W.; Karnosky, D.; et al. New international long-term ecological research on air pollution effects on the Carpathian Mountain forests, Central Europe. Environ. Int. 2003, 29, 367–376. [Google Scholar] [CrossRef]
- Vogelmann, J.E.; Xian, G.; Homer, C.; Tolk, B. Monitoring gradual ecosystem change using Landsat time series analyses: Case studies in selected forest and rangeland ecosystems. Remote Sens. Environ. 2012, 122, 92–105. [Google Scholar] [CrossRef]


| Acquisition Date |
|---|
| 3 August 1984 |
| 9 August 1986 |
| 11 July 1987 |
| 6 August 1988 |
| 5 July 1988 |
| 8 July 1989 |
| 4 August 1990 |
| 7 August 1991 |
| 9 August 1992 |
| 31 August 1994 |
| 14 July 1994 |
| 30 July 1994 |
| 1 July 1995 |
| 7 August 1997 |
| 10 August 1998 |
| 14 September 1999 |
| Variable Name and Description | Abbreviation | State | Units | Data Source |
|---|---|---|---|---|
| Forest structure | ||||
| Distance to the nearest infested forest in the previous year | Dist-source | dynamic | (m) | map of land cover |
| Direction to the nearest infested forest in the previous year | Dir-source | dynamic | 8 classes | map of land cover |
| Distance to the nearest clear-cut | D-clear-cut | static | (m) | map of land cover |
| Distance to the natural non forested area | D-natur-edg | static | (m) | map of land cover |
| Degree of naturalness of forest stand | Dg-natur | static | 6 classes | [55,60] |
| Age of dominant tree layer | Age | static | years | FMI database |
| Tree density of dominant tree layer | Density | static | trees no./ha | FMI database |
| Pedology and geology | ||||
| Edaphic category | Edaphic | static | 11 classes | FMI database |
| Distance to wet or aquatic conditions | Geol-wet | static | (m) | Geological map |
| Topography and climate | ||||
| Altitude | DEM | static | (m) | DMR 4G DEM |
| Heat load index | HLI | static | unitless | DMR 4G DEM |
| Area solar radiation for entire year | ASR12 | static | Wh/m2 | DMR 4G DEM |
| Topography wetness index | TWI | static | unitless | DMR 4G DEM |
| Pre-disturbance forest conditions | ||||
| Slope of Brightness index | Bright-sl | dynamic | unitless | Landsat imagery |
| Slope of Wetness index | Wet-sl | dynamic | unitless | Landsat imagery |
| Slope of Greenness index | Green-sl | dynamic | unitless | Landsat imagery |
| Year | Wet-sl | Bright-sl | Dir-Source | D-Clear-Cut | D-natur-Edge | Dg-Natur | AGE | Density | Edaphic | Geol-Wet | HLI | TWI | Legend |
|---|---|---|---|---|---|---|---|---|---|---|---|---|---|
| 1994 | 0.93 | 0.38 | 1 | 1 | 0.96 | 0.53 | 0.65 | 0.36 | 1 | 0.98 | 1 | 0.62 | ≤0.2 |
| 1995 | 0.81 | 0.57 | 0.09 | 0.33 | 0.53 | 0.56 | 0.36 | 0.48 | 0.01 | 0.42 | 0.84 | 0.62 | 0.21–0.40 |
| 1996 | 1 | 0.86 | 0.07 | 0.32 | 1 | 1 | 0.61 | 0.3 | 1 | 1 | 0.7 | 1 | 0.41–0.60 |
| 1997 | 1 | 0.54 | 0.95 | 0.45 | 0.29 | 1 | 1 | 1 | 1 | 0.53 | 0.74 | 1 | 0.61–0.80 |
| 1998 | 1 | 0.27 | 1 | 0.26 | 1 | 0.3 | 0.3 | 0.37 | 0.99 | 0.29 | 0.54 | 0.61 | 0.81–1.00 |
| 1999 | 0.99 | 0.28 | 0.45 | 0.68 | 0.4 | 0.86 | 0.31 | 0.93 | 0.47 | 0.48 | 0.29 | 0.3 | |
| 2000 | 0.26 | 0.28 | 0.01 | 0.95 | 0.32 | 0.38 | 0.26 | 0.32 | 0.01 | 0.37 | 0.66 | 0.43 |
| Years of Prediction | Legend | ||||||||
|---|---|---|---|---|---|---|---|---|---|
| 1994 | 1995 | 1996 | 1997 | 1998 | 1999 | 2000 | |||
| Years of Model Fit | 1994 | - | 0.76 | 0.75 | 0.66 | 0.49 | 0.50 | 0.62 | ≤0.5 |
| 1995 | 0.79 | - | 0.77 | 0.71 | 0.60 | 0.52 | 0.47 | 0.51–0.60 | |
| 1996 | 0.81 | 0.83 | - | 0.73 | 0.54 | 0.51 | 0.66 | 0.61–0.70 | |
| 1997 | 0.73 | 0.75 | 0.79 | - | 0.65 | 0.57 | 0.53 | 0.71–0.80 | |
| 1998 | 0.65 | 0.68 | 0.63 | 0.69 | - | 0.57 | 0.76 | 0.81–0.90 | |
| 1999 | 0.69 | 0.62 | 0.63 | 0.67 | 0.65 | - | 0.82 | ||
| 2000 | 0.70 | 0.66 | 0.63 | 0.67 | 0.65 | 0.65 | - | ||
| Year of Prediction | ||||||||
|---|---|---|---|---|---|---|---|---|
| 1994 | 1995 | 1996 | 1997 | 1998 | 1999 | 2000 | ||
| Year of Model Fit | 1994 | - | 0.01 | 0.01 | 0.02 | 0.01 | −0.01 | −0.04 |
| 1995 | 0.03 | - | 0.02 | 0.02 | 0.03 | −0.01 | 0.01 | |
| 1996 | 0.04 | 0.01 | - | 0.01 | 0.01 | 0.01 | −0.02 | |
| 1997 | 0.06 | 0.04 | 0.03 | - | 0.02 | 0.03 | 0.03 | |
| 1998 | 0.06 | 0.07 | 0.05 | 0.01 | - | 0.12 | 0.02 | |
| 1999 | 0.10 | 0.06 | 0.06 | 0.02 | 0.02 | - | −0.02 | |
| 2000 | 0.00 | 0.00 | 0.00 | 0.00 | 0.00 | 0.00 | - | |
© 2016 by the authors; licensee MDPI, Basel, Switzerland. This article is an open access article distributed under the terms and conditions of the Creative Commons Attribution (CC-BY) license (http://creativecommons.org/licenses/by/4.0/).
Share and Cite
Hais, M.; Wild, J.; Berec, L.; Brůna, J.; Kennedy, R.; Braaten, J.; Brož, Z. Landsat Imagery Spectral Trajectories—Important Variables for Spatially Predicting the Risks of Bark Beetle Disturbance. Remote Sens. 2016, 8, 687. https://doi.org/10.3390/rs8080687
Hais M, Wild J, Berec L, Brůna J, Kennedy R, Braaten J, Brož Z. Landsat Imagery Spectral Trajectories—Important Variables for Spatially Predicting the Risks of Bark Beetle Disturbance. Remote Sensing. 2016; 8(8):687. https://doi.org/10.3390/rs8080687
Chicago/Turabian StyleHais, Martin, Jan Wild, Luděk Berec, Josef Brůna, Robert Kennedy, Justin Braaten, and Zdeněk Brož. 2016. "Landsat Imagery Spectral Trajectories—Important Variables for Spatially Predicting the Risks of Bark Beetle Disturbance" Remote Sensing 8, no. 8: 687. https://doi.org/10.3390/rs8080687
APA StyleHais, M., Wild, J., Berec, L., Brůna, J., Kennedy, R., Braaten, J., & Brož, Z. (2016). Landsat Imagery Spectral Trajectories—Important Variables for Spatially Predicting the Risks of Bark Beetle Disturbance. Remote Sensing, 8(8), 687. https://doi.org/10.3390/rs8080687