Article

Thermal Imagery-Derived Surface Inundation Modeling to Assess Flood Risk in a Flood-Pulsed Savannah Watershed in Botswana and Namibia

1
Department of Earth and Ocean Sciences, University of North Carolina Wilmington, 601 S College Rd., Wilmington, NC 28403, USA
2
Department of Mathematics and Statistics, University of North Carolina Wilmington, 601 S College Rd., Wilmington, NC 28403, USA
1
School Teacher, Etomba, Namibia
1
MET, KAZA, Windhoek, Namibia
1
The Department of Water Affairs, Kasane, Botswana
*
Authors to whom correspondence should be addressed.
Remote Sens. 2016, 8(8), 676; https://doi.org/10.3390/rs8080676
Submission received: 22 April 2016 / Revised: 4 August 2016 / Accepted: 15 August 2016 / Published: 20 August 2016
(This article belongs to the Special Issue Earth Observations for a Better Future Earth)

Abstract

:
The Chobe River Basin (CRB), a sub-basin of the Upper Zambezi Basin shared by Namibia and Botswana, is a complex hydrologic system that lies at the center of the world’s largest transfrontier conservation area. Despite its regional importance for livelihoods and biodiversity, its hydrology, controlled by the timing and relative contributions of water from two regional rivers, remains poorly understood. An increase in the magnitude of flooding in this region since 2009 has resulted in significant displacements of rural communities. We use an innovative approach that employs time-series of thermal imagery and station discharge data to model seasonal flooding patterns, identify the driving forces that control the magnitude of flooding and the high population density areas that are most at risk of high magnitude floods throughout the watershed. Spatio-temporal changes in surface inundation determined using NASA Moderate-resolution Imaging Spectroradiometer (MODIS) thermal imagery (2000–2015) revealed that flooding extent in the CRB is extremely variable, ranging from 401 km2 to 5779 km2 over the last 15 years. A multiple regression model of lagged discharge of surface contributor basins and flooding extent in the CRB indicated that the best predictor of flooding in this region is the discharge of the Zambezi River 64 days prior to flooding. The seasonal floods have increased drastically in magnitude since 2008 causing large populations to be displaced. Over 46,000 people (53% of Zambezi Region population) are living in high magnitude flood risk areas, making the need for resettlement planning and mitigation strategies increasingly important.

Graphical Abstract

1. Introduction

For centuries, populations worldwide have relied on seasonal flooding for their livelihoods. This dependence has resulted in settlements being built on riverbanks and floodplains in order to utilize the water sources and fluvial soils provided by seasonal floods. However, with these resources come risks. Seasonal flooding can be unpredictable in its timing and extent, threatening the lives of people who depend upon these floods. It is estimated that one billion people are living in the potential path of a 100-year flood (whether coastal or inland) and this number is expected to double by 2050 due to climate change, sea level rise and deforestation [1]. Floods affect the lives of over 500 million people per year worldwide and result in death, disease, homelessness, and other devastating losses. The majority of these communities contain some of the poorest people in the world and disaster warning and preparedness is nearly absent [1]. Increasing frequency and intensity of seasonal floods will continue to drive communities out of their homes and lead to environmental refugees and the need for resettlements [2].
In order for successful resettlement plans to be made, areas at the highest risk from inundation must be properly identified and predicted. Remote sensing offers the ability to map and analyze both seasonal and inter-annual flood dynamics at a regional scale, making it an indispensable tool for flood monitoring. Temporal changes in flooding extent can be monitored based on remotely sensed imagery using a variety of data collection methods such as optical [3], thermal, and RAdio Detection and Ranging (RADAR) imagery [4]. Further, optical data in particular has often been utilized for flood detection, as techniques for thresholding and ratioing between channels, supervised and unsupervised classifications, and additional indices including the Normalized Difference Water Index (NDWI), Land Surface Water Index (LSWI) and Vegetation Index (EVI) [5,6,7,8,9,10] extend the capabilities of multispectral data. The combination of multispectral images and data from active sensors (including RADAR and LiDAR) presents an advantage in flood detection that is commonly utilized by the remote sensing community [11,12].
Optical imagery of flooded and wet areas may contain a great deal of information that can be used to monitor nutrient fluxes, suspended sediment, and chlorophyll concentrations. This additional information, however, may confound the detection of floodwaters if a researcher is unfamiliar with local water conditions. One of the widely-utilized water indices, the NDWI [13], can mistake land noise for water, though the modification of this index using a middle infrared band can improve results [14]. In addition, surrounding land surfaces may be mistaken for water when the spectral signature in one of the infrared bands is similar. Pricope et al. [15] mapped flooding extents, but in some cases, fire scars caused the amount of flooding to be underestimated.
The use of thermal data, however, may not result in such inaccuracies. Water’s high thermal inertia and emissivity result in areas of homogenous surface temperatures in flooded regions. In addition, thermal data is generally only able to detect surface temperatures, meaning that suspended particles are less likely to influence the delineation of surface waters, which can often carry high sediment loads. The properties of water allow for increased potential with thermal imagery because night and day images can be compared using the diurnal differences of land and surface temperatures. This technique has been used in many regions worldwide, including the Everglades [16], the continent of Africa [17], an agricultural region of Germany [18], the Sudd wetlands of South Sudan [19], and the Xinjiang Autonomous Region of China [20].
The MODIS Terra and Aqua sensors are able to collect thermal data of a sufficiently high temporal resolution for night and day differencing techniques. Khan et al. [7] and Sakamoto et al. [6] demonstrated that MODIS can successfully distinguish between flooded and non-flooded pixels. The lower spatial resolution that MODIS offers is sufficient for mapping in larger regional areas [21], especially transnational water systems [19] in wetland areas [22]. The diurnal temperature difference is extremely detectable in semi-arid areas, such as southern Africa, where the surrounding landscape is devoid of localized water or heavy vegetation that may influence flood detection.
Fertile alluvial soils, fishery resources and grazing lands in the Upper Zambezi support one of the most densely populated areas in southern Africa [23]. Although seasonal floods are essential to the ecology of this region, floods of extreme magnitude cause the rapid migration of people and animals alike, increasing human-wildlife conflict and leading to temporary or permanent displacements. A series of large floods have occurred in the Zambezi region since 2009, and have drawn the attention of relief agencies and placed additional burdens on local communities as well as land and water managers [10]. Areas that had been dry for decades have recently been experiencing floods of extreme magnitudes exposing un-expecting villages to a variety of threats [24]. Prior research has attempted to identify the causes of the increase in high magnitude floods in recent years in the Upper Zambezi region. McCarthy and Gumbricht [5] used NOAA Advanced Very High Resolution Radiometer (AVHRR) to estimate inundation and concluded that changes in channel distribution and the resulting spatial extent of the flooded area can been attributed to external climate changes and El Nino/Southern Oscillation (ENSO) effects. This is further supported by Wolski et al. [25] who found the annual flood patterns in the Okavango basin have been changing over past decades and examined the extent to which extreme floods, such as those between 2009 and 2011, were caused by greenhouse-gas-driven climate change. Wolski et al. [25] determined that the probability of such extreme floods would be lower in a climate without anthropogenic greenhouse gas forcings. A better understanding of the flooding patterns and the driving forces of these floods can reveal which regions are most susceptible to high magnitude floods and can help determine whether relocation actions are required from the government. Though there are risks, a flood can also present short-term economic opportunities, which may make it difficult to convince communities to move from their homes. Fishing, for instance, becomes possible in areas that are dry under normal conditions [26].
Previous research in the Chobe River Basin (CRB henceforth) shows that it receives pulses of floodwater from various sources throughout the year, but the quantity and impact of each of these sources is not fully understood and results have been somewhat conflicting. The goals of this research are to reveal the surficial hydrologic connections of the Chobe with the Kwando and Zambezi Rivers, quantify the influxes to the Chobe and inundation patterns throughout the year and identify high population density areas that are most at risk. Specifically, this research will address the following questions:
(1)
Can thermal imagery be utilized successfully to determine the seasonal and inter-annual patterns of inundation in the Chobe River Basin and how have they changed over the past 15 years?
(2)
What are the driving forces that control the magnitude of flooding of the Chobe River, do different variables have more of an impact on the flooding magnitude than others and how do these variables differ between years that experience average flooding and years with unusual (high or low) flooding magnitude?
(3)
Where in the Chobe River basin are large populations of people most susceptible to high magnitude floods?

2. Materials and Methods
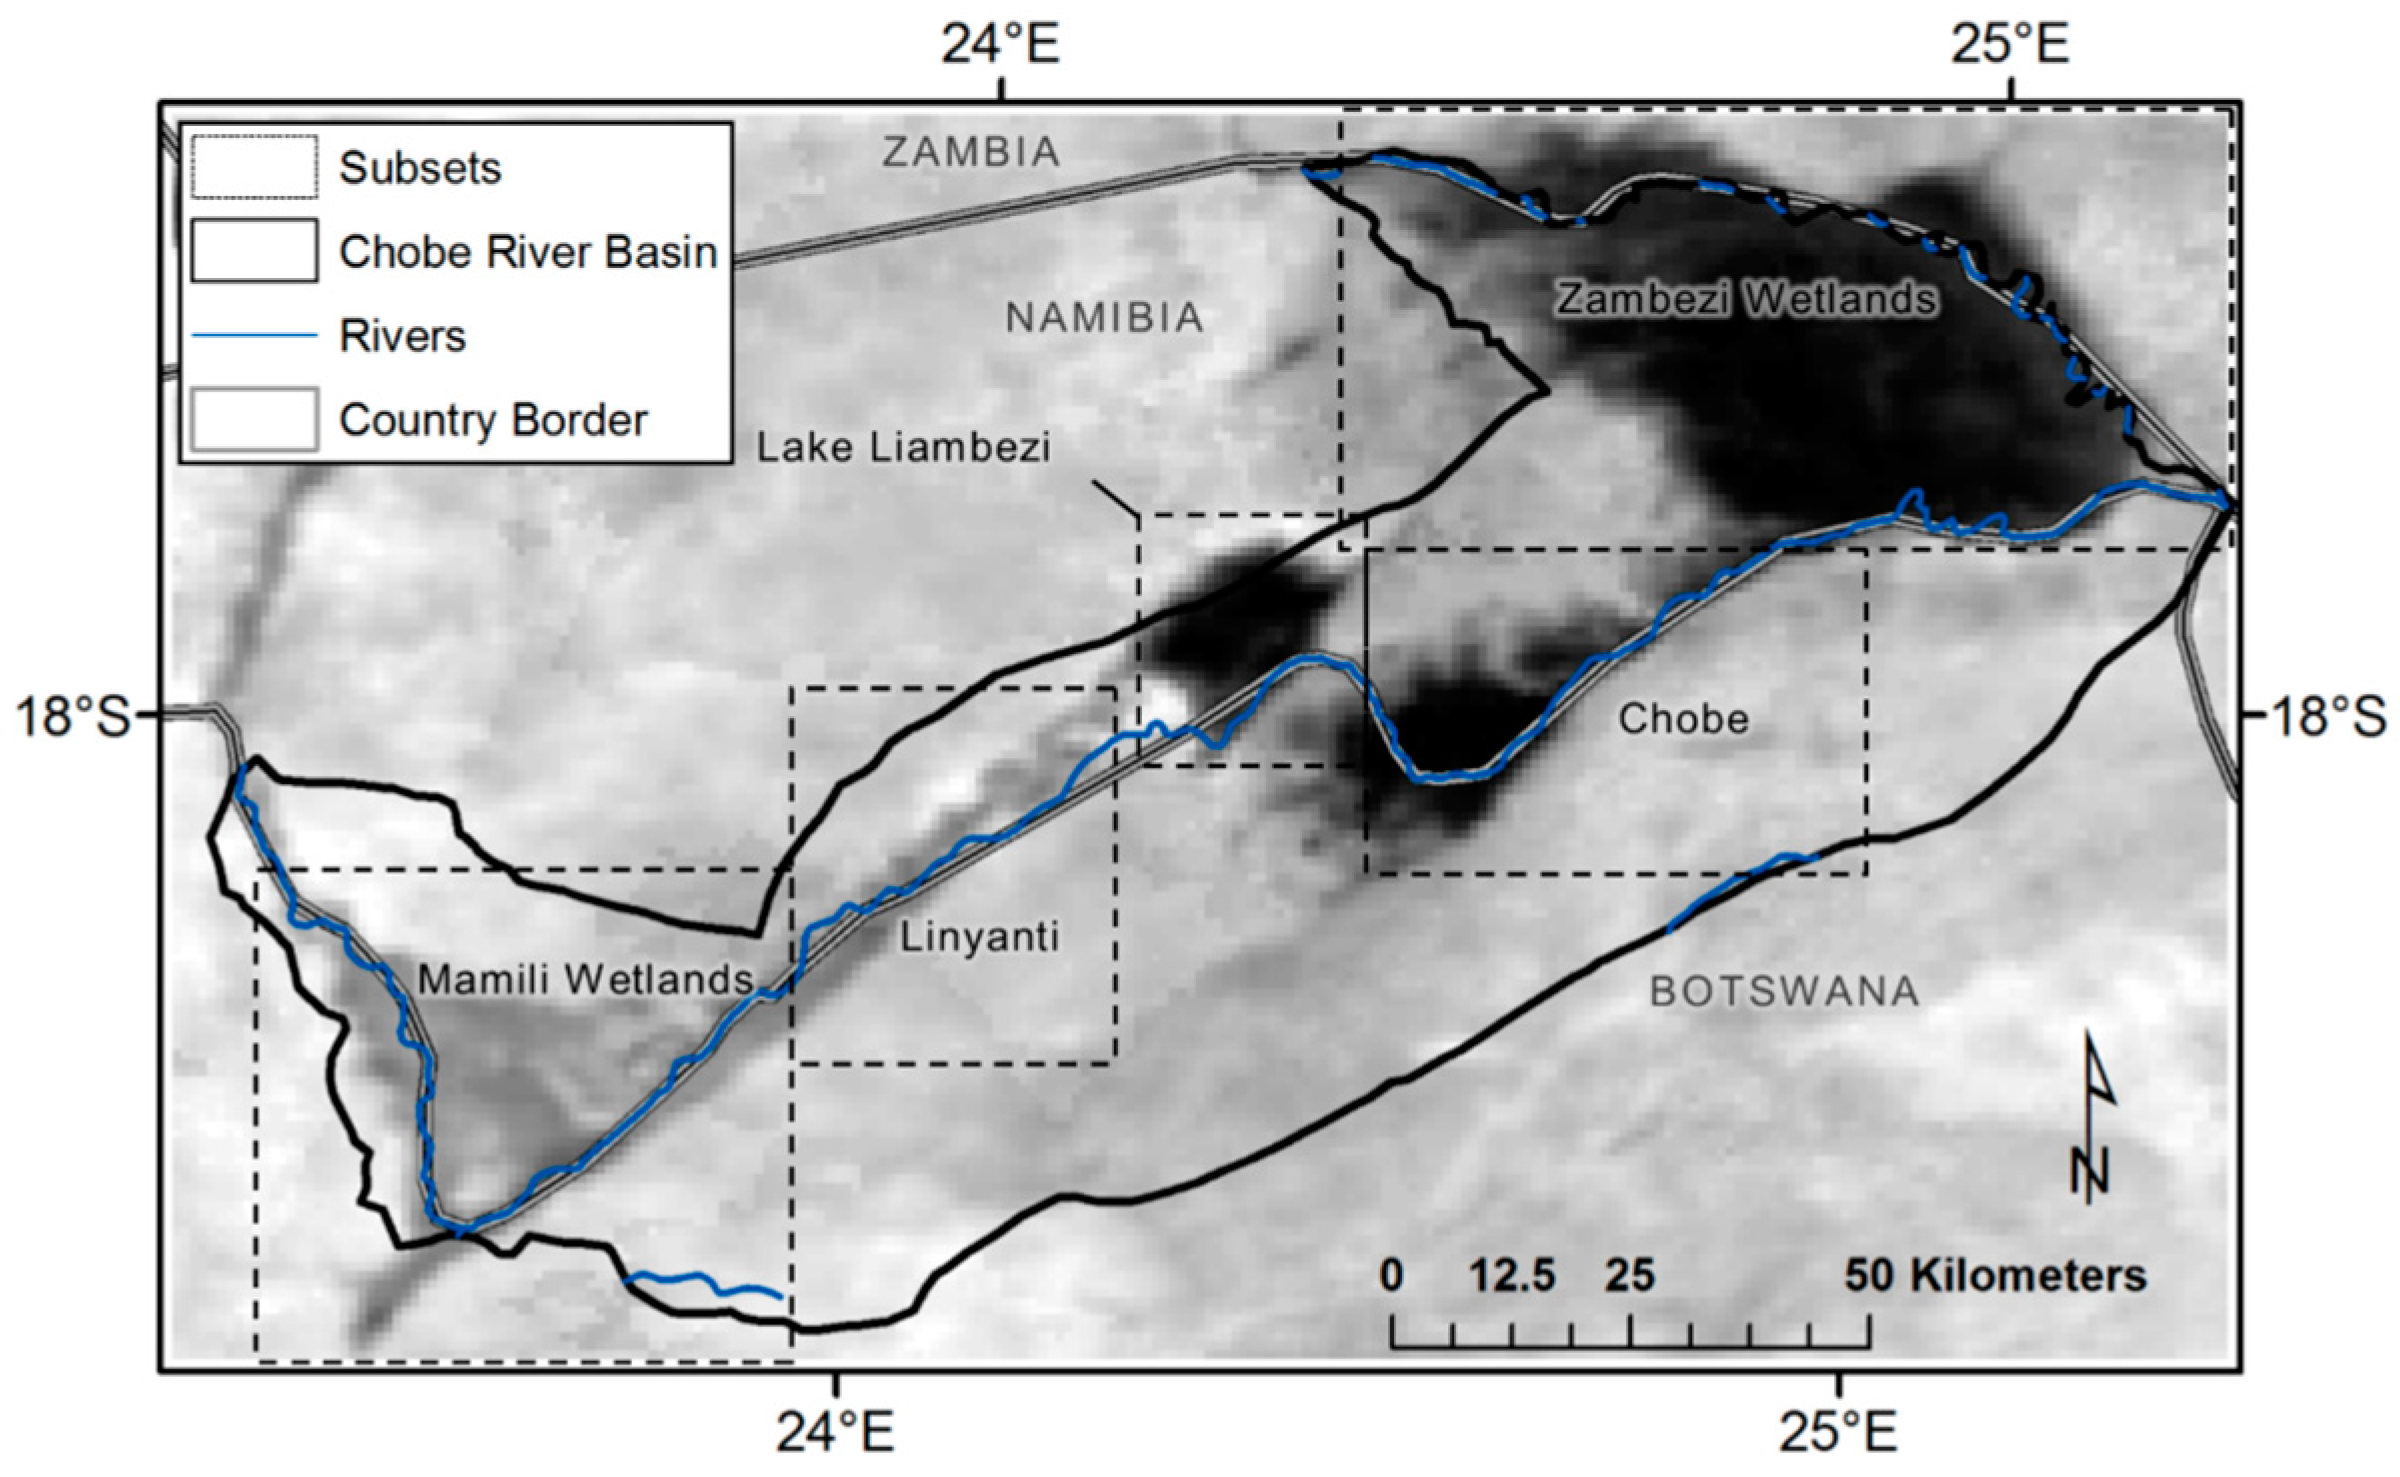
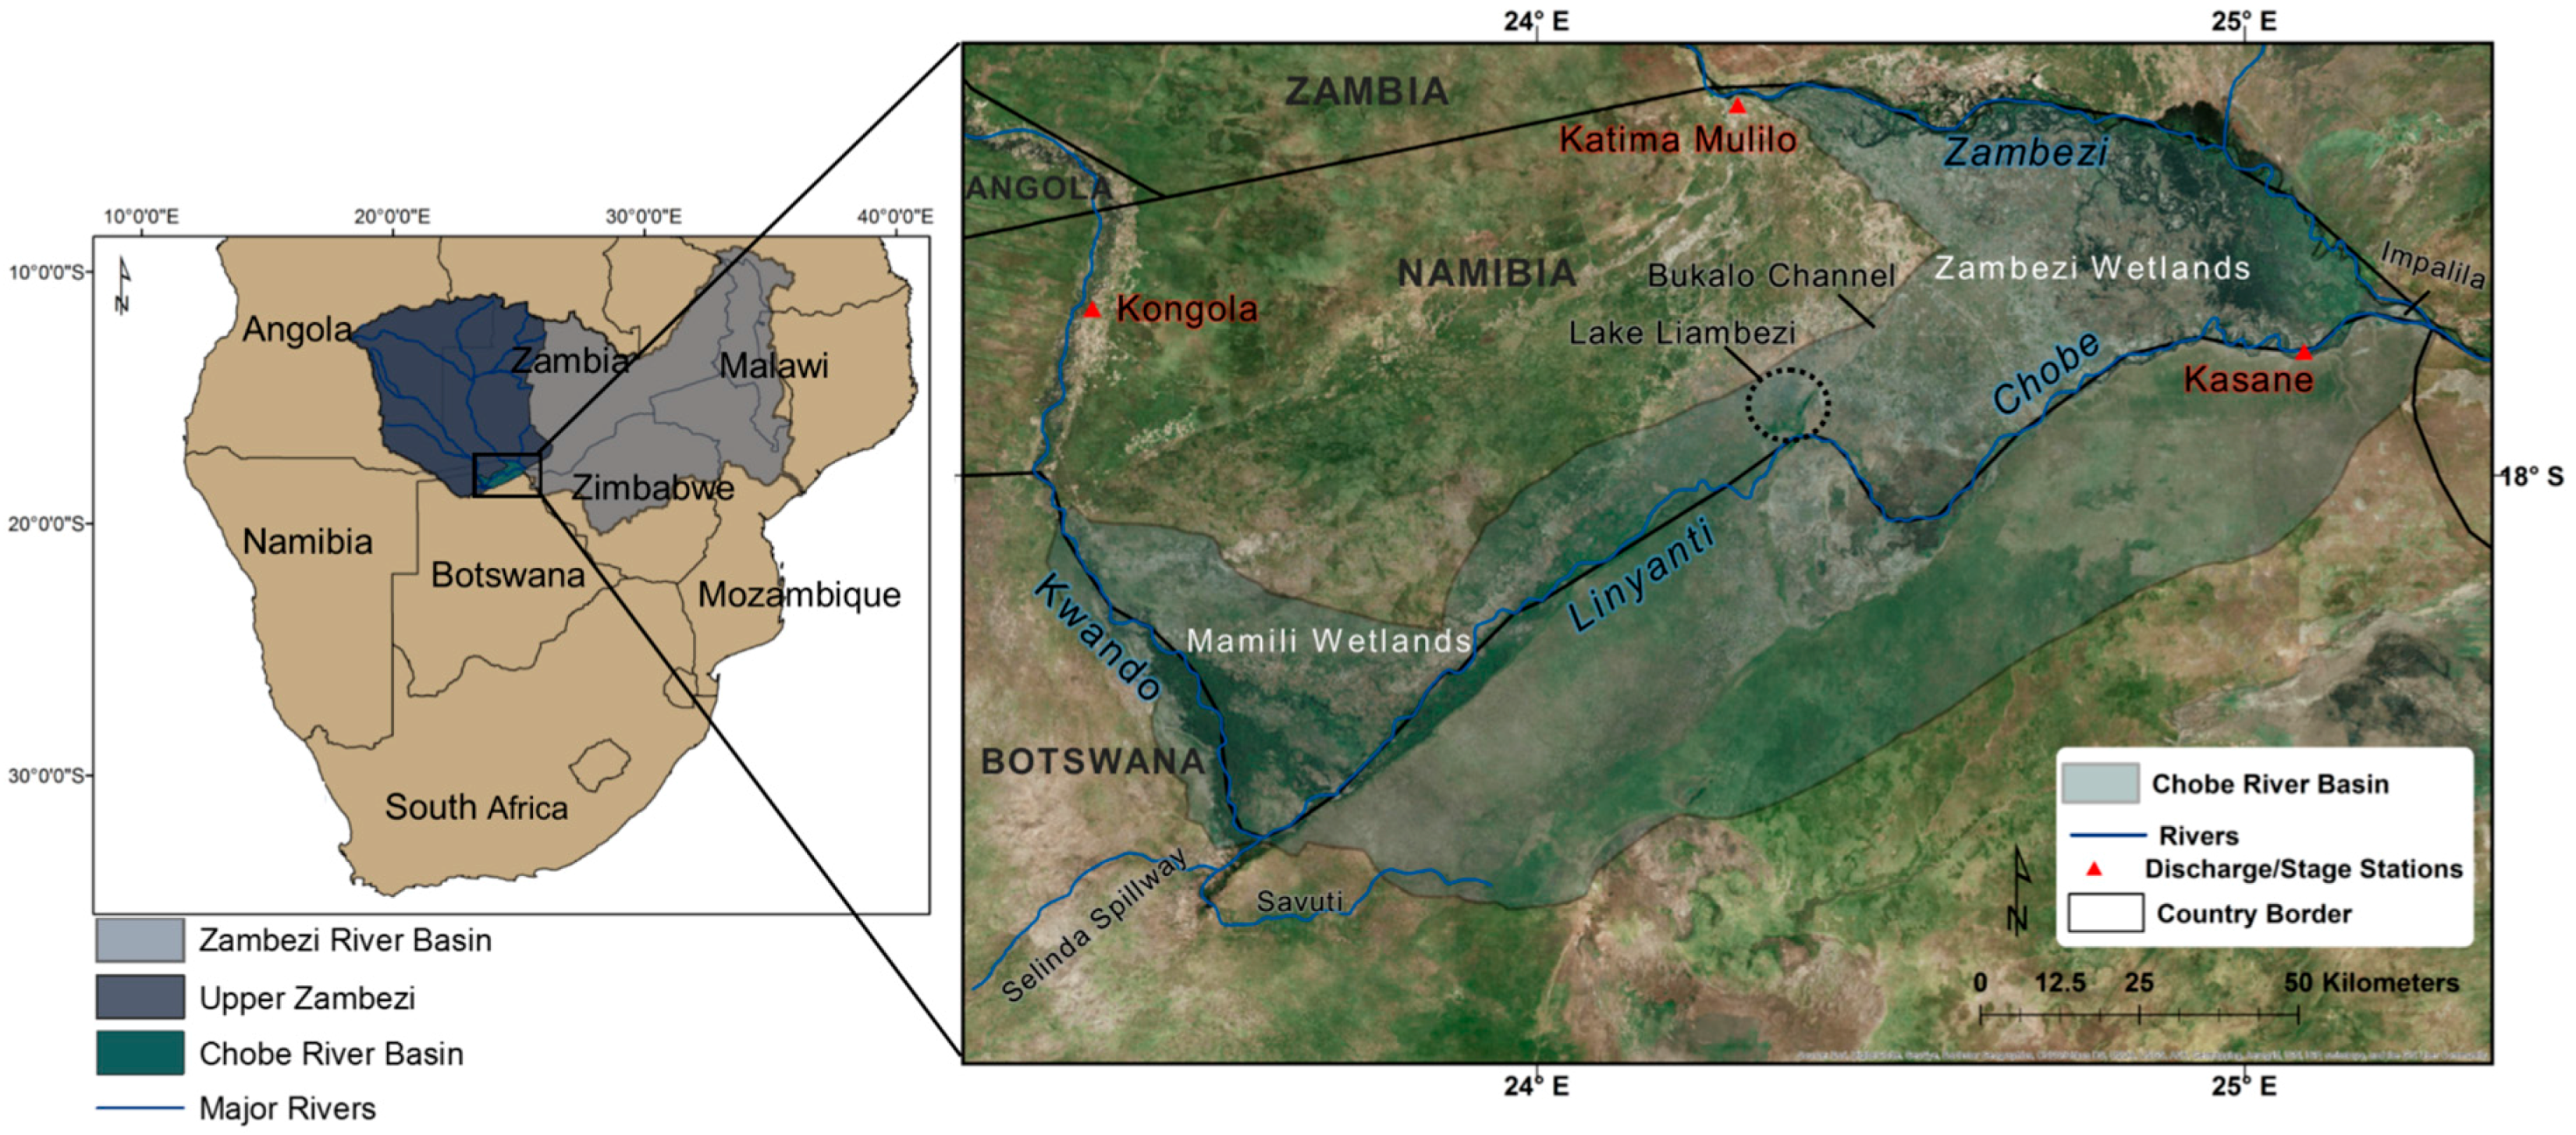
2.1. Study Area

This study focuses on the flooding patterns of the Chobe River basin (CRB), a ~4000 km2 sub-basin of the Upper Zambezi in Botswana and Namibia (Figure 1). The basin boundaries and drainage area of the Chobe River basin that contain the Mamili and Zambezi wetlands, the Chobe and Linyanti channels and floodplains, and Lake Liambezi were delineated previously by Pricope [9] using a 10-m spatial resolution DEM, 1-m spatial resolution orthophotograph, AVHRR NDVI and MODIS images and permanent water training samples [9].
Together with the Okavango Delta, the Chobe River lies at the center of the Kavango–Zambezi Transfrontier Conservation Area (KAZA), the largest transfrontier conservation area in the world spanning more than 170,000 km2 and home to the largest elephant population on earth, as well as many other migratory wildlife populations [27]. This conservation area provides a wildlife corridor and contains vital water sources for agriculture and grazing in a water-limited ecosystem [28]. Increased flooding decreases the amount of land for human use, and increases human-wildlife conflict (Elvis Simba, KAZA) 23 May 2014, personal communication [29]).
The annual flood pulses of the Chobe River are influenced by multiple factors, including the timing and relative contributions of runoff from the Zambezi, Kwando and Okavango Rivers, which in turn are determined by precipitation and evapotranspiration rates of each of these basins. Peak flow in the Okavango, Kwando and Zambezi Rivers occurs at slightly different times of the year, controlling the flow rate and flooding extent of the Chobe River. The multiple influxes of water to the river can cause an unusual back-flowing regime in the Chobe River channel during portions of the year [9]. The Zambezi River originates in northwest Zambia before flowing through east-central Angola capturing runoff from the Angolan highlands and the Kabompo and Lungwebungu Rivers. The Kwando River, also commonly spelled Cuando, originates in the central plateau of Angola, draining approximately 22% of the Upper Zambezi region [30].
The discharge patterns of the Zambezi and Kwando Rivers are controlled by regional precipitation, which are determined by the migration of the inter-tropical convergence zone (ITCZ) and sea surface temperatures in the Indian and Atlantic oceans [28]. The entire Zambezi catchment receives an average of 990 mm of rainfall per year (Figure 2). Although this is a relatively large amount of rainfall, the majority of the precipitation falls in less than six months. The Kwando/Chobe sub-catchment, which provides water to the Chobe floodplain, receives about 800 mm/year of rainfall with most of it falling between October and March [30]. Precipitation modeling and observational studies have suggested a drying trend over recent decades throughout Africa [31], though more localized dry and wet patterns over the continent have been documented. The precipitation data shown in Figure 2 reflects a weak drying trend with 90% confidence computed by a Seasonal Mann Kendall test over the study area sub basin.

2.2. Materials

2.2.1. Thermal Imagery (Land Surface Temperature)

A series of level-3 MODIS Land Surface Temperature (LST) and Emissivity products from 2000 to 2014 were used to create a time series of annual floods. LST is a product of the MODIS instrument that is onboard the EOS (Earth Observing System) AM (Terra) and PM (Aqua) platforms [32]. Land Surface Temperature & Emissivity 8-Day L3 Global 1 km (MOD11A2) images were acquired in 2014 from the USGS EarthExplorer (EE) tool from 2000 to 2014. Upon downloading, MOD11A2 8-day data are composed of daily 1-km LST product (MOD11A1) and stored on a 1-km sinusoidal grid as the average values of clear-sky LST during an 8-day period. These images are validated to stage 2 indicating that their accuracy has been assessed via ground truth over numerous locations and time periods. Land surface temperature is one of nine scientific datasets contained within the MODIS L2 LST product [33].
LST is estimated from space with an algorithm created by Wan and Li, 1997 that uses day/night pairs of thermal infrared (TIR) data in seven MODIS bands [32]. The accuracy specification for MODIS LST is 1°K at 1 km resolution under clear-sky conditions [32]. Atmospheric and emissivity effects for several land cover types are corrected using a view-angle dependent split-window LST algorithm.
Cloud coverage made images from November to March unusable. This does not act to the detriment of this method because in this region changes in flooding extent do no coincide directly with the rainy season. This method can be further utilized in trans boundary river basins where the majority of the floodwater originates outside the delta.

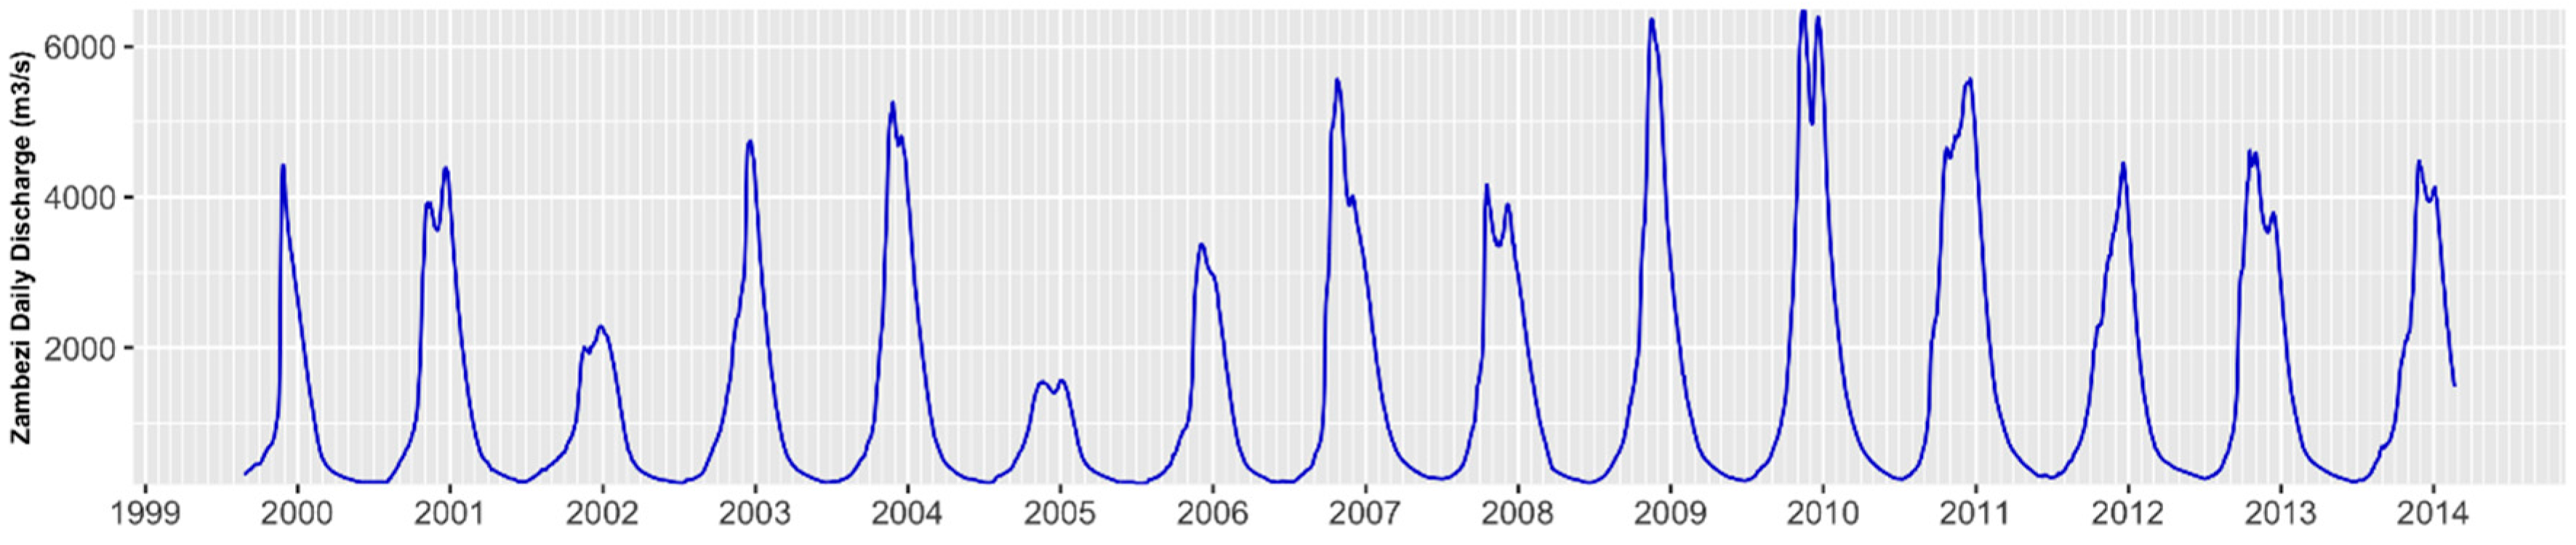
2.2.2. Discharge and Stage Data

A key dataset for the execution of this research is the discharge and river stage data that were collected for multiple stations throughout the Chobe River Basin. The Department of Water Affairs office in Kasane, Botswana provided daily discharge data for the Chobe, Okavango, and Boteti Rivers, monthly channel depths of the Chobe River at Kasane from 1971 to present and weekly water situation reports for major dams and rivers in the Chobe/Zambezi, Limpopo and Okavango Basins (Figure 3). Daily water level and daily flow data for the Okavango, Zambezi and Kwando Rivers from 2007-present were received from the Department of Water Affairs in Windhoek, Namibia.

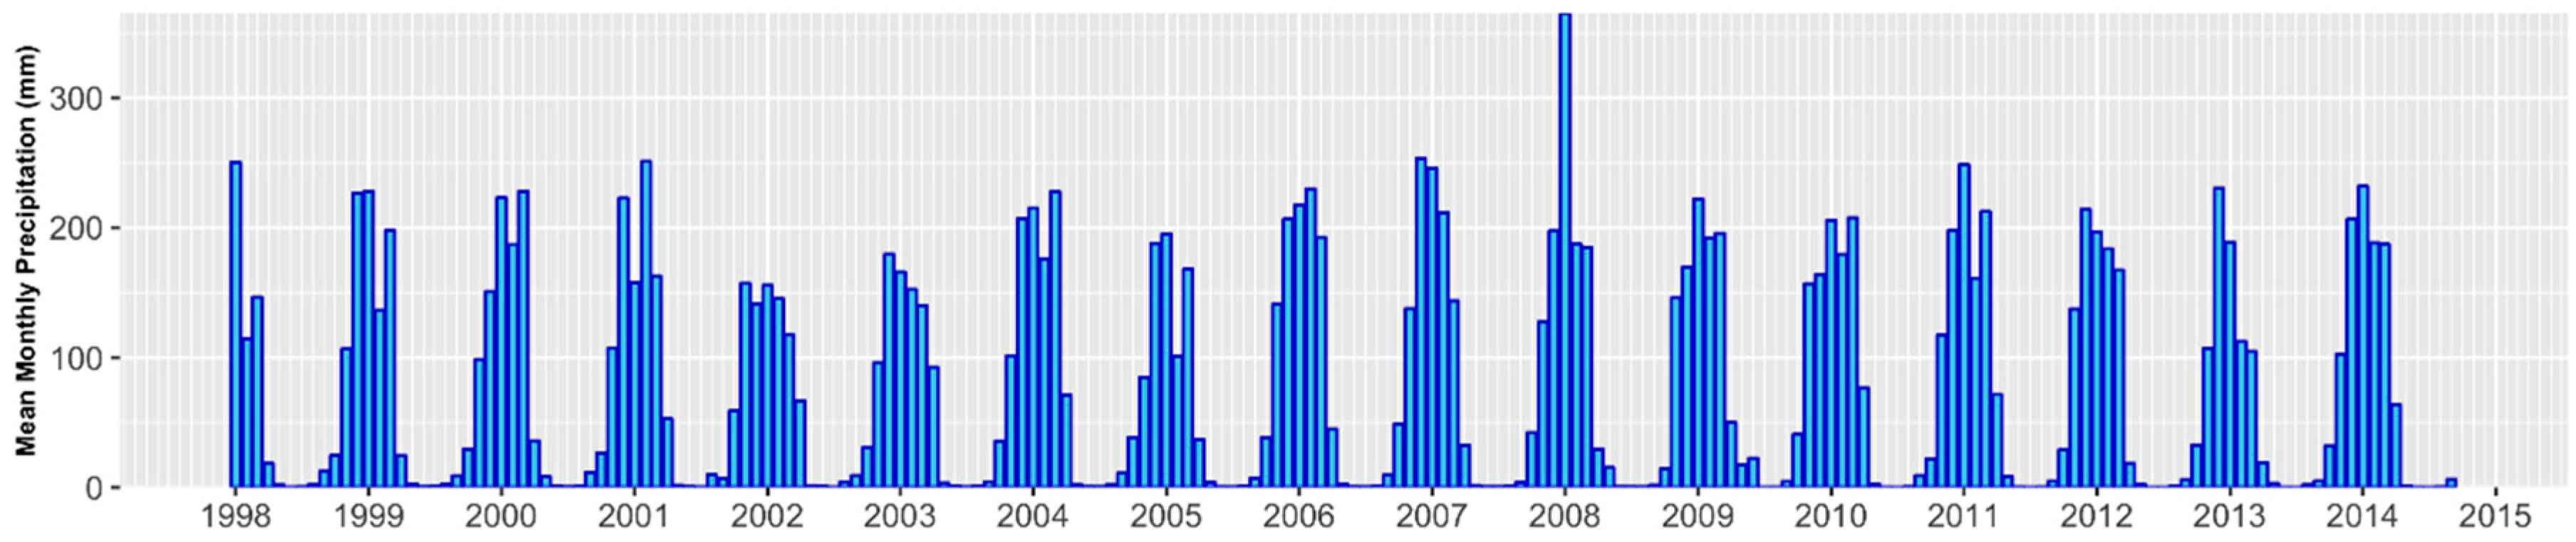
2.2.3. Precipitation

To account for precipitation patterns in the Chobe River Basin, as well as the surrounding watersheds, data from the Tropical Rainfall Measuring Mission (TRMM) 3B43 was used. The dataset from 1998 to 2014 was downloaded using the Mirador Data Access on the NASA website. Stacks of monthly and annual rainfall totals were derived and converted to millimeters. The TRMM data, with a spatial resolution of 0.25 × 0.25 degrees, was subset to both the CRB and the larger, surrounding watersheds to gain insight into the influence of local precipitation patterns on flooding area. TRMM precipitation data has proven successful in previous studies, such as Curtarelli et al. [34], which showed the TRMM 3B43 data to be in sound agreement with reference data collected at rain gauge stations. Even in studies that show TRMM data to be somewhat unreliable, the southern region of Africa indicates a lower bias than other regions and the 3B43 product was shown to be the most reliable [35].

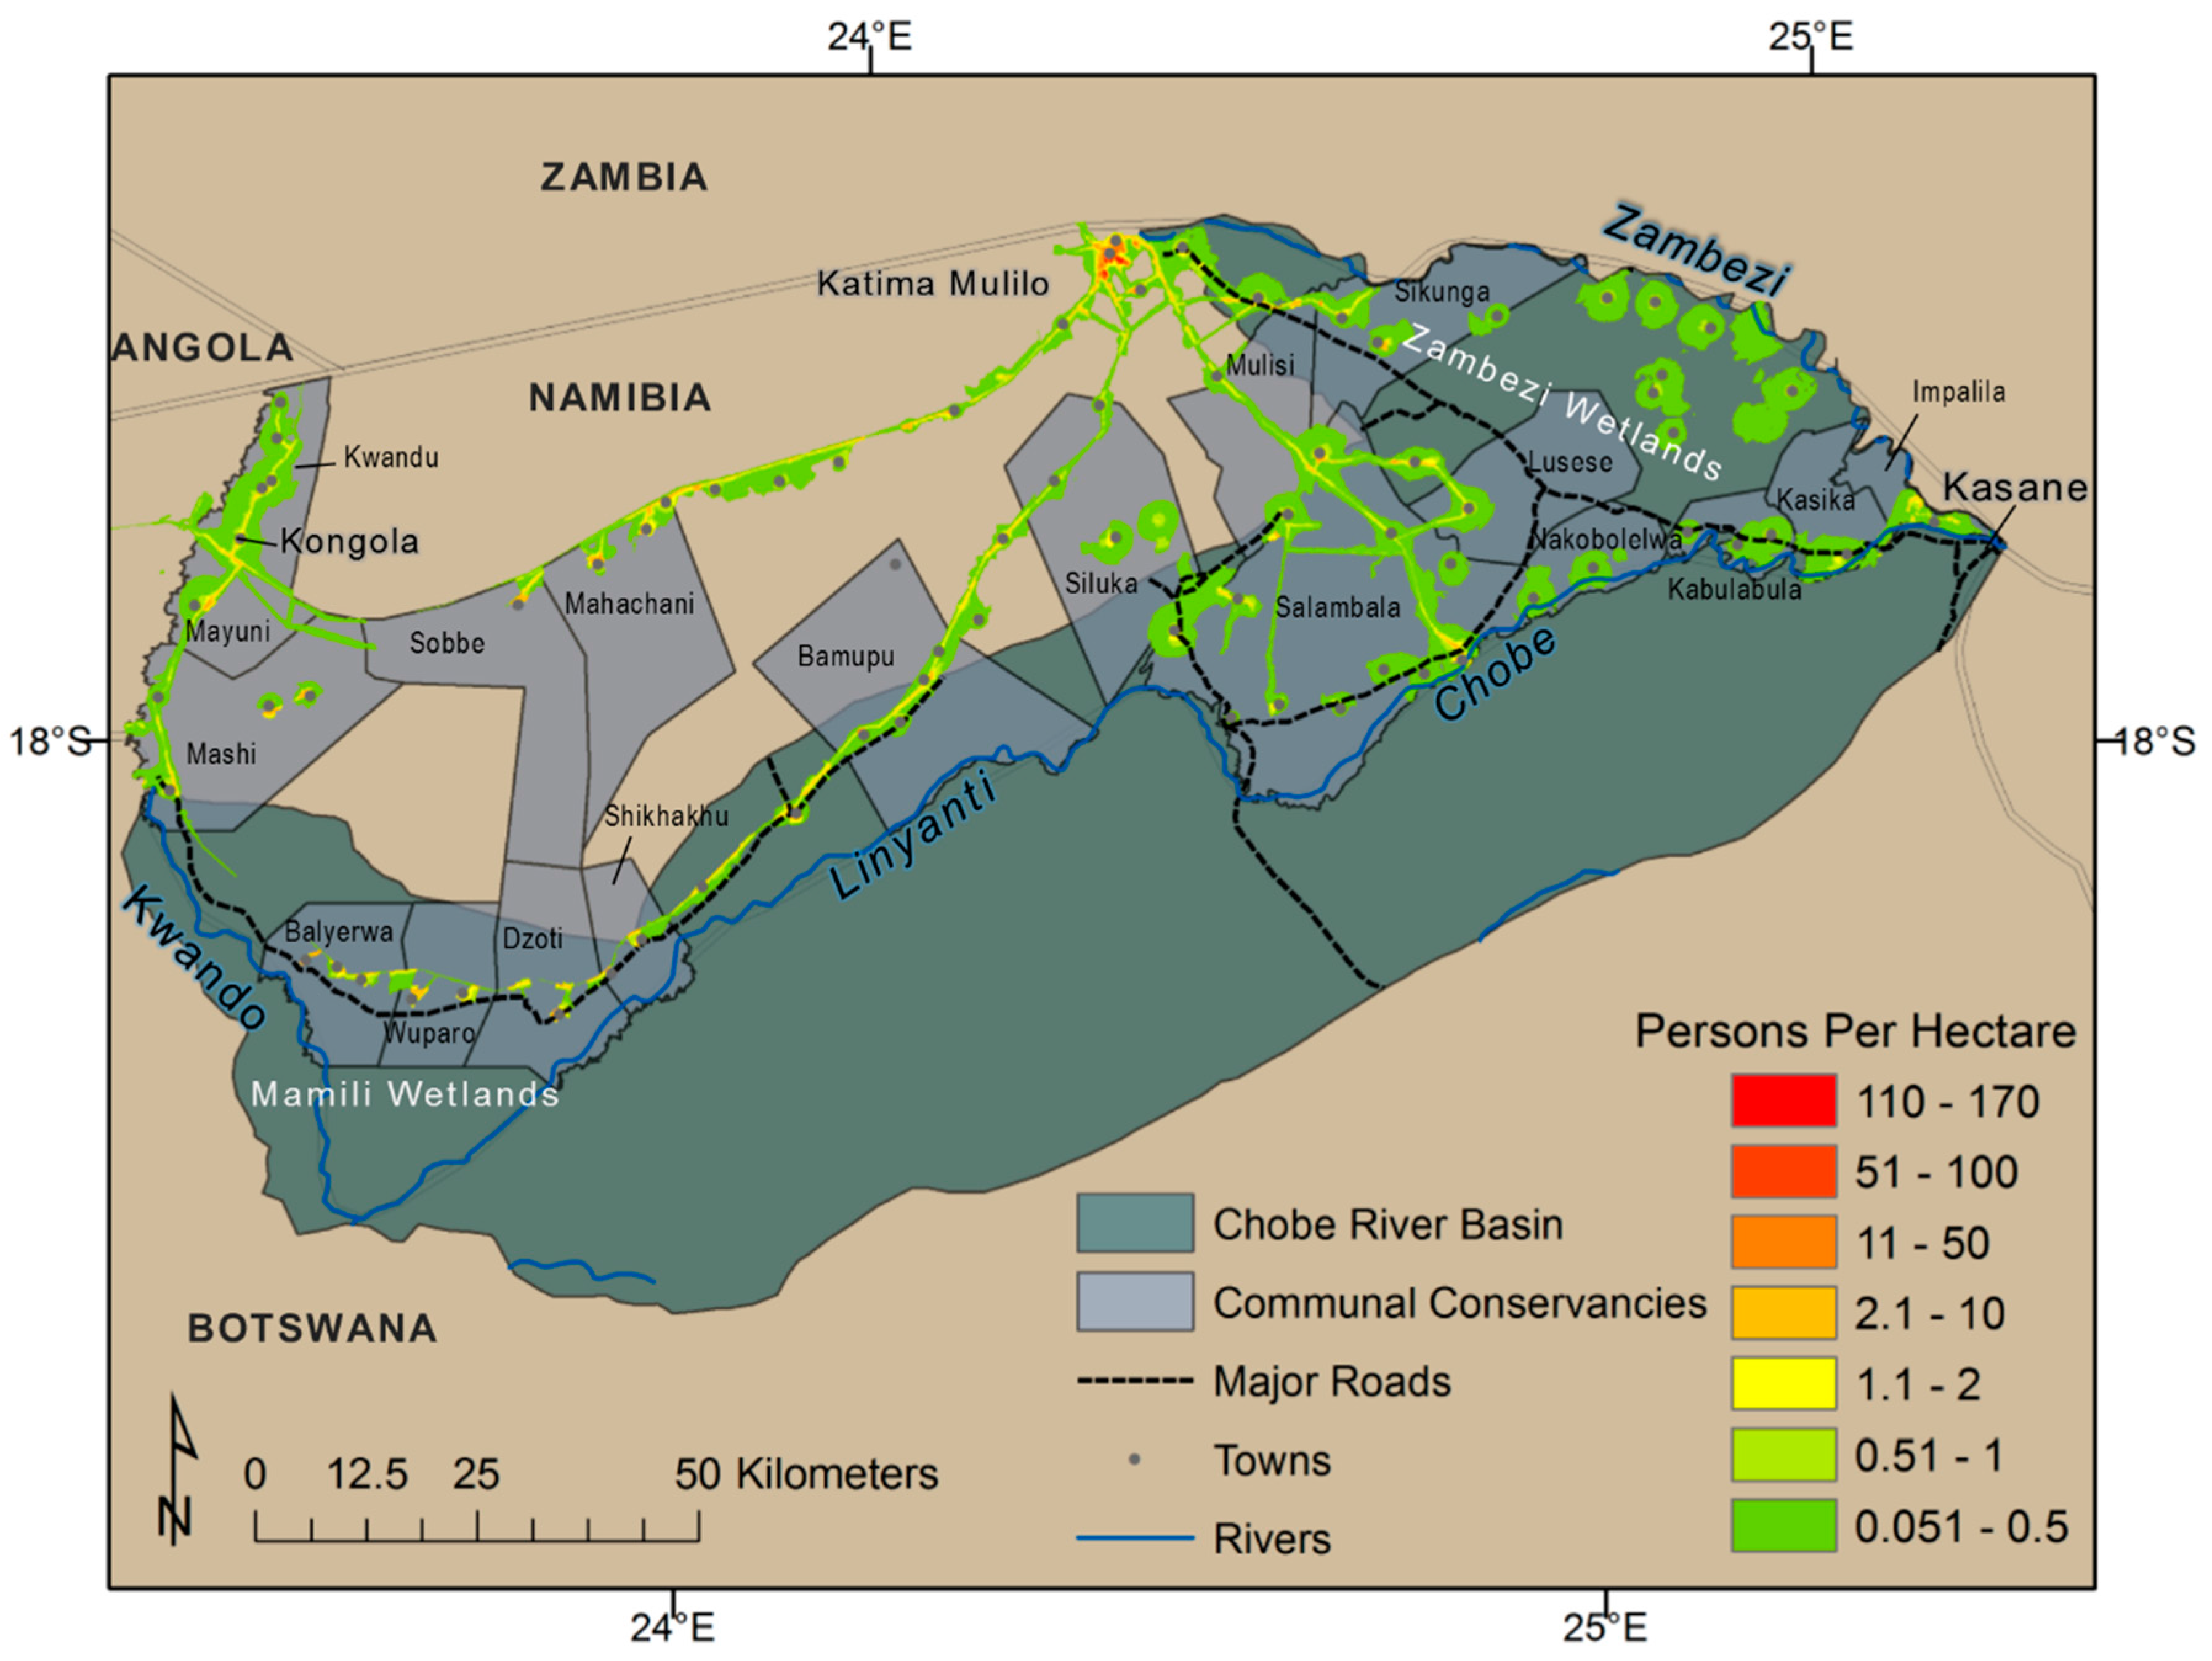
2.2.4. Population and Ancillary Data

Gridded population datasets created by the WorldPop Project were used to identify areas with high population density that have the highest risk of being exposed to a high magnitude flooding event. The population grids for 2000, 2011 and 2015 with a spatial resolution of 0.000833333 decimal degrees, or approximately 100 m, were created using a spatial model to disaggregate census counts and estimate the number of people within each grid cell of the area [36].

2.3. Methods

2.3.1. MODIS Pre-Processing and Image Differencing

The MODIS Conversion Toolkit (MCTK) was used to extract the daytime and nighttime temperature bands from the original LST Hierarchical Data Format (HDF) stack. During the conversion process, the MCTK automatically applies the scaling factor of 0.02 to accurately adjust the temperature values to degrees Kelvin. Bands 1 (LST_Day_1 km) and 5 (LST_night_1 km) were selected to be stacked in the output image. The output file is a standard grid, which maintains the native map information and sinusoidal projection [37]. All pixels with bad data were filled with NaN (Not a Number) and were later masked out when located within an obvious body of water.
Similarly to the approach used in Ordoyne and Friedl [16], surface water was extracted from the MODIS images based on diurnal temperature differences of land and water (Figure 4A). The differencing methods utilized the different diurnal temperature fluctuations of land and water to identify areas of the landscape that are covered with a significant amount of flooding. Once the MODIS images were processed in the MCTK, Interactive Data Language (IDL) was used to difference the 8-day composite daytime and 8-day composite nighttime bands using band math.

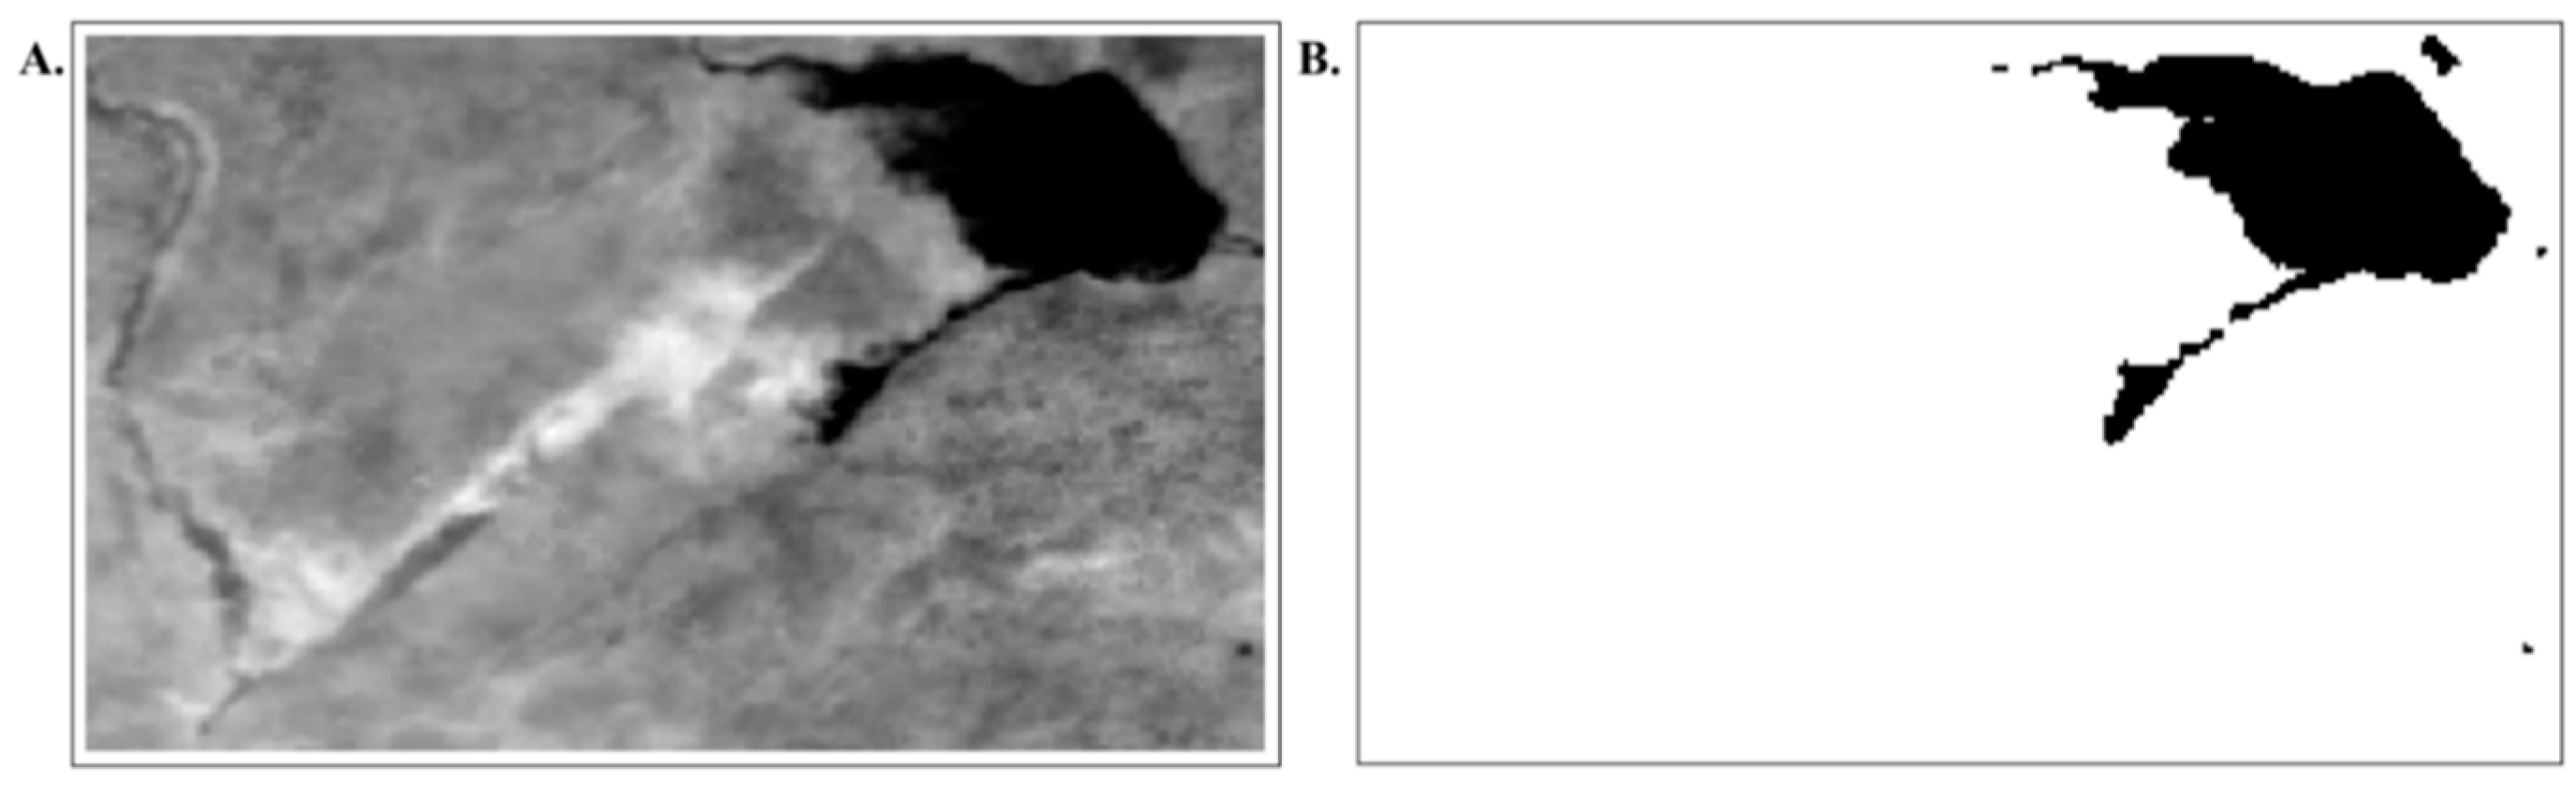
2.3.2. Image Threshold Segmentation

A fixed threshold for every image of the time series was not an appropriate approach because of the variation in diurnal temperatures during different seasons. Image specific thresholds proved to be a much more effective method because temperature thresholds change throughout the year along with local air temperature and differential land/water specific heat. Otsu thresholding is an unsupervised and nonparametric method of threshold selection from a gray level histogram [38]. Advantages of this method include its simplicity, range of applications and the automatic and stable threshold selection [38]. The Otsu method “maximizes the ratio of the between-class variance to the within-class variance” [39], thus in our case, pixels with values below the determined threshold are regarded as water while pixels above the threshold are background, or land. A total of 386 differenced images were segmented in IDL using Otsu thresholding (Figure 4). After being processed, each image was visually inspected and compared to the original differenced images to verify the results. Subsequently, a rule-based classification, using the determined threshold, was performed to identify the flooding extent on case-by-case basis.

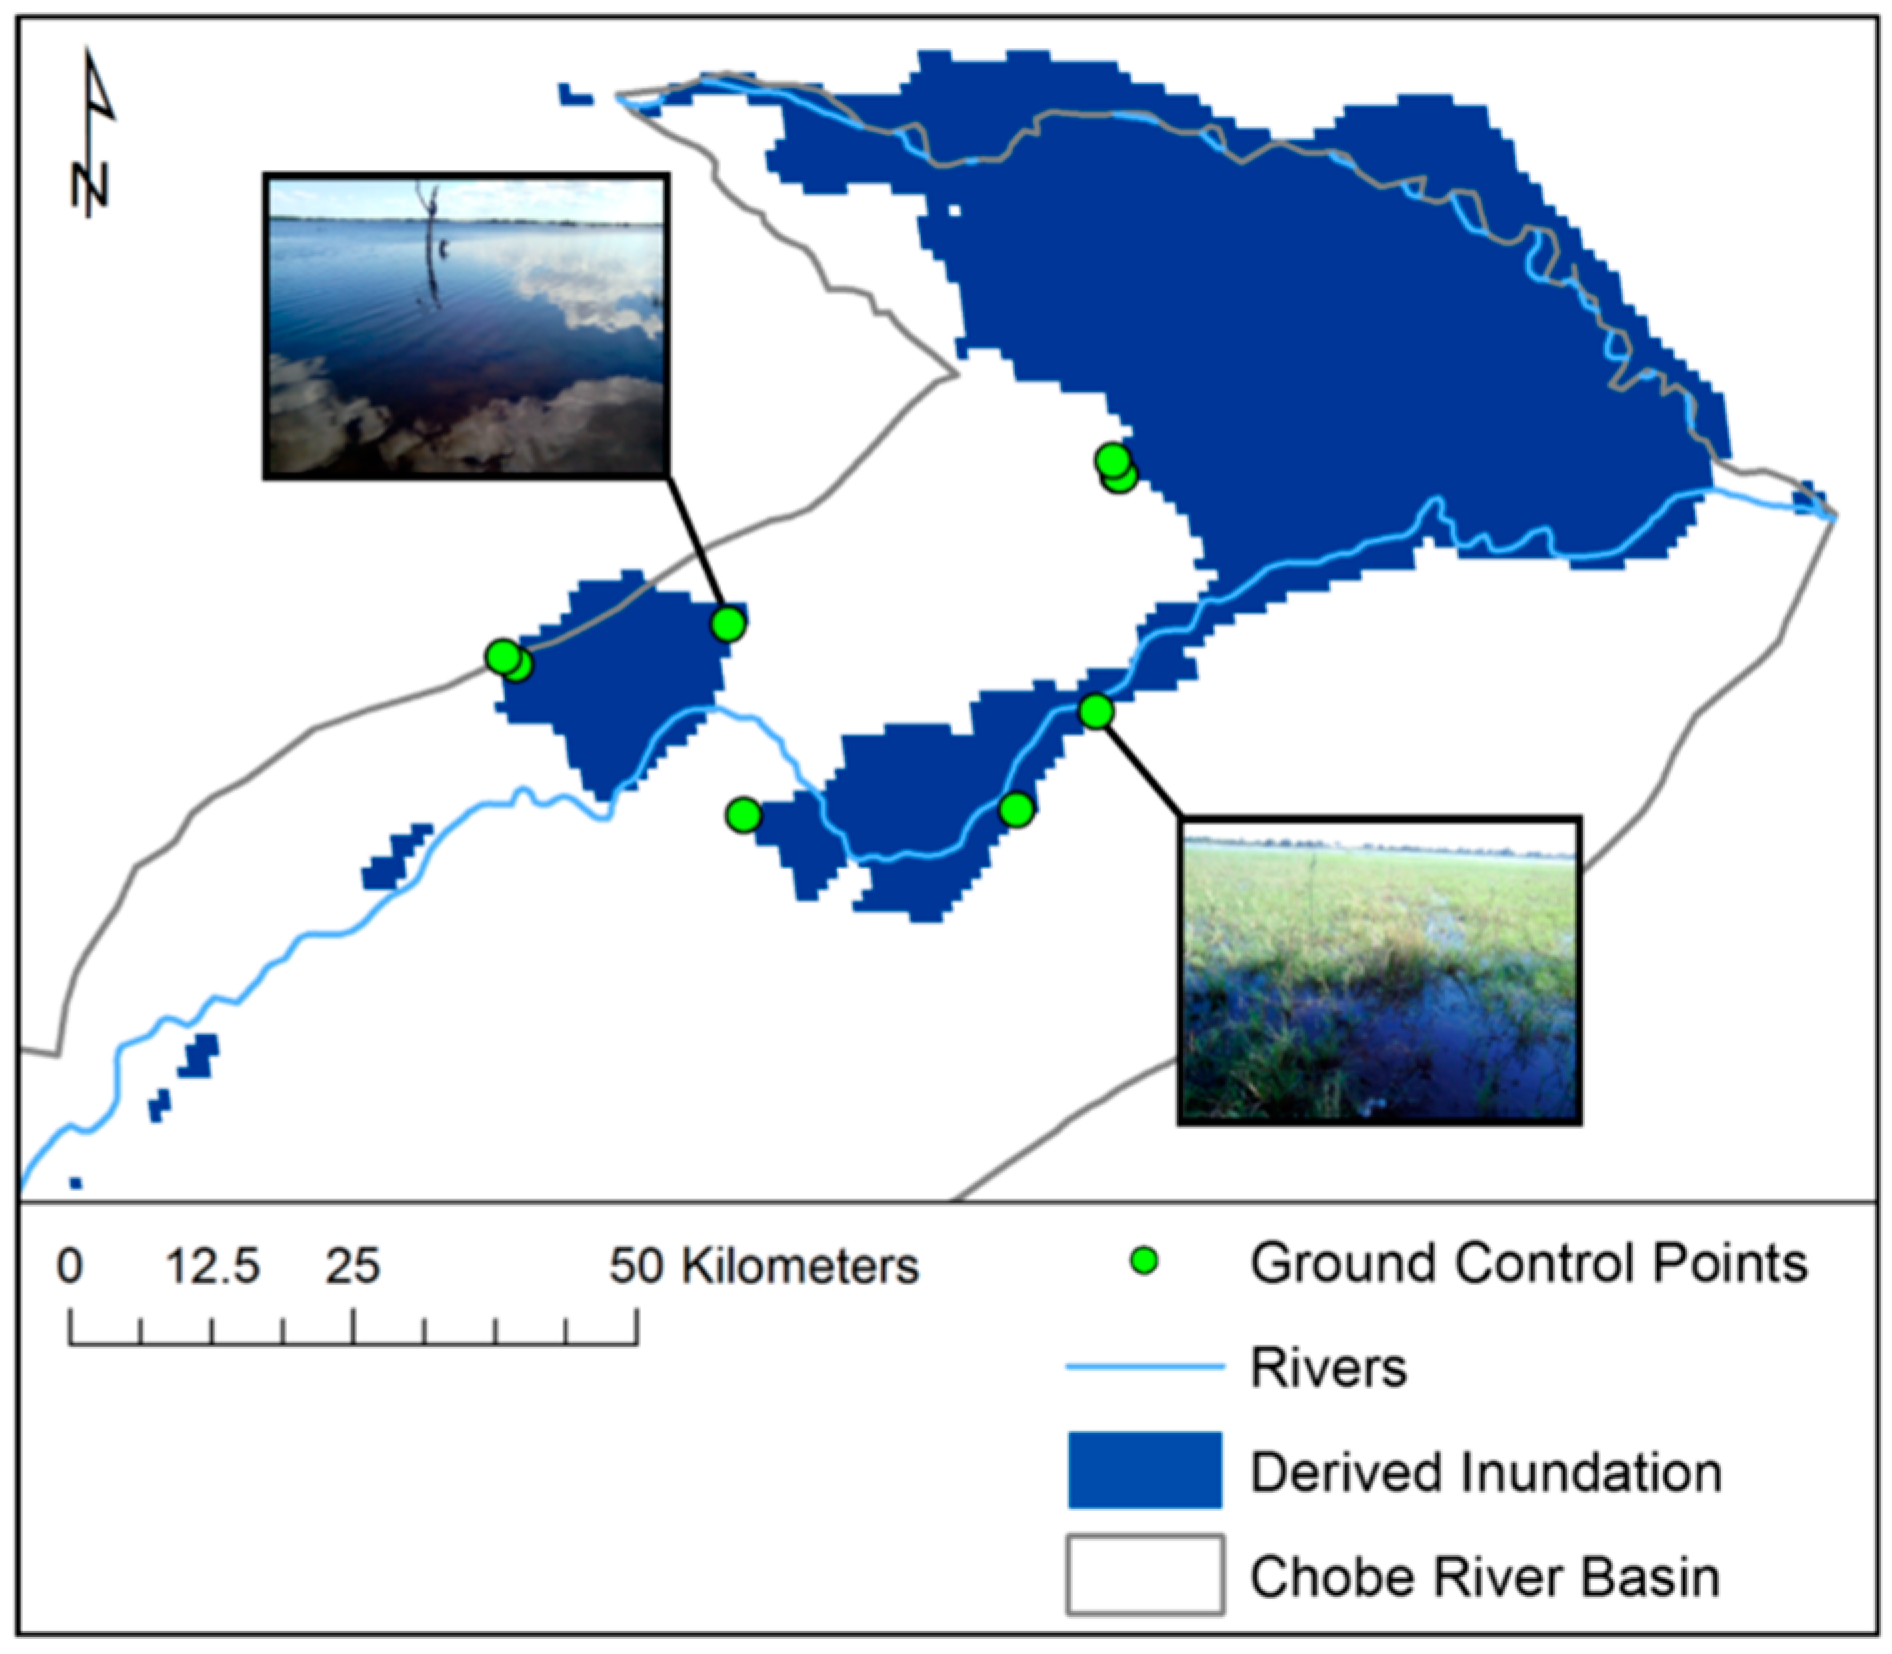
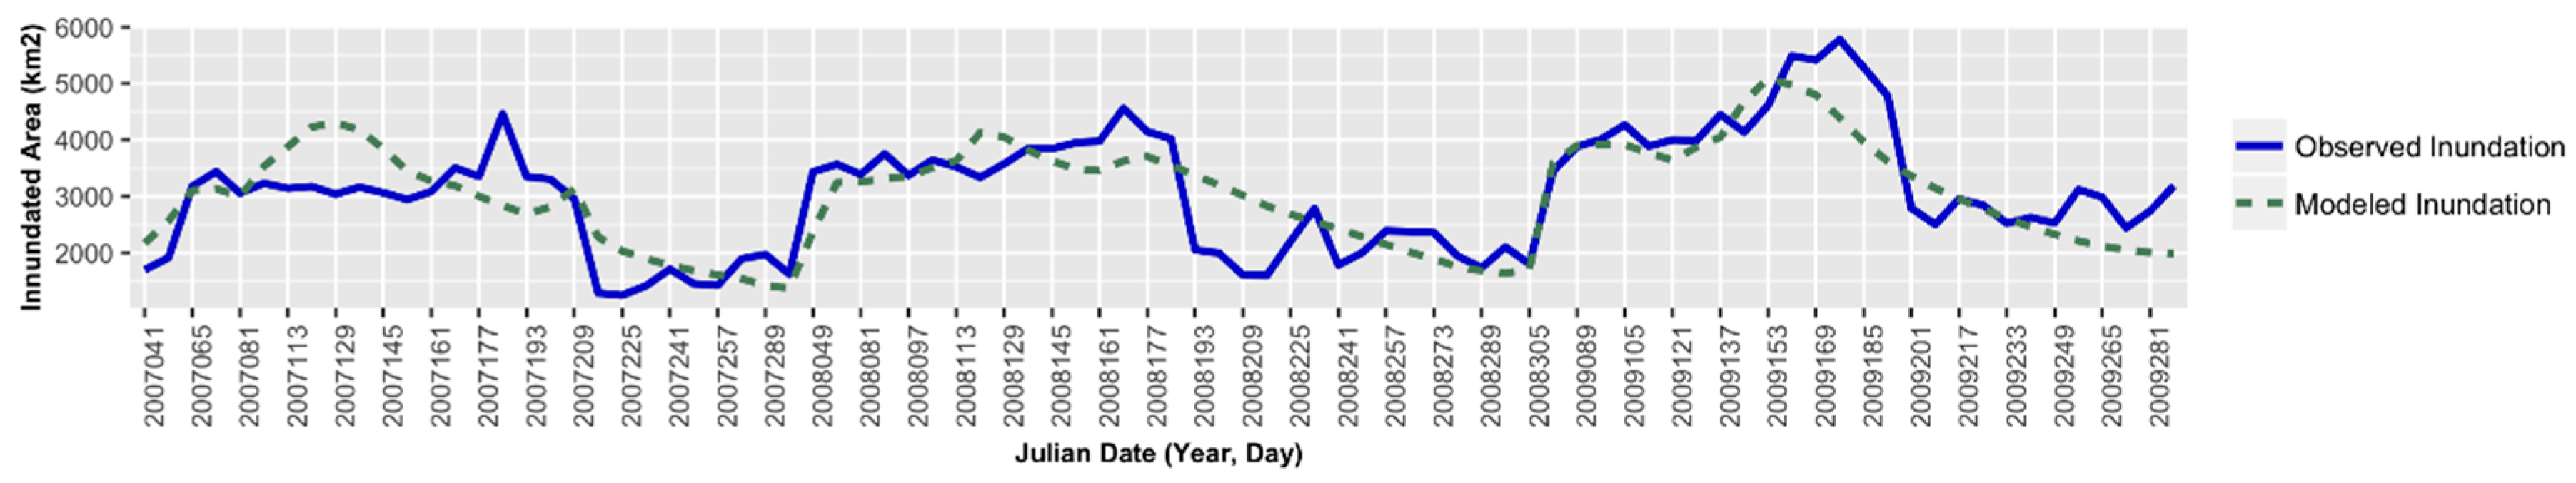
2.3.3. Inundation Mapping Validation

The successful application of remote sensing techniques over large areas requires accurate ground truthing [40]. Field work was conducted in May and June of 2014 in Namibia and Botswana to obtain ground control points to validate the water signal obtained from MODIS LST images. The ground control points were collected using opportunistic sampling across the floodplain at all major access points along different types of roads and even boats. Standing water, sites with homogeneous vegetation and relative soil moisture data were collected to be used to train the signal obtained from the thermal imagery at the scale of this study area. Data collected at each site included topography, inundation, soil type, soil color, soil moisture and vegetation type. A total of 69 training samples were collected throughout the basin to validate the thresholding technique allowing us to create classes of inundation frequency. The derived inundation extents are compared with these training samples in the results section.

2.3.4. Regression Analysis of Flood, Discharge and Precipitation Patterns

Regression models are often used to relate hydrological response to different catchment descriptors that are the drivers of flooding in a given region [41]. To understand the lag between discharge in the Zambezi and Kwando rivers and the resulting flooding extent, the daily discharge data (m3/s) was lagged back in 9 (8-day) time steps. The lag was set at 8-day intervals to correspond to the 8-Day MODIS LST data that was used to derive flooded area. To determine which variables were the most influential on the flooding extent in the CRB, general linear models were fit using a stepwise procedure. The region was subdivided into six sub-regions (Figure 5) to enable the independent analysis of the different hydrologic features within the basin. The derived flooded area for each of the sub-regions was used as the dependent variable and the lagged discharge of the Zambezi and Kwando rivers as the independent variables. To determine what the best predictor of the discharge of the Zambezi River, monthly precipitation data for the surrounding watershed was lagged back in three (one month) time steps. This type of modeling also defines relationships between the different independent variables.
Model selection for general linear models was conducted using the GLMSELECT procedure, SAS Version 9.3. The stepwise selection method was utilized, which adds parameters one at a time, and checks the current parameter set for any to remove at each step [42]. The model first fits an intercept value to the data, followed by the variable with lowest p-value. The method continues adding variables in this fashion; however, for each addition it then performs a backward elimination to determine if any remaining explanatory variables should be removed from the model. Thus, the method endeavors to choose the best predictors.

2.3.5. At-Risk Population Analysis

By considering the relationship between the timing, quantity and influence of the discharge of the rivers that feed the Chobe and the resulting inundation extent in the CRB, areas in the region that are at the highest risk of being exposed to high magnitude flooding can be identified. Two time-steps of the gridded population datasets for Namibia only, one from 2000 and one from 2011 based on the Namibia 2010 census, were used to identify population epicenters that are located within high frequency flood areas. The population dataset for Botswana was not included because of the scarcity of data surrounding the CRB. The two population time steps were used to locate regions that experienced the greatest change in population to determine if these areas correlate to regions of high frequency flooding. Once the regions of high population density were identified, they were combined with inundation duration maps representing years of high magnitude flooding, low magnitude flooding and the cumulative inundation map containing all years of this study to identify areas in this region most susceptible to high magnitude flooding and observe how the number of people impacted changes depending on the scale of flooding.

3. Results

The results of the work outlined above are presented in this section, which is composed of four sub-sections. First, the inter-annual spatial extent of duration of inundation in the CRB for the period 2000–2013 is shown with derived flood inundation duration maps. Then, the results of the MODIS LST and hydrological analyses are discussed, including major floods and dry years as well as controls of the major subsystems. Third, the results of the predictive regression models are discussed. Lastly, at-risk population centers are identified using models of low and high magnitude flooding.

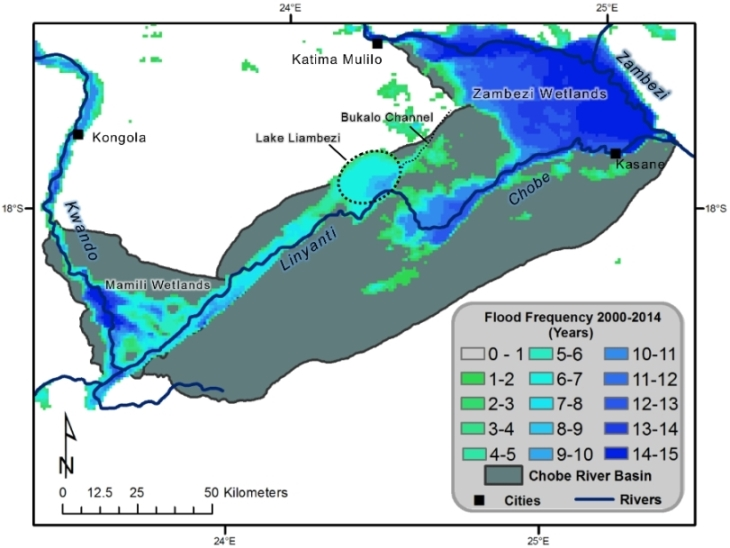
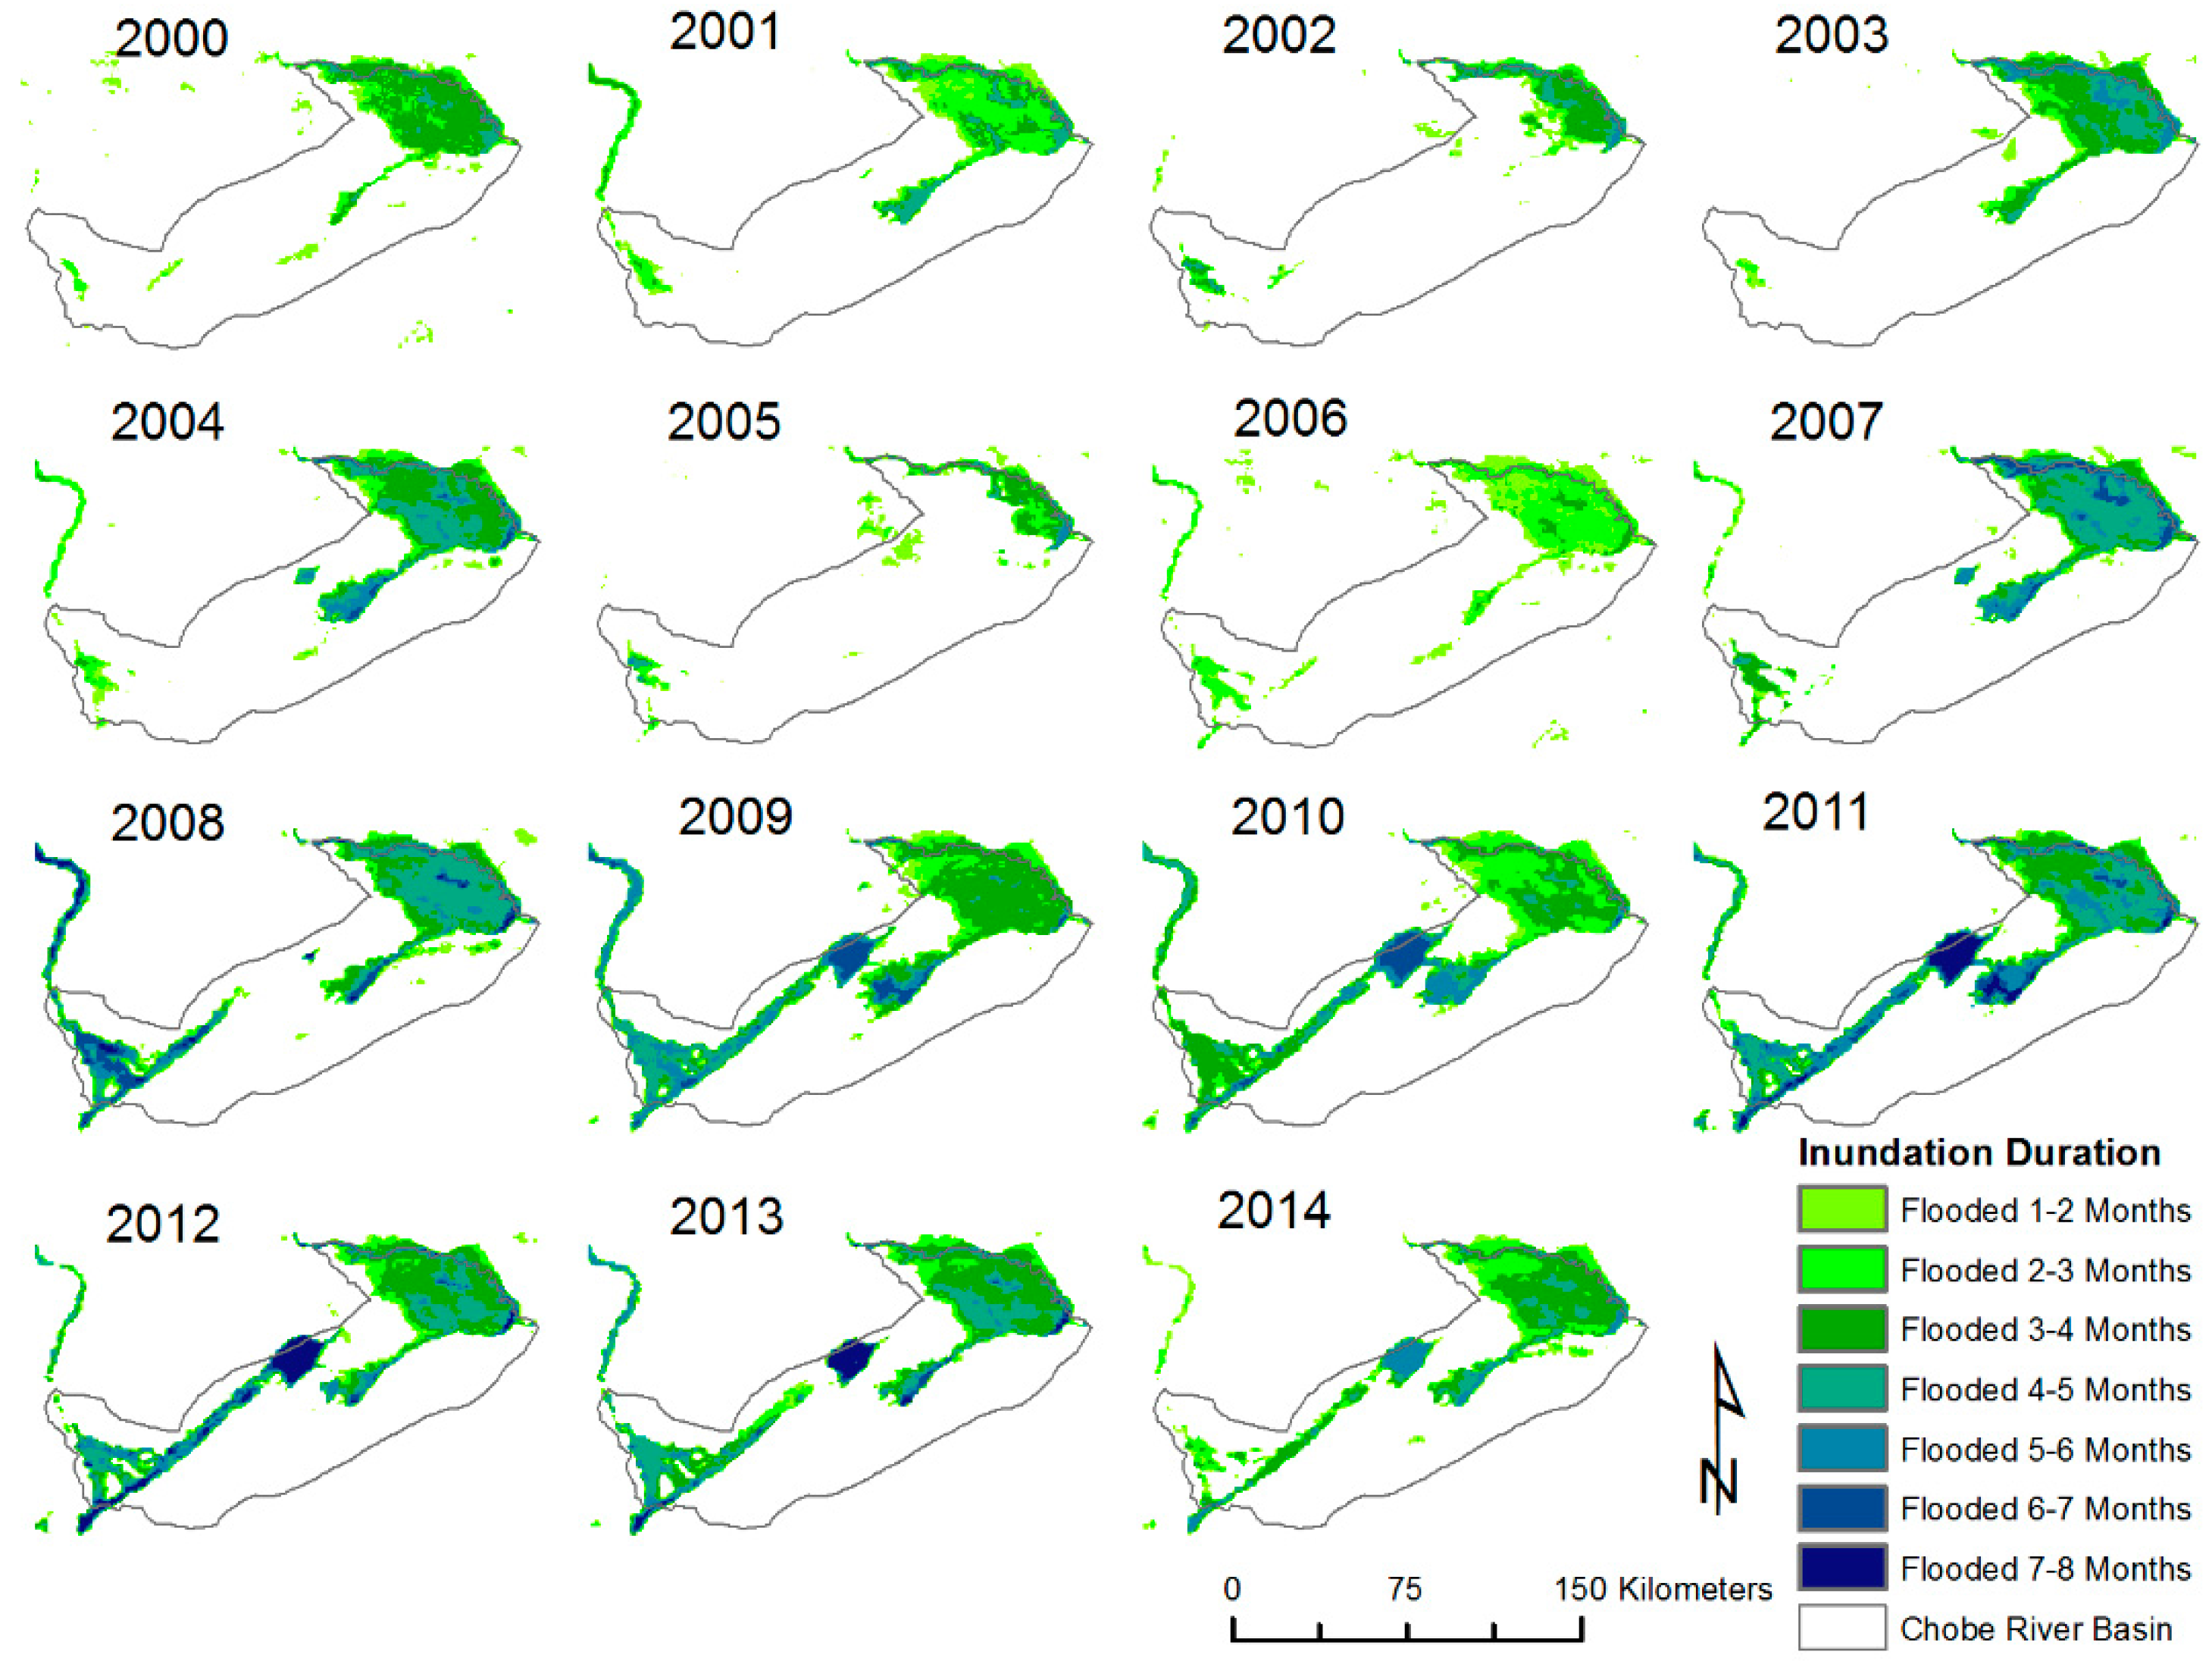
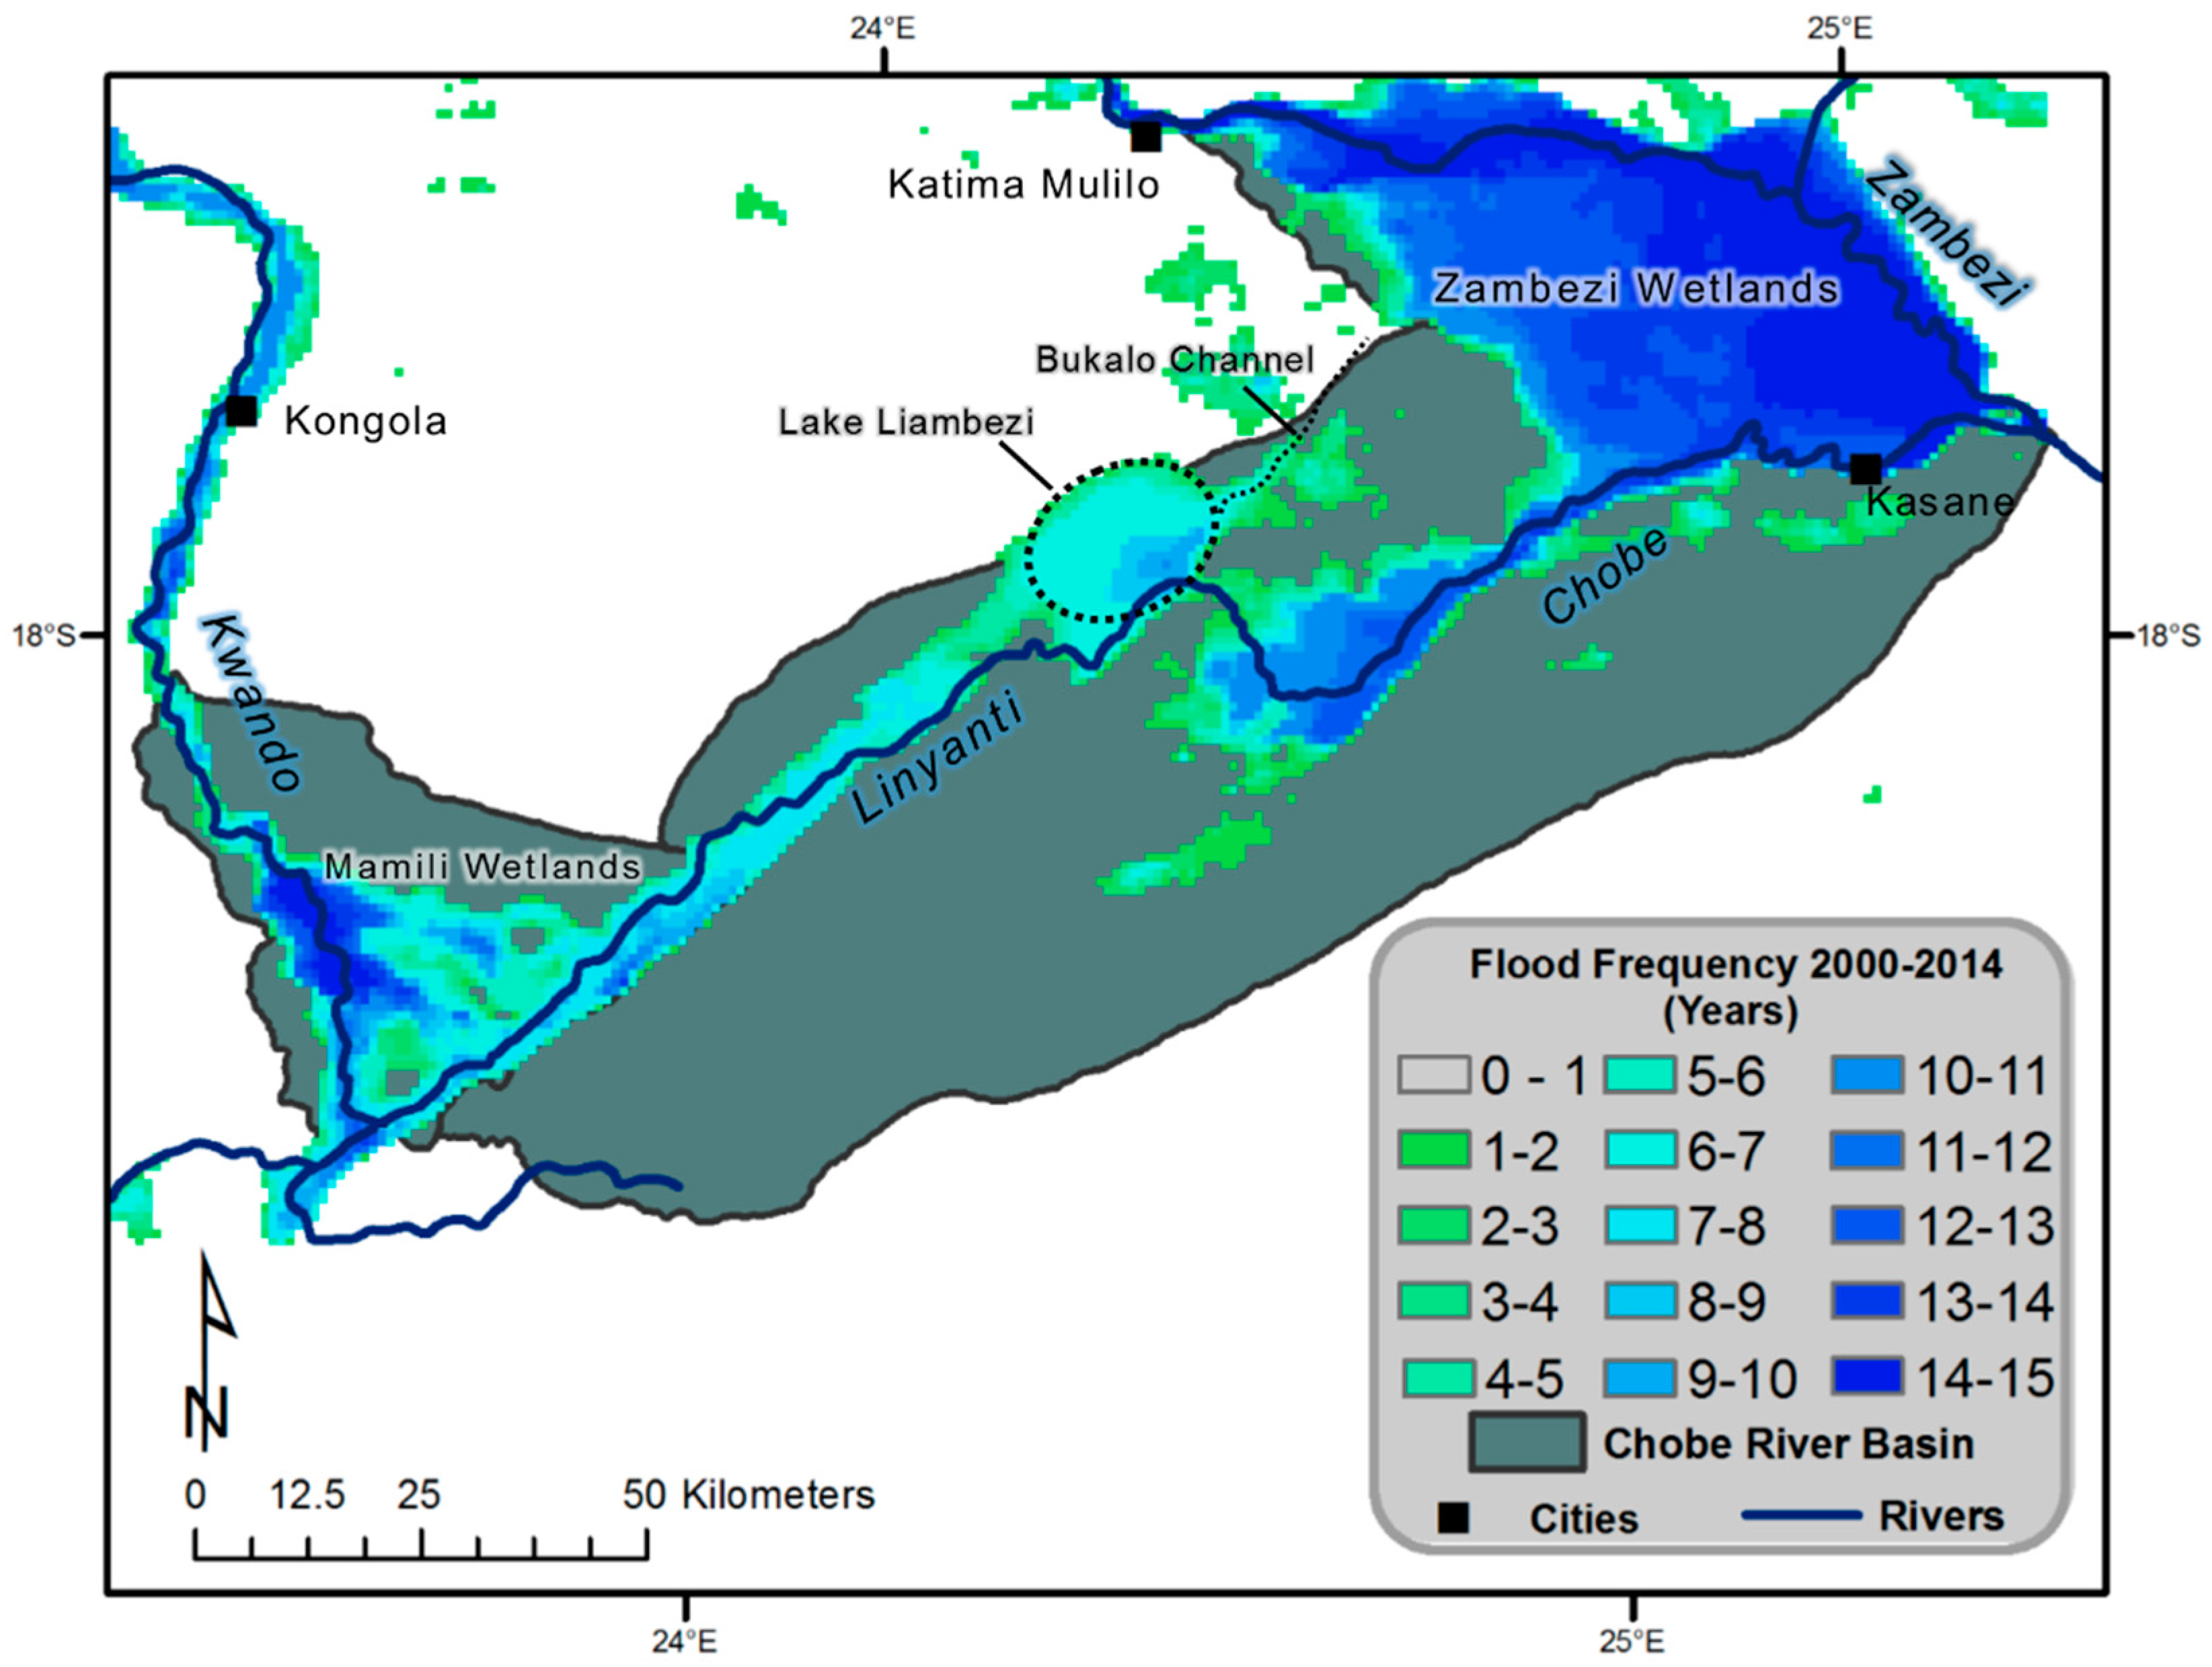
3.1. Regional Inundation Duration

Figure 6 shows the inter-annual spatial extent and duration of inundation in the CRB for the period 2000–2014 from March to November of each year. Even in years of low flooding, surface water remains in topographic depressions along the main channel of the Chobe and regions of the Zambezi and Mamili wetlands for as long as four months. Communities of the region tend to cluster around these semi-permanent water bodies, as will be discussed in Section 3.5. Temporal changes in inundation duration are reflective of the changes in annual discharge and precipitation. Long-term water bodies were identified in Lake Liambezi, portions of the northeastern Zambezi wetlands before reaching the bottleneck in Zambezi East as well as along the ridge of the Chobe River. The number of images included in each year’s flood frequency map varied depending on the amount of viable images, averaging at 26 images per year.
As shown in Figure 6, the years of low flooding include 2002, 2005, and 2006, all of which are relatively early in the study period. In more recent years, the duration and extent of flooding have increased dramatically, especially from 2009 to 2012. Areas within the landscape that remain inundated for the longest measured time (7–8 months) include Lake Liambezi in 2011–2013, as well as portions in the Mamili Wetlands and Linyanti channel. The average annual maximum flood for the period 2000–2014 covered 4097 km2 of land in the CRB. Figure 7 shows how the consecutive years varied from this average.

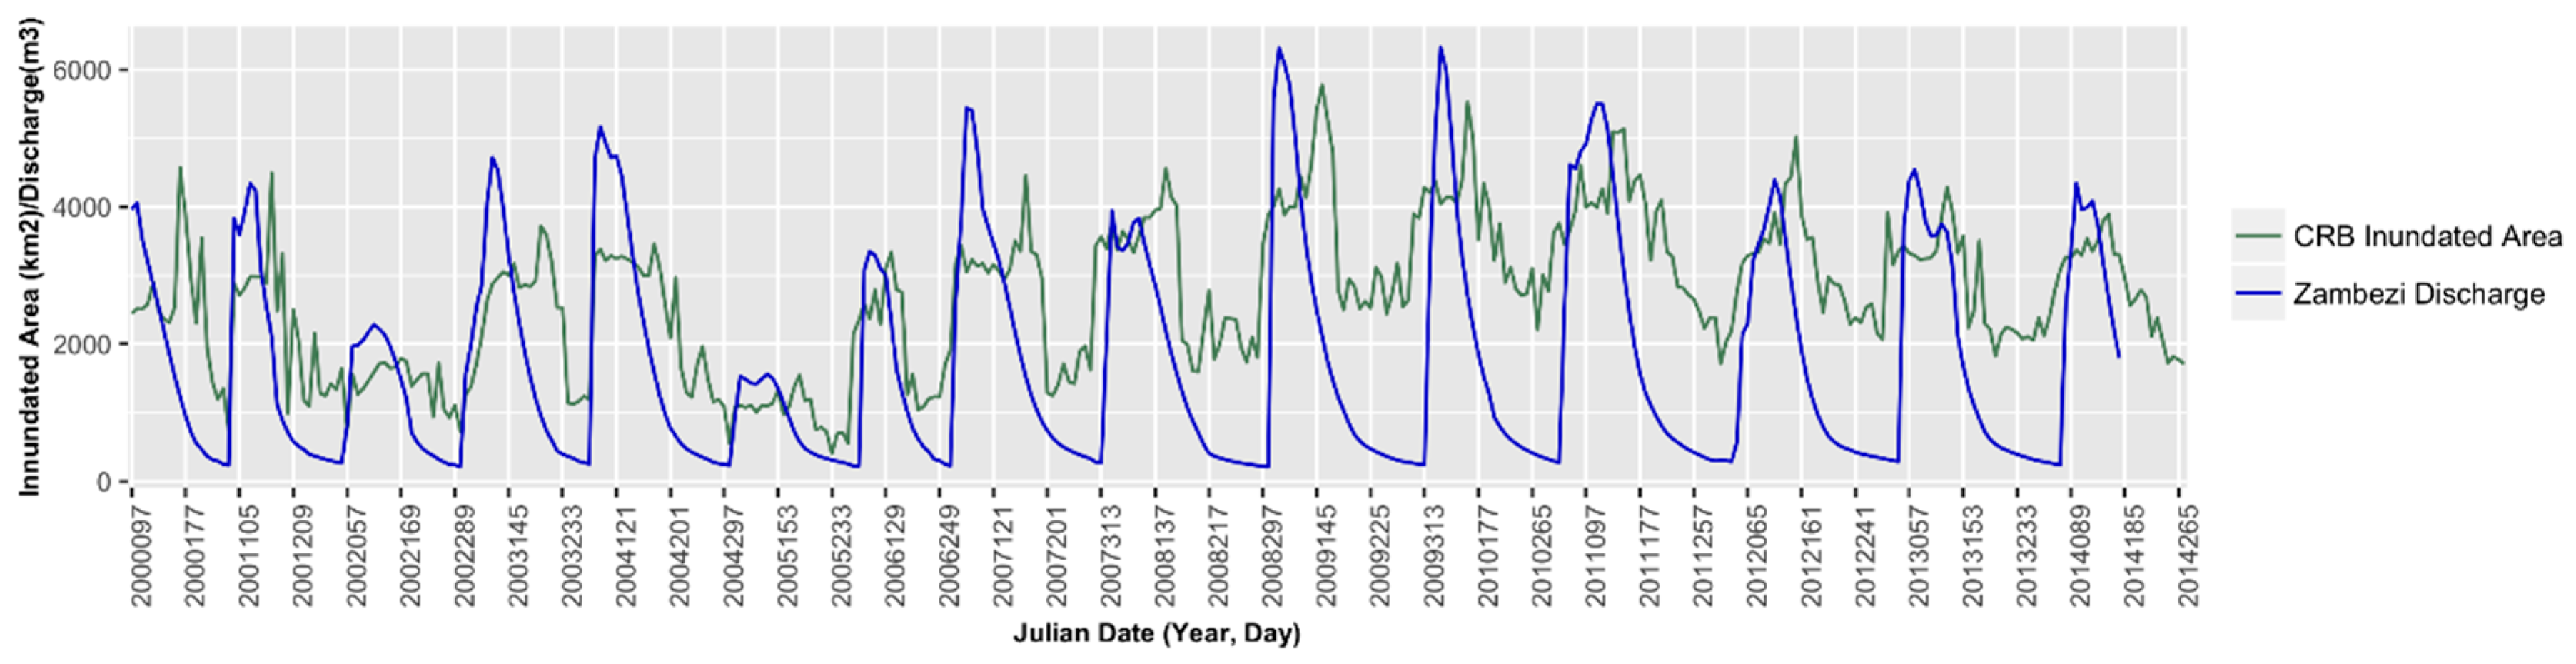
3.2. Inundation Duration 2000–2014

The inundation duration maps for each individual year were combined to identify regions in CRB that have experienced the most inundation over the past 15 years (Figure 8). Depressions in the Zambezi east and along the Zambezi and Chobe channels consistently retain surface water. The portion of the Zambezi wetlands adjacent to Kasane tends to maintain floodwater for much of the year. Other areas in the landscape that are often inundated for extended periods of time include Lake Liambezi and regions of the Mamili wetlands.
For verification of derived flooding extent using the LST methodology, ground control points collected in the field were visually compared with the derived flooding extent on 10 June 2014 (Julian Date 2014161) (Figure 9). The furthest flooding extents marked in the field were located within 1 pixel distance (approximately 1 km) from the extents derived with the MODIS imagery. The boundaries of Lake Liambezi and the Chobe Floodplain were especially well correlated, probably due to the large amount surface water present while in the field.

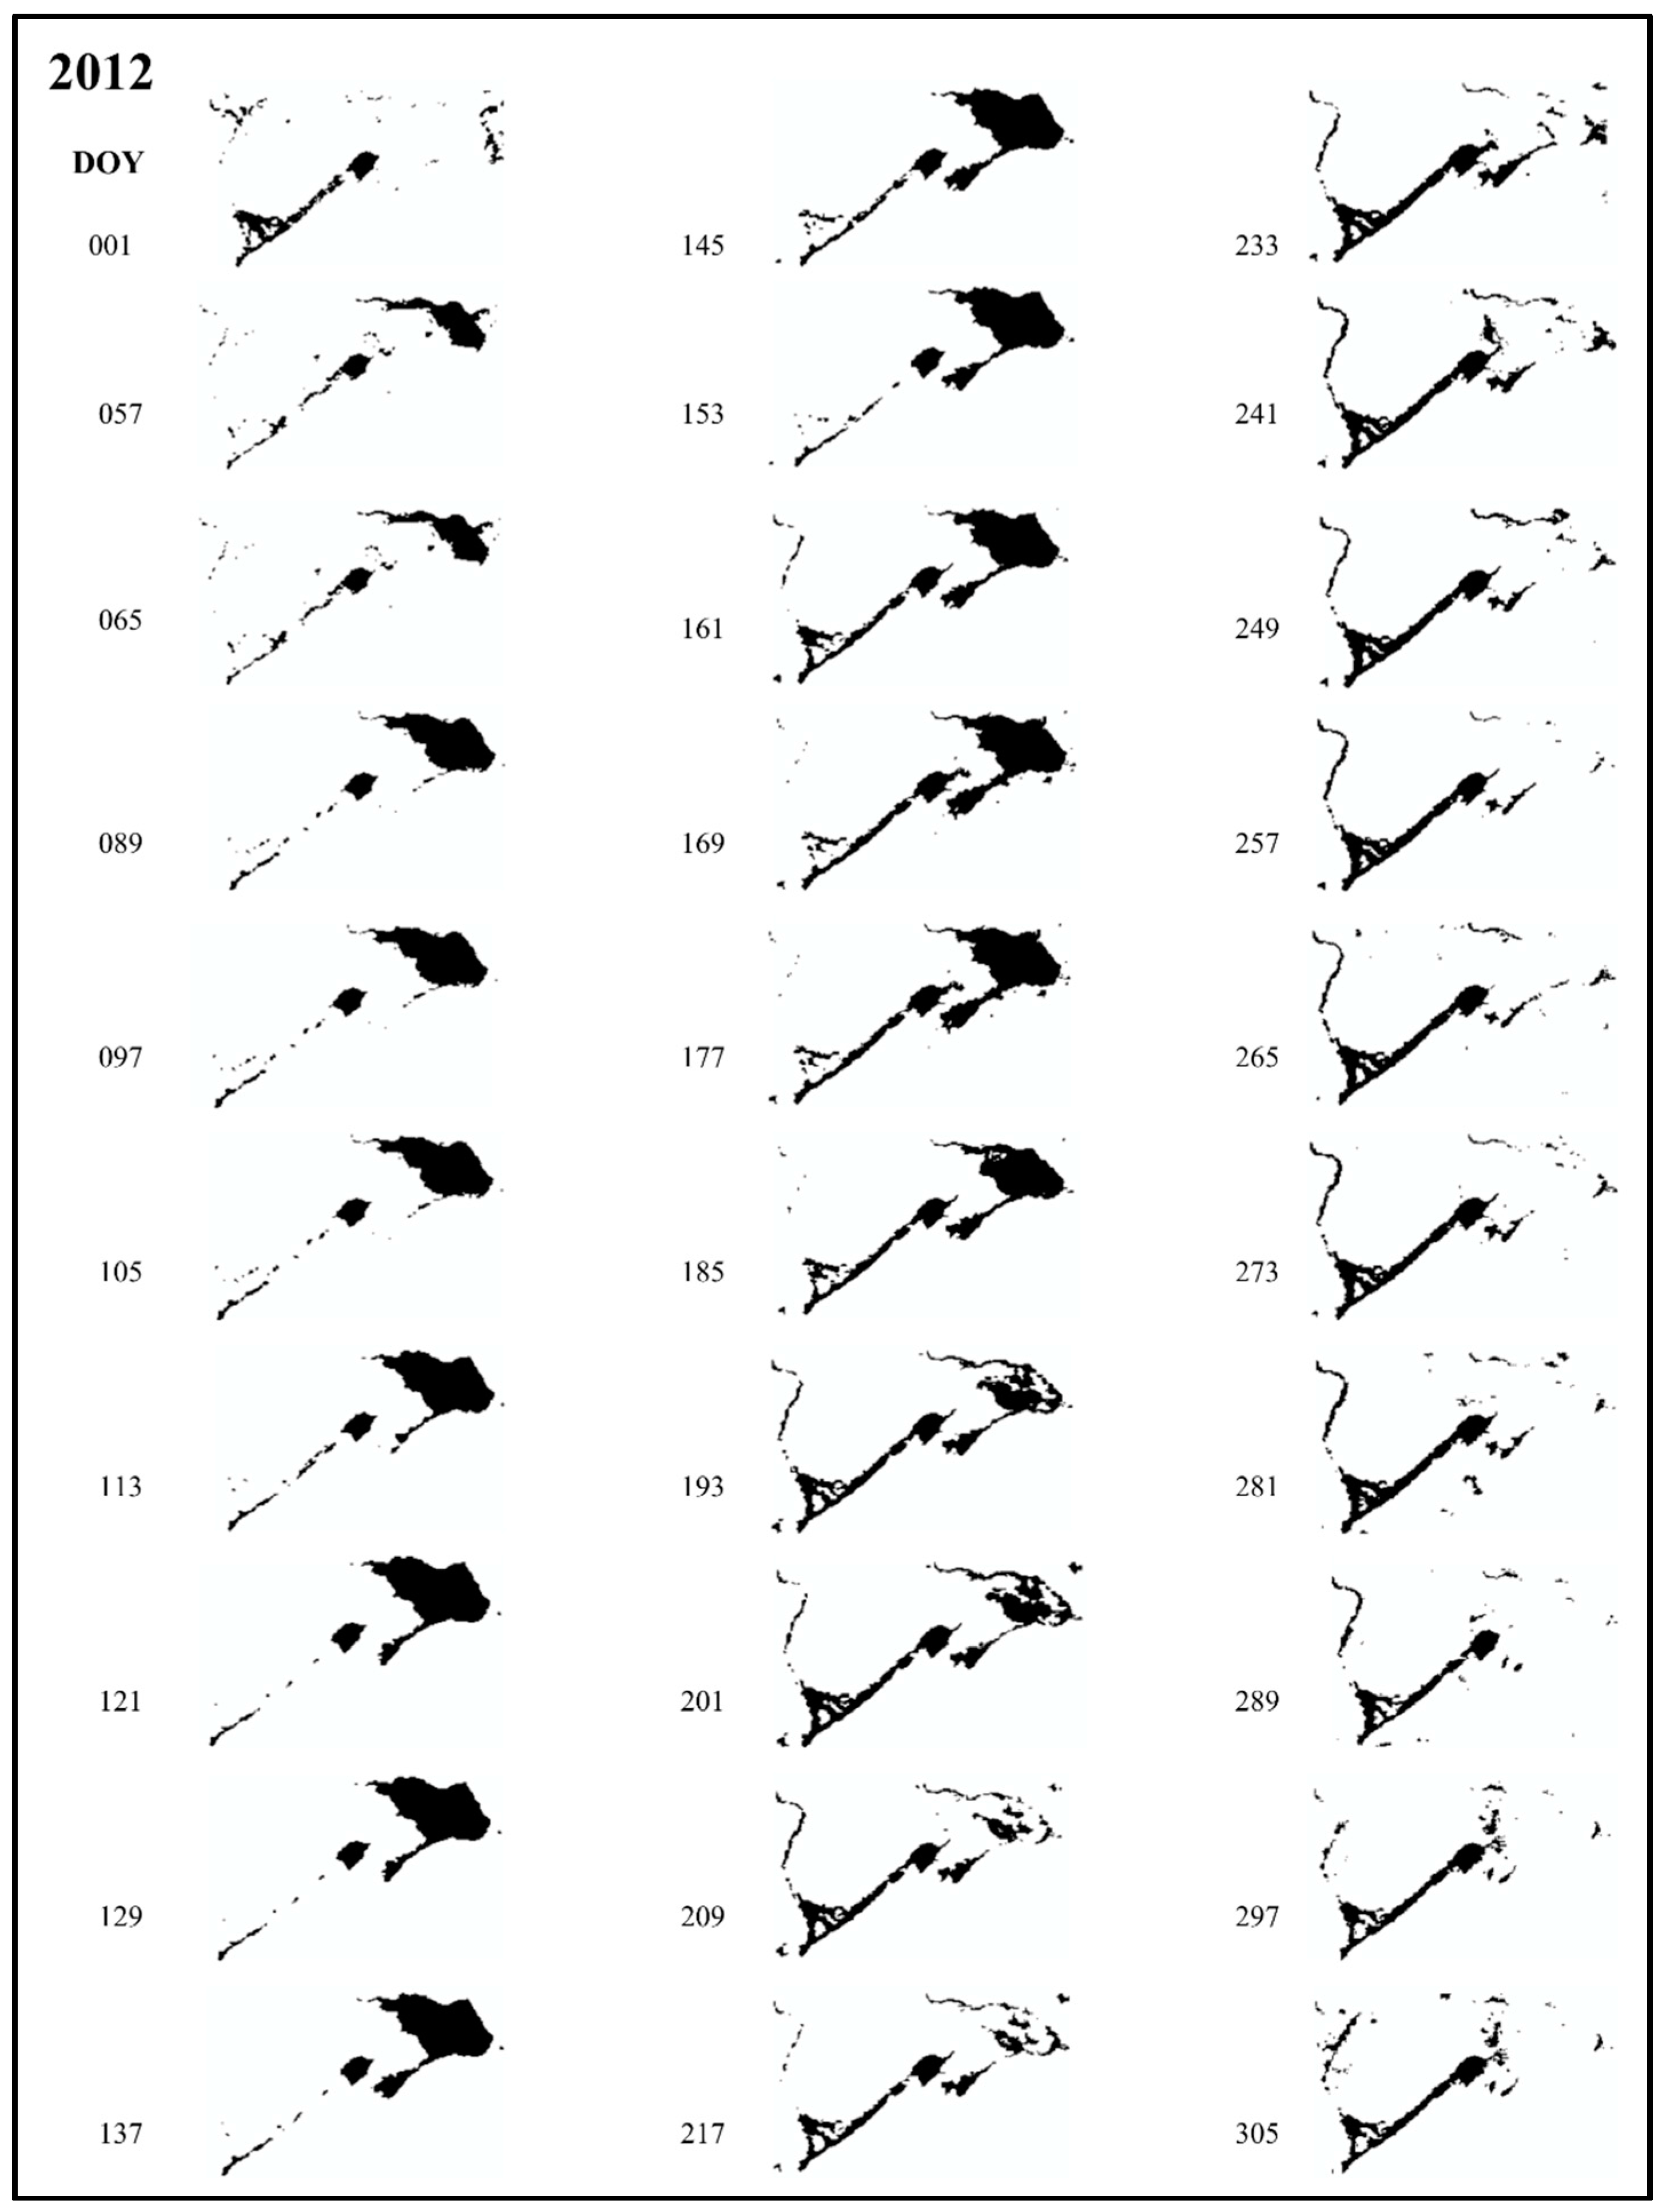
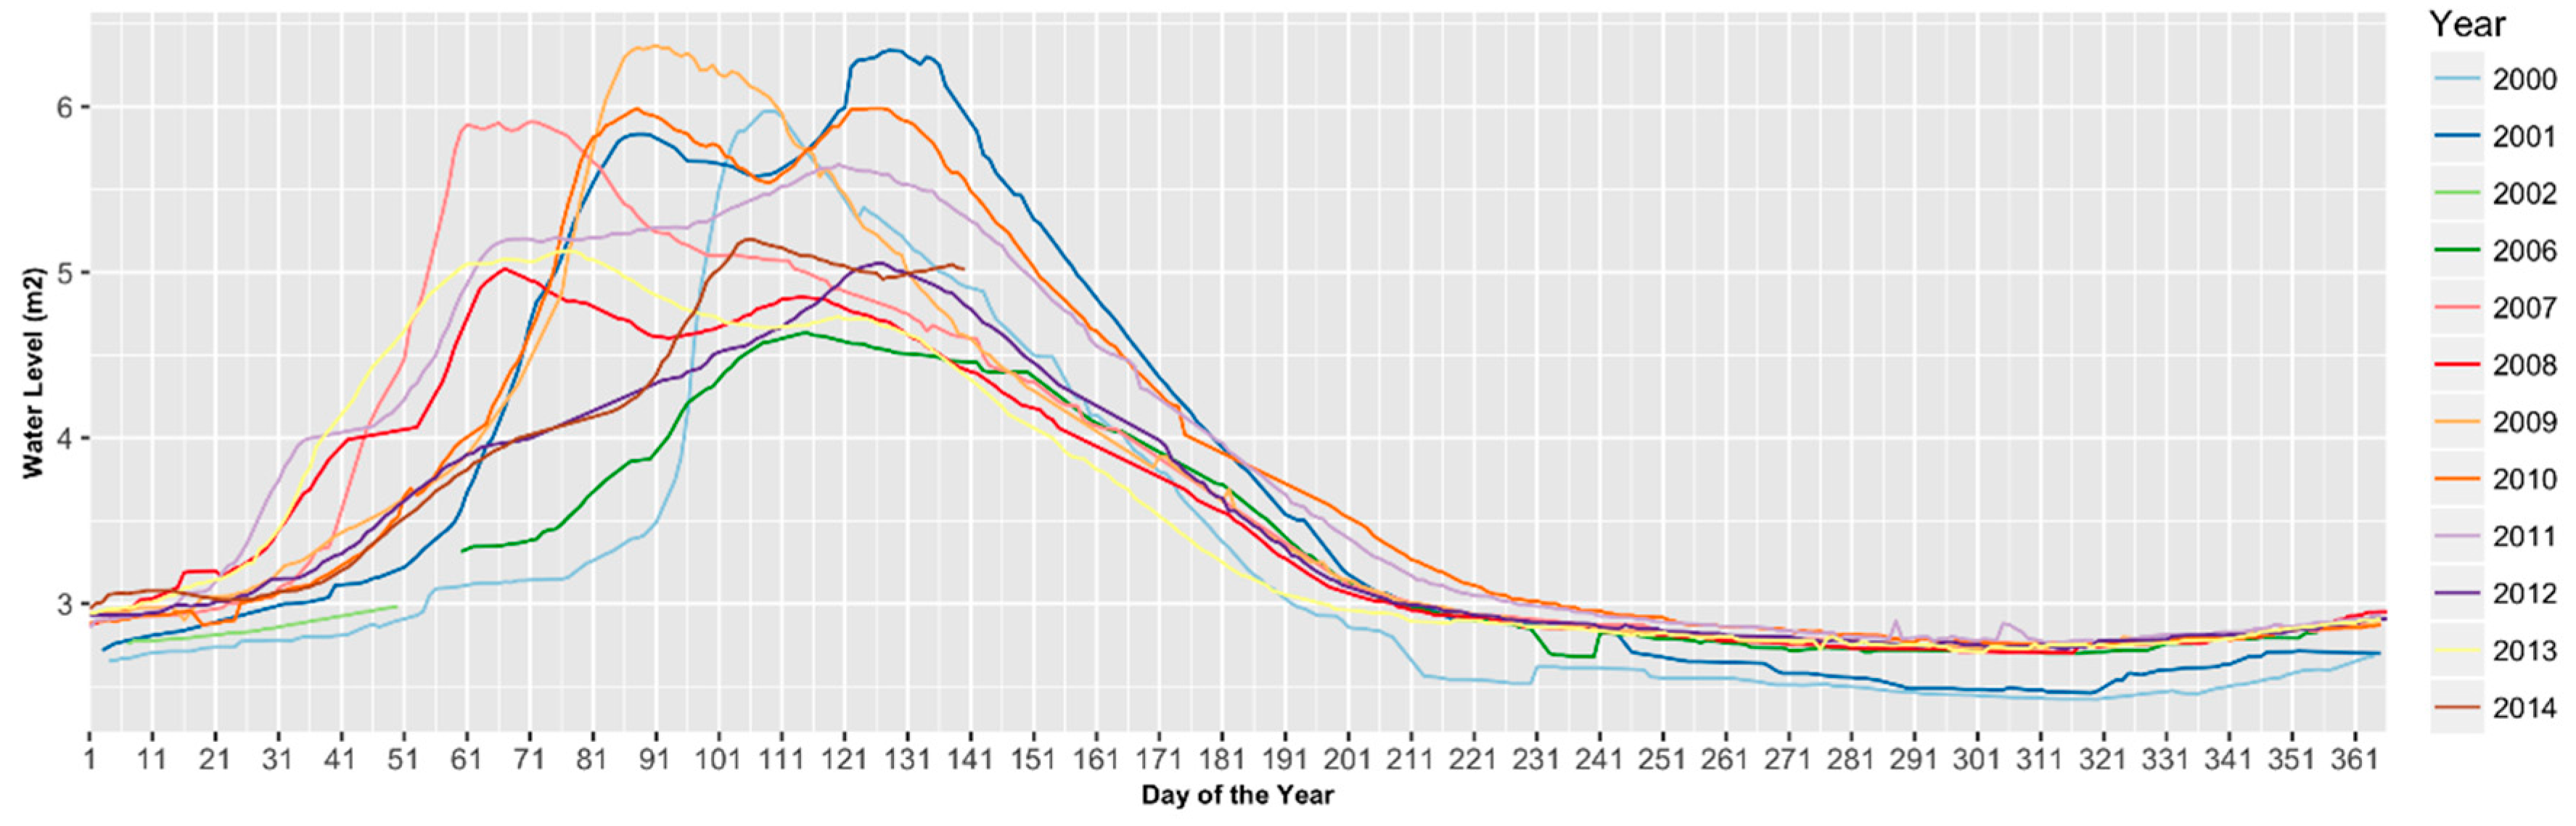
3.3. Typical Seasonal Inundation Dynamics

The MODIS LST imagery provided a way to observe the mechanism in which flood water moves through the interrelated sub-regions in this unique landscape each year. Figure 10 shows thirty time-steps from 2012, chosen due to the higher duration of inundation relative to years at the beginning of the time series, the large area that was flooded and the number of viable images from this year. The annual flood pulse from the Zambezi can first be seen entering the Zambezi wetlands at the end of February after passing Katima Mulilo (Day 57). The water moves south-eastward, spreading through the Zambezi wetlands until it reaches a bottleneck at Impalila Island where it is forced back. The Zambezi wetlands reach peak inundation within a week of maximum discharge of the Zambezi at the Katima Station. After the Zambezi wetlands are fully inundated, floodwater is pushed from the Zambezi east, first through the Bukalo channel, and then down the Chobe, usually around the beginning of March. Floodwater then continues to spill over the Chobe floodplain throughout March and April (Day 60–120), depending on the continued discharge of the Zambezi. A smaller flood pulse arrives later in the wet season (~Day 161) from the Kwando, which enters the CRB in the Mamili wetlands. Water can be seen moving down the channel of the Chobe River by the end of March (~Day 88). Years that are subsequent to wet years, such as 2012, often retain water from the previous year on the landscape in places like Lake Liambezi. The Mamili wetlands remained slightly flooded in the beginning of 2012 because of the large flood events in 2011. The second flood pulse from the Kwando can be seen arriving in mid-June (Day 161) of 2012 pushing flood water northeast up the Linyanti channel where it connects with Lake Liambezi. If the pulse of water in a given year is of a large enough quantity, it begins to be pushed northeast through the Linyanti channel, eventually meeting Lake Liambezi. When flows from both rivers are high enough, the Chobe floodplain and Lake Liambezi become connected via the Savute channel. The area of inundation abruptly falls in the Zambezi wetlands between July and August, around 3 or 4 months after the second peak flow event of the Zambezi.
The direction of water flow in the Chobe River is controlled by the depth of water and flow rates in the channel. The bankfull level of the Chobe River is 5.35 m. According to the field hydrologist from the Department of Water Affairs in Kasane, when the stage is above around 5.3 m, water from the Chobe begins flowing west towards Lake Liambezi via the Savute channel [43]. As the flood water recedes and the stage level of the Chobe River drops below 4.5 m, water begins to once more flow forward towards the Zambezi River confluence just east of Kasane. Between 2000 and 2014, there is a clear contrast in the timing of peak stage of the Chobe that ranges from 1 March–17 May. In some years, such as 2001 and 2008, the stage of the Chobe peaked twice (Figure 11). Although the timing of peak stage was different for all of the years, all began to decrease at the same time at a very similar rate suggesting a reduction in the amount of water moving through the system by that time since we’re entering the dry season and the supply from the north is stalled. Stage peaked relatively early in 2007 and 2013 in the beginning of March corresponding to an early arrival of peak discharge of the Zambezi for these years (Section 4). The early arrival of Zambezi discharge in 2007 caused the Zambezi wetlands and Chobe Floodplain to be significantly inundated by the beginning of March (Day 65).
The majority of the landscape that becomes inundated annually retains surface water for less than four months of the year. The furthest extent of the flood water Zambezi wetlands is sometimes only present for two to three weeks before quickly receding. The same topographic depressions called milapos where water remains for 3–5 months per year, discussed by Pricope [9] were noted throughout the Zambezi, Chobe and Mamili wetlands. Milapos are highly fertile depressions that are commonly used for flood- recession agriculture.

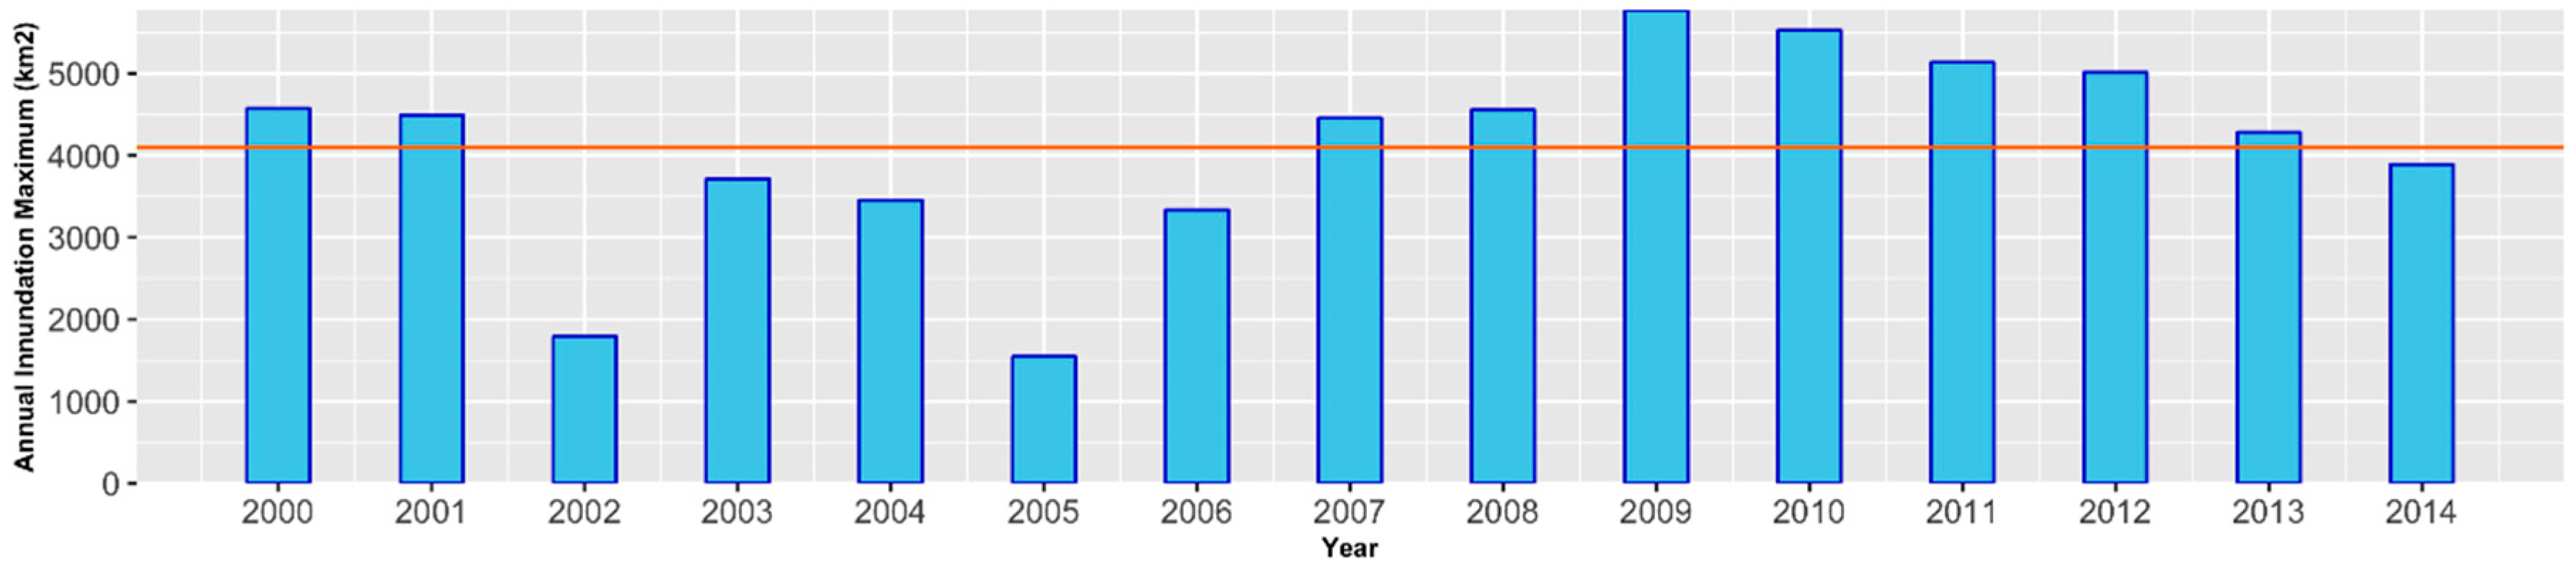
3.4. Regression Analysis of Flood and Precipitation Patterns

Chobe River Basin Statistics

A stepwise regression was constructed with the flooding extent of the Chobe River Basin as the dependent variable and the lagged discharge of the Zambezi and Kwando Rivers as the predictor variables. The stepwise selection method was used which switches between adding and deleting parameters one at a time [42]. The best predictor of flooding was chosen based on the standardized estimate, which standardizes the independent variables to have a variance of one and compares the effects of potential predictors within a model. The GLMSELECT procedure in SAS was utilized to implement the stepwise regression analysis. The regression determination yielded the following equation where Zi and Ki are the observed discharge of the Zambezi and Kwando Rivers respectively at the i-th time step:
F l o o d e d   a r e a   i n   C R B   = 518.575   +   0.318 Z 1 +   0.369 Z 9 +   15.744 K 1
Based on the standardized estimates of the variables, the stepwise regression determined that the most influential variable on flooding in the Chobe River Basin is the discharge of the Zambezi River 64 days prior to observed flooding followed by the discharge of the Zambezi 8 days prior. The immediate flow of the Kwando also influences the extent of flooding in the CRB. All of the yielded predictors, based on a t-test with 178 degrees of freedom, are significant at 99% confidence. The correlation between the selected model of inundation in the CRB and lagged discharge values yielded an R2 of 0.658. When only the lagged discharge of the Zambezi is used in the model, the Zambezi discharge at the ninth time-step is identified as the best predictor again, but has a lower standardized estimate than when the lagged discharges of both rivers are used as variables.
The same statistical methodology was conducted to identify the best predictor of flooding in the sub-basins of the CRB. Regression analysis using lagged Zambezi and Kwando discharge with flooding area in the Chobe Floodplain Sub-basin yielded the following equation:
F l o o d e d   a r e a   i n   C h o b e   F l o o d p l a i n =   103.246 +   0.045 Z 3 +   0.064 Z 9 +   3.11 K 1
The selected model yielded an R2 value of 0.598, and all of the variables chosen to be in the model have p-values of <0.0001, based on a t-test with 175 degrees of freedom. The most influential predictor of flooding extent in the Chobe Floodplain is the discharge of the Zambezi River at the ninth time-step, or 64 days prior to flooding based on this variables standardized estimate (0.46).
M a m i l i   w e t l a n d s   f l o o d e d   a r e a =   179.467     0.086 Z 2   +   4.214 K 2   +   9.165 K 9
The selected model for inundation area in the Mamili wetlands identified the flow of the Kwando at the 9th time-step, or 64-days prior, as the most influential predictor based on its standardized estimate (0.57). The selected model yielded an R2 value of 0.862, with all variables in the model having p-values of <0.0001 based on a t-test with 175 degrees of freedom. Because of the known nature of this part of the system, the model for flooding in the Mamili wetlands was also run with only the flow of the Kwando as an independent variable and identified the same lag as the best predictor.
L i n y a n t i   f l o o d e d   a r e a =   82.766 0.013 Z 1   +   3.316 K 9
The selected model yielded an R2 value of 0.699, and all of the variables chosen to be in the model have p-values of <0.0001, based on a t-test with 176 degrees of freedom. The most influential predictor of flooding area in the Linyanti based on the standardized estimate (0.787) is the Kwando discharge at the 9th time-step, or 64 days prior. The predictive equation for flooding extent in the CRB was modeled and plotted against the observed flooding extent derived from the MODIS imagery (Figure 12). The model performed well with exception of the extreme peaks in observed inundation that occur during the wet season.

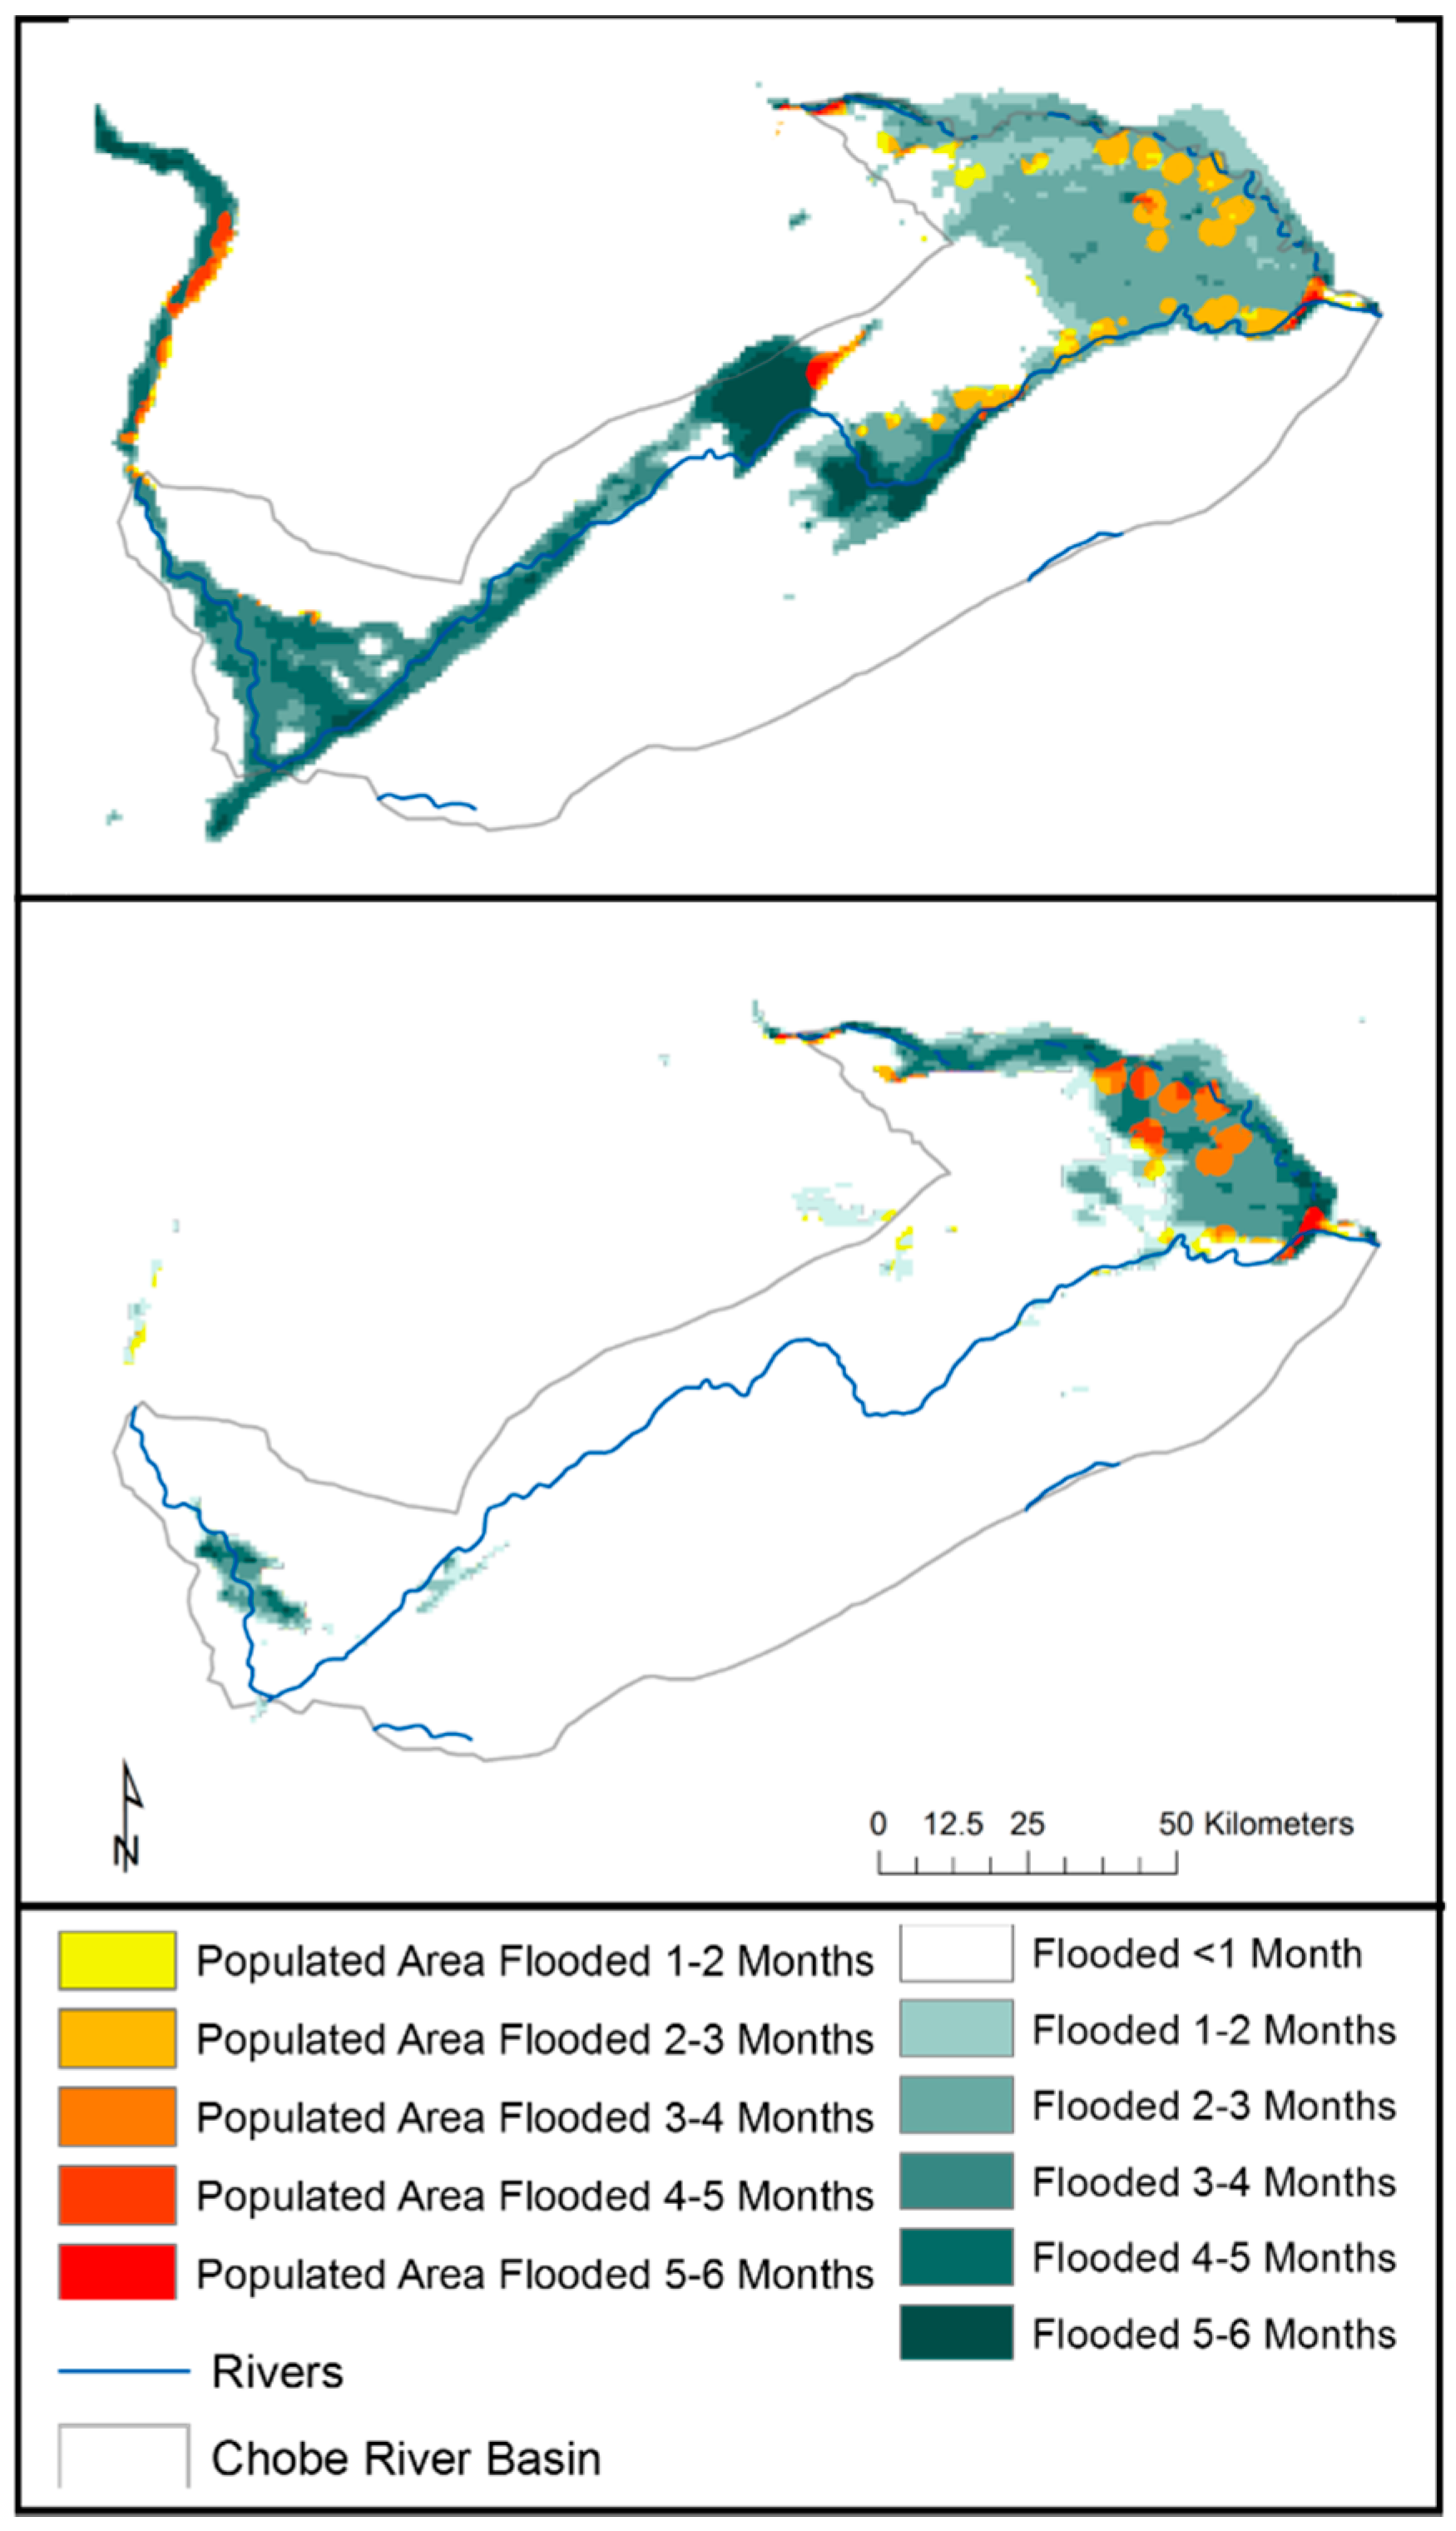
3.5. Population-Flood Risk Mapping

The population centers of this region are small and clustered around major town centers, such as Kasane, roadways and villages throughout the floodplains. The communities that reside in the floodplain usually live on termite mounds and small islands during the wet season. During the wet season, water level can rise up to 2 m on the floodplains, forcing communities to seek higher ground. In such a flat region, large termite mounds and small islands are their only options [26]. Based on the WorldPop dataset [44], there were approximately 90,000 people living in the CRB in 2011 (Figure 13). Many of these population epicenters are located within communal conservancies surrounding the Chobe River in Namibia such as the Lusese, Salambala, Kasika and Impalila Conservancies in the North East, centrally located Bamunu Conservancy and Shikhakhu, Dzoti, Wuparo and Balyerwa in the Mamili region. The communities are strategically located along the floodplains to utilize the natural resources and implement flood recession agriculture, but the high magnitude and unpredictable nature of the floods in recent years has put many people in the path of high magnitude flooding.
The inundation duration for 2002 was used as an example to examine how population centers are impacted during a year with low flooding spatial extent (Figure 14). Even in years that experience low flooding events, over 22,000 people are exposed to flooding for over a month in the Namibian floodplain of the CRB. Many communities in the Zambezi east are located in locations that receive significant amounts of annual flooding almost every year. To quantify the number of people living in flood zones during years of high flooding, the inundation duration index of 2009 was used (Figure 14). In a year of high magnitude flooding, such as 2009, approximately 53%, or 46,801 people were living in an area that was flooded for over a month a year. 22%, or 19,652 people are living in an area that will be inundated for more than three months of the year. Over 3000 of these people live in an area that was flooded for over six months in 2009. The high flood event of 2009 caused many communities in the Zambezi East, especially within the Impalila, Kabulabula and Kasika conservancies to be flooded for 3–6 months. The differences in these examples show how variable and unpredictable the extent and duration of flooding can be in this region. The high magnitude flood of 2009, although spatially affecting more of the region, left communities in the Zambezi East flooded for less time than the flooding in 2002.

4. Discussion

This study analyzed 15 years of flooding in the Chobe River Basin. The area of inundation throughout the Chobe River Basin exhibits extreme spatial and temporal variability and responds to external variables such as the relative discharge of the Kwando and Zambezi, which is controlled by regional precipitation. During interviews, many local officials stated that the floodwater comes from Angola. The lack of precipitation in the CRB during the flooding season supports this statement. The area of maximum flood varies greatly between years and there is a complex link between the different sub-basins of the CRB. The driest year in terms of both rainfall and inundation area was 2002. The highest observed discharge of the Zambezi River occurred on 22 March 2010 (Julian Date 2010081), followed by 25 March 2009 (Julian Date 2009084), corresponding to the highest observed maximum inundation areas in the CRB for the study period.
It has been suggested that the overall trend in flooding extent in the CRB has decreased between 1997 and 2010 [9]. The results of the analysis of annual inundation maximum for the time period of this study, which extends four years further, revealed a positive overall trend, indicating that the area inundated has generally increased since 2000. The positive trend captured in this time series was likely influenced by the high magnitude floods experienced in the CRB since 2009. As shown in Figure 7 the maximum inundation area for 2009–2012 was well above the long-term average of this study. The compiled MODIS images allow the creation of flood frequency maps to identify regions throughout the landscape that are flooded for extended periods of time. The highest annual inundation maximum was observed in 2009. Results from Long [10] noted the same increase in inundation between 2008 and 2009. The flood of 2009 caused an estimated $5,000,000 worth of damage to infrastructure in Zambia, destroyed roads and schools and destroyed crops [45]. Not only can floodwaters destroy homes and block main roads, they can also bring dangerous wildlife such as hippopotamuses and crocodiles into residential regions. The large flood of 2009 brought hippos and crocodiles 20 km further inland than usual, resulting in injuries and the death of villagers [24].
Flooding in this region is a building process that is controlled by multiple flood pulses received from the Kwando and Zambezi Rivers. It may also be impacted antecedent floodwater that can remain within major channels as well as Lake Liambezi previous flooding [9]. The antecedent effect can be observed in 2008 and 2012 when a relatively low discharge of the Zambezi resulted in high flooding extent in the CRB (Figure 15). The common consensus of locals is that the flooding in this region is controlled by the discharge of the Zambezi. Instead, this research indicates that after a year of moderate flooding, the high discharge of the Kwando River can amplify the impacts on the current year, resulting in major flooding that covers vast areas and connects the sub-basins. The predictive models of inundation determined by the GLMSelect procedure exhibit how the flooding in the region is not entirely controlled by one variable. The regression equation determined by Gumbricht et al. [46] to predict spatial extent of inundation in the Okavango delta also yielded multiple variables that strongly influence the resulting flooding extent. As determined by Gumbricht et al. [46], because evapotranspiration varies very little annually, including it the predictive model provides no improvement to the analysis.
The nature and strength of El Nino and La Nina govern precipitation patterns for the region, and therefore control the variation of flow in the Zambezi and Kwando, as well as inundation patterns [9]. For example, the low spatial extent of flooding in the CRB in 2002 and 2005 can be accredited to low precipitation totals in the Upper Zambezi sub-basin corresponding to the warm phase ENSO. The El Nino event of 2009/2010, however, brought above average rainfall conditions to the region that resulted in the high magnitude floods seen in this study, as well as by Long [10] (Southern Africa Special Report). Climate forecasts from the NOAA Climate Prediction Center (CPC) and the International Research Institute for Climate and Society (IRI) indicate an elevated chance for El Nino to continue through 2015 [47].
The timing of maximum inundation in the CRB is determined by the arrival of the flood pulses from the Zambezi and Kwando Rivers. The annual cyclic lag between peak discharge in the Zambezi and maximum flooding extent can be seen in Figure 15. The multiple regression model identified the discharge of the Zambezi 64 days prior as the best predictor of flooding throughout the CRB. The magnitude of flow in Zambezi also seems to impact the lag between peak discharge and peak flooded area in the following year. For example, the high discharge of the Zambezi in 2007 and 2010 both resulted in a long lag time between peak discharge and flooding area. The years following these high discharge events (2008 and 2011) however did not experience discharge as high as the previous year, but had much shorter lag times and resulted in a large area of inundation. The lags between peak discharge and flooded area in 2010 and 2011 were relatively rapid following the high discharge event of 2009. This shorter lag between peak discharge and peak inundation may be a result of the landscape still being flooded for the previous year. If the channels are already flooded, they will surpass bank full levels and water will enter the floodplains at a faster rate. It is logical that even in years with high discharge, there is still a significant lag between peak discharge and peak inundation in the floodplain. The water must first fill the channel before it flows over the banks and onto the floodplain. During years with high discharge (2009–2012), it is observed that the floodplains remain inundated for extended periods of time; long after the river discharge has peaked (Figure 15). Based on the ideas of Ogilvie et al. [48], the floodwater recedes from the floodplains at a slower rate than water within the channels because it is trapped in topographic depressions [48]. This can be observed in both the Zambezi and Chobe Rivers in respect to their corresponding floodplains. The stage of the Chobe River at Kasane typically returns to bank full level by mid-July (DOY 201) (Figure 11). Depending on the magnitude of the flooding, floodplains in this region may remain inundated for weeks following this decline in river level. Due to the lack of a complete discharge record for the Kwando River, we cannot make the same assumption for this region.
The Kwando/Chobe Sub-basin, which is usually the driest of the Upper Zambezi region, received a large amount of rainfall in January 2008 [30]. This spike in rainfall caused the discharge of the Kwando River to drastically increase, producing high amounts of flooding in the Mamili wetlands. The Kwando River, which normally peaks in May–June and quickly recedes, continued to rise resulting in the area surround the river to become swamps [49]. After being dry for many years, the large floods of 2008 marked the onset of increased water level of Lake Liambezi, which has drawn people from all over the region to its shores to utilize the fishing opportunities.
The benefits and economic opportunities associated with living on a seasonal floodplain draw populations closer to riverbanks, making them more susceptible to large flooding events. The high magnitude floods observed in recent years have caused the displacement of many communities in throughout the Zambezi basin. For example, the floods of the Zambezi in 2008 displaced 90,000 people in Mozambique [50]. In the CRB, the amount of people impacted by flooding each year can increase by more than 48% between years of low and high magnitude flooding. To local farmers and residents, rainfall in this region is unpredictable making it difficult to accurately determine when to plant their crops and almost every year, more people are forced to move because of flooding [29]. High magnitude floods force entire communities to leave their homes and relocate to drier ground. Resettlement has caused tension between conservancies and has forced communities to relocate.
Limitations of this study include the missing MODIS LST imagery throughout the rainy season and the missing years of discharge data for the Kwando River. The relatively coarse resolution of the MODIS dataset limits the detection of small bodies of water and stream channels.

5. Conclusions

Seasonal and interannual inundation patterns of the CRB were observed using 386 MODIS LST images for the period 2000 to 2014. Results show that the area of inundation in the CRB has varied from 401 km2 to 5779 km2 and has drastically increased since 2000 with a major rise in 2008 and 2009. The timing and magnitude of flooding in the CRB is influenced by multiple variables. To understand the relationship between relative discharge of the Zambezi and Kwando Rivers and inundation extent in the CRB, as well as sub-regions within the basin, a multiple regression was performed. The model determined that the flooding extent in the CRB can be best predicted by the discharge of the Zambezi River 64 days prior to flooding. This type of modelling has the potential to predict the extent of flooding weeks in advance, which could be invaluable to land use managers and resettlement planning. There are over 46,000 people in the Zambezi region living in areas at high risk of long-term flooding. The majority of these people are living in communities throughout the Zambezi wetlands and depend on the seasonal floods for flood recession, or molapo farming. This dependence, along with the economic opportunities that floods can provide, often make it difficult to convince communities to relocate. With large flood events becoming increasingly common and unpredictable, it is critical to quantify the drivers of flooding in this region and understand how they are changing. Understanding these changes and their implications in the Zambezi Region will aid in future regional adaptation and resettlement planning at the more local levels.

Acknowledgments

This research was supported by a Graduate Student Research Grant through The Geological Society of America, as well as the University of North Carolina Wilmington through Pricope’s Socio-Environmental Analysis Lab. We would like to thank Amelia C. Sosnowski for her contributions to portions of the methodology of this research, as well as her assistance with creating plots and editing of the paper. We would also like to thank The Department of Water Affairs in Kasane, Botswana, The Department of Water Affairs in Windhoek, Namibia, Ezekiel Motanyane, Elvis Simba Mwilima (MET), Janet Matota and Bennety Busihu (IRDNC), as well as Andrea Gaughan for her knowledge and assistance in the field. We appreciate the valuable and constructive comments of four anonymous reviewers.

Author Contributions

J.J.B. performed the analyses, designed portions of the analysis methodology, wrote the paper and manuscript as well as created all figures; N.G.P. designed the work and research questions, fieldwork and portions of the analysis methodology and partially funded the field data collection, while J.B. designed and supervised the statistical modeling component.

Conflicts of Interest

The authors declare no conflict of interest.

References

  1. Bogardi, J. Two Billion Will Be in Flood Path by 2050. Available online: http://archive.unu.edu/update/archive/issue322.htm (accessed on 25 September 2014).
  2. Intergovernmental Panel on Climate Change (IPCC). Managing the Risks of Extreme Events and Disasters to Advance Climate Change Adaptation; A Special Report of Working Groups I and II of the Intergovernmental Panel on Climate Change; Field, C.B., Barros, V.R., Stocker, T.F., Qin, D., Dokken, D.J., Ebi, K.L., Mastrandrea, M.D., Mach, K.J., Plattner, G.K., Allen, S.K., et al., Eds.; Cambridge University Press: Cambridge, UK, 2012. [Google Scholar]
  3. Hui, F.M.; Xu, B.; Huang, H.B.; Yu, Q.; Gong, P. Modelling spatial-temporal change of Poyang Lake using multitemporal Landsat imagery. Int. J. Remote Sens. 2008, 29, 5767–5784. [Google Scholar] [CrossRef]
  4. Ramsey, E.; Lu, Z.; Suzuoki, Y.; Rangoonwala, A.; Werle, D. Monitoring duration and extent of storm-surge and flooding in western coastal Louisiana Marshes With ENVISAT ASAR data. IEEE J. Sel. Top. Appl. Earth Observ. Remote Sens. 2011, 4, 387–399. [Google Scholar] [CrossRef]
  5. McCarthy, J.M.; Gumbricht, T.; McCarthy, T.; Frost, P.; Wessels, K.; Seidel, F. Flooding patterns of the Okavango wetland in Botswana between 1972 and 2000. Ambio 2003, 32, 453–457. [Google Scholar] [CrossRef] [PubMed]
  6. Sakamoto, T.; Van Nguyen, N.; Kotera, A.; Ohno, H.; Ishitsuka, N.; Yokozawa, M. Detecting temporal changes in the extent of annual flooding within the Cambodia and the Vietnamese Mekong Delta from MODIS time-series imagery. Remote Sens. Environ. 2007, 109, 295–313. [Google Scholar] [CrossRef]
  7. Khan, S.I.; Hong, Y.; Wang, J.; Yilmaz, K.K.; Gourley, J.J.; Adler, R.F.; Irwin, D. Satellite remote sensing and hydrologic modeling for flood inundation mapping in Lake Victoria basin: Implications for hydrologic prediction in ungauged basins. IEEE Trans. Geosci. Remote Sens. 2011, 49, 85–95. [Google Scholar] [CrossRef]
  8. Handisyde, N.; Lacalle, D.S.; Arranz, S.; Ross, L.G. Modelling the flood cycle, aquaculture development potential and risk using MODIS data: A case study for the floodplain of the Rio Paraná, Argentina. Aquaculture 2014, 422, 18–24. [Google Scholar] [CrossRef]
  9. Pricope, N.G. Variable-source flood pulsing in a semi-arid transboundary watershed: The Chobe River, Botswana and Namibia. Environ. Monit. Assess. 2013, 185, 1883–1906. [Google Scholar] [CrossRef] [PubMed]
  10. Long, S.; Fatoyinbo, T.E.; Policelli, F. Flood extent mapping for Namibia using change detection and thresholding with SAR. Environ. Res. Lett. 2014, 9, 1–9. [Google Scholar] [CrossRef]
  11. Huang, C.; Peng, Y.; Lang, M.; Yeo, I.-Y.; McCarty, G. Wetland inundation mapping and change monitoring using Landsat and airborne LiDAR data. Remote Sens. Environ. 2014, 141, 231–242. [Google Scholar] [CrossRef]
  12. Ward, D.P.; Petty, A.; Setterfield, S.A.; Douglas, M.M.; Ferdinands, K.; Hamilton, S.K.; Phinn, S. Floodplain inundation and vegetation dynamics in the Alligator Rivers region (Kakadu) of northern Australia assessed using optical and radar remote sensing. Remote Sens. Environ. 2014, 147, 43–55. [Google Scholar] [CrossRef]
  13. Gao, B.C. NDWI—A normalized difference water index for remote sensing of vegetation liquid water from space. Remote Sens. Environ. 1996, 58, 257–266. [Google Scholar] [CrossRef]
  14. Xu, H.Q. Modification of normalised difference water index (NDWI) to enhance open water features in remotely sensed imagery. Int. J. Remote Sens. 2006, 27, 3025–3033. [Google Scholar] [CrossRef]
  15. Pricope, N.G.; Binford, M.W. A spatio-temporal analysis of fire recurrence and extent for semi-arid savanna ecosystems in southern Africa using moderate-resolution satellite imagery. J. Environ. Manag. 2012, 100, 72–85. [Google Scholar] [CrossRef] [PubMed]
  16. Ordoyne, C.; Friedl, M.A. Using MODIS data to characterize seasonal inundation patterns in the Florida Everglades. Remote Sens. Environ. 2008, 11, 4107–4119. [Google Scholar] [CrossRef]
  17. Pekel, J.-F.; Vancutsem, C.; Bastin, L.; Clerici, M.; Vanbogaert, E.; Bartholomé, E.; Defourny, P. A near real-time water surface detection method based on HSV transformation of MODIS multi-spectral time series data Remote Sens. Environ. 2014, 140, 704–716. [Google Scholar]
  18. Franck, R.; Prinz, B.; Spitzer, H. Supporting land-use mapping by using multitemporal thermal infrared imagery in conjunction with a simple diurnal temperature model. In Proceedings of the Fourth International Airborne Remote Sensing Conference and Exhibition/21st Canadian Symposium on Remote Sensing, Ottawa, ON, Canada, 21–24 June 1999.
  19. Sosnowski, A.; Ghoneim, E.; Burke, J.J.; Hines, E.; Halls, J. Remote regions, remote data: A spatial investigation of precipitation, dynamic land covers, and conflict in the Sudd wetland of South Sudan. Appl. Geogr. 2016, 69, 51–64. [Google Scholar] [CrossRef]
  20. Veroustraete, F.; Li, Q.; Verstraeten, W.W.; Chen, X.; Li, J.; Liu, T.; Dong, Q.H.; Willems, P. The AMSL LST algorithm validated for the Xinjiang Autonomous Region in China. Int. J. Remote Sens. 2012, 33, 3886–3906. [Google Scholar] [CrossRef]
  21. Leblanc, M.; Lemoalle, J.; Bader, J.C.; Tweed, S.; Mofor, L. Thermal remote sensing of water under flooded vegetation: New observations of inundation patterns for the “Small” Lake Chad. J. Hydrol. 2011, 404, 87–98. [Google Scholar] [CrossRef]
  22. Chen, Y.; Huang, C.; Ticehurst, C.; Merrin, L.; Thew, P. An evaluation of MODIS daily and 8-day composite products for floodplain and wetland inundation mapping. Wetlands 2013, 33, 823–835. [Google Scholar] [CrossRef]
  23. Scudder, T. Need and justification for maintaining transboundary flood regimes: The Africa case. Nat. Resour. J. 1991, 31, 75–107. [Google Scholar]
  24. Inambao, C. Namibia: Caprivi Floods Reach Historic Mark. Available online: http://reliefweb.int/report/namibia/namibia-caprivi-floods-reach-historic-mark (accesed on 3 July 2013).
  25. Wolski, P.; Stone, D.; Tadross, M.; Wehner, M.; Hewitson, B. Attribution of floods in the Okavango basin, southern Africa. J. Hydrol. 2014, 511, 350–358. [Google Scholar] [CrossRef]
  26. Kachingo, F.; School Teacher, Etomba, Namibia. Personal communication, 2014.
  27. Fraser, C. Africa’s Ambitious Experiment to Preserve Threatened Wildlife; Yale Environmental e360, Yale School of Forestry and Environmental Studies: New Haven, CT, USA, 2012; Volume 14, pp. 1–13. [Google Scholar]
  28. Gaughan, A.E.; Waylen, P.R. Spatial and temporal precipitation variability in the Okavango–Kwando–Zambezi catchment, southern Africa. J. Arid Environ. 2012, 82, 9–30. [Google Scholar]
  29. Mwilima, E.S.; MET, KAZA, Windhoek, Namibia. Personal communication, 2014.
  30. Beilfuss, R. A Risky Climate for Southern African Hydro: Assessing Hydrological Risks and Consequences for Zambezi River Basin Dams; International Rivers: Berkeley, CA, USA, 2012. [Google Scholar]
  31. Giannini, A.; Biasutti, M.; Held, I.M.; Sobel, A.H. A global perspective on African climate. Clim. Chang. 2008, 90, 359–383. [Google Scholar] [CrossRef]
  32. Wan, Z. MODIS Land-Surface Temperature Algorithm Theoretical Basis Document (LST ATBD); Version 3.3; NASA Documents; Institute for Computational Earth System Science, University of California: Santa Barbara, CA, USA, 1999. Available online: http://modis.gsfc.nasa.gov/atbd/atbd_mod11.pdf 26 (accessed on 18 January 2015).
  33. Wan, Z. MODIS Land Surface Temperature Products Users’ Guide; Institute for Computational Earth System Science, University of California: Santa Barbara, CA, USA, 2006; Available online: http://www. icess. ucsb. edu/modis/LstUsrGuide/usrguide.html (accessed on 26 January 2015).
  34. Curtarelli, M.P.; Rennó, C.D.; Alcântara, E.H. Evaluation of the Tropical Rainfall Measuring Mission 3B43 product over an inland area in Brazil and the effects of satellite boost on rainfall estimates. J. Appl. Remote Sens. 2014, 8, 083589. [Google Scholar] [CrossRef]
  35. Adeyewa, Z.D.; Nakamura, K. Validation of TRMM radar rainfall data over major climatic regions in Africa. J. Appl. Meteorol. 2003, 42, 331–337. [Google Scholar] [CrossRef]
  36. Linard, C.; Gilbert, M.; Snow, R.W.; Noor, A.M.; Tatem, A.J. Population distribution, settlement patterns and accessibility across Africa in 2010. PLoS ONE 2012, 7, e31743. [Google Scholar] [CrossRef] [PubMed]
  37. White, D.A. The MODIS Conversion Toolkit (MCTK) User’s Guide. ITT Visual Information Solutions. Available online: http://nsidc.org/data/modis/tools.html (accessed on 20 April 2014).
  38. Otsu, N. A threshold selection method from gray-level histograms. Automatica 1975, 11, 23–27. [Google Scholar]
  39. Shu, Y.; Li, J.; Yousif, H.; Gomes, G. Dark-spot detection from SAR intensity imagery with spatial density thresholding for oil-spill monitoring. Remote Sens. Environ. 2010, 114, 2026–2035. [Google Scholar] [CrossRef]
  40. Dobriyal, P.; Qureshi, A.; Badola, R.; Hussain, S.A. A review of the methods available for estimating soil moisture and its implications for water resource management. J. Hydrol. 2012, 458–459, 110–117. [Google Scholar] [CrossRef]
  41. Mediero, L.; Kjeldsen, T.R. Regional flood hydrology in a semi-arid catchment using a GLS regression model. J. Hydrol. 2014, 514, 158–171. [Google Scholar] [CrossRef] [Green Version]
  42. Cohen, R.A. Introducing the GLMSELECT procedure for model selection. In Proceedings of the 31st Annual SAS Users Group International Conference, Cary, NC, USA, 26–29 March 2006; pp. 207–231.
  43. Montanyane, E.; The Department of Water Affairs, Kasane, Botswana. Personal communication, 2014.
  44. High Resolution, Contemporary Data on Human Population Distributions, Namibia; Worldpop Africa Dataset; GeoData Institute, University of Southampton: UK, 2014; Available online: http://www.worldpop.org.uk/data/summary/?contselect=Africa&countselect=Namibia&typeselect=Population (accessed on 12 February 2015).
  45. Integrated Regional Information Networks (IRIN). Namibia/Zambia: Flood Insecurity Looms as Floods Swallow Crops, 2009. Available online: http://www.irinnews.org/report/83623/namibia-zambia-flood-in-security-looms-as-floods-swallow-crops (accessed on 30 March 2014).
  46. Gumbricht, T.; Wolski, P.; Frost, P.; McCarthy, T.S. Forecasting the spatial extent of the annual flood in the Okavango Delta, Botswana. J. Hydrol. 2004, 290, 178–191. [Google Scholar] [CrossRef]
  47. Famine Early Warning Systems Network (FEWS NET). Southern Africa Special Report: 2014/2015 El Nino Event. Available online: http://reliefweb.int/report/mozambique/southern-africa-special-report-201415-el-ni-o-event-july-2014 (accessed on 31 March 2015).
  48. Ogilvie, A.; Belaud, G.; Delenne, C.; Bailly, J.-S.; Bader, J.-C.; Oleksiak, A.; Ferry, L.; Martin, D. Decadal monitoring of the Niger Inner Delta flood dynamics using MODIS optical data. J. Hydrol. 2015, 523, 368–383. [Google Scholar] [CrossRef]
  49. Bosch, N. Flooding Caprivi Namibia. Available online: http://www.caprivi.biz/flooding.html (accessed on 29 March 2015).
  50. Intergovernmental Panel on Climate Change (IPCC). Climate Change 2014: Impacts, Adaptation, and Vulnerability. Part A: Global and Sectoral Aspects; Contribution of Working Group II to the Fifth Assessment Report of the Intergovernmental Panel on Climate Change; Field, C.B., Barros, V.R., Dokken, D.J., Mach, K.J., Mastrandrea, M.D., Bilir, T.E., Chatterjee, M., Ebi, K.L., Estrada, Y.O., Genova, R.C., et al., Eds.; Cambridge University Press: Cambridge, UK, 2014. [Google Scholar]
Figure 1. Study area showing the Chobe River Basin in Namibia and Botswana. Also shown are the rivers that provide water to the region: the Zambezi River, the Linyanti and Chobe Rivers in the center of the basin, and the Kwando River.
Remotesensing 08 00676 g001
Figure 2. Mean monthly precipitation in the Upper Zambezi Sub basin calculated from TRMM 3B43 data for the period 1998–2014.
Remotesensing 08 00676 g002
Figure 3. Time series of daily discharge of the Zambezi River collected at the Katima Station from 2000 to 2014.
Remotesensing 08 00676 g003
Figure 4. (A) Sample differenced MODIS Land Surface Temperature image for 16 May 2000 using the day and night LST bands; (B) Sample inundation extent extracted from differenced MODIS LST image using Otsu thresholding.
Remotesensing 08 00676 g004
Figure 5. Subsets of the Chobe River Basin used in regression analysis.
Remotesensing 08 00676 g005
Figure 6. Spatial extent of inundation duration cycles in the Chobe River Basin calculated from MODIS LST data for the period 2000–2014. Areas within the CRB limit that are white reflect no flooding.
Remotesensing 08 00676 g006
Figure 7. Derived annual inundation maximums from 2000 to 2014. The long-term average of 4097 km2 is shown.
Remotesensing 08 00676 g007
Figure 8. Flood frequency in the Chobe River Basin for the period 2000–2014.
Remotesensing 08 00676 g008
Figure 9. Examples of ground control points taken in the field with their corresponding flooding extent derived from MODIS imagery on the 8-day aggregated 10 June image. All shown GCPs were marked on the furthest extent of flooding in that area. Images shown were taken on location with a Trimble Juno SB device.
Remotesensing 08 00676 g009
Figure 10. Time series of classified MODIS LST images showing the movement of surface flooding through the CRB in 2012.
Remotesensing 08 00676 g010
Figure 11. Stage of Chobe River at Marina Lodge, Kasane, Botswana (Data courtesy of the Department of Water Affairs office in Kasane, Botswana).
Remotesensing 08 00676 g011
Figure 12. Comparison of the observed inundation derived from the MODIS LST imagery and with that modeled using Equation (3) over the period 2001–2003.
Remotesensing 08 00676 g012
Figure 13. Distribution of population in the Zambezi Region of eastern Namibia.
Remotesensing 08 00676 g013
Figure 14. Population centers located within flood zones in years of low magnitude (top) and high magnitude flooding (bottom).
Remotesensing 08 00676 g014
Figure 15. Daily discharge of the Zambezi and derived area of flooding in the Chobe River Basin from 2000 to 2014.
Remotesensing 08 00676 g015

