
Combining Sun-Induced Chlorophyll Fluorescence and Photochemical Reflectance Index Improves Diurnal Modeling of Gross Primary Productivity

 , , and
Abstract
:
1. Introduction
2. Materials and Methods
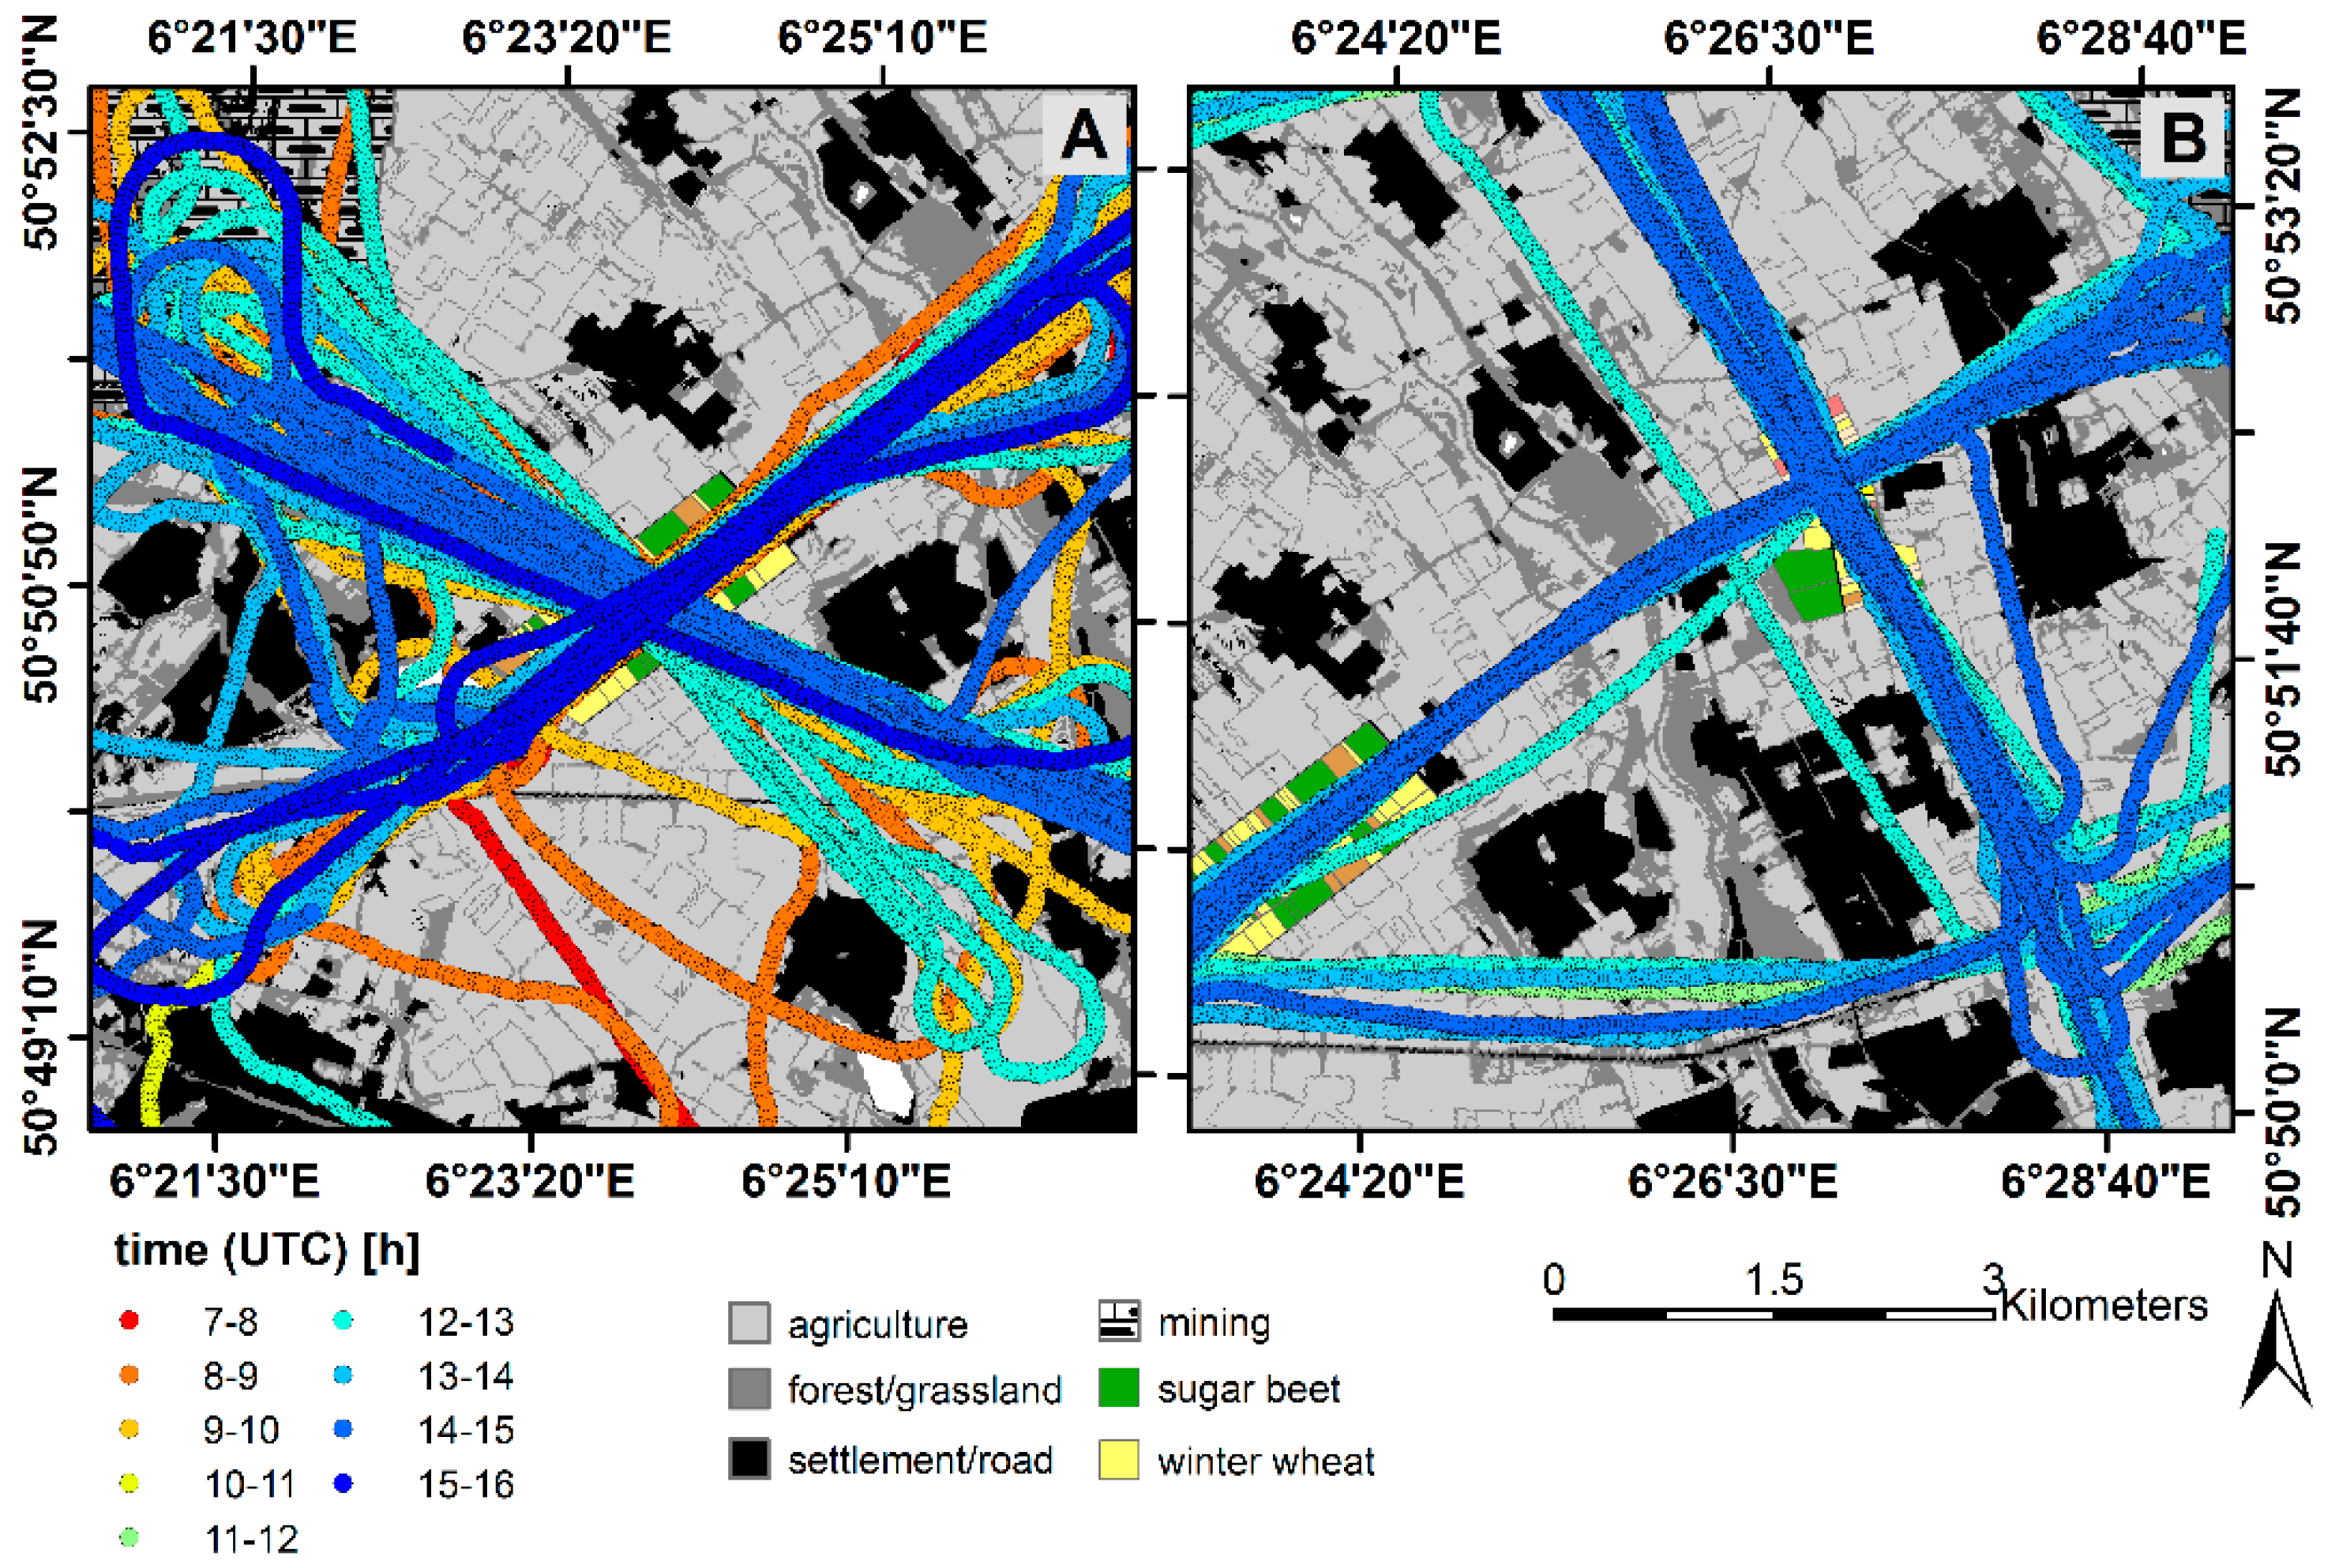
2.1. Study Site
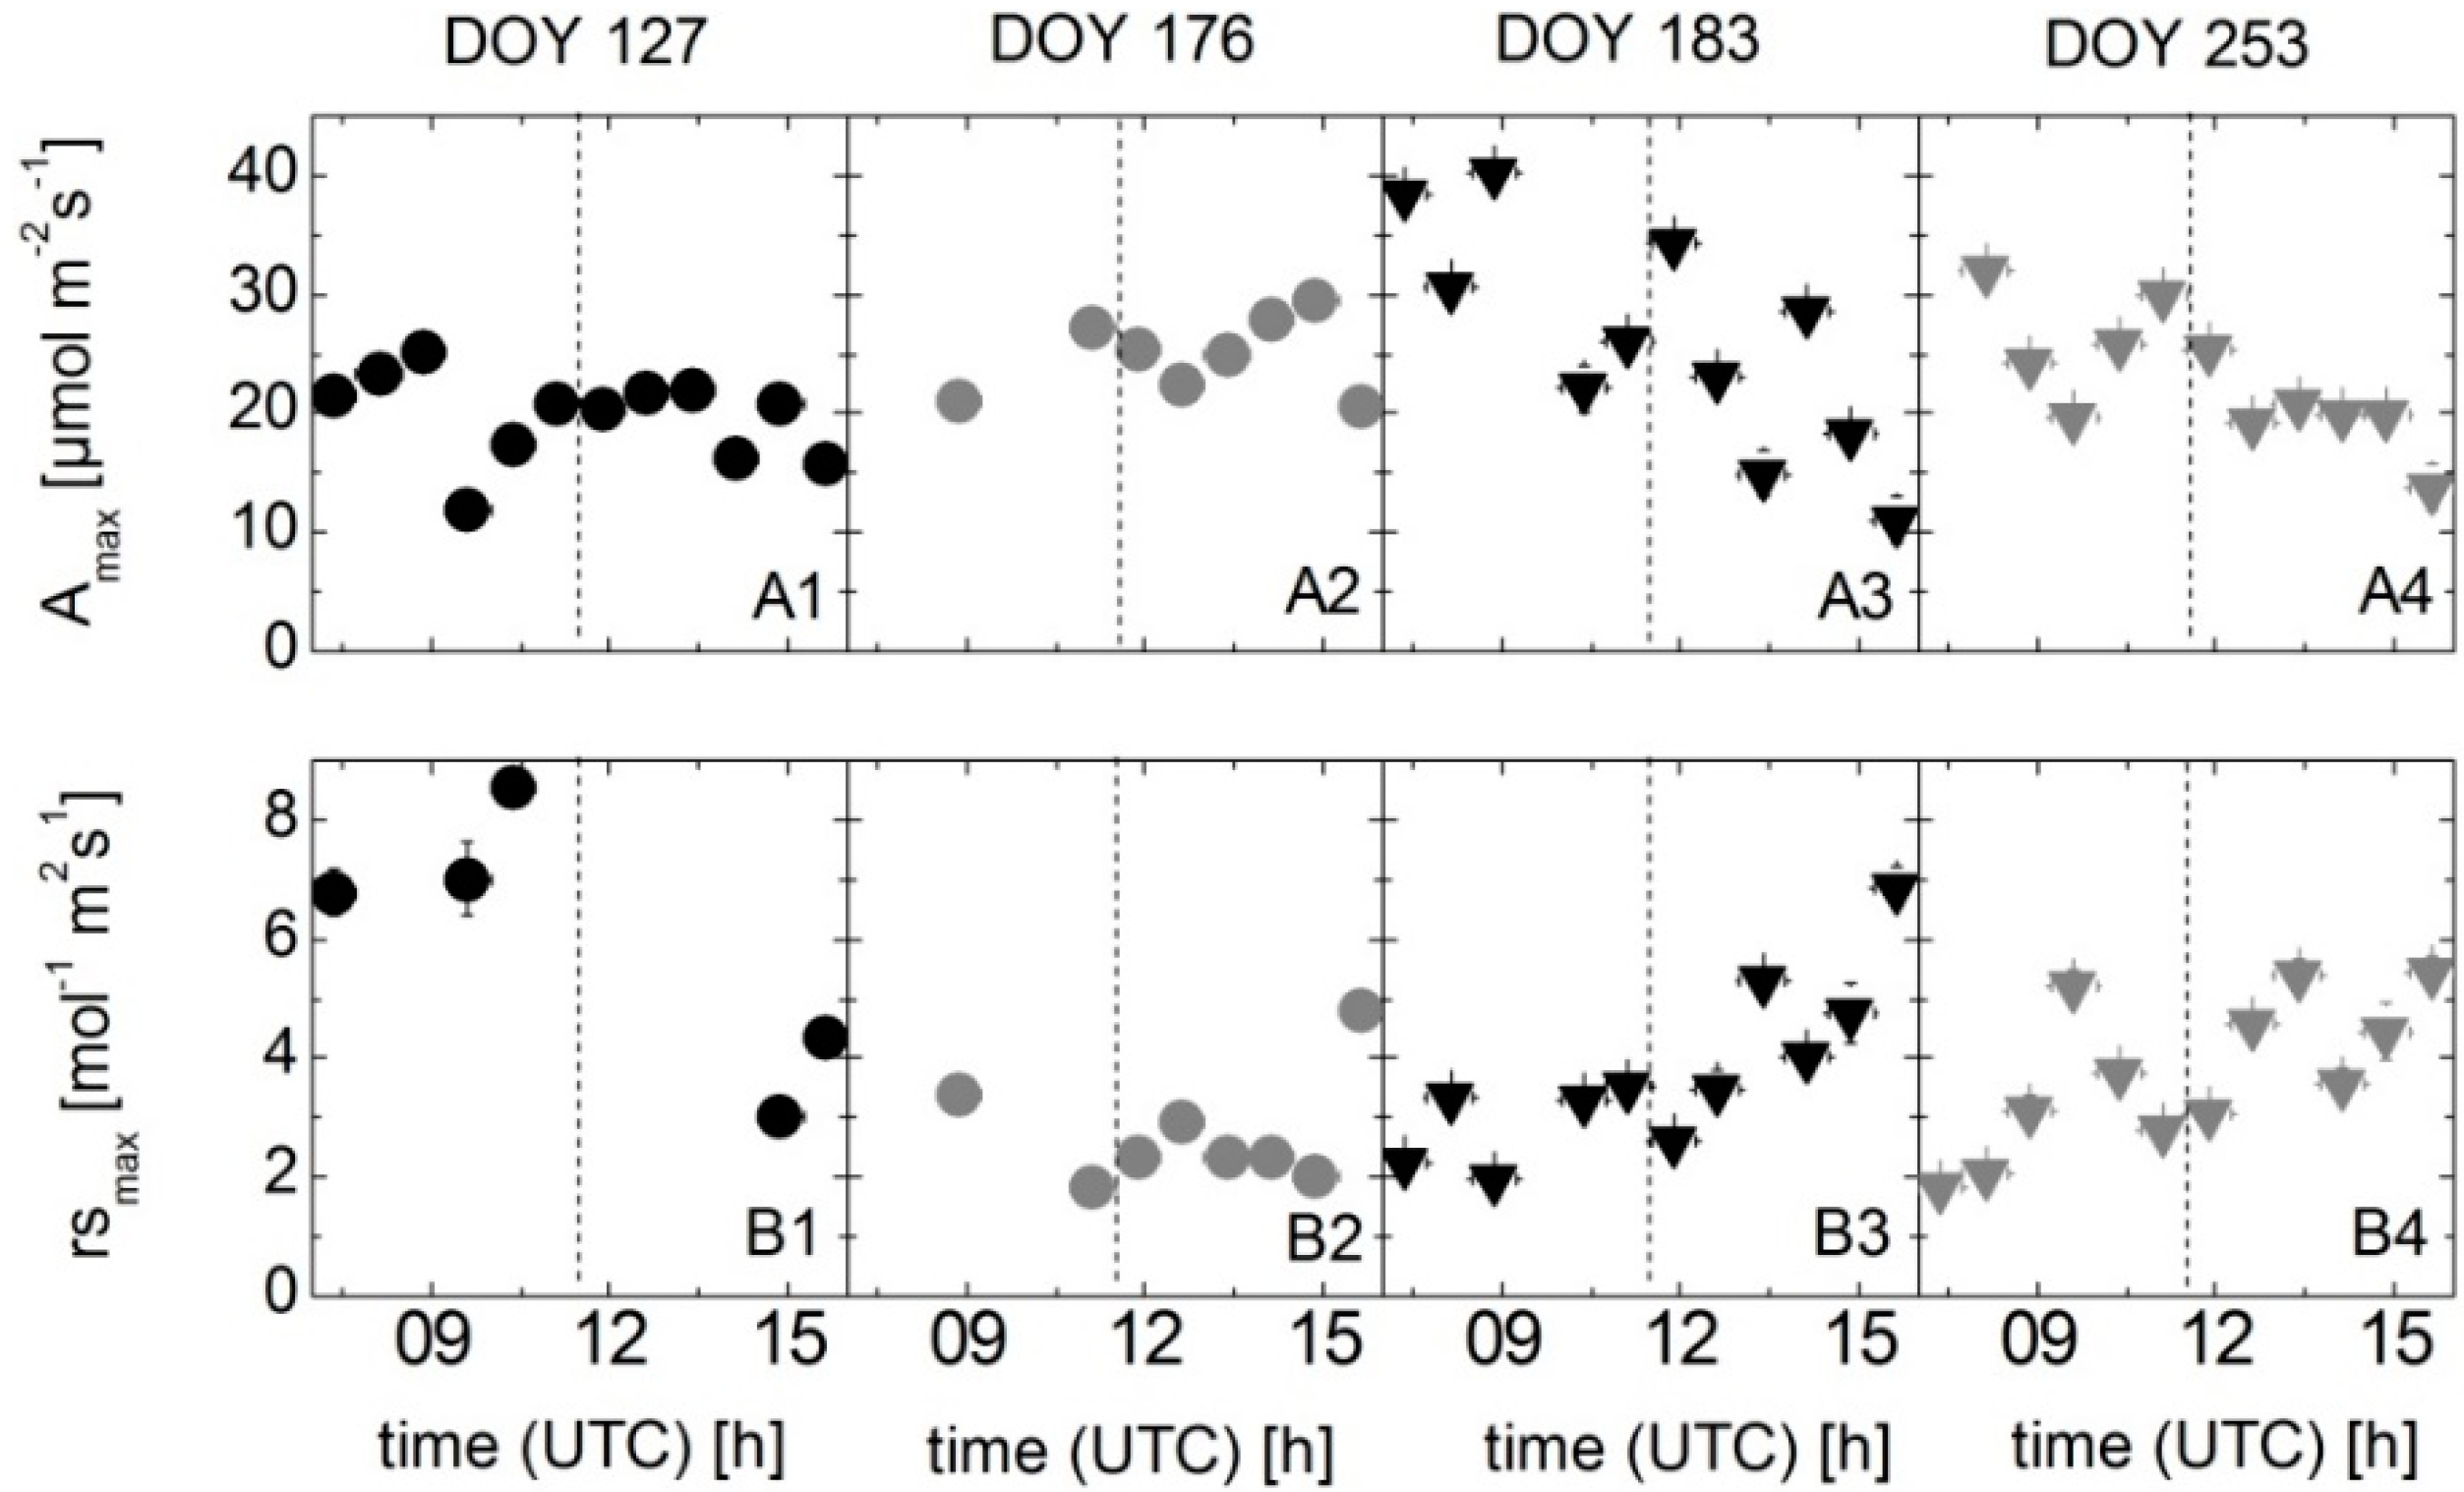
2.2. Leaf-Level Measurements of the Photosynthetic Carbon Uptake Rate and Stomatal Conductance
2.3. Measurements of Canopy-Scale Carbon Fluxes (Eddy Covariance)
2.4. Spectroradiometric Measurements on the Ground
2.5. Spectroradiometric Measurements with the Dimona Aircraft
2.6. Parameters Derived from Spectroradiometric Measurements
2.7. Forward Modeling of Gross Primary Productivity
- (A)
- GPPA describes the classical approach where LUE is considered to remain constant over the course of the day. Thus LUE is parameterized as an optimized but constant value for each diurnal course. We measured ƒAPAR and PAR directly using the spectroradiometer on the ground.
- (B)
- It has been described in the literature that the NDVI of the observed surface can be used as proxy for ƒAPAR in the canopy [39]. Consequently, approach GPPB was formulated by using NDVI as a proxy for ƒAPAR in GPPA, aiming to estimate GPP solely from spectroscopic measurements, while using a constant LUE as for GPPA. The LUEconst is the daytime mean (07–16 UTC) of the LUE measured with the EC method. The parameters m and k were obtained from the slope and axis interception of the linear fit between ƒAPAR and NDVI. The parameters of the linear fit can be found in Table S1 in the supplemental materials.As we will show later (see Section 3.5), approaches GPPA and GPPB performed equally well for all five observation days. Therefore, NDVI scaling for ƒAPAR as in GPPB was also used in the remaining approaches. For those three approaches LUE is also parameterized linearly using the variables F760-yield and PRI.
- (C)
- GPPC describes the approach where LUE is considered to be parameterized linearly using the F760-yield. Parameters a and b (Equations (12)–(14)) represent the slope and the axis interception of the linear fit between LUE measured with the EC method and each remote sensed parameter. The parameters of the linear fits can be found in Tables S2–S4 in the supplemental materials.
- (D)
- Another approach, where LUE is considered to be parameterized linearly to PRI, could be written as follows:
- (E)
- To include both the non-photochemical energy dissipation (NPQ) and the efficiency of photochemical energy separation in the LUE concept, a linear relation to the product of both parameters, PRI and F760‑yield, is used:
3. Results
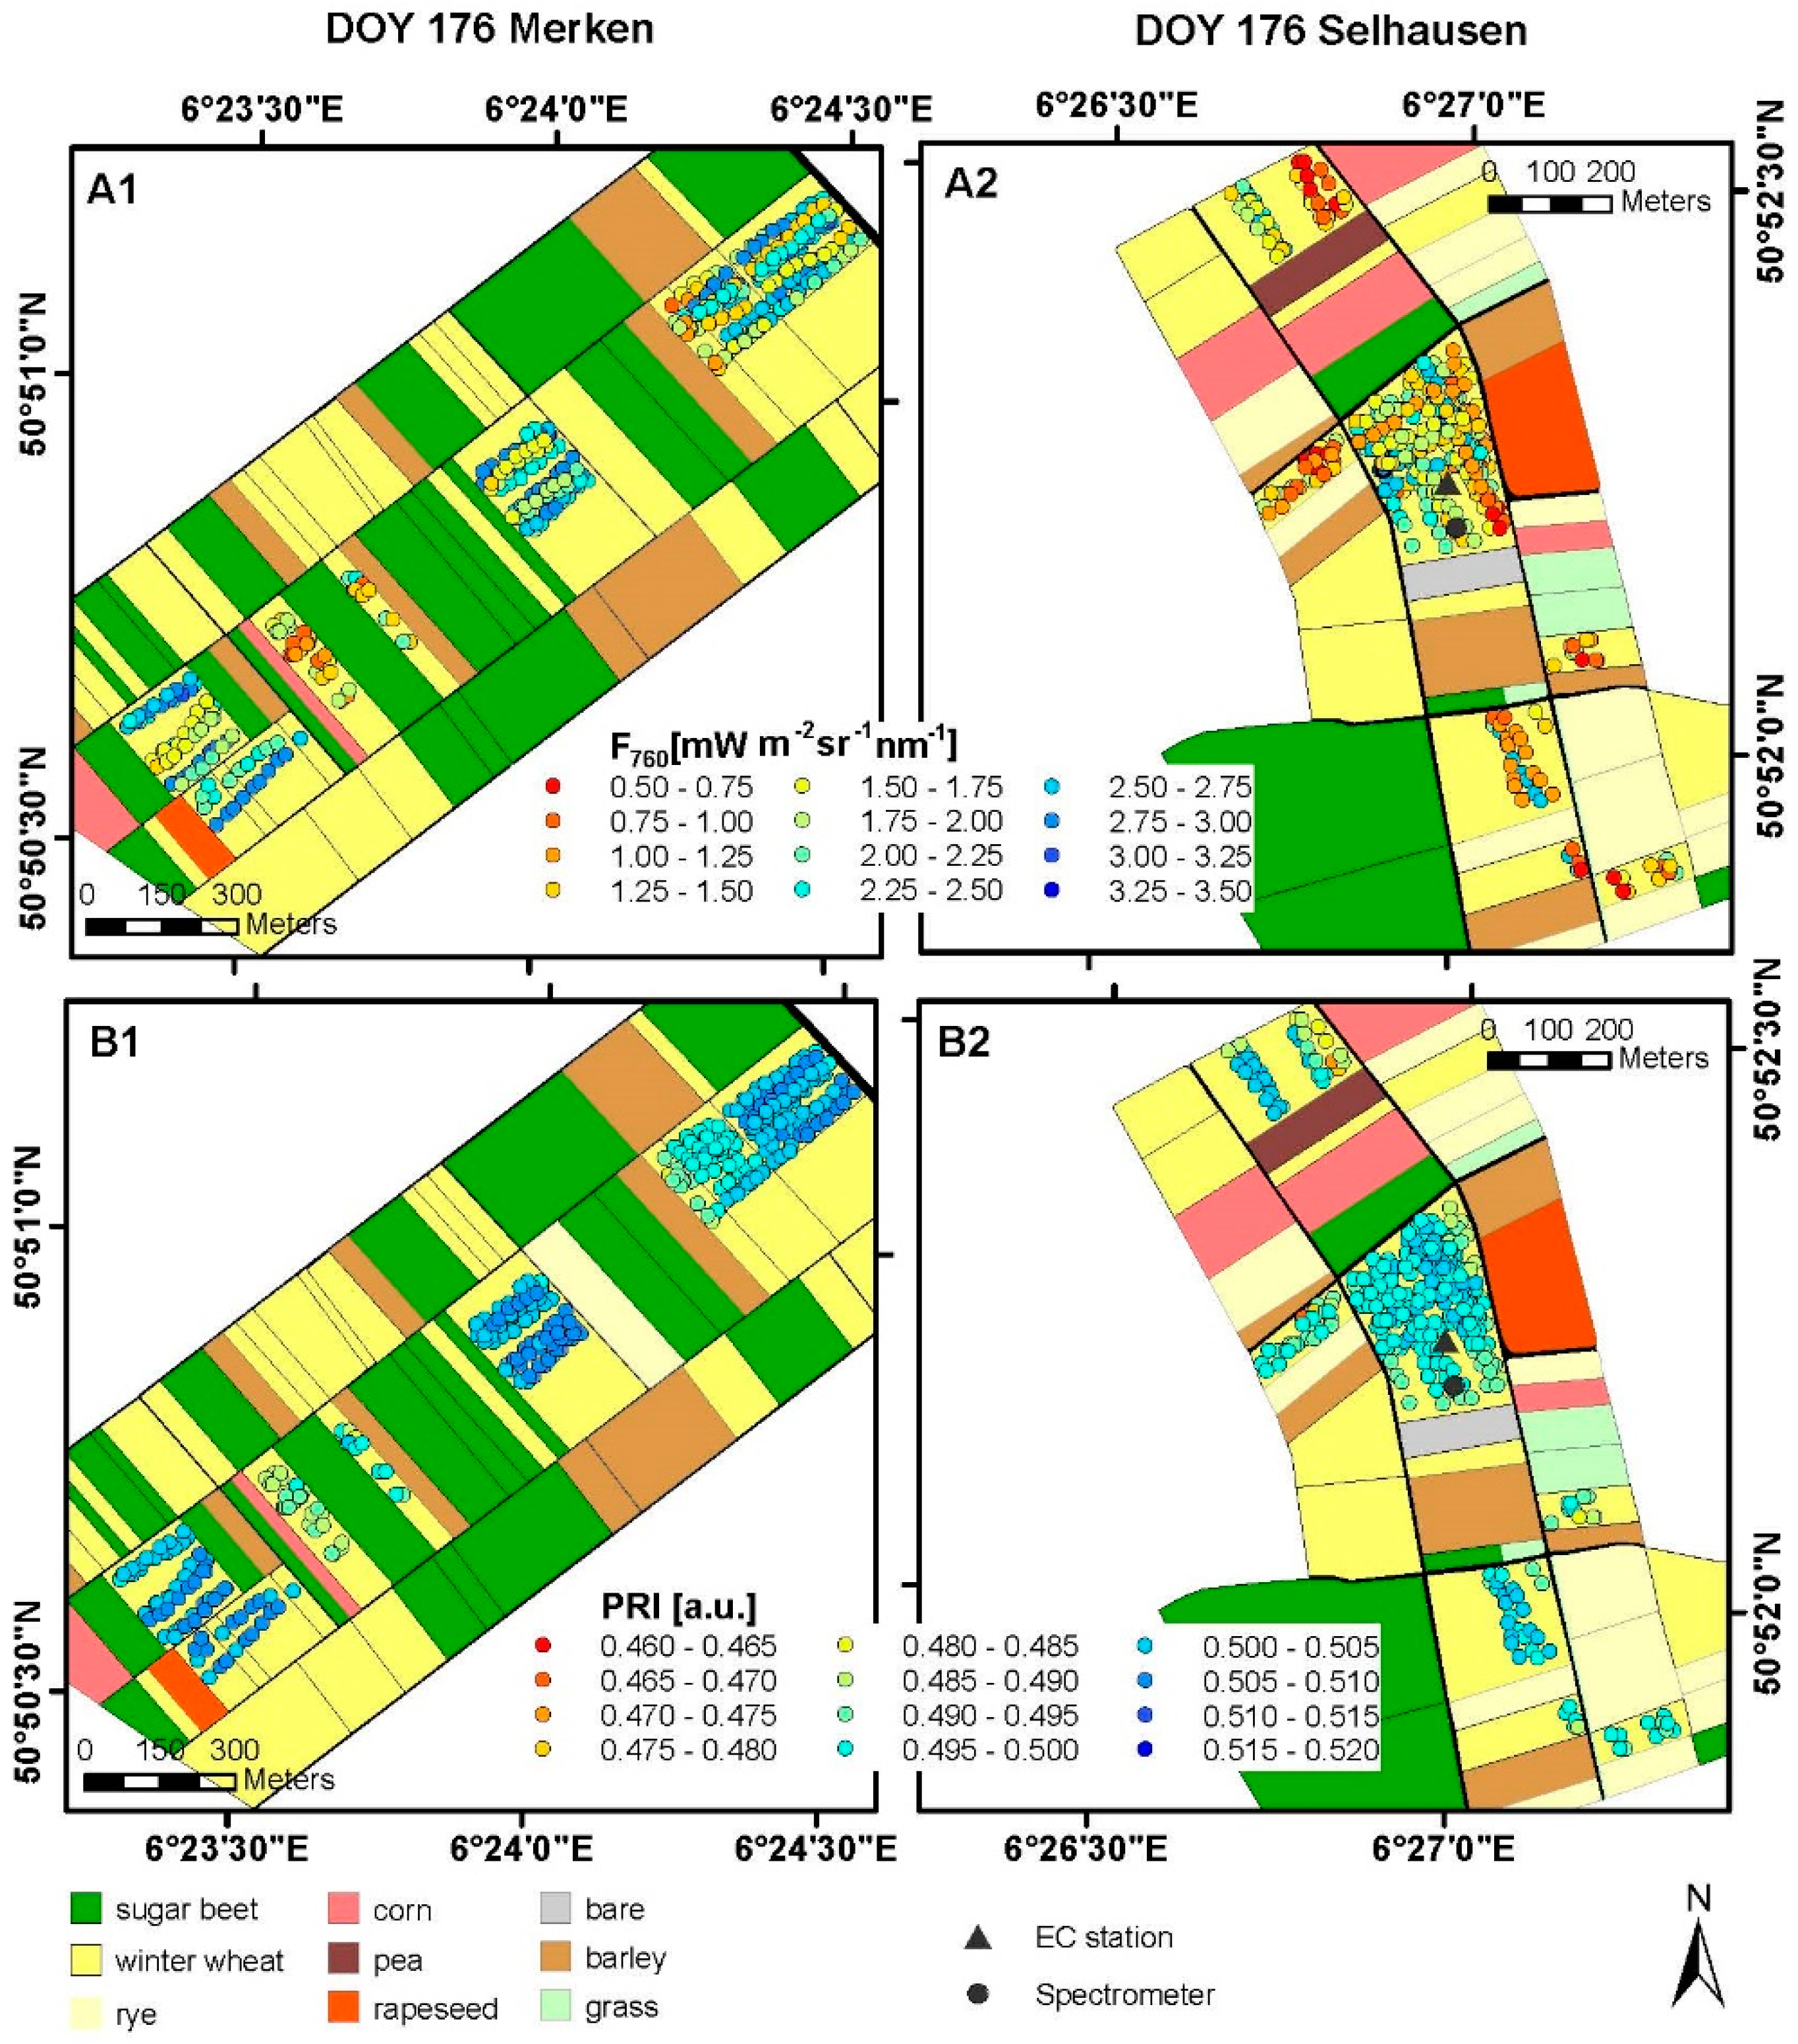
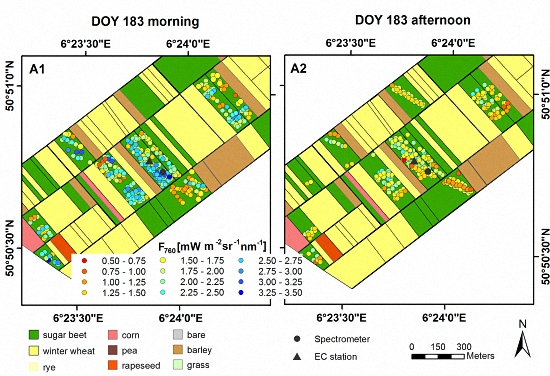
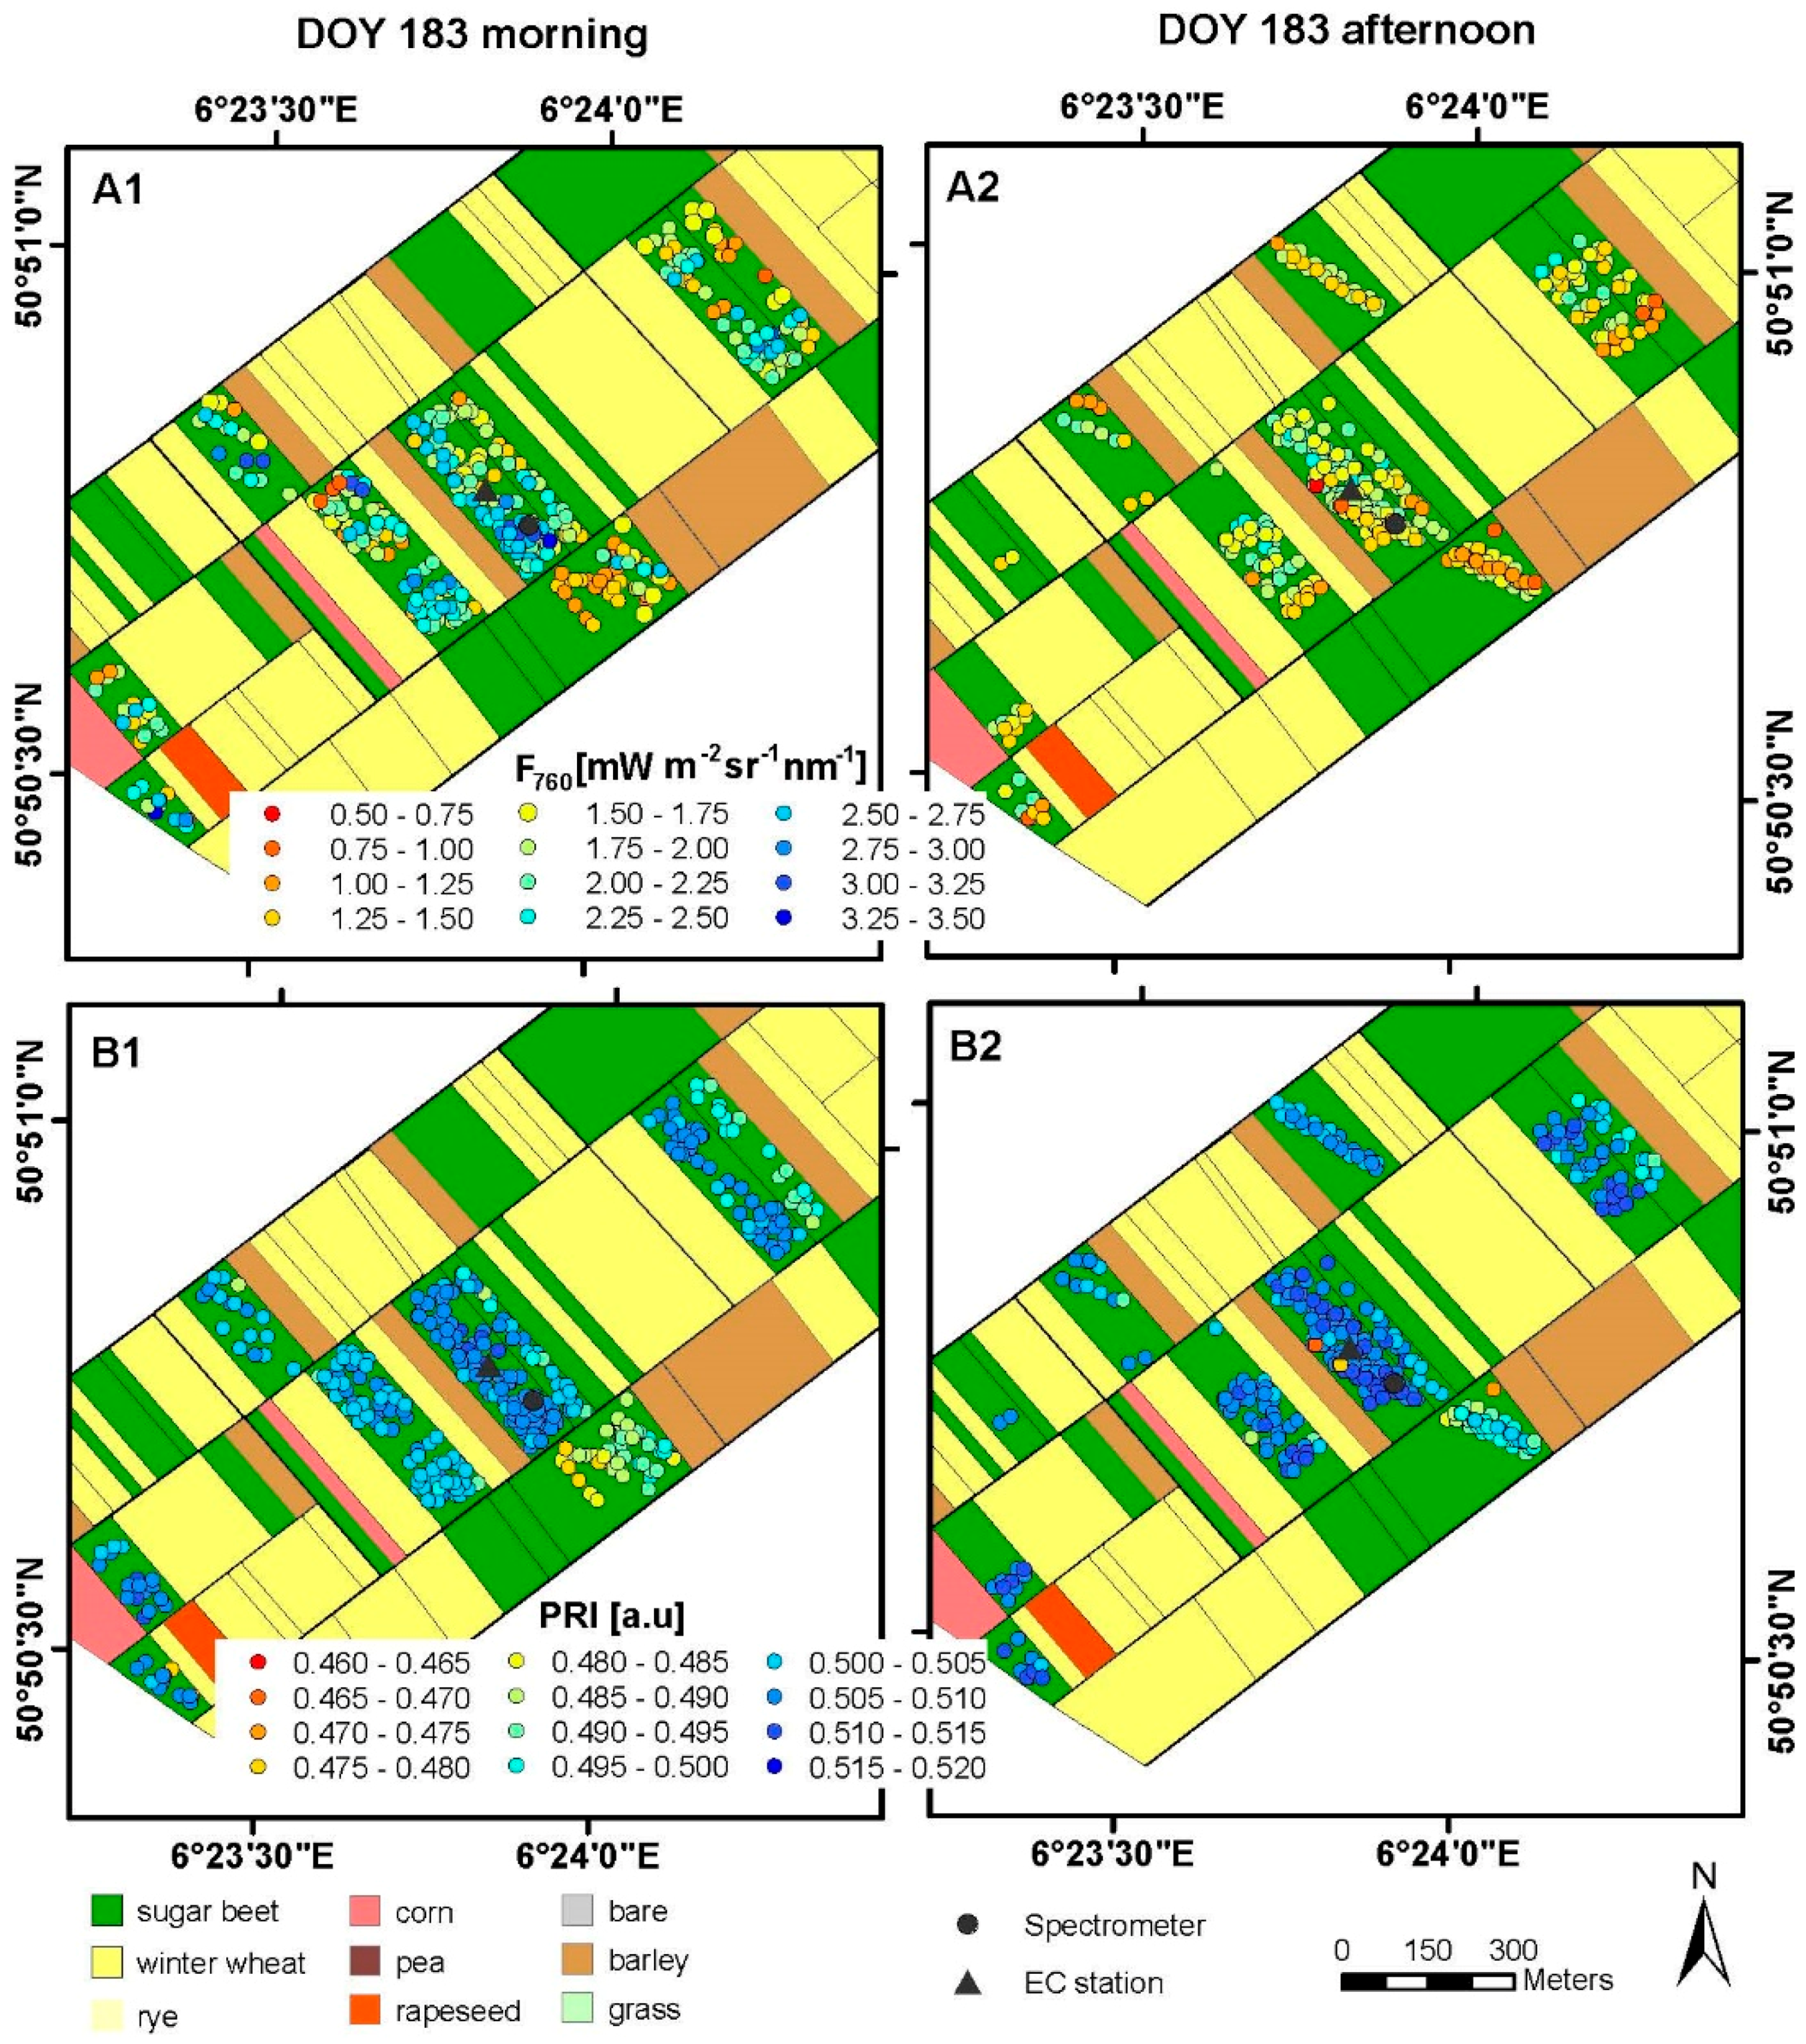
3.1. Spatial and Temporal Variability of Optical Parameters in Winter Wheat
3.2. Spatial and Temporal Variability of Optical Parameters in Sugar Beet
3.3. Results of Spectroradiometric and Eddy Covariance Measurements on the Ground
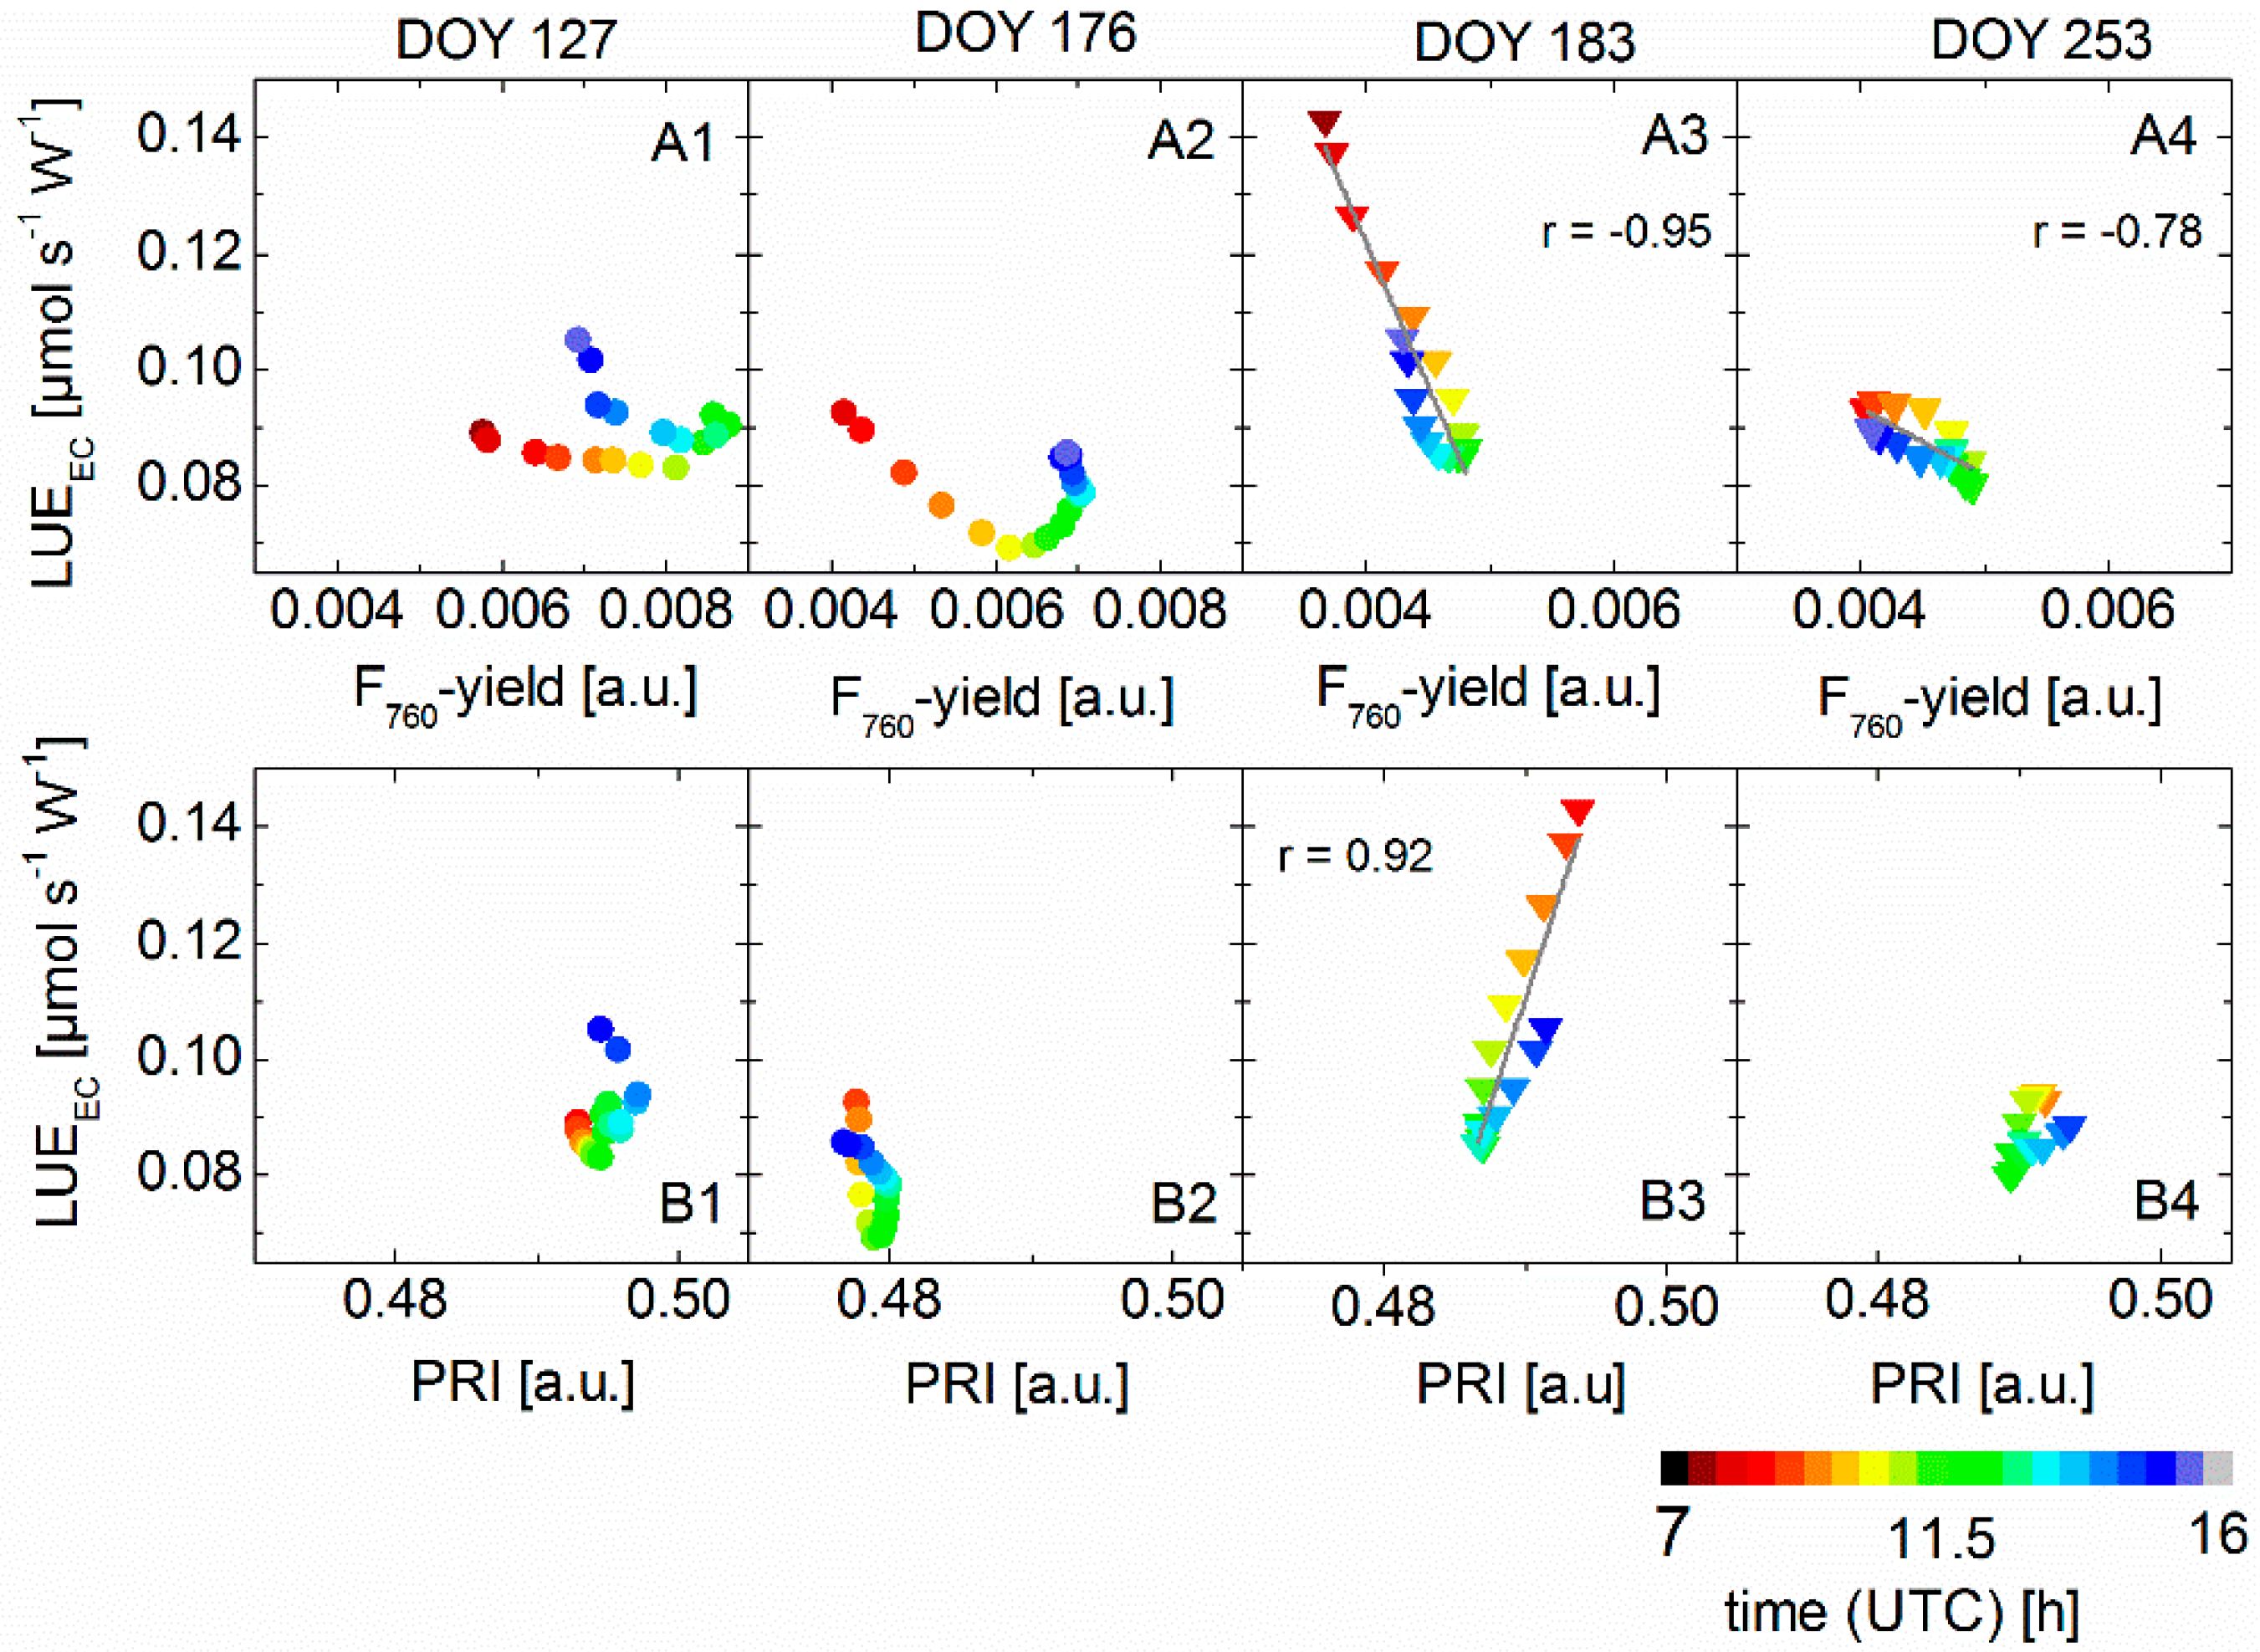
3.4. Correlation between Sun-Induced Fluorescence Yield, Photochemical Reflectance Index, and Photosynthetic Light-Use Efficiency
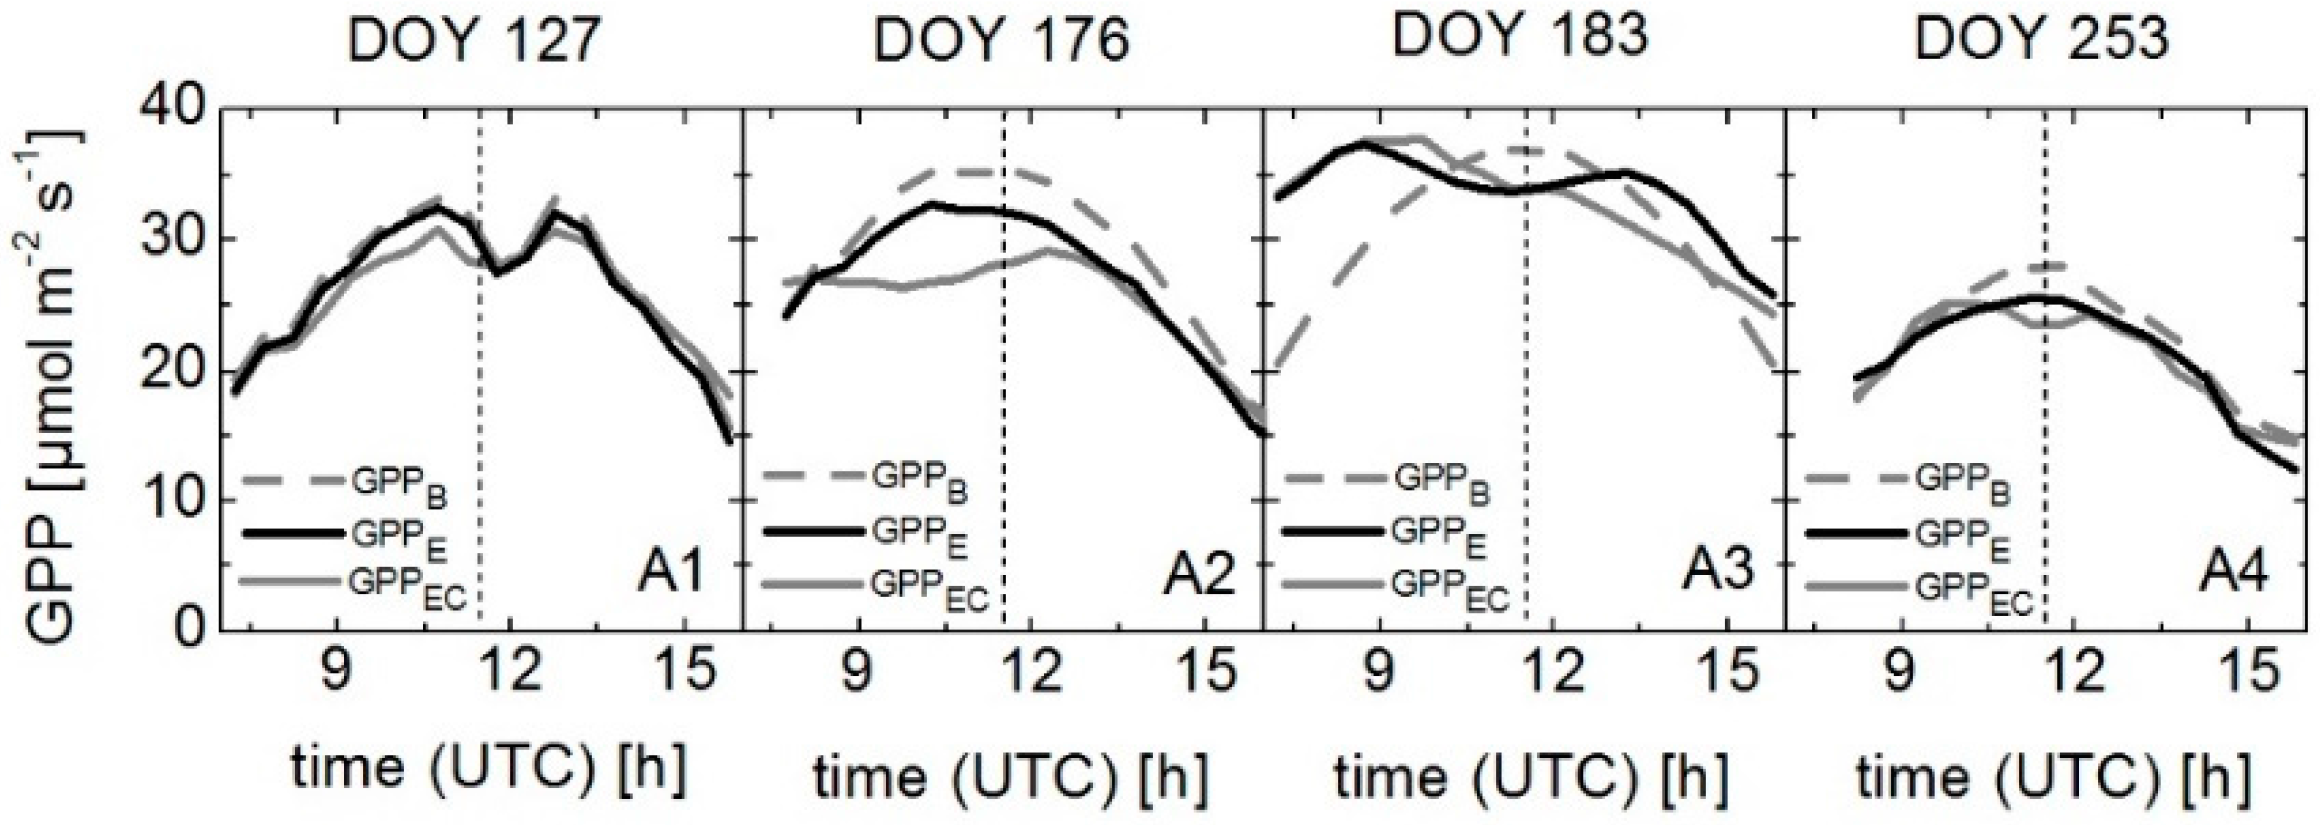
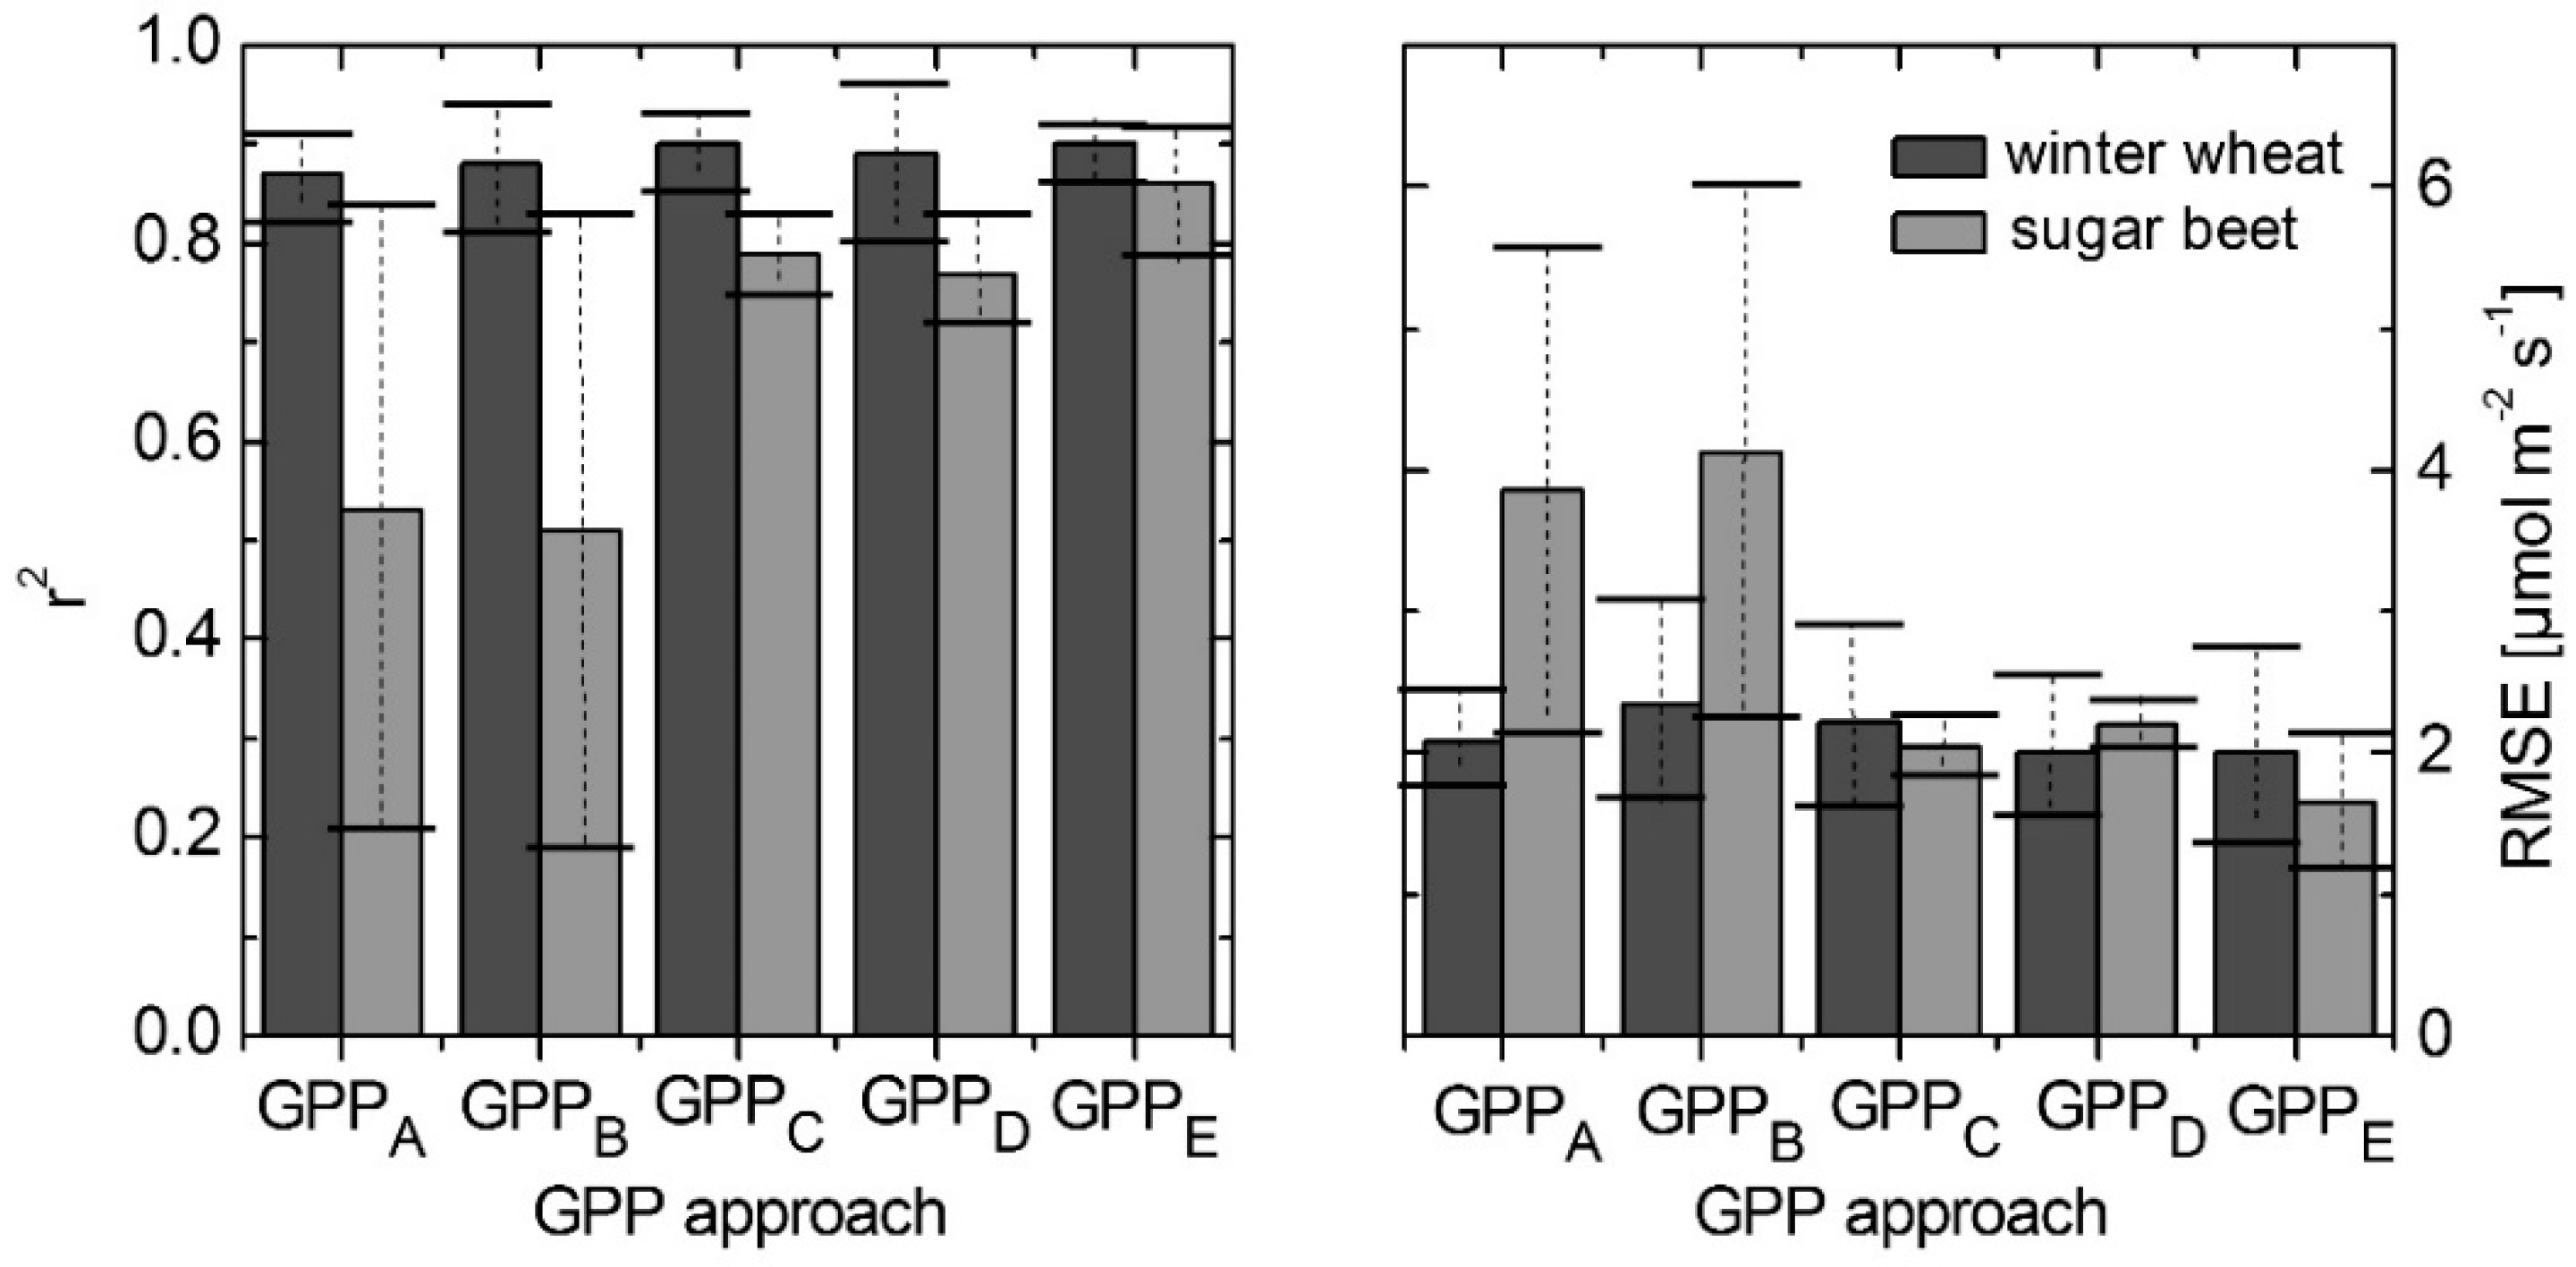
3.5. Modeling GPP Using Spectroradiometric Measurements of Sun-Induced Fluorescence and PRI as Dynamic Input Parameters
4. Discussion
5. Conclusions
Supplementary Materials
Acknowledgments
Author Contributions
Conflicts of Interest
References
- Le Quéré, C.; Raupach, M.R.; Canadell, J.G.; Marland, G.; Bopp, L.; Ciais, P.; Conway, T.J.; Doney, S.C.; Feely, R.A.; Foster, P.; et al. Trends in the sources and sinks of carbon dioxide. Nat. Geosci. 2009, 2, 831–836. [Google Scholar] [CrossRef]
- Xia, J.; Niu, S.; Ciais, P.; Janssens, I.A.; Chen, J.; Ammann, C.; Arain, A.; Blanken, P.D.; Cescatti, A.; Bonal, D.; et al. Joint control of terrestrial gross primary productivity by plant phenology and physiology. Proc. Natl. Acad. Sci. USA 2015, 112, 2788–2793. [Google Scholar] [CrossRef] [PubMed]
- Cramer, W.; Kicklighter, D.W.; Bondeau, A.; Moore, B.; Churkina, C.; Nemry, B.; Ruimy, A.; Schloss, A.L. Comparing global models of terrestrial net primary productivity (NPP): Overview and key results. Glob. Chang. Biol. 1999, 5, 1–15. [Google Scholar] [CrossRef]
- Monteith, J.L. Solar-radiation and productivity in tropical ecosystems. J. Appl. Ecol. 1972, 9, 747–766. [Google Scholar] [CrossRef]
- Monteith, J.L. Climate and efficiency of crop production in Britain. Philos. Trans. R. Soc. Lond. Ser. B Biol. Sci. 1977, 281, 277–294. [Google Scholar] [CrossRef]
- Rascher, U.; Nedbal, L. Dynamics of photosynthesis in fluctuating light—Commentary. Curr. Opin. Plant Biol. 2006, 9, 671–678. [Google Scholar] [CrossRef] [PubMed]
- Asner, G.P.; Martin, R.E.; Carlson, K.M.; Rascher, U.; Vitousek, P.M. Vegetation–climate interactions among native and invasive species in Hawaiian rainforest. Ecosystems 2006, 6, 1106–1117. [Google Scholar] [CrossRef]
- Gamon, J.A.; Peñuelas, J.; Field, C.B. A narrow-waveband spectral index that tracks diurnal changes in photosynthetic efficiency. Remote Sens. Environ. 1992, 41, 35–44. [Google Scholar] [CrossRef]
- Barton, C.V.M.; North, P.R.J. Remote sensing of canopy light use efficiency using the photochemical reflectance index—Model and sensitivity analysis. Remote Sens. Environ. 2001, 78, 264–273. [Google Scholar] [CrossRef]
- Gamon, J.A.; Berry, J.A. Facultative and constitutive pigment effects on the Photochemical Reflectance Index (PRI) in sun and shade conifer needles. Isr. J. Plant Sci. 2012, 60, 85–95. [Google Scholar] [CrossRef]
- Damm, A.; Guanter, L.; Verhoef, W.; Schläpfer, D.; Garbari, S.; Schaepman, M.E. Impact of varying irradiance on vegetation indices and chlorophyll fluorescence derived from spectroscopy data. Remote Sens. Environ. 2015, 156, 202–215. [Google Scholar] [CrossRef]
- Cheng, Y.-B.; Middleton, E.M.; Zhang, Q.; Corp, L.A.; Dandois, J.; Kustas, W.P. The photochemical reflectance index from directional cornfield reflectances: Observations and simulations. Remote Sens. Environ. 2012, 124, 444–453. [Google Scholar] [CrossRef]
- Garbulsky, M.F.; Penuelas, J.; Gamon, J.; Inoue, Y.; Filella, I. The photochemical reflectance index (PRI) and the remote sensing of leaf, canopy and ecosystem radiation use efficiencies. A review and meta-analysis. Remote Sens. Environ. 2011, 115, 281–297. [Google Scholar] [CrossRef]
- Rascher, U.; Agati, G.; Alonso, L.; Cecchi, G.; Champagne, S.; Colombo, R.; Damm, A.; Daumard, F.; de Miguel, E.; Fernandez, G.; et al. CEFLES2: The remote sensing component to quantify photosynthetic efficiency from the leaf to the region by measuring sun-induced fluorescence in the oxygen absorption bands. Biogeosciences 2009, 6, 1181–1198. [Google Scholar] [CrossRef]
- Meroni, M.; Rossini, M.; Guanter, L.; Alonso, L.; Rascher, U.; Colombo, R.; Moreno, J. Remote sensing of solar-induced chlorophyll fluorescence: Review of methods and applications. Remote Sens. Environ. 2009, 113, 2037–2051. [Google Scholar] [CrossRef]
- Joiner, J.; Yoshida, Y.; Vasilkov, A.P.; Yoshida, Y.; Corp, L.A.; Middleton, E.M. First observations of global and seasonal terrestrial chlorophyll fluorescence from space. Biogeosciences 2011, 8, 637–651. [Google Scholar] [CrossRef]
- Frankenberg, C.; Fisher, J.B.; Worden, J.; Badgley, G.; Saatchi, S.S.; Lee, J.-E.; Toon, G.C.; Butz, A.; Jung, M.; Kuze, A.; et al. New global observations of the terrestrial carbon cycle from GOSAT: Patterns of plant fluorescence with gross primary productivity. Geophys. Res. Lett. 2011, 38, L17706. [Google Scholar] [CrossRef]
- Guanter, L.; Frankenberg, C.; Dudhia, A.; Lewis, P.E.; Gomez-Dans, J.; Kuze, A.; Suto, H.; Grainger, R.G. Retrieval and global assessment of terrestrial chlorophyll fluorescence from GOSAT space measurements. Remote Sens. Environ. 2012, 121, 236–251. [Google Scholar]
- Guanter, L.; Zhang, Y.G.; Jung, M.; Joiner, J.; Voigt, M.; Berry, J.A.; Frankenberg, C.; Huete, A.R.; Zarco-Tejada, P.; Lee, J.E.; et al. Global and time-resolved monitoring of crop photosynthesis with chlorophyll fluorescence. Proc. Natl. Acad. Sci. USA 2014, 111, E1327–E1333. [Google Scholar] [CrossRef] [PubMed]
- Damm, A.; Elbers, J.; Erler, E.; Gioli, B.; Hamdi, K.; Hutjes, R.; Kosvancova, M.; Meroni, M.; Miglietta, F.; Moersch, A.; et al. Remote sensing of sun induced fluorescence to improve modeling of diurnal courses of gross primary production (GPP). Glob. Chang. Biol. 2010, 16, 171–186. [Google Scholar] [CrossRef]
- Cheng, Y.-B.; Middleton, E.M.; Zhang, Q.; Huemmrich, K.F.; Campbell, P.K.E.; Corp, L.A.; Cook, B.D.; Kustas, W.P.; Daughtry, C.S. Integrating solar induced fluorescence and the photochemical reflectance index for estimating gross primary production in a cornfield. Remote Sens. 2013, 12, 6857–6879. [Google Scholar] [CrossRef]
- Rossini, M.; Meroni, M.; Migliavacca, M.; Manca, G.; Cogliati, S.; Busetto, L.; Picchi, V.; Cescatti, A.; Seufert, G.; Colombo, R. High resolution field spectroscopy measurements for estimating gross ecosystem production in a rice field. Agric. For. Meteorol. 2010, 150, 1283–1296. [Google Scholar] [CrossRef]
- Rossini, M.; Cogliati, S.; Meroni, M.; Migliavacca, M.; Galvagno, M.; Busetto, L.; Cremonese, E.; Julitta, T.; Siniscalco, C.; di Cella, U.; et al. Remote sensing-based estimation of gross primary production in a subalpine grassland. Biogeosciences 2012, 9, 2565–2584. [Google Scholar] [CrossRef]
- Farquhar, G.D.; Sharkey, T.D. Stomatal conductance and photosynthesis. Annu. Rev. Plant Physiol. Plant Mol. Biol. 1982, 33, 317–345. [Google Scholar] [CrossRef]
- Hall, A.E. Mathematical models of plant water loss and plant water relations. In Encyclopedia of Plant Physiology; Physiological Plant Ecology II; Lange, O.L., Nobel, P.S., Osmond, C.B., Ziegler, H., Eds.; Springer-Verlag: Berlin/Heidelberg, Germany; New York, NY, USA, 1982; pp. 231–261. [Google Scholar]
- Swinbank, W.C. The measurement of vertical transfer of heat and water vapor by eddies in the lower atmosphere. J. Meteorol. 1951, 8, 135–145. [Google Scholar] [CrossRef]
- Mauder, M.; Foken, T. Documentation and Instruction Manual of the Eddy Covariance Software Package TK2; Department of Micrometeorol, University of Bayreuth: Bayreuth, Germany, 2004. [Google Scholar]
- Van Dijk, A.; Moene, A.F.; de Bruin, H.A.R. The Principle of Surface Flux Physics: Theory, Practice and Description of the ECPACK Library; Internal Rep. 2004/1; Meteorology and Air Quality Group, Wageningen University: Wageningen, The Netherlands, 2004. [Google Scholar]
- Schmidt, M.; Reichenau, T.G.; Fiener, P.; Schneider, K. The carbon budget of a winter wheat field: An eddy covariance analysis of seasonal and inter-annual variability. Agric. For. Meteorol. 2012, 165, 114–126. [Google Scholar] [CrossRef]
- Graf, A.; Prolingheuer, N.; Schickling, A.; Schmidt, M.; Schneider, K.; Schuttemeyer, D.; Herbst, M.; Huisman, J.A.; Weihermuller, L.; Scharnagl, B.; et al. Temporal downscaling of soil carbon dioxide efflux measurements based on time-stable spatial patterns. Vadose Zone J. 2011, 10, 239–251. [Google Scholar] [CrossRef]
- Reichstein, M.; Falge, E.; Baldocchi, D.; Papale, D.; Aubinet, M.; Berbigier, P.; Bernhofer, C.; Buchmann, N.; Gilmanov, T.; Granier, A.; et al. On the separation of net ecosystem exchange into assimilation and ecosystem respiration: Review and improved algorithm. Glob. Chang. Biol. 2005, 11, 1424–1439. [Google Scholar] [CrossRef]
- Neininger, B.; Fuchs, W.; Baeumle, M.; Volz-Thomas, A.; Prévôt, A.S.H.; Dommen, J. A small aircraft for more than just ozone: Metair’s ‘Dimona’ after ten years of evolving development. In Proceedings of the 11th Symposium on Meteorological Observations and Instrumentation, Albuquerque, NM, USA, 14–19 January 2001.
- Berk, A.; Anderson, G.P.; Acharya, P.K.; Bernstein, L.S.; Muratov, L.; Lee, J.; Fox, M.; Adler-Golden, S.M.; Chetwynd, J.H.; Hoke, M.L.; et al. MODTRAN5: A reformulated atmospheric band model with auxiliary species and practical multiple scattering options. Proc. Soc. Photo-Opt. Instrum. Eng. 2005, 5655, 662–667. [Google Scholar]
- Damm, A.; Guanter, L.; Laurent, V.C.E.; Schaepman, M.E.; Schickling, A.; Rascher, U. FLD-based retrieval of sun-induced chlorophyll fluorescence from medium spectral resolution airborne spectroscopy data. Remote Sens. Environ. 2014, 147, 256–266. [Google Scholar] [CrossRef]
- Maier, S.W.; Günther, K.P.; Stellmes, M. Sun-induced fluorescence: A new tool for precision farming. In Digital Imaging and Spectral Techniques: Applications to Precision Agriculture and Crop Physiology; McDonald, M., Schepers, J., Tartly, L., van Toai, T., Major, D., Eds.; ASA Special Publication: Boston, MA, USA, 2003; pp. 209–222. [Google Scholar]
- Gitelson, A.A.; Gamon, J.A. The need for a common basis for defining light-use efficiency: Implications for productivity estimation. Remote Sens. Environ. 2015, 156, 196–201. [Google Scholar] [CrossRef]
- Rouse, J.W., Jr.; Haas, R.H.; Schell, J.A.; Deering, D.W. Monitoring vegetation systems in the Great Plains with ERTS. In Third ERTS Symposium; NASA SP-351; NASA: Washington, DC, USA, 1973; pp. 309–317. [Google Scholar]
- Tucker, C.J. Red and photographic infrared linear combinations for monitoring vegetation. Remote Sens. Environ. 1979, 8, 127–150. [Google Scholar] [CrossRef]
- Myneni, R.B.; Williams, D.L. On the relationship between FAPAR and NDVI. Remote Sens. Environ. 1994, 49, 200–211. [Google Scholar] [CrossRef]
- Guanter, L.; Rossini, M.; Colombo, R.; Meroni, M.; Frankenberg, C.; Lee, J.-E.; Joiner, J. Using field spectroscopy to assess the potential of statistical approaches for the retrieval of sun-induced chlorophyll fluorescence from ground and space. Remote Sens. Environ. 2013, 133, 52–61. [Google Scholar] [CrossRef]
- Joiner, J.; Guanter, L.; Lindstrot, R.; Voigt, M.; Vasilkov, A.P.; Middleton, E.M.; Huemmrich, K.F.; Yoshida, Y.; Frankenberg, C. Global monitoring of terrestrial chlorophyll fluorescence from moderate spectral resolution near-infrared satellite measurements: Methodology, simulations, and application to GOME-2. Atmos. Meas. Tech. 2013, 6, 2803–2823. [Google Scholar] [CrossRef]
- Rossini, M.; Nedbal, L.; Guanter, L.; Ač, A.; Alonso, L.; Burkart, A.; Cogliati, S.; Colombo, R.; Damm, A.; Drusch, M.; et al. Red and far red Sun-induced chlorophyll fluorescence as a measure of plant photosynthesis. Geophys. Res. Lett. 2015, 42. [Google Scholar] [CrossRef]
- Sabater, N.; Alonso, L.; Vicent, J.; Cogliati, S.; Verrelst, J.; Moreno, J. A fluorescence retrieval method for the FLEX Sentinel-3 tandem mission. In Proceedings of the Workshop on Hyperspectral Imaging and Signal Processing: Evolution in Remote Sensing (WHISPERS), Lausanne, Switzerland, 24–27 June 2014.
- Rascher, U.; Alonso, L.; Burkart, A.; Cilia, C.; Cogliati, S.; Colombo, R.; Damm, A.; Drusch, M.; Guanter, L.; Hanus, J.; et al. Sun-induced fluorescence—A new probe of photosynthesis: First maps from the imaging spectrometer HyPlant. Glob. Chang. Biol. 2015, 21, 4673–4684. [Google Scholar] [CrossRef] [PubMed]
- Damm, A.; Guanter, L.; Paul-Limoges, E.; Van der Tol, C.; Hueni, A.; Buchmann, N.; Eugster, W.; Ammann, C.; Schaepman, M.E. Far-red sun-induced chlorophyll fluorescence shows ecosystem-specific relationships to gross primary production: An assessment based on observational and modeling approaches. Remote Sens. Environ. 2015, 166, 91–105. [Google Scholar] [CrossRef]
- Verrelst, J.; Rivera, J.P.; Van der Tol, C.; Magnani, F.; Mohammed, G.; Moreno, J. Global sensitivity analysis of the SCOPE model: What drives simulated canopy-leaving sun-induced fluorescence? Remote Sens. Environ. 2015, 166, 8–21. [Google Scholar] [CrossRef]
- Van der Tol, C.; Berry, J.A.; Campbell, P.K.E.; Rascher, U. Models of fluorescence and photosynthesis for interpreting measurements of solar-induced chlorophyll fluorescence. J. Geophys. Res. Biogeosci. 2014, 119, 2312–2327. [Google Scholar] [CrossRef]
- Van der Tol, C.; Verhoef, W.; Rosema, A. A model for chlorophyll fluorescence and photosynthesis at leaf scale. Agricult. For. Meteorol. 2009, 149, 96–105. [Google Scholar] [CrossRef]
- Zhang, Y.; Guanter, L.; Berry, J.A.; Joiner, J.; van der Tol, C.; Huete, A.; Gitelson, A.; Voigt, M.; Koehler, P. Estimation of vegetation photosynthetic capacity from space-based measurements of chlorophyll fluorescence for terrestrial biosphere models. Glob. Chang. Biol. 2014, 20, 3727–3742. [Google Scholar] [CrossRef] [PubMed]
- Lee, J.E.; Berry, J.A.; Van der Tol, C.; Yang, X.; Guanter, L.; Damm, A.; Baker, I.; Frankenberg, C. Simulations of chlorophyll fluorescence incorporated into the Community Land Model version 4. Glob. Chang. Biol. 2015, 21, 3469–3477. [Google Scholar] [CrossRef] [PubMed]
- Guanter, L.; Aben, I.; Tol, P.; Krijger, J.M.; Hollstein, A.; Koehler, P.; Damm, A.; Joiner, J.; Frankenberg, C.; Landgraf, J. Potential of the TROPOspheric Monitoring Instrument (TROPOMI) onboard the Sentinel-5 Precursor for the monitoring of terrestrial chlorophyll fluorescence. Atmos. Meas. Tech. 2015, 8, 1337–1352. [Google Scholar] [CrossRef]
- Kraft, S.; Bézy, J.L.; Del Bello, U.; Berlich, R.; Drusch, M.; Franco, R.; Gabriele, A.; Harnisch, B.; Meynart, R.; Silvestrin, P. FLORIS: Phase A status of the fluorescence imaging spectrometer of the Earth Explorer mission candidate FLEX. Proc. SPIE 2013, 8889. [Google Scholar] [CrossRef]
- Nichol, C.J.; Rascher, U.; Matsubara, S.; Osmond, C.B. Assessing photosynthetic efficiency in an experimental mangrove canopy using remote sensing and chlorophyll fluorescence. Trees Struct. Funct. 2006, 20, 9–15. [Google Scholar] [CrossRef]
- Mottus, M.; Takala, T.L.H.; Stenberg, P.; Knyazikhin, Y.; Yang, B.; Nilson, T. Diffuse sky radiation influences the relationship between canopy PRI and shadow fraction. ISPRS J. Photogramm. Remote Sens. 2015, 105, 54–60. [Google Scholar] [CrossRef]


| DOY | Crop | GPPA | GPPB | GPPC | GPPD | GPPE | |||||
|---|---|---|---|---|---|---|---|---|---|---|---|
| r2 | RMSE | r2 | RMSE | r2 | RMSE | r2 | RMSE | r2 | RMSE | ||
| 127 | Winter wheat | 0.92 | 1.73 | 0.95 | 1.63 | 0.94 | 1.58 | 0.97 | 1.51 | 0.93 | 1.31 |
| 176 | Winter wheat | 0.83 | 2.40 | 0.82 | 3.04 | 0.86 | 2.86 | 0.81 | 2.50 | 0.87 | 2.70 |
| 183 | Sugar beet | 0.21 | 5.56 | 0.19 | 6.00 | 0.75 | 2.26 | 0.72 | 2.37 | 0.79 | 2.13 |
| 253 | Sugar beet | 0.84 | 2.13 | 0.83 | 2.24 | 0.83 | 1.83 | 0.83 | 2.03 | 0.92 | 1.18 |
© 2016 by the authors; licensee MDPI, Basel, Switzerland. This article is an open access article distributed under the terms and conditions of the Creative Commons Attribution (CC-BY) license (http://creativecommons.org/licenses/by/4.0/).
Share and Cite
Schickling, A.; Matveeva, M.; Damm, A.; Schween, J.H.; Wahner, A.; Graf, A.; Crewell, S.; Rascher, U. Combining Sun-Induced Chlorophyll Fluorescence and Photochemical Reflectance Index Improves Diurnal Modeling of Gross Primary Productivity. Remote Sens. 2016, 8, 574. https://doi.org/10.3390/rs8070574
Schickling A, Matveeva M, Damm A, Schween JH, Wahner A, Graf A, Crewell S, Rascher U. Combining Sun-Induced Chlorophyll Fluorescence and Photochemical Reflectance Index Improves Diurnal Modeling of Gross Primary Productivity. Remote Sensing. 2016; 8(7):574. https://doi.org/10.3390/rs8070574
Chicago/Turabian StyleSchickling, Anke, Maria Matveeva, Alexander Damm, Jan H. Schween, Andreas Wahner, Alexander Graf, Susanne Crewell, and Uwe Rascher. 2016. "Combining Sun-Induced Chlorophyll Fluorescence and Photochemical Reflectance Index Improves Diurnal Modeling of Gross Primary Productivity" Remote Sensing 8, no. 7: 574. https://doi.org/10.3390/rs8070574
APA StyleSchickling, A., Matveeva, M., Damm, A., Schween, J. H., Wahner, A., Graf, A., Crewell, S., & Rascher, U. (2016). Combining Sun-Induced Chlorophyll Fluorescence and Photochemical Reflectance Index Improves Diurnal Modeling of Gross Primary Productivity. Remote Sensing, 8(7), 574. https://doi.org/10.3390/rs8070574