Article

Similarity and Error Intercomparison of the GPM and Its Predecessor-TRMM Multisatellite Precipitation Analysis Using the Best Available Hourly Gauge Network over the Tibetan Plateau

1
State Key Laboratory of Hydroscience and Engineering, Department of Hydraulic Engineering, Tsinghua University, Beijing 100084, China
2
State Key Laboratory of Hydrology-Water Resources and Hydraulic Engineering, Hohai University, Nanjing 210098, China
3
Chinese Academy of Meteorological Sciences, Beijing 100081, China
4
Department of Civil Engineering and Environmental Science, University of Oklahoma, Norman, OK 73019, USA
*
Authors to whom correspondence should be addressed.
Remote Sens. 2016, 8(7), 569; https://doi.org/10.3390/rs8070569
Submission received: 28 March 2016 / Revised: 20 June 2016 / Accepted: 30 June 2016 / Published: 7 July 2016
(This article belongs to the Special Issue Uncertainties in Remote Sensing)

Abstract

:
The performance of Day-1 Integrated Multi-satellitE Retrievals for the Global Precipitation Measurement (GPM) mission (IMERG) and its predecessor, the Tropical Rainfall Measuring Mission (TRMM) Multisatellite Precipitation Analysis 3B42 Version 7 (3B42V7), was cross-evaluated using data from the best-available hourly gauge network over the Tibetan Plateau (TP). Analyses of three-hourly rainfall estimates in the warm season of 2014 reveal that IMERG shows appreciably better correlations and lower errors than 3B42V7, though with very similar spatial patterns for all assessment indicators. IMERG also appears to detect light rainfall better than 3B42V7. However, IMERG shows slightly lower POD than 3B42V7 for elevations above 4200 m. Both IMERG and 3B42V7 successfully capture the northward dynamic life cycle of the Indian monsoon reasonably well over the TP. In particular, the relatively light rain from early and end Indian monsoon moisture surge events often fails to be captured by the sparsely-distributed gauges. In spite of limited snowfall field observations, IMERG shows the potential of detecting solid precipitation, which cannot be retrieved from the 3B42V7 products.

Graphical Abstract

1. Introduction

Reliable precipitation data and information are essential for understanding the water and energy cycles at both regional and global scales. However, accurate observation of precipitation is challenging in many remote regions of the world, such as the Tibetan Plateau (TP), due to sparse gauge networks and high spatial variability in precipitation [1,2]. Satellite remote sensing has provided unprecedented precipitation information at a broader range of time and space scales, representing a significant contribution toward mapping global rainfall [3,4,5].
The Global Precipitation Measurement (GPM) mission is an important new program designed for global satellite precipitation estimation based on an international satellite constellation, which provides precipitation measurements from space at a spatial resolution of 0.1° × 0.1° and a half-hourly temporal resolution [6]. As the successor of the highly successful TRMM, the GPM mission provides four levels of products based on various algorithms. Level 1 data consist of geolocated, calibrated Dual-frequency Precipitation Radar (DPR) power, GPM Microwave Imager (GMI) brightness temperatures and intercalibrated brightness temperatures from partner radiometers at the Instantaneous Field Of View (IFOV); Level 2 products include geolocated, geophysical data and DPR reflectivity at the IFOV; Level 3 products consist of gridded time-space sampled geophysical data (e.g., precipitation rates) from the GPM Core sensors and partner radiometers; and Level 4 products include merged remotely-sensed and model information [6]. The Integrated Multi-satellitE Retrievals for GPM mission (IMERG) was designed to create Level 3 products, a consistently calibrated global precipitation product with appropriate error and metadata information.
The intercomparison of GPM with current satellite precipitation products and corresponding analysis across the TP is urgently needed. Efforts have been made to assess the suitability of satellite precipitation products over the TP [1,7,8,9,10,11]. Previous studies found that the TMPA precipitation products outperform other satellite products (e.g., PERSIANN and CMORPH) across the plateau with lower errors and biases [9,11]. The work in [9] showed that Global Precipitation Climatology Center (GPCC) gauges employed in the post-real-time TMPA system significantly improve the data accuracy. The work in [11] also confirmed that due to the monthly gauge adjustments, the research products of TMPA exhibit great hydrological potential at both monthly and daily scales over the TP. The work in [12] showed that the latest 3B42 Version 7 (3B42V7) clearly improves upon 3B42V6 over China in terms of daily mean precipitation. Here, the TMPA 3B42V7 product of the best performance is selected to compare to the GPM IMERG product.
Despite the aforementioned studies, the newly-launched GPM satellite-based precipitation estimates warrant evaluation over the TP urgently because: (1) the similarity and differences of GPM Day-1 IMERG and TMPA 3B42V7 rainfall products should be investigated; (2) error analysis at the sub-daily scale is seldom performed; and (3) impacts of elevation and latitude on satellite rainfall estimates should be thoroughly explored.
In the cold season (i.e., October to the next March), snowfall occurs frequently across the TP [13,14]. Figures S1 and S2 also show snowfall regimes (including snowfall occurrence and amounts) retrieved from the IMERG product for the period October 2014–March 2015. Moreover, the automatic gauge network is generally switched off from October to the next March on the TP [15]. Thus, this study focuses on the error analysis and comprehensive assessments of GPM-era Day-1 IMERG and TRMM-era 3B42V7 products only in the warm season of 2014 over the TP. In order to understand solid precipitation regimes from IMERG on the TP, we perform an initial comparison with the field snowfall experiment at a site in the northeastern TP. Results of this study are expected to promote the improvement of future versions of the IMERG algorithms.
This paper is organized as follows: Section 2 provides the details of the study area, dataset and method. Section 3 and Section 4 present error analysis and the discussion, as well as constructive suggestions for the IMERG algorithm over regions of complex terrain and high elevations. The main conclusions and future work are provided in Section 5.

2. Materials and Methods
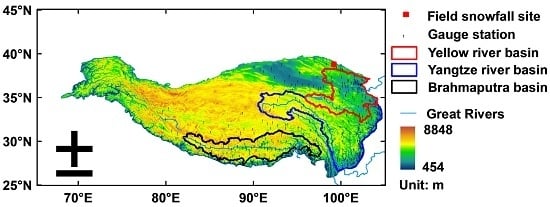
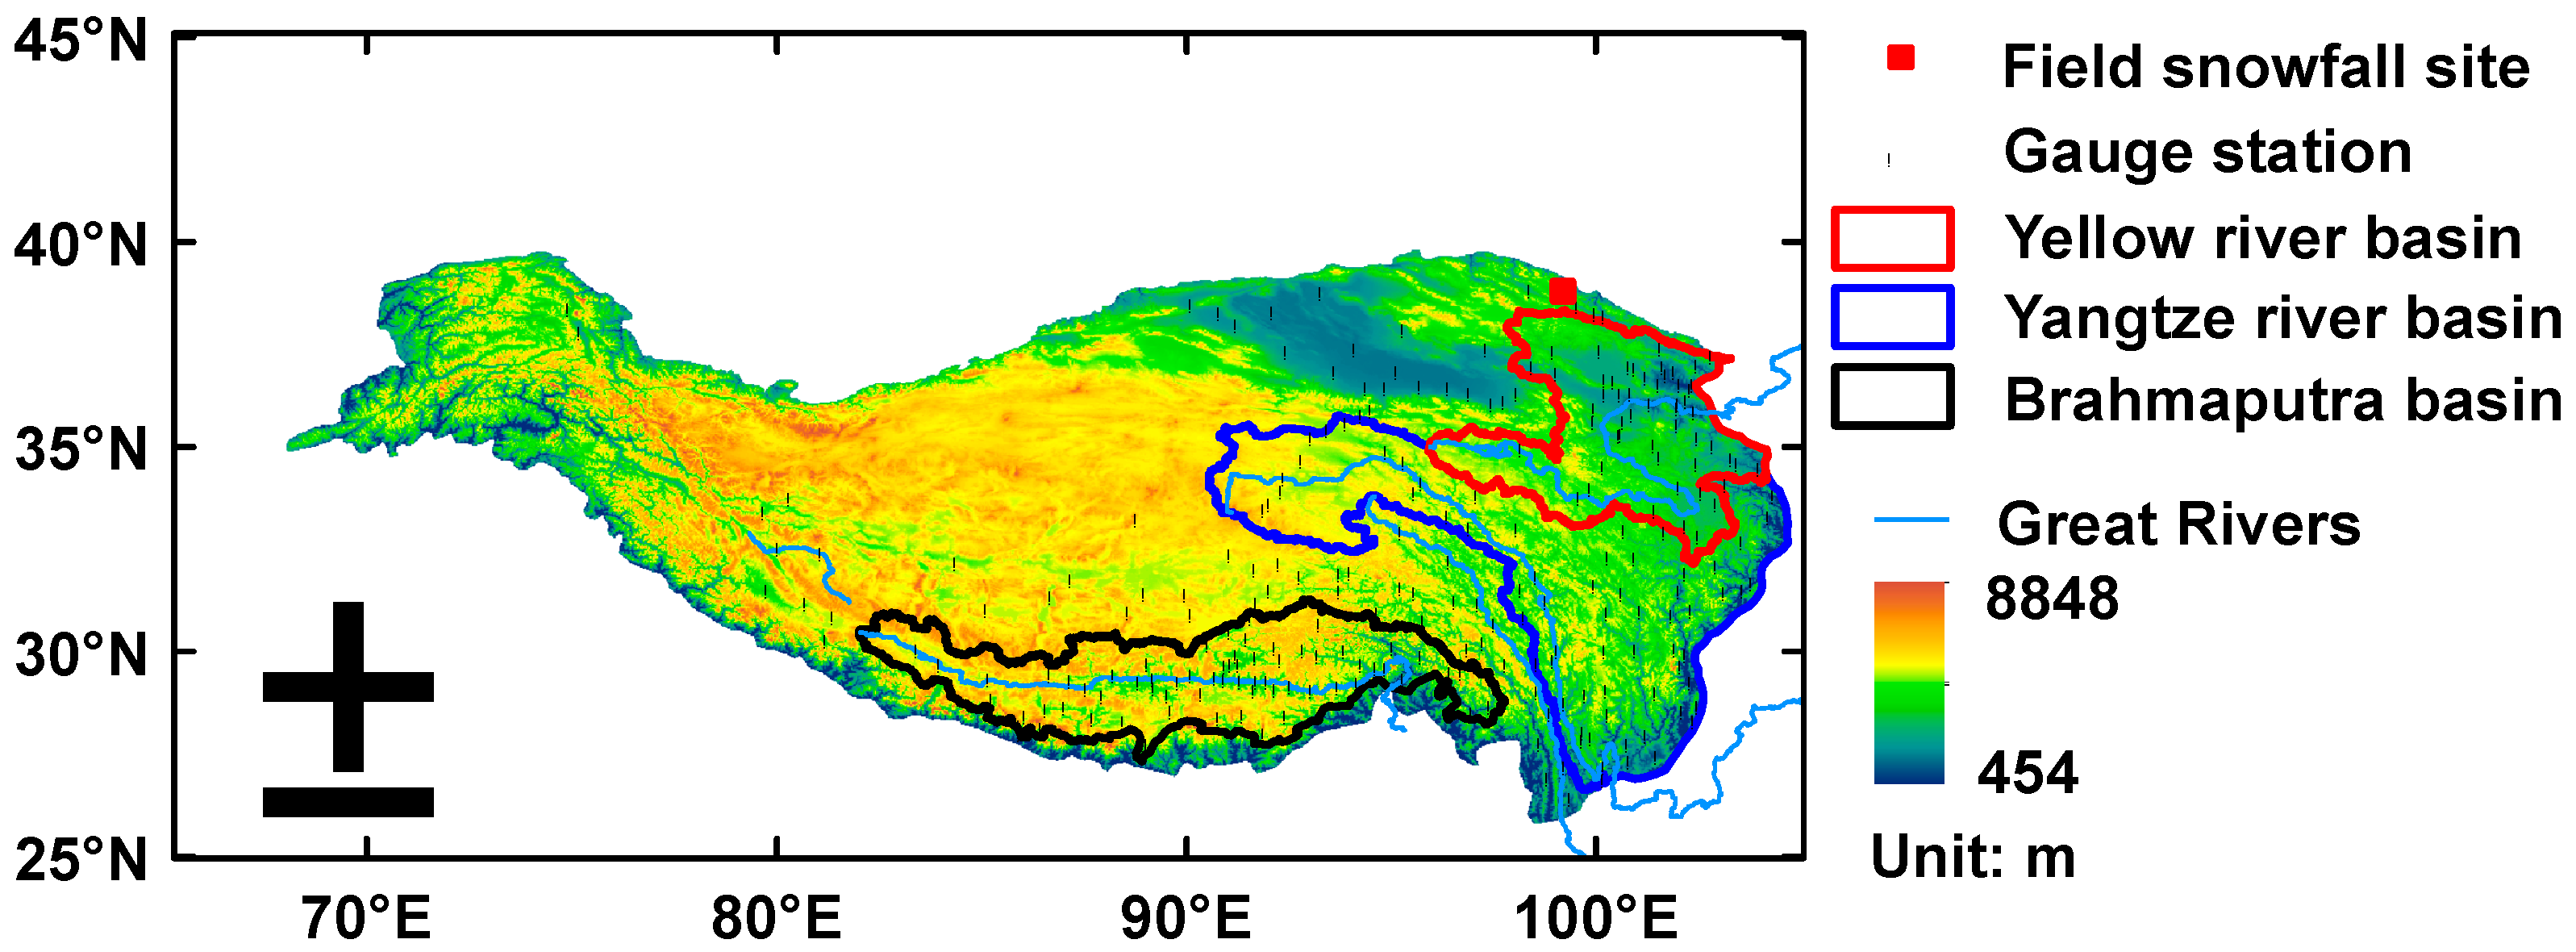
2.1. Study Region

The TP, with a mean elevation of more than 4000 m above sea level (a.s.l.), is the highest and largest plateau in the world. Topography plays a vital role in the formation of distinct local climates and environments ranging from forests to alpine grassland across the whole plateau [16]. The TP is also subjected to the effect of multiple climate systems. Atmospheric circulation patterns over the TP are primarily characterized by the Indian monsoon in the warm season and the mid-latitude Westerlies in the cold season [17]. Moreover, the TP is Asia’s water tower, being the source region of many major rivers in the Asian continent, e.g., the Brahmaputra, Yellow, Yangtze, Mekong, Salween, and Indus Rivers. The three watersheds (i.e., Brahmaputra, Yellow and Yangtze Rivers) totally within China’s territory are selected for basin-scale error analysis (Figure 1).

2.2. Satellite Retrievals and Gauge Data

High-resolution IMERG precipitation products have been released since mid-March 2014. It is necessary and urgent to conduct a comprehensive assessment all over the world, especially in areas with complex terrain and climates, such as the TP. A detailed description of IMERG is provided in [6,18]. In this research, we use the very early Day-1 stage of the IMERG “Final run” product. The IMERG data are downloaded from the GPM website [19]. The IMERG algorithm is designed to intercalibrate, merge and interpolate all possible satellite microwave precipitation estimates, accompanied with microwave-calibrated infrared satellite estimates, gauge precipitation analyses and other potential precipitation estimators at reliable temporal and spatial scales [18]. In order to retrieve precipitation from the GPM constellation, the 2014 version of the Goddard Profiling Algorithm (GPROF2014) was used and then gridded, intercalibrated to the GPM Combined Instrument product with a 0.10 degree scale [18]. The CMORPH Kalman Filter Lagrangian time interpolation scheme [20] and PERSIANN-CCS re-calibration scheme [21] were also provided in the computation routines.
As the predecessor to GPM, the TMPA system produces estimates of quasi-global rainfall (50° N–50° S) at relatively fine resolutions (0.25° × 0.25°, 3 h) [22]. TMPA provides two standard products, i.e., near-real time and post-real time, which have been widely utilized in hydrological and climatic studies, e.g., [23,24,25]. In this study, we use the latest TMPA 3B42V7 product.
The rain gauge network used for validation comprises 258 automatic gauges over the whole TP (Table S1). The used hourly gauge data are available from China’s hourly gauge network, which consists of a total of ~2000 automatic weather stations distributed across China [15]. Hourly precipitation is observed by siphon or tipping-bucket rain gauges and recorded automatically. Hourly precipitation reports from these stations are transferred to China Meteorological Administration (CMA). Because all the stations used are automatic observation systems, and we do not have the bias-adjusted precipitation procedure for automatic rain gauges, the precipitation undercatch is not considered in this study. However, all of the gauge data have undergone strict quality control in three levels by CMA, including: (1) the extreme values’ check; (2) internal consistency check; and (3) spatial consistency check [26]. The quality-controlled hourly gauge data are used widely for satellite precipitation estimation and high spatiotemporal gauge-satellite precipitation integration in mainland China [10,15,27]. To our best understanding, this is the best hourly rainfall observational dataset over the study region. We have some other gridded rainfall datasets, for instance, China Gauge-based Daily Precipitation Analysis (CGDPA). However, this is based on a daily scale that does not meet our requirement for evaluation at the sub-daily scale.
In terms of the independence of the intercomparison between gauge- and satellite-based data, there are 19 GPCC stations used for bias adjustment or the update of TRMM/GPM research level products over the TP, accounting for a very small portion of the total gauges (~7%) (Table S1). Therefore, the evaluation and comparison of GPM and TRMM are based on ~93% independent gauge stations. In addition, both TRMM and GPM products combine GPCC gauge data at the monthly scale [18,22], while the analysis of two satellite products are performed at the sub-daily scale.
Considering data availability and quality, this study uses the best hourly gauge data covering the warm period from 1 April–30 September 2014. Among all of the stations, there are 52 in the Yellow River basin, 66 in the Yangtze River basin and 69 in the Brahmaputra basin. The gauge densities in the Yellow River, Yangtze River and Brahmaputra basins are 2.01 and 1.34, 1.78 per ten thousand square kilometers, respectively. Moreover, a field snowfall experiment from April 2014–February 2015 at a site (99°52′54″ E, 38°16′06″ N, 2980 m) of the northeastern TP (Figure 1) was performed by [28], and the data are used for IMERG snowfall error analysis. Details of the field site information can be found from [28].

2.3. Evaluation Indicators

To better evaluate the satellite rainfall products over the TP, several statistical indices were selected, including Relative Bias (RB), Standard Deviation (SD), Root Mean Square Error (RMSE), and Correlation Coefficients (CC). Moreover, the Probability Of Detection (POD) and False Alarm Ratio (FAR) were calculated to check the appearance possibility of rainfall events from satellite products. The definitions of the indicators are as follows:
R B = n = 1 N ( f n r n ) n = 1 N r n × 100 %
S D f = 1 N n = 1 N ( f n f ' ) 2
R M S E = 1 N n = 1 N [ ( f n r n ) ] 2
C C = 1 N n = 1 N ( f n f ) ( r n r ) S D f S D r
P O D = H H + M
F A R = F H + F
where N is the number of samples; f n and f stand for individual and averaged satellite rainfall estimates; r n and r indicate individual and averaged gauge-based measurements, respectively. H represents the observed rain by gauge, which is detected by satellite correctly, while M is the observed rain not detected, and F is not the observed rain, but detected falsely. The detailed information of the evaluation indices can be found in [29,30].

3. Results

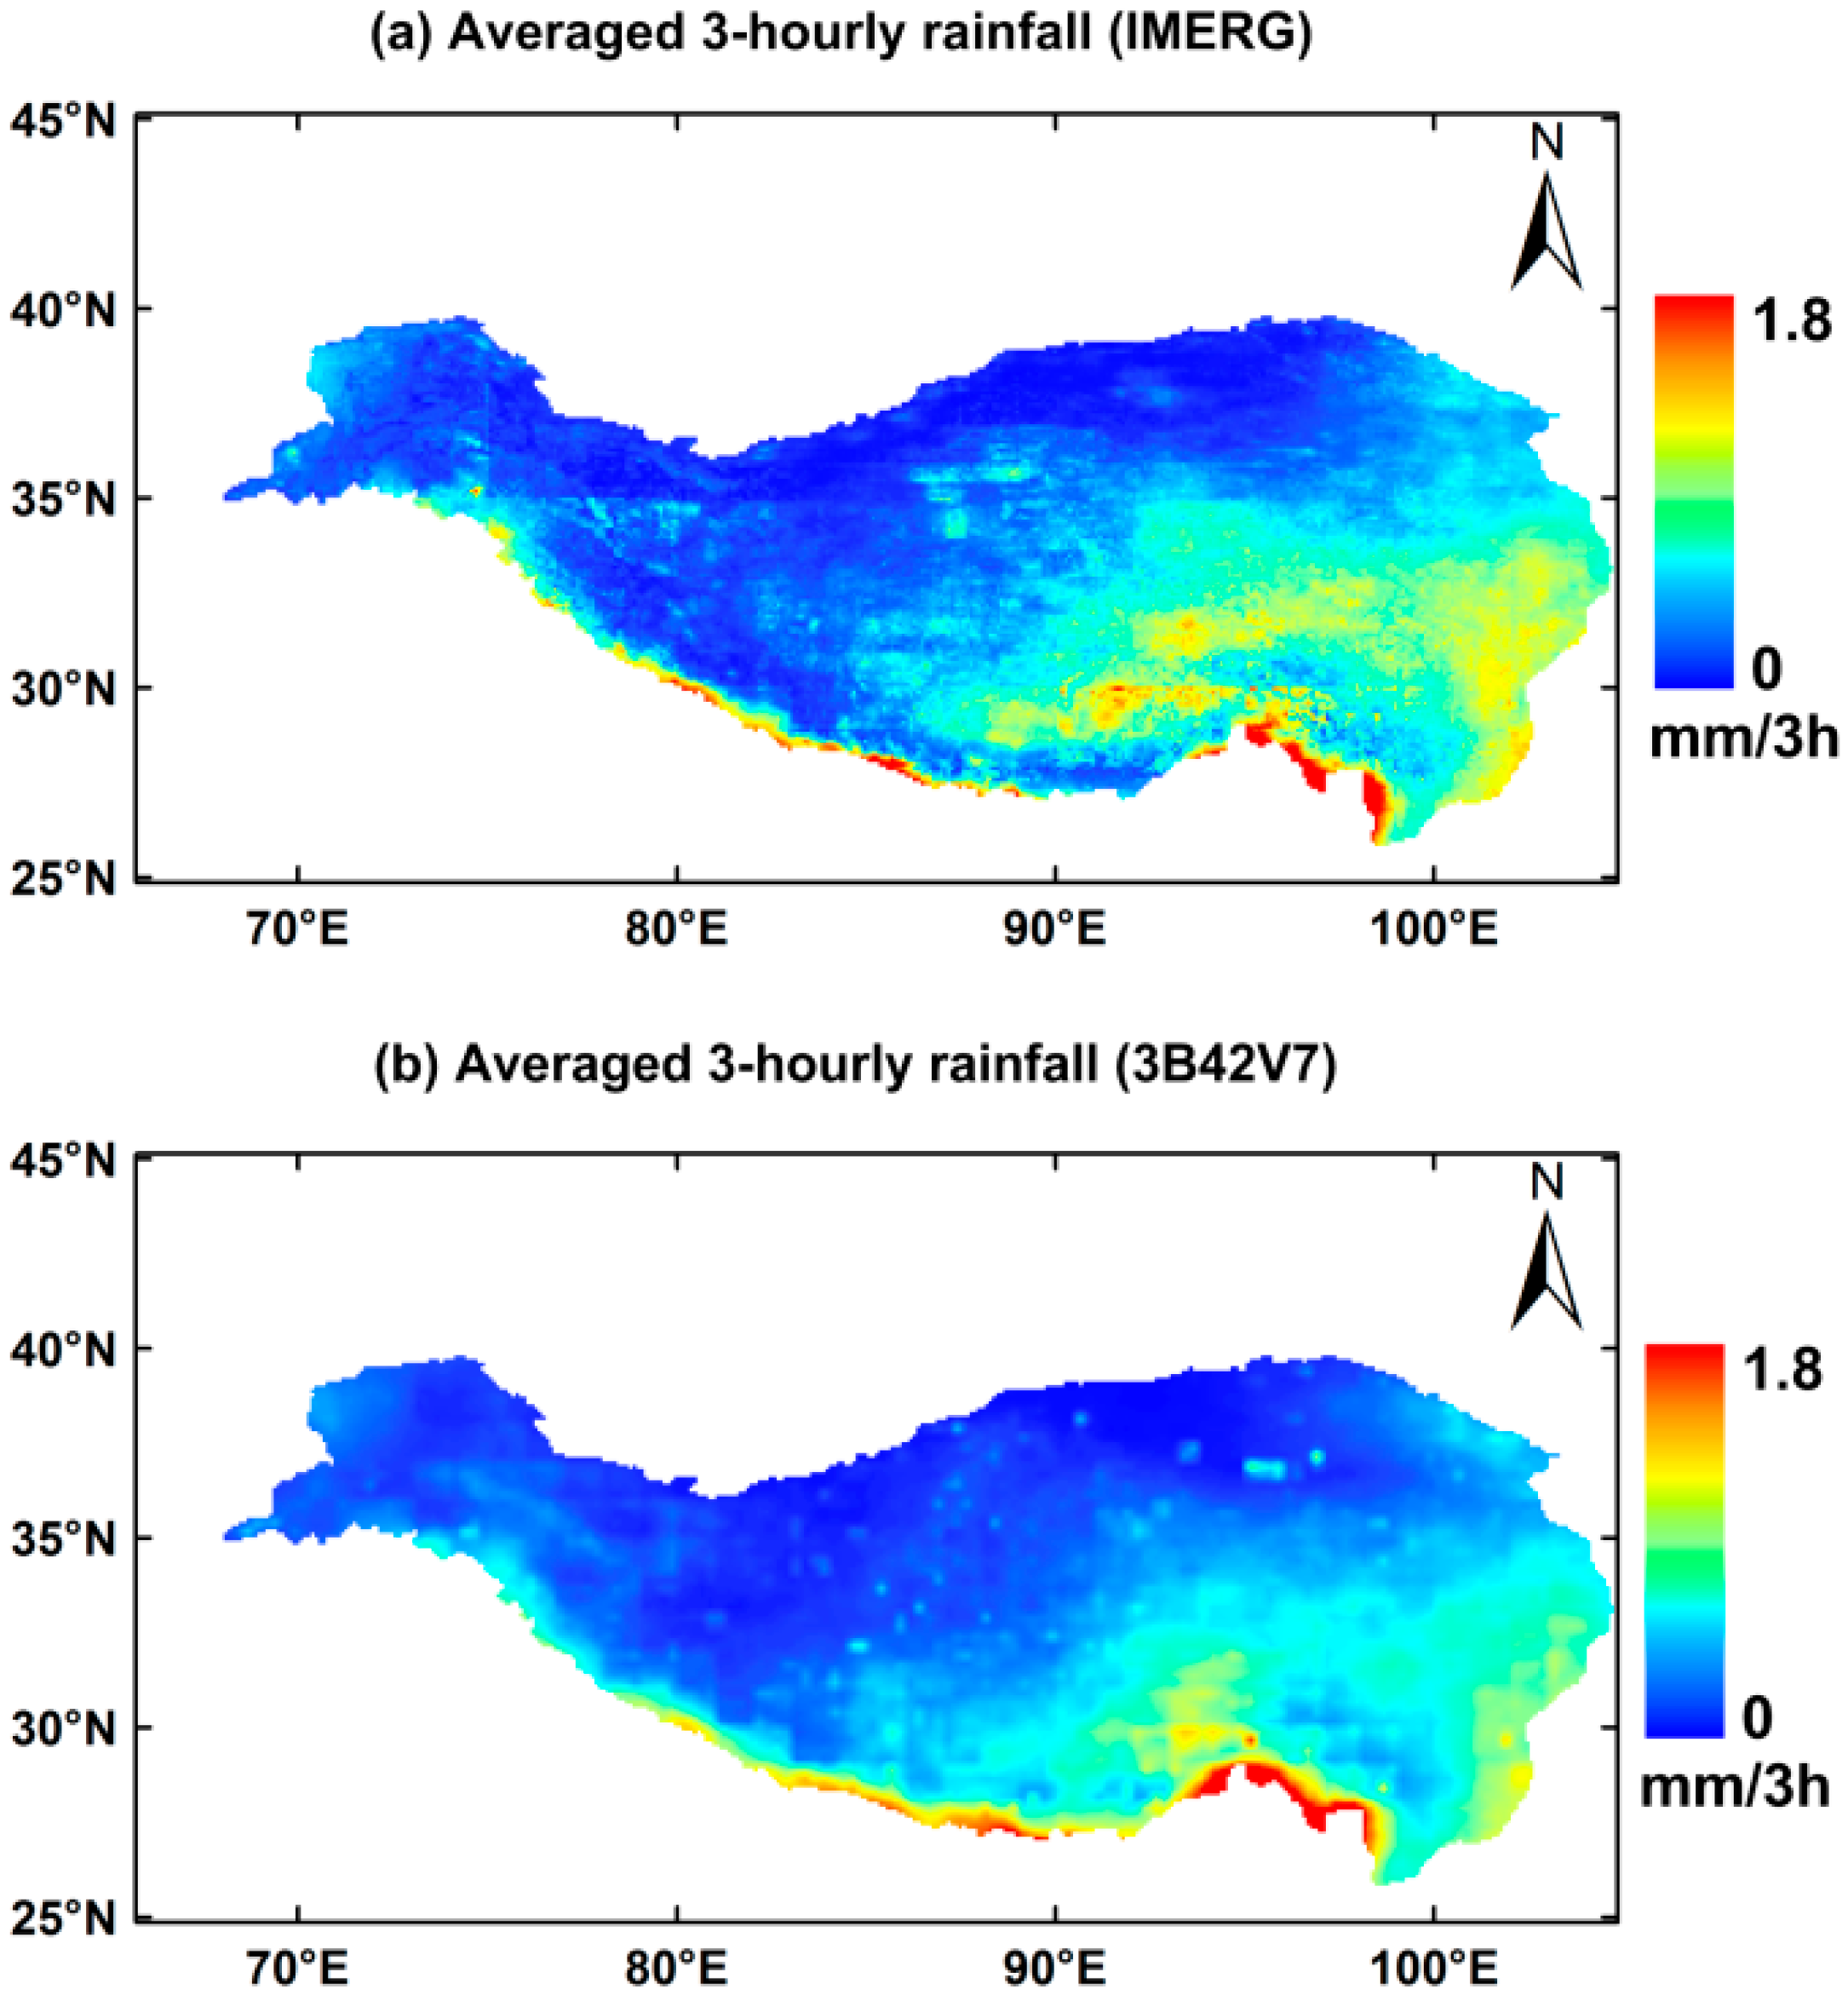
3.1. Similarity of Spatial Rainfall Patterns

Figure 2 describes spatial patterns of average three-hourly IMERG and 3B42V7 rainfall estimates in the warm season (from April–September) of 2014 over the TP. Both products show a decreasing trend from the southeast to the northwest over the plateau, which are generally consistent with other satellite products (e.g., 3B42RT, CMORPH and PERSIANN) [9,10,11]. The average accumulated rainfall in the warm season of 2014 is 347 mm over the whole plateau, and the maximum rainfall primarily occurs in the Himalayan region with a value of 2609 mm. In contrast, most parts of the west and north show lower values, where the Westerlies do not prevail and the Indian monsoon is relatively weaker during the warm period [17].

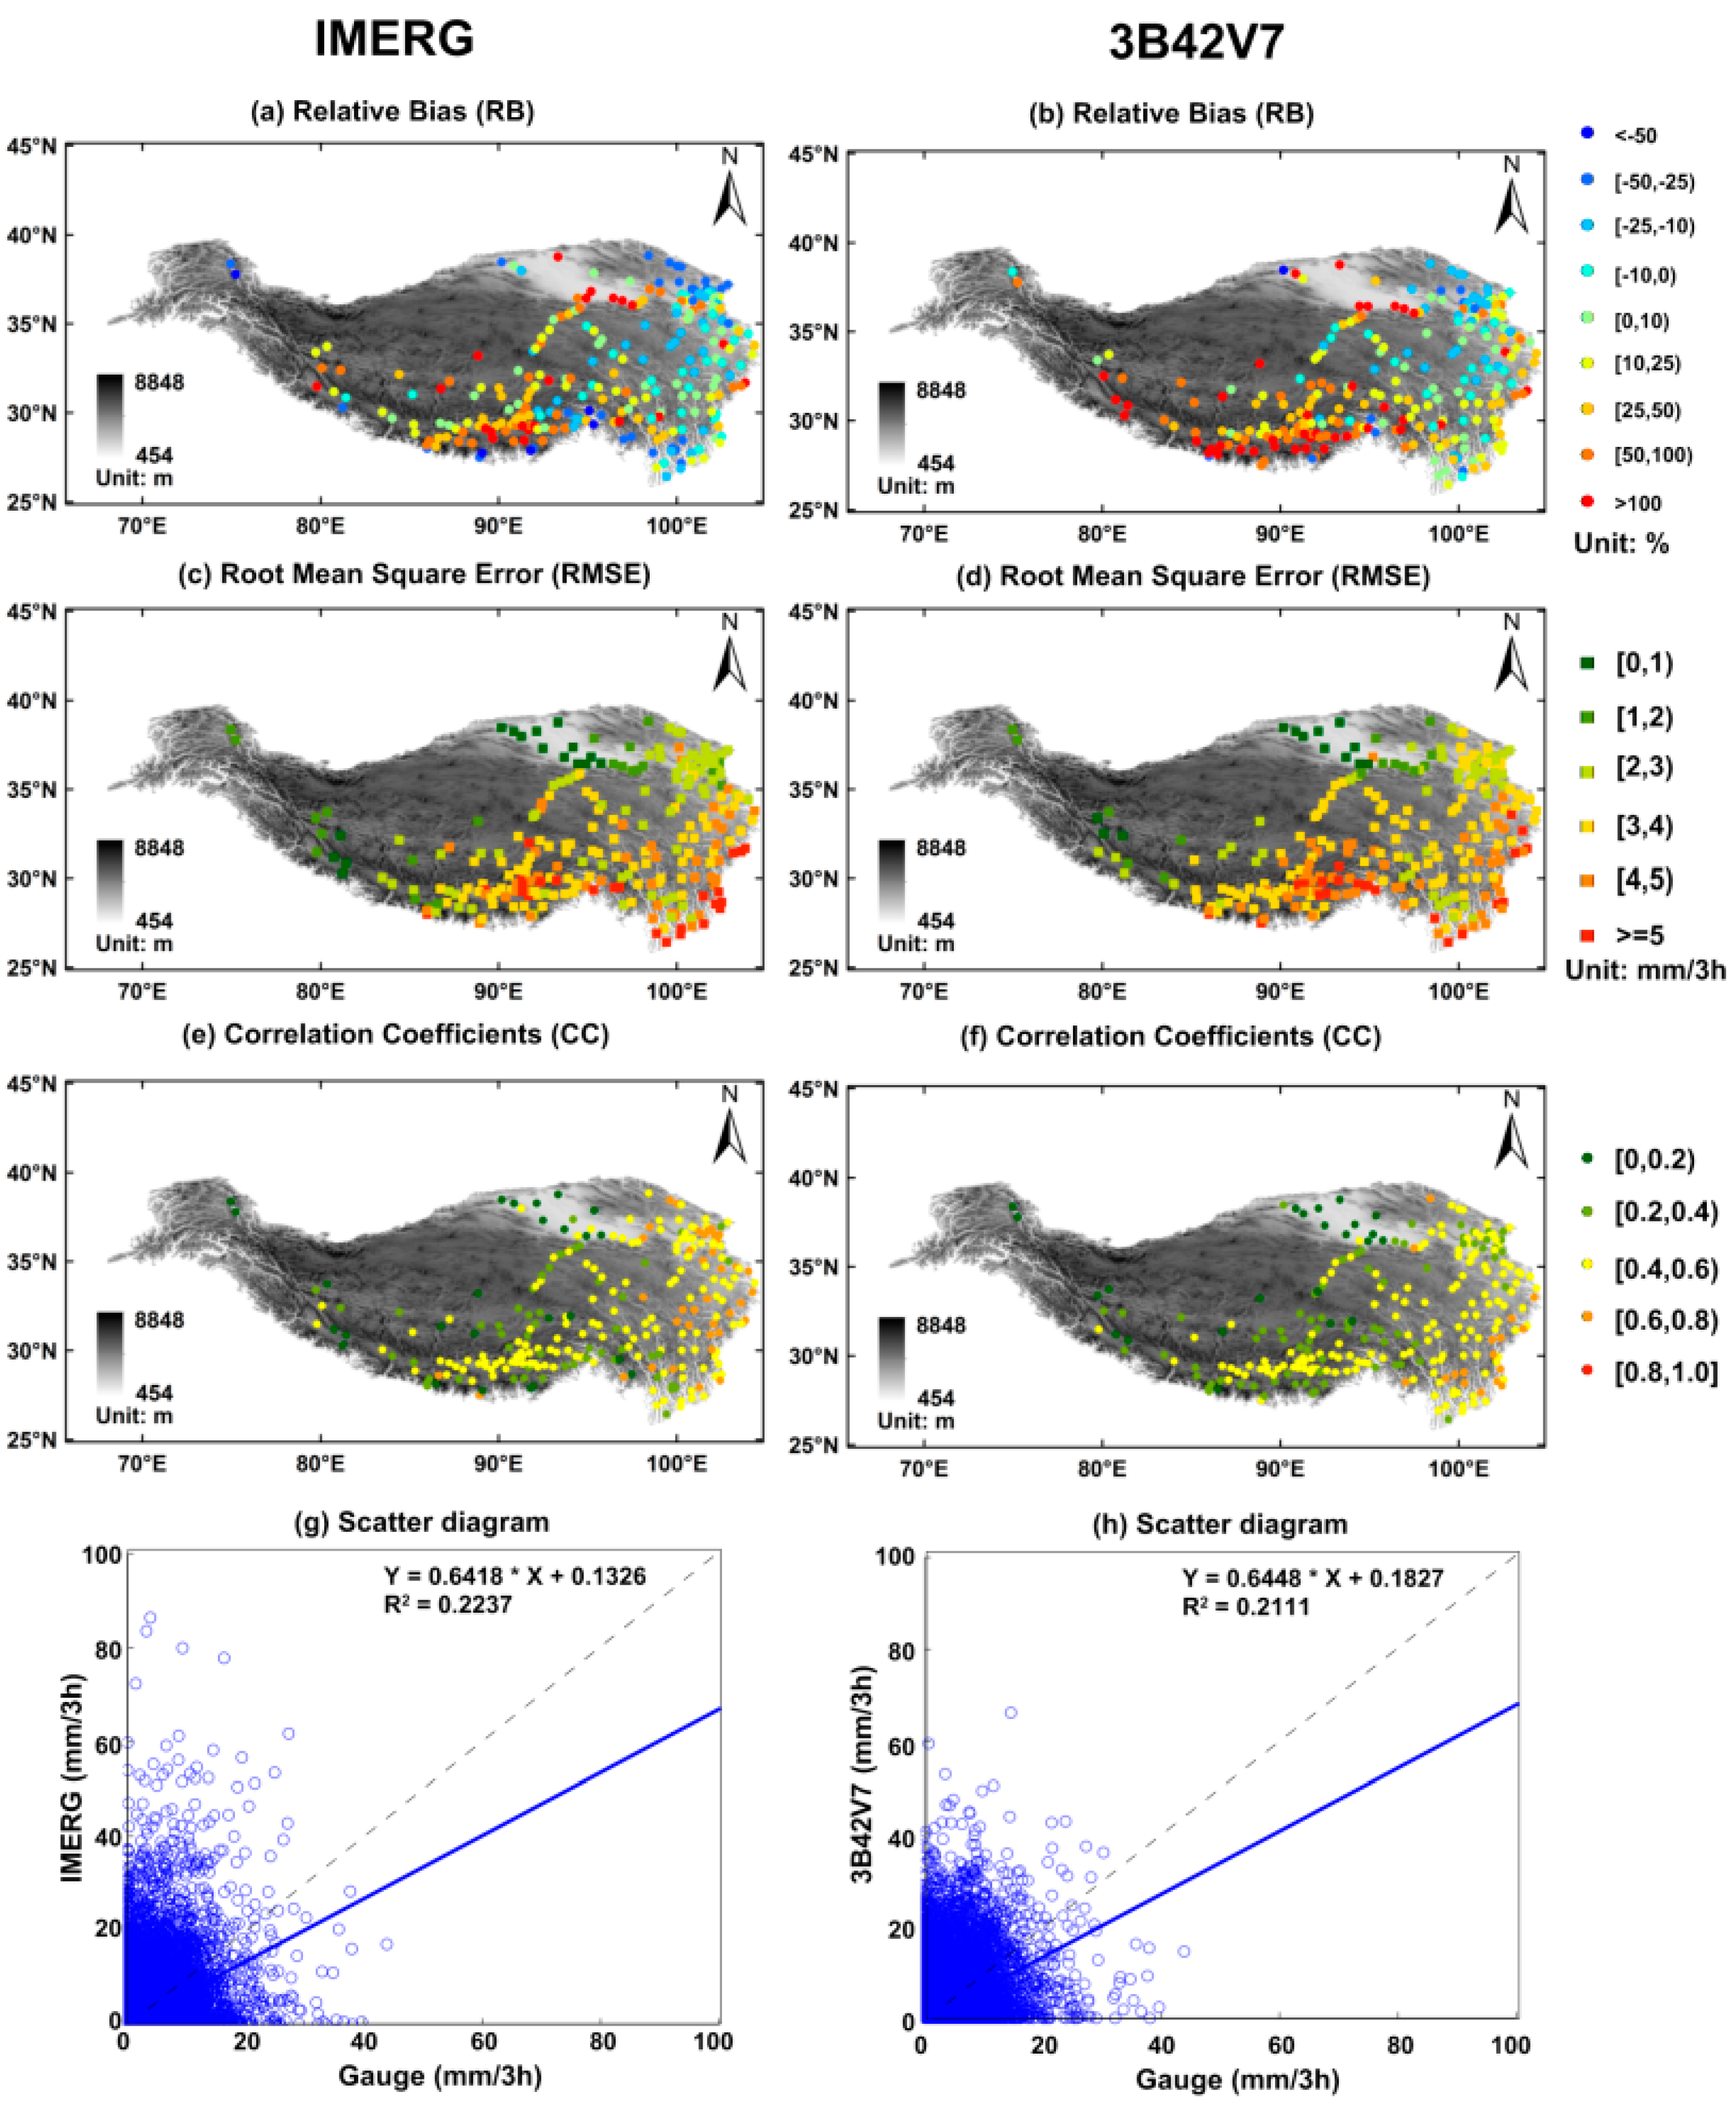
3.2. Pixel-Scale Error Intercomparison

To ensure proper error analysis at the grid cell scale, we firstly check the specified location or pixel for each rain gauge and then evaluate the spatial-temporally coincident satellite pixel with corresponding gauges over the TP. Note that the zero-event records are not considered as the rainfall events during the calculation.
In general, the IMERG product showed a limited capability in estimating hourly rainfall in the warm season of 2014, with the averaged CC of 0.32 for all gauges across the TP (Table 1). Higher CC was observed in the northeast and southeast TP (Figure 3). Along the Himalayas (i.e., the southern part of the TP), CC was smaller with the mean value less than 0.40. The weaker correlation was attributed to the complex topography in the Himalayas, which might influence the retrieval of satellite precipitation [10]. In spite of higher elevation (i.e., more than 4000 m a.s.l.) in the central TP, the mean CC was more than 0.60.
At the three-hourly scale, IMERG and 3B42V7 showed similar RB, RMSE and CC patterns in space across the TP (Figure 3). Both of them showed overestimation in the south and west and underestimation in the northeast. However, several negative RB values of IMERG rainfall estimates were detected along the southern boundary of the TP, whereas 3B42V7 generally showed positive RB values. In addition, lower absolute RB values were mainly distributed in the eastern TP for both products at the three-hourly scale. Over the plateau, both IMERG and 3B42V7 showed overall overestimation of 28.1% and 48.6% at the three-hourly scale, respectively. As for RMSE, both products decreased gradually from the southeast to northwest across the TP, with averaged values of 3.26 mm (IMERG) and 3.47 mm (3B42V7), respectively (Table 1). 3B42V7 showed slightly worse agreement with gauge data than IMERG, with the CC value of 0.42 at the three-hourly scale. Spatially, the CC values for both products were generally higher in the east than those in the west.

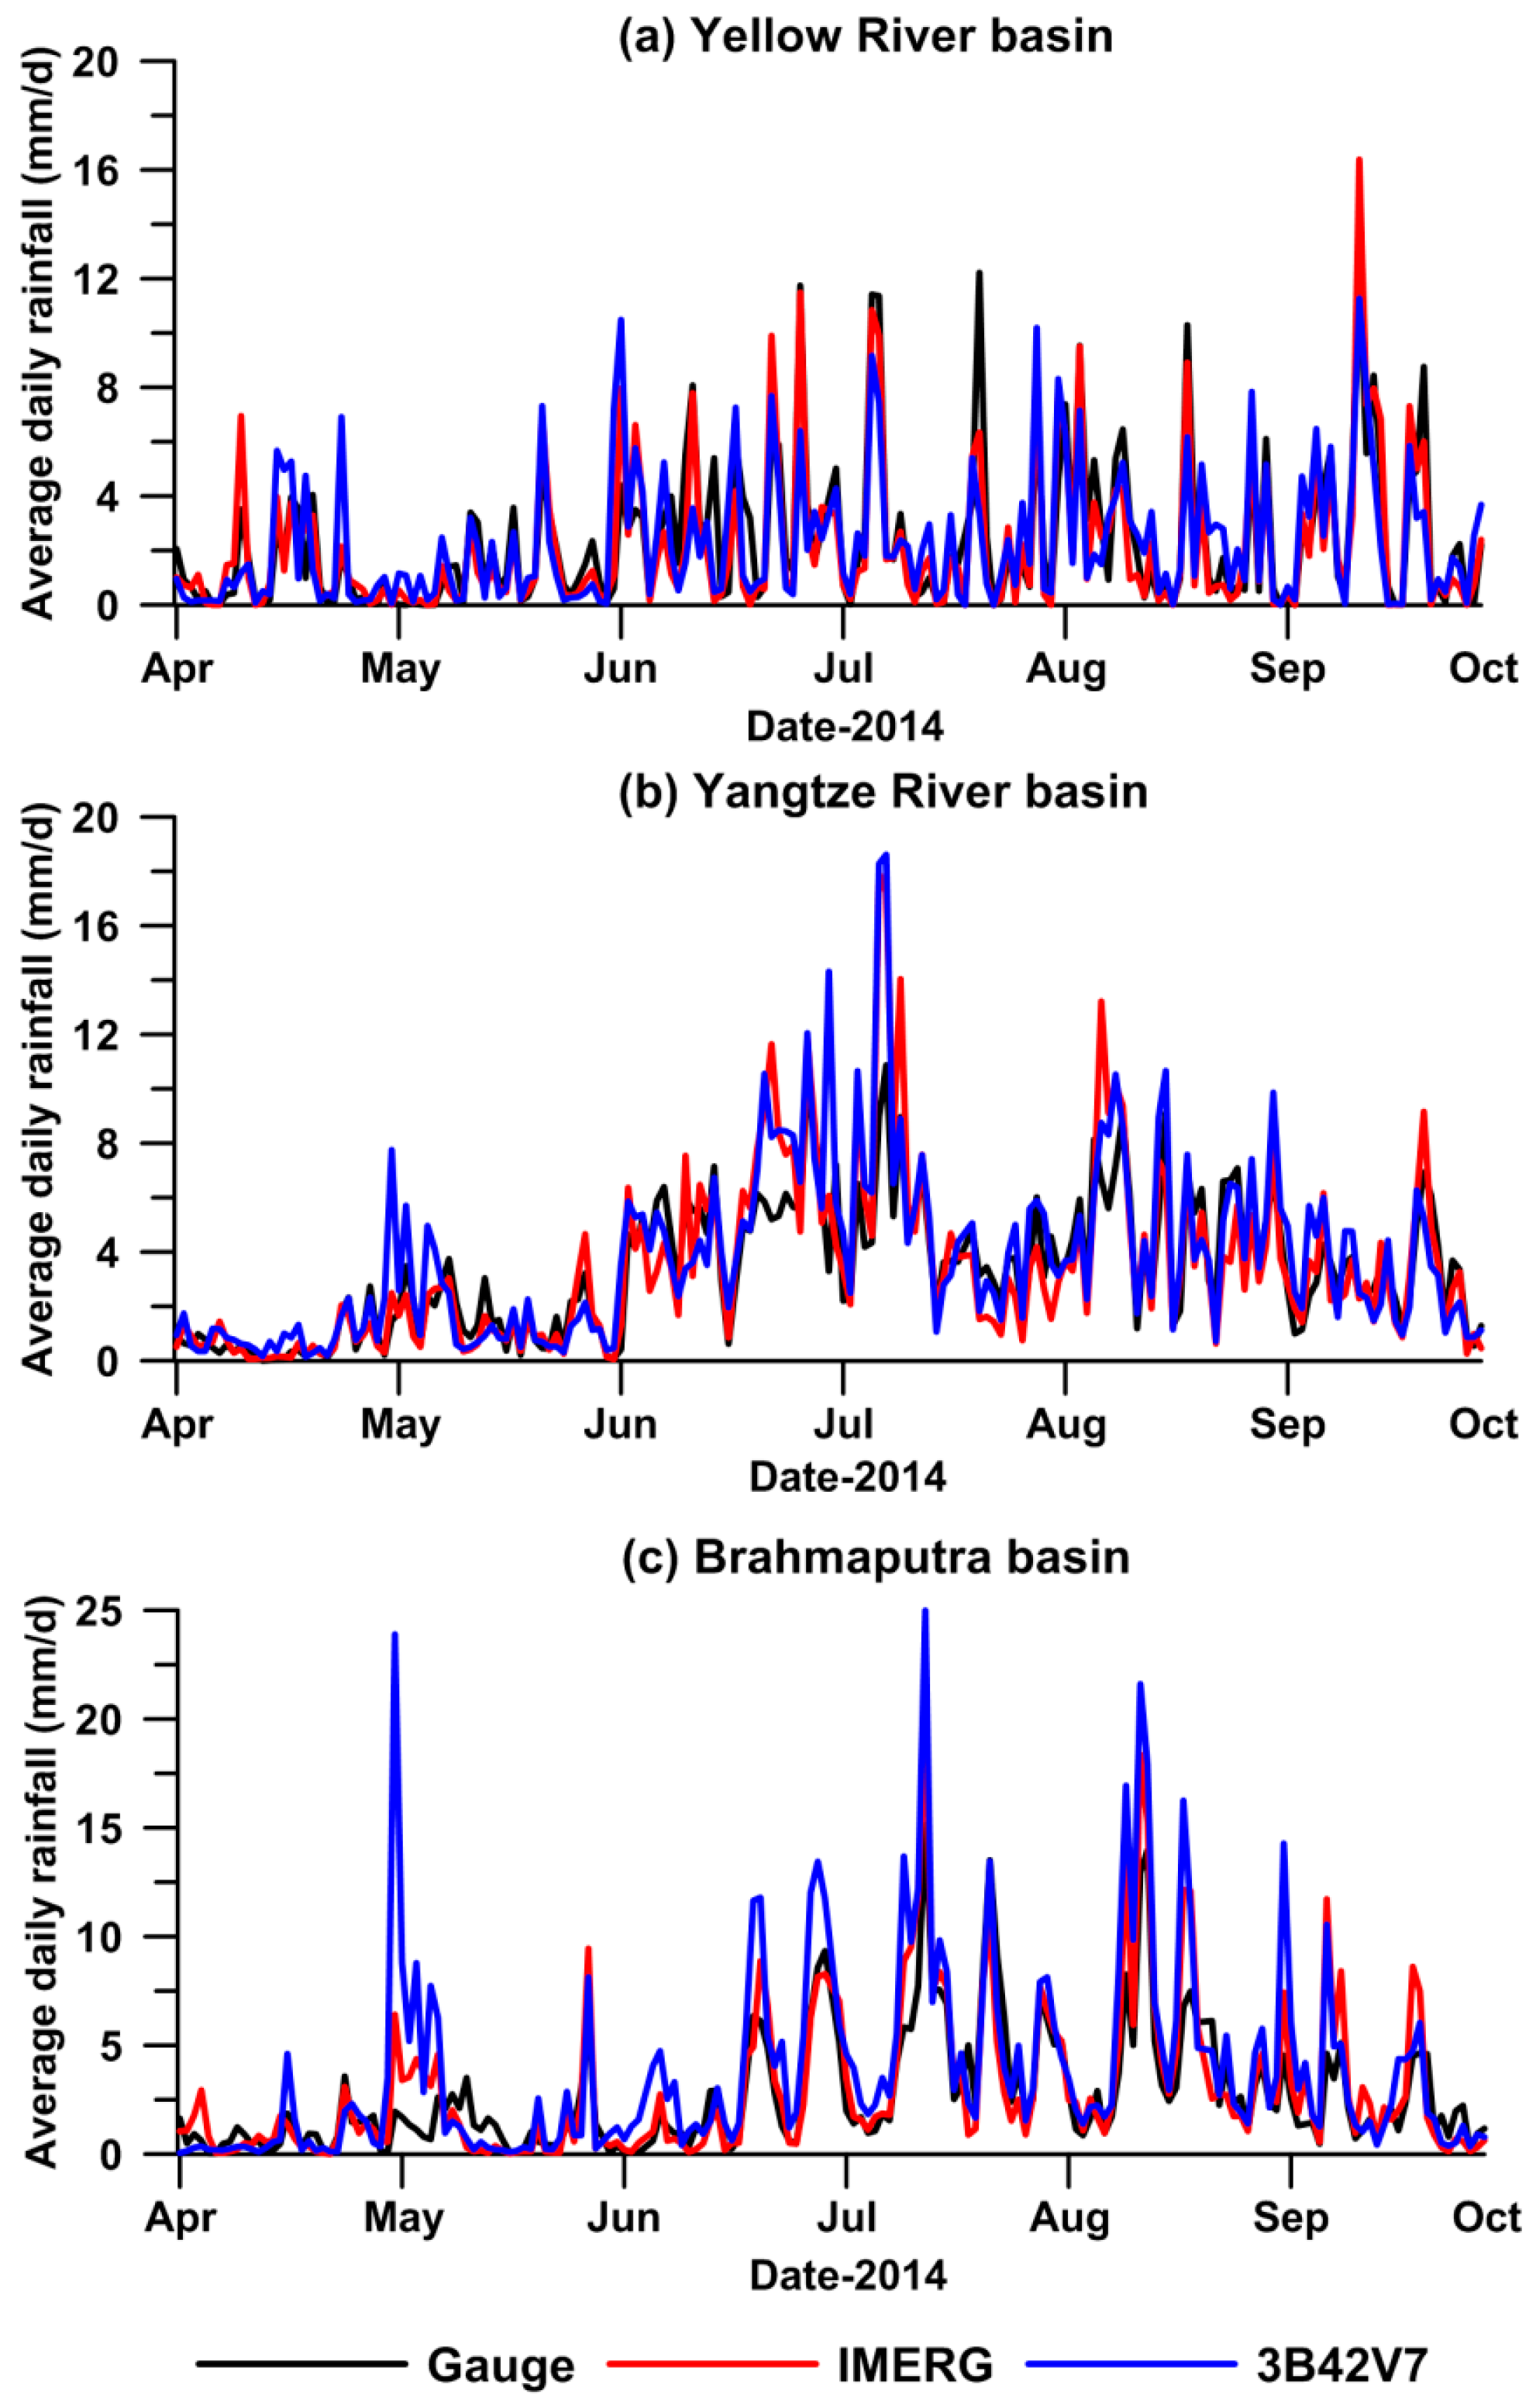
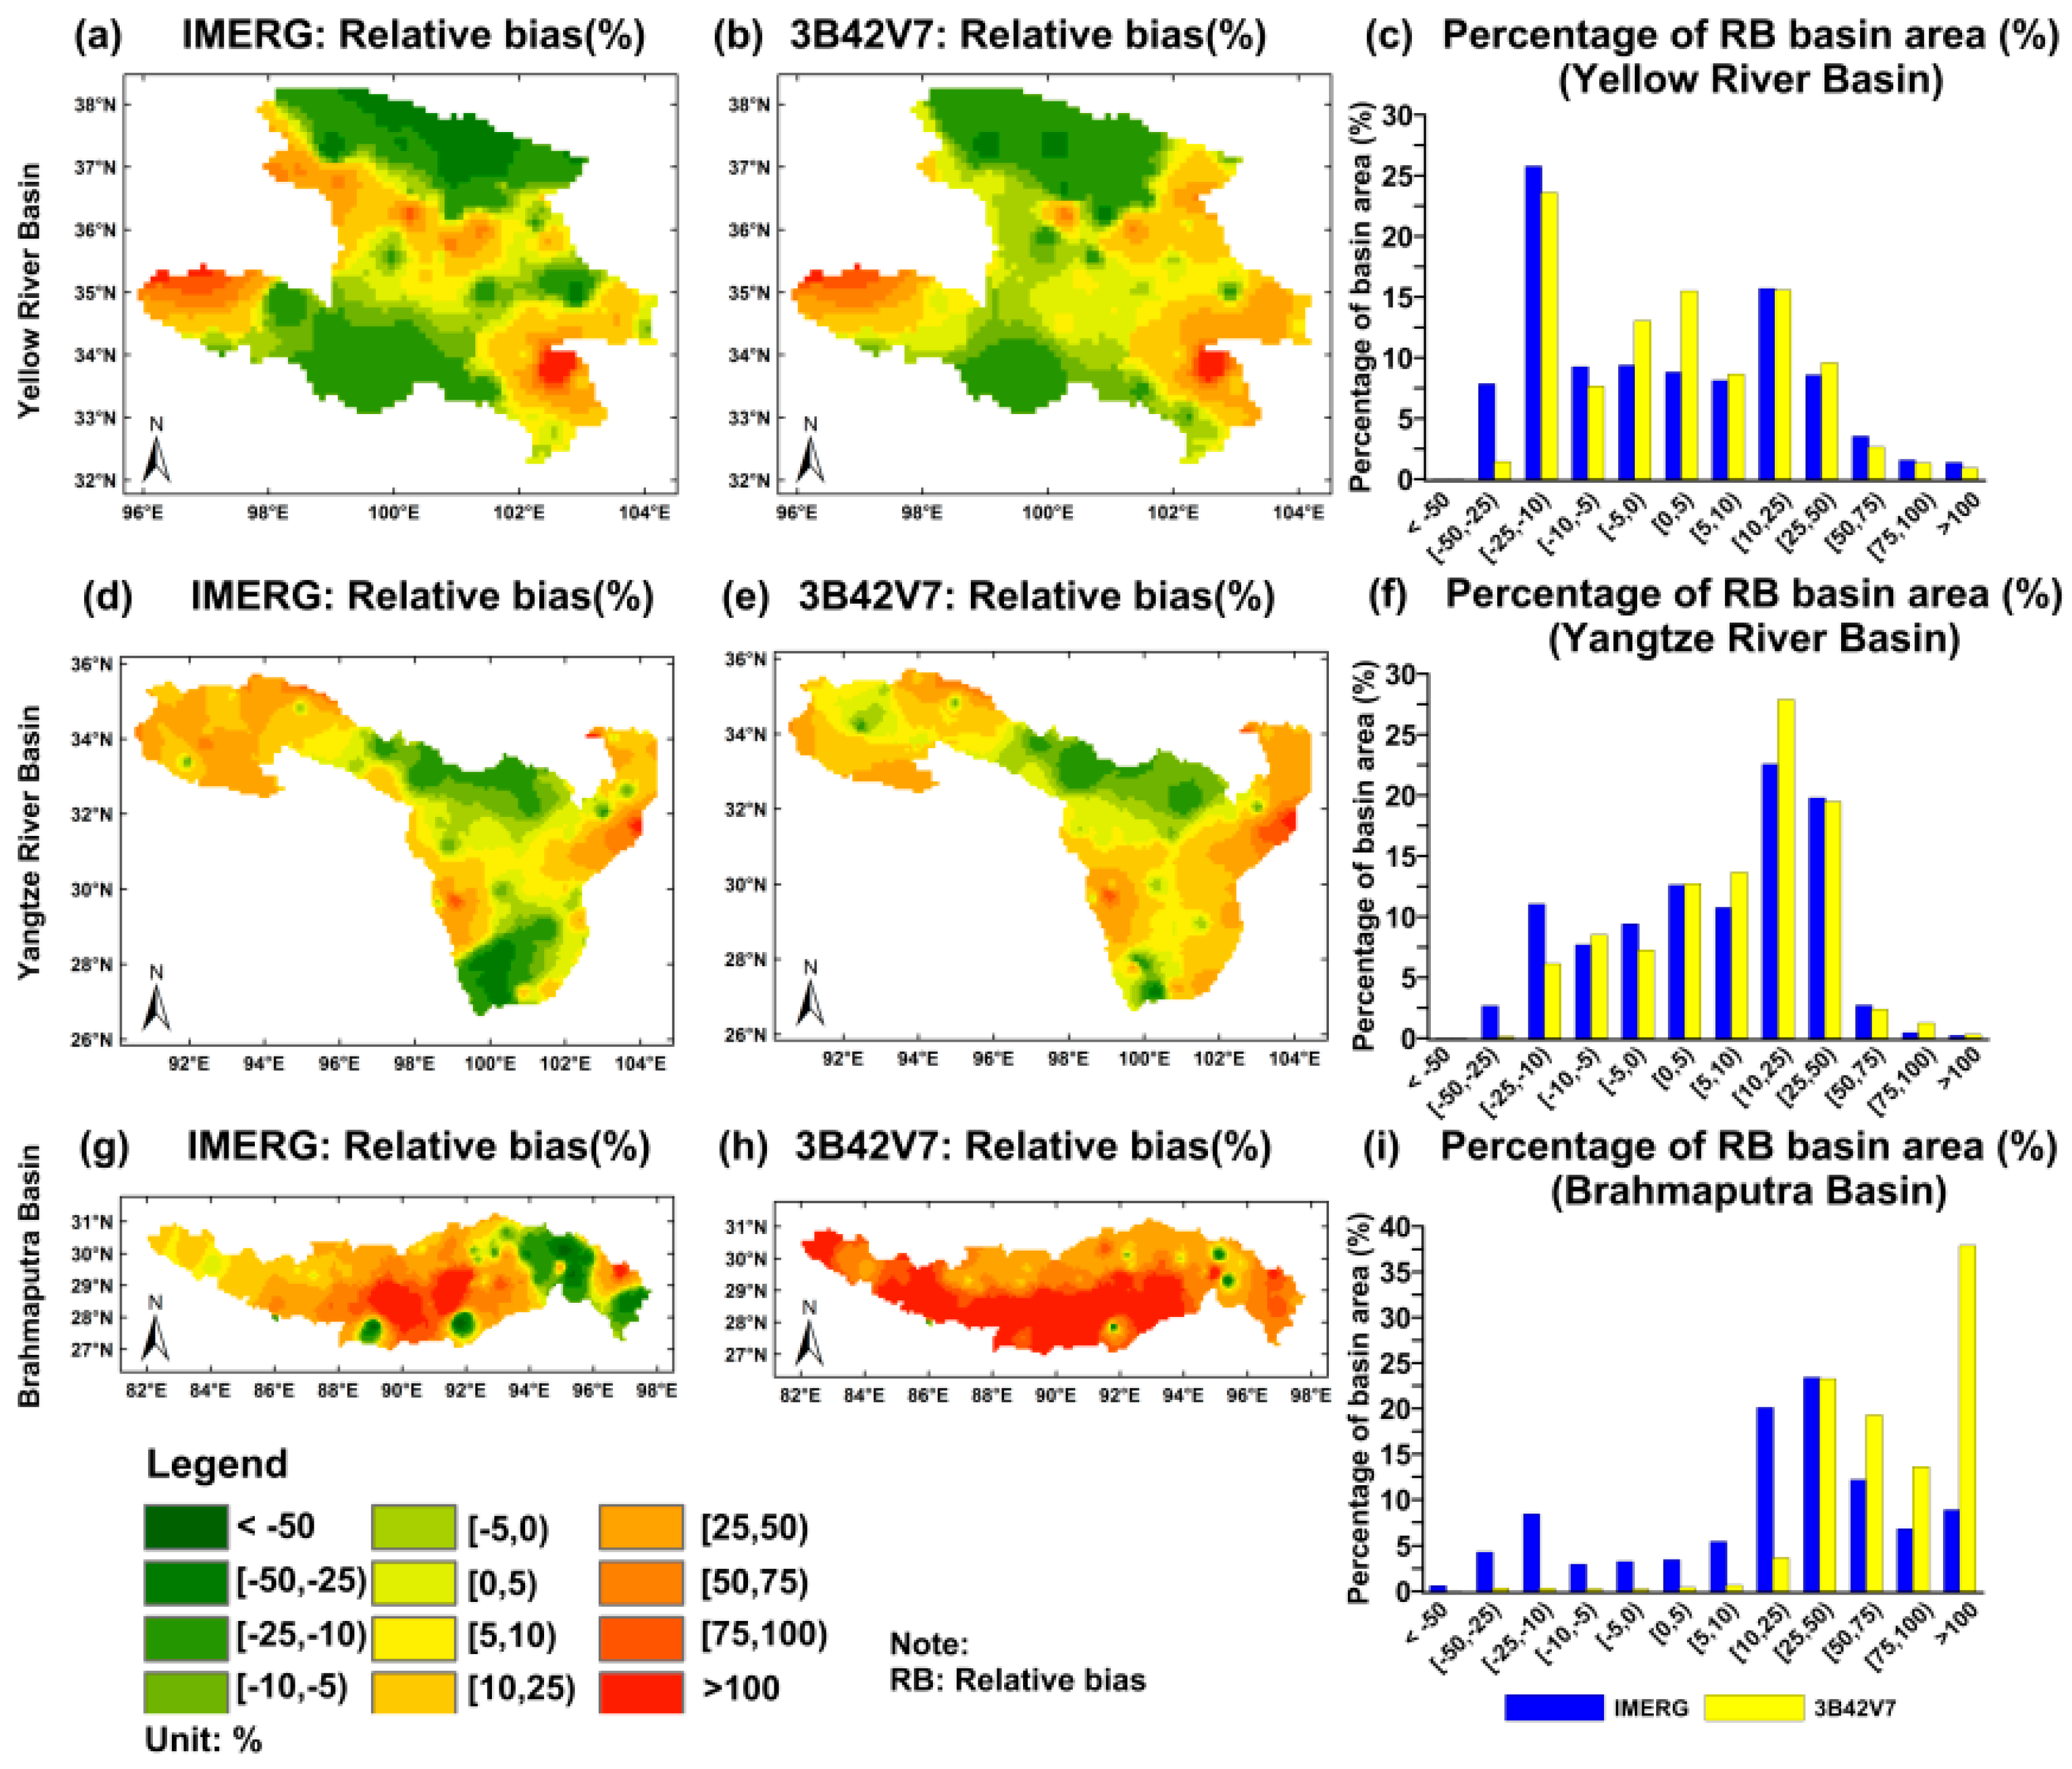
3.3. Basin-Scale Error Intercomparison

To facilitate direct comparison between IMERG and 3B42V7 products, the spatial resolutions of gauge- and satellite-based products should be consistent firstly. The gauge data available in each basin (including the Yellow, Yangtze and Brahmaputra basins) were initially interpolated to a 0.10° grid with the Inverse Distance Weighting (IDW) method, which had been shown to be reliable and efficient in many previous basin-scale studies [11,31,32,33,34]. In order to make the different data comparable, the 3B42V7 data were resampled to the 0.10° × 0.10° resolution, the same as IMERG and the interpolated gauge data, by using the standard bilinear interpolation method [35]. We adopt a consistent common 0.10° grid cell for both satellite rainfall comparison and validation. Note that potential errors would possibly be introduced during the resampling procedure.
At the three-hourly scale, both IMERG and 3B42V7 showed similar bias patterns and bias ratio distribution in the Yellow and Yangtze River basins (Figure 4). In the Yellow River basin, the two products showed apparent underestimation in the north and south parts and overestimation in the other parts (e.g., central and southeast); whereas in the Yangtze River basin, both showed overestimation in the west and east and underestimation in the central part. Furthermore, IMERG showed lower biases than 3B42V7 for both the Yellow and Yangtze River basins. The averaged RB values in the Yellow River basin were 3.7% and 5.8% for IMERG and 3B42V7, respectively. In the Yangtze River basin, the RB values were 10.8% (IMERG) and 13.8% (3B42V7), respectively. In the Brahmaputra basin, IMERG showed obvious overestimation with an overall mean RB value of 35.6% and SD value of 49.5%, respectively. 3B42V7 showed more significant overestimation around the whole basin, and the averaged RB and SD values were 92.6% and 59.6%, respectively (Table 2). In short, both satellite products showed more acceptable performance in the Yellow and Yangtze River basins than in the Brahmaputra basin.
In addition, time series analyses of IMERG, 3B42V7 and gauge-based rainfall are shown for each major river basin during the warm season of 2014 (Figure 5). Although both satellite products showed large standard deviations, IMERG did not have extreme values and appeared to be a more acceptable satellite rainfall product in each basin.

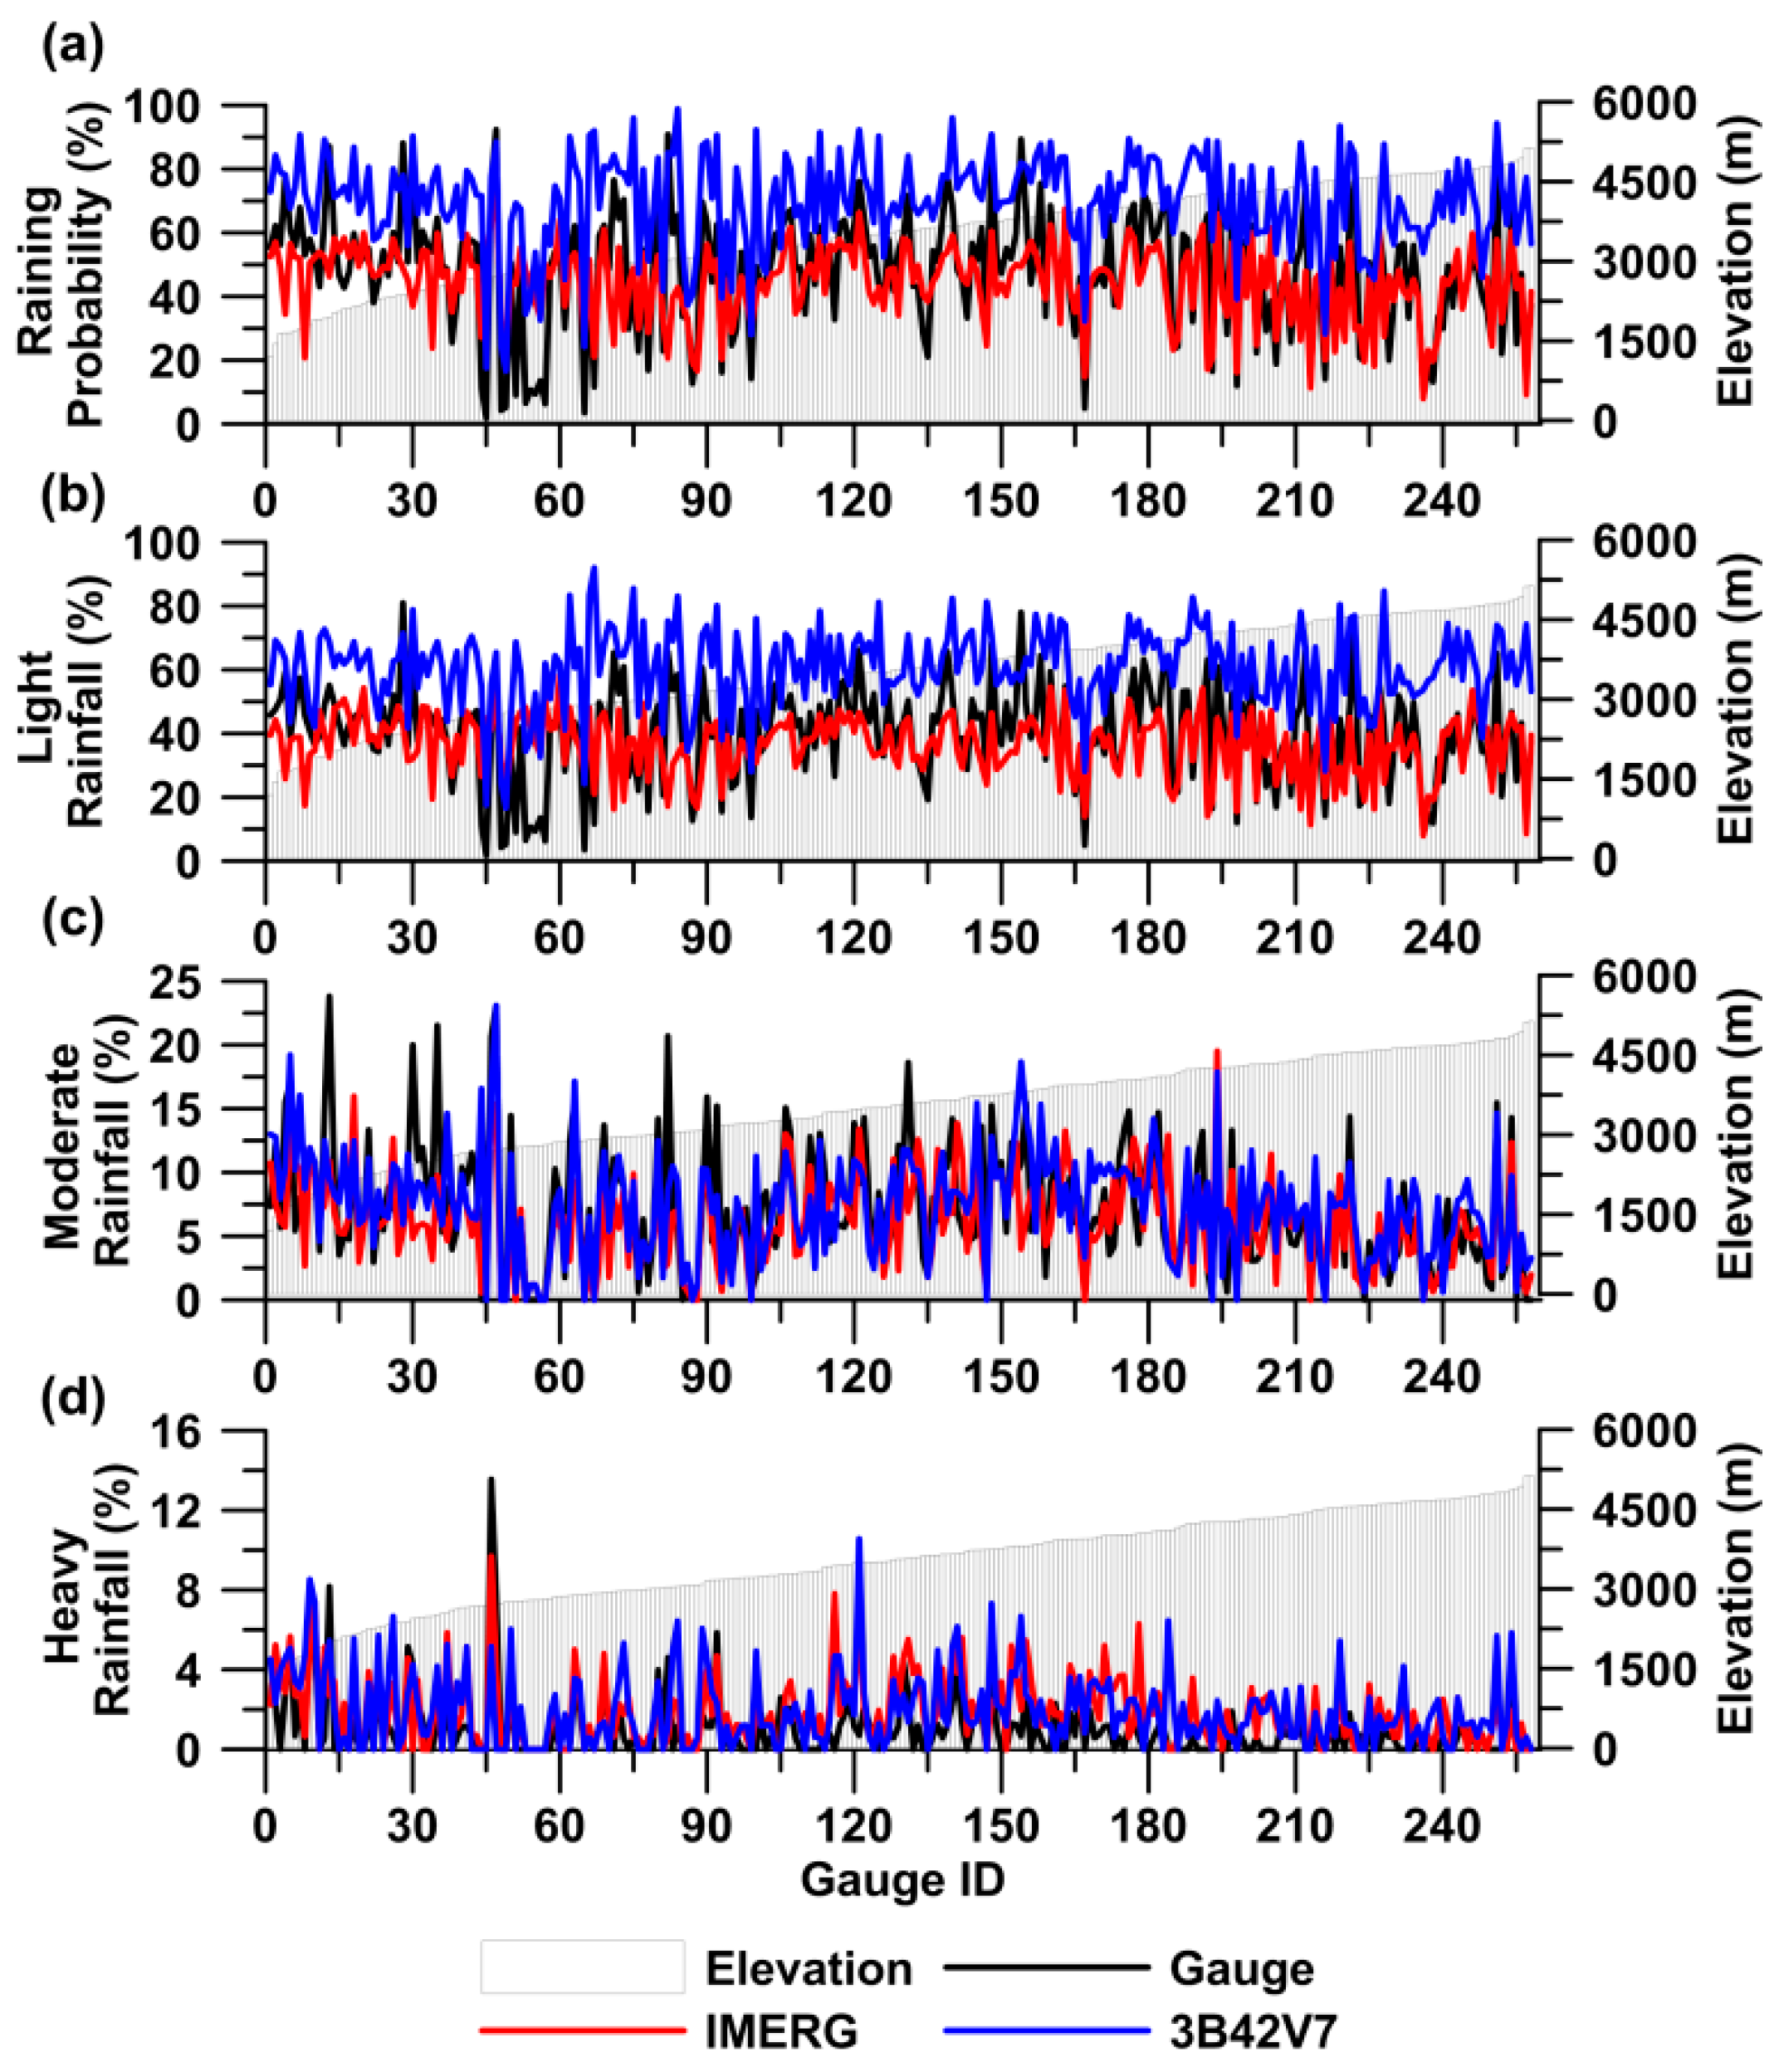
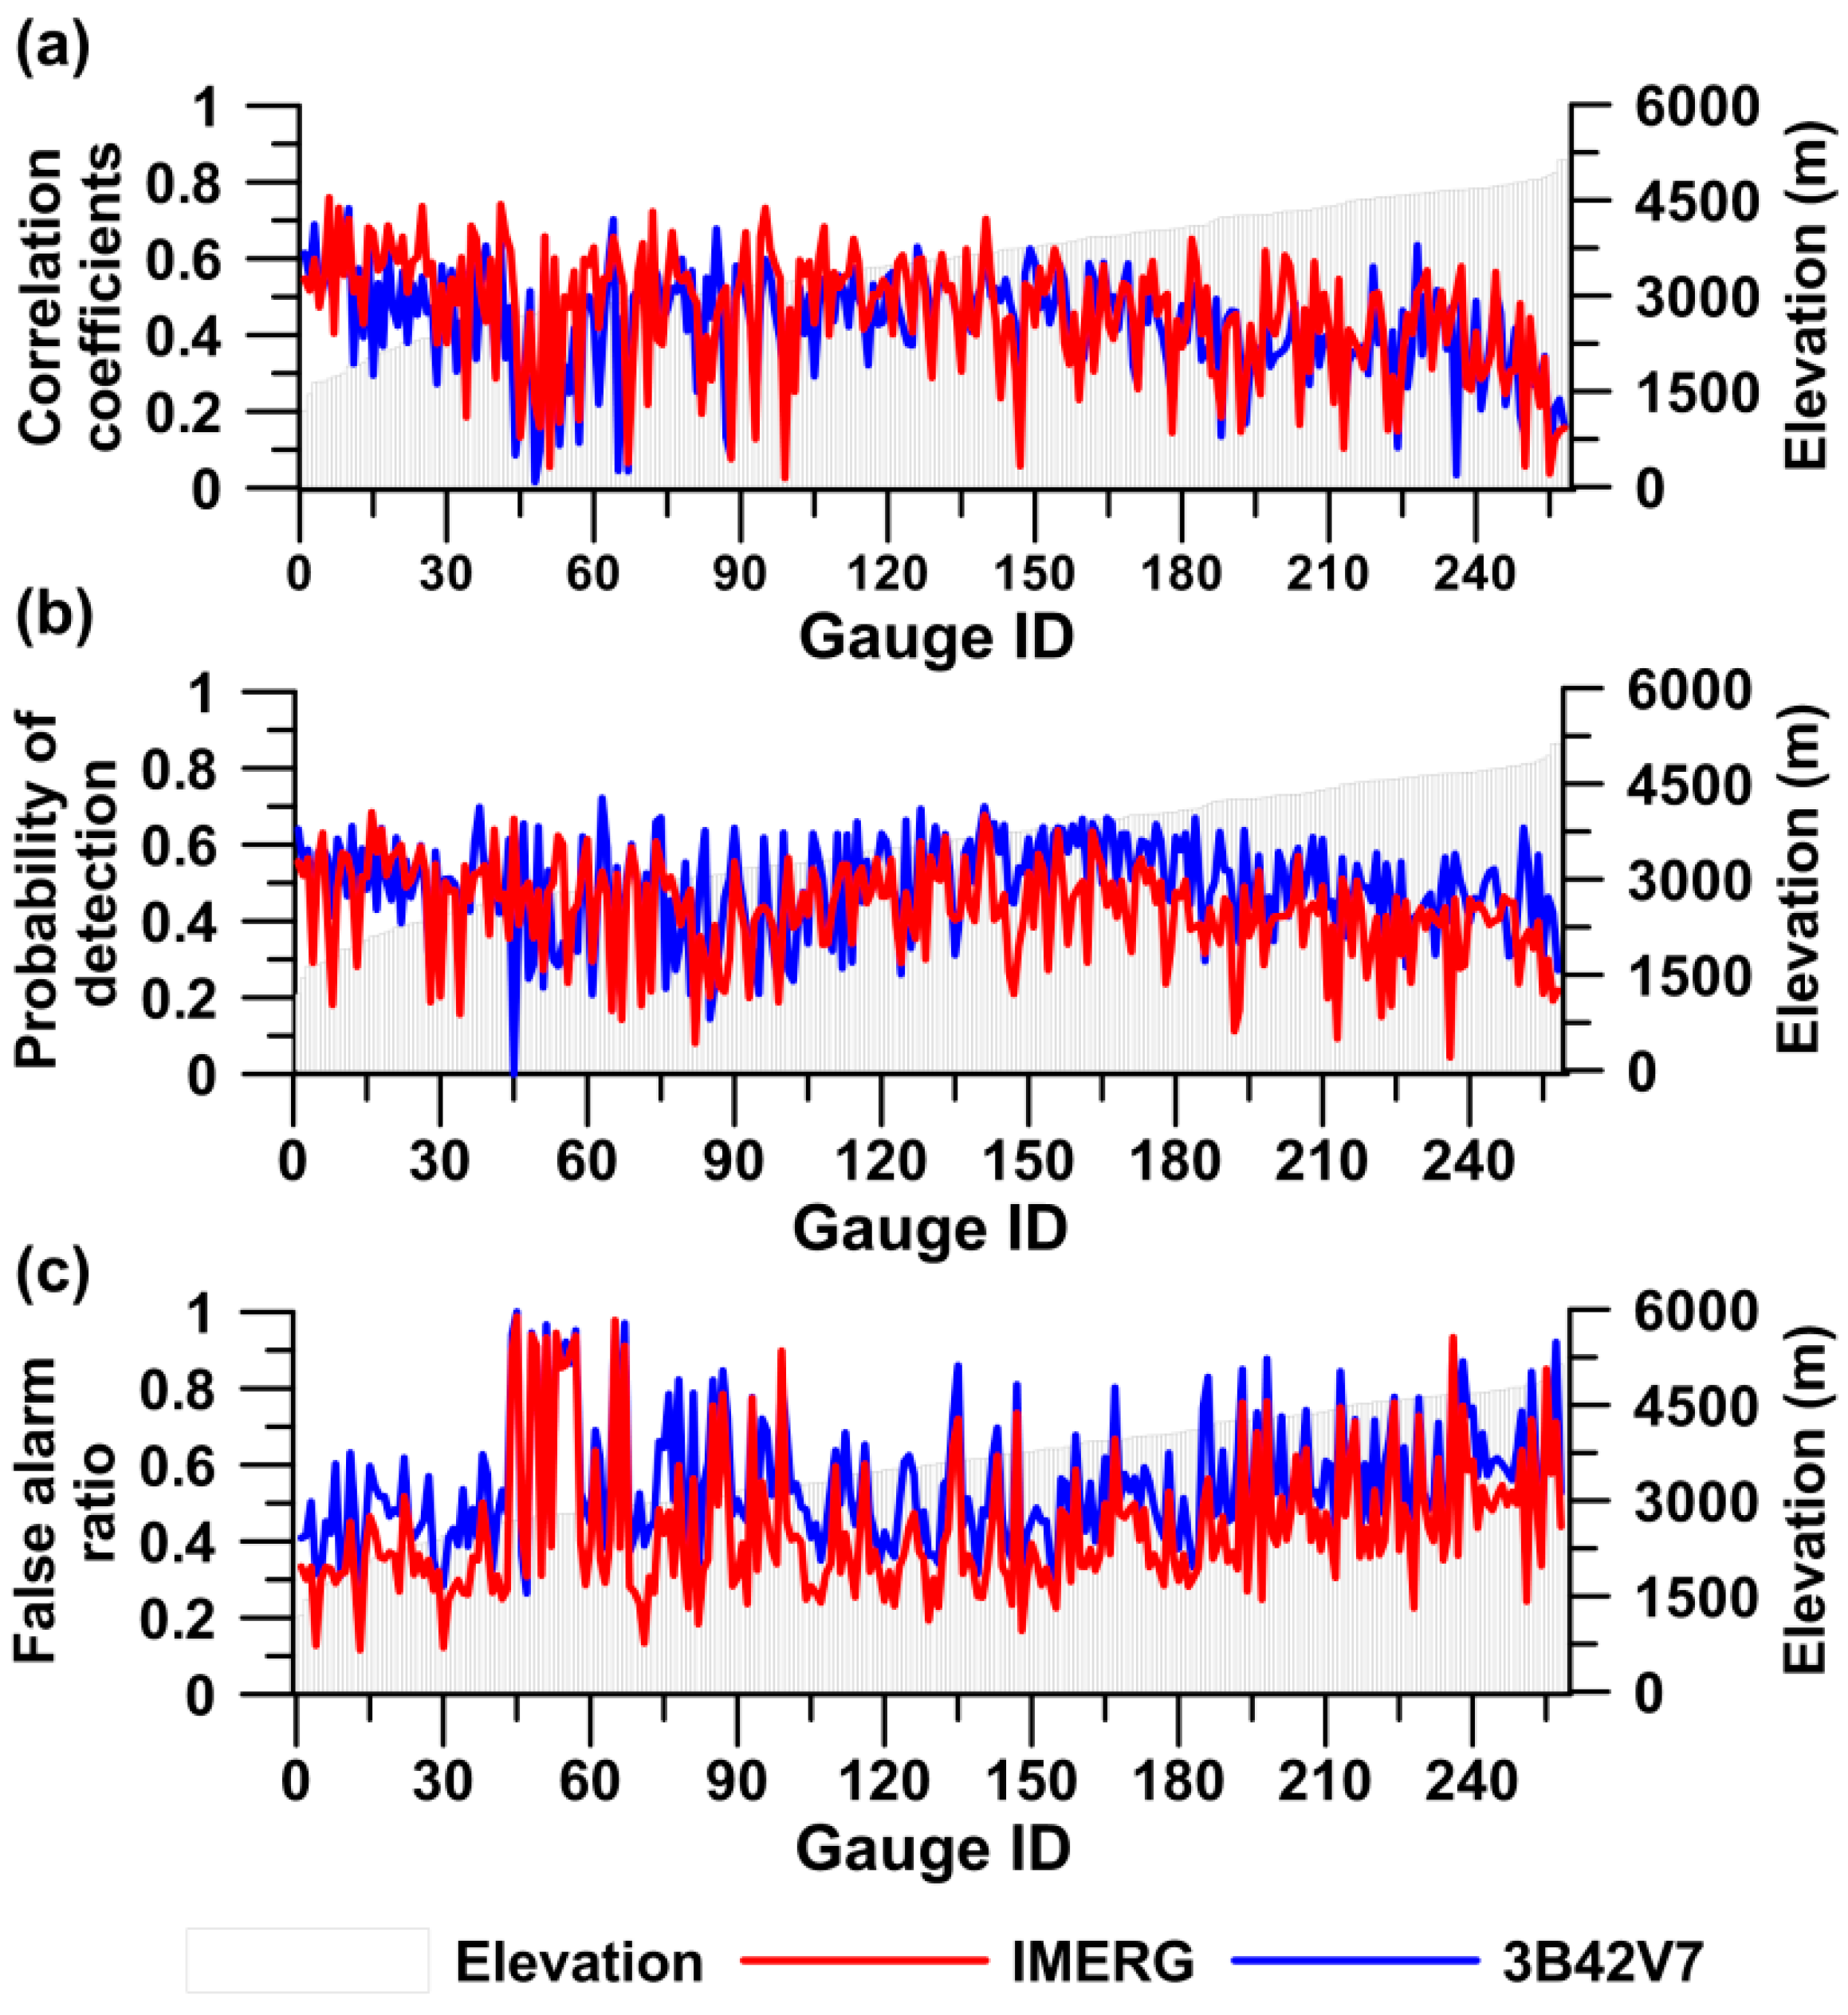
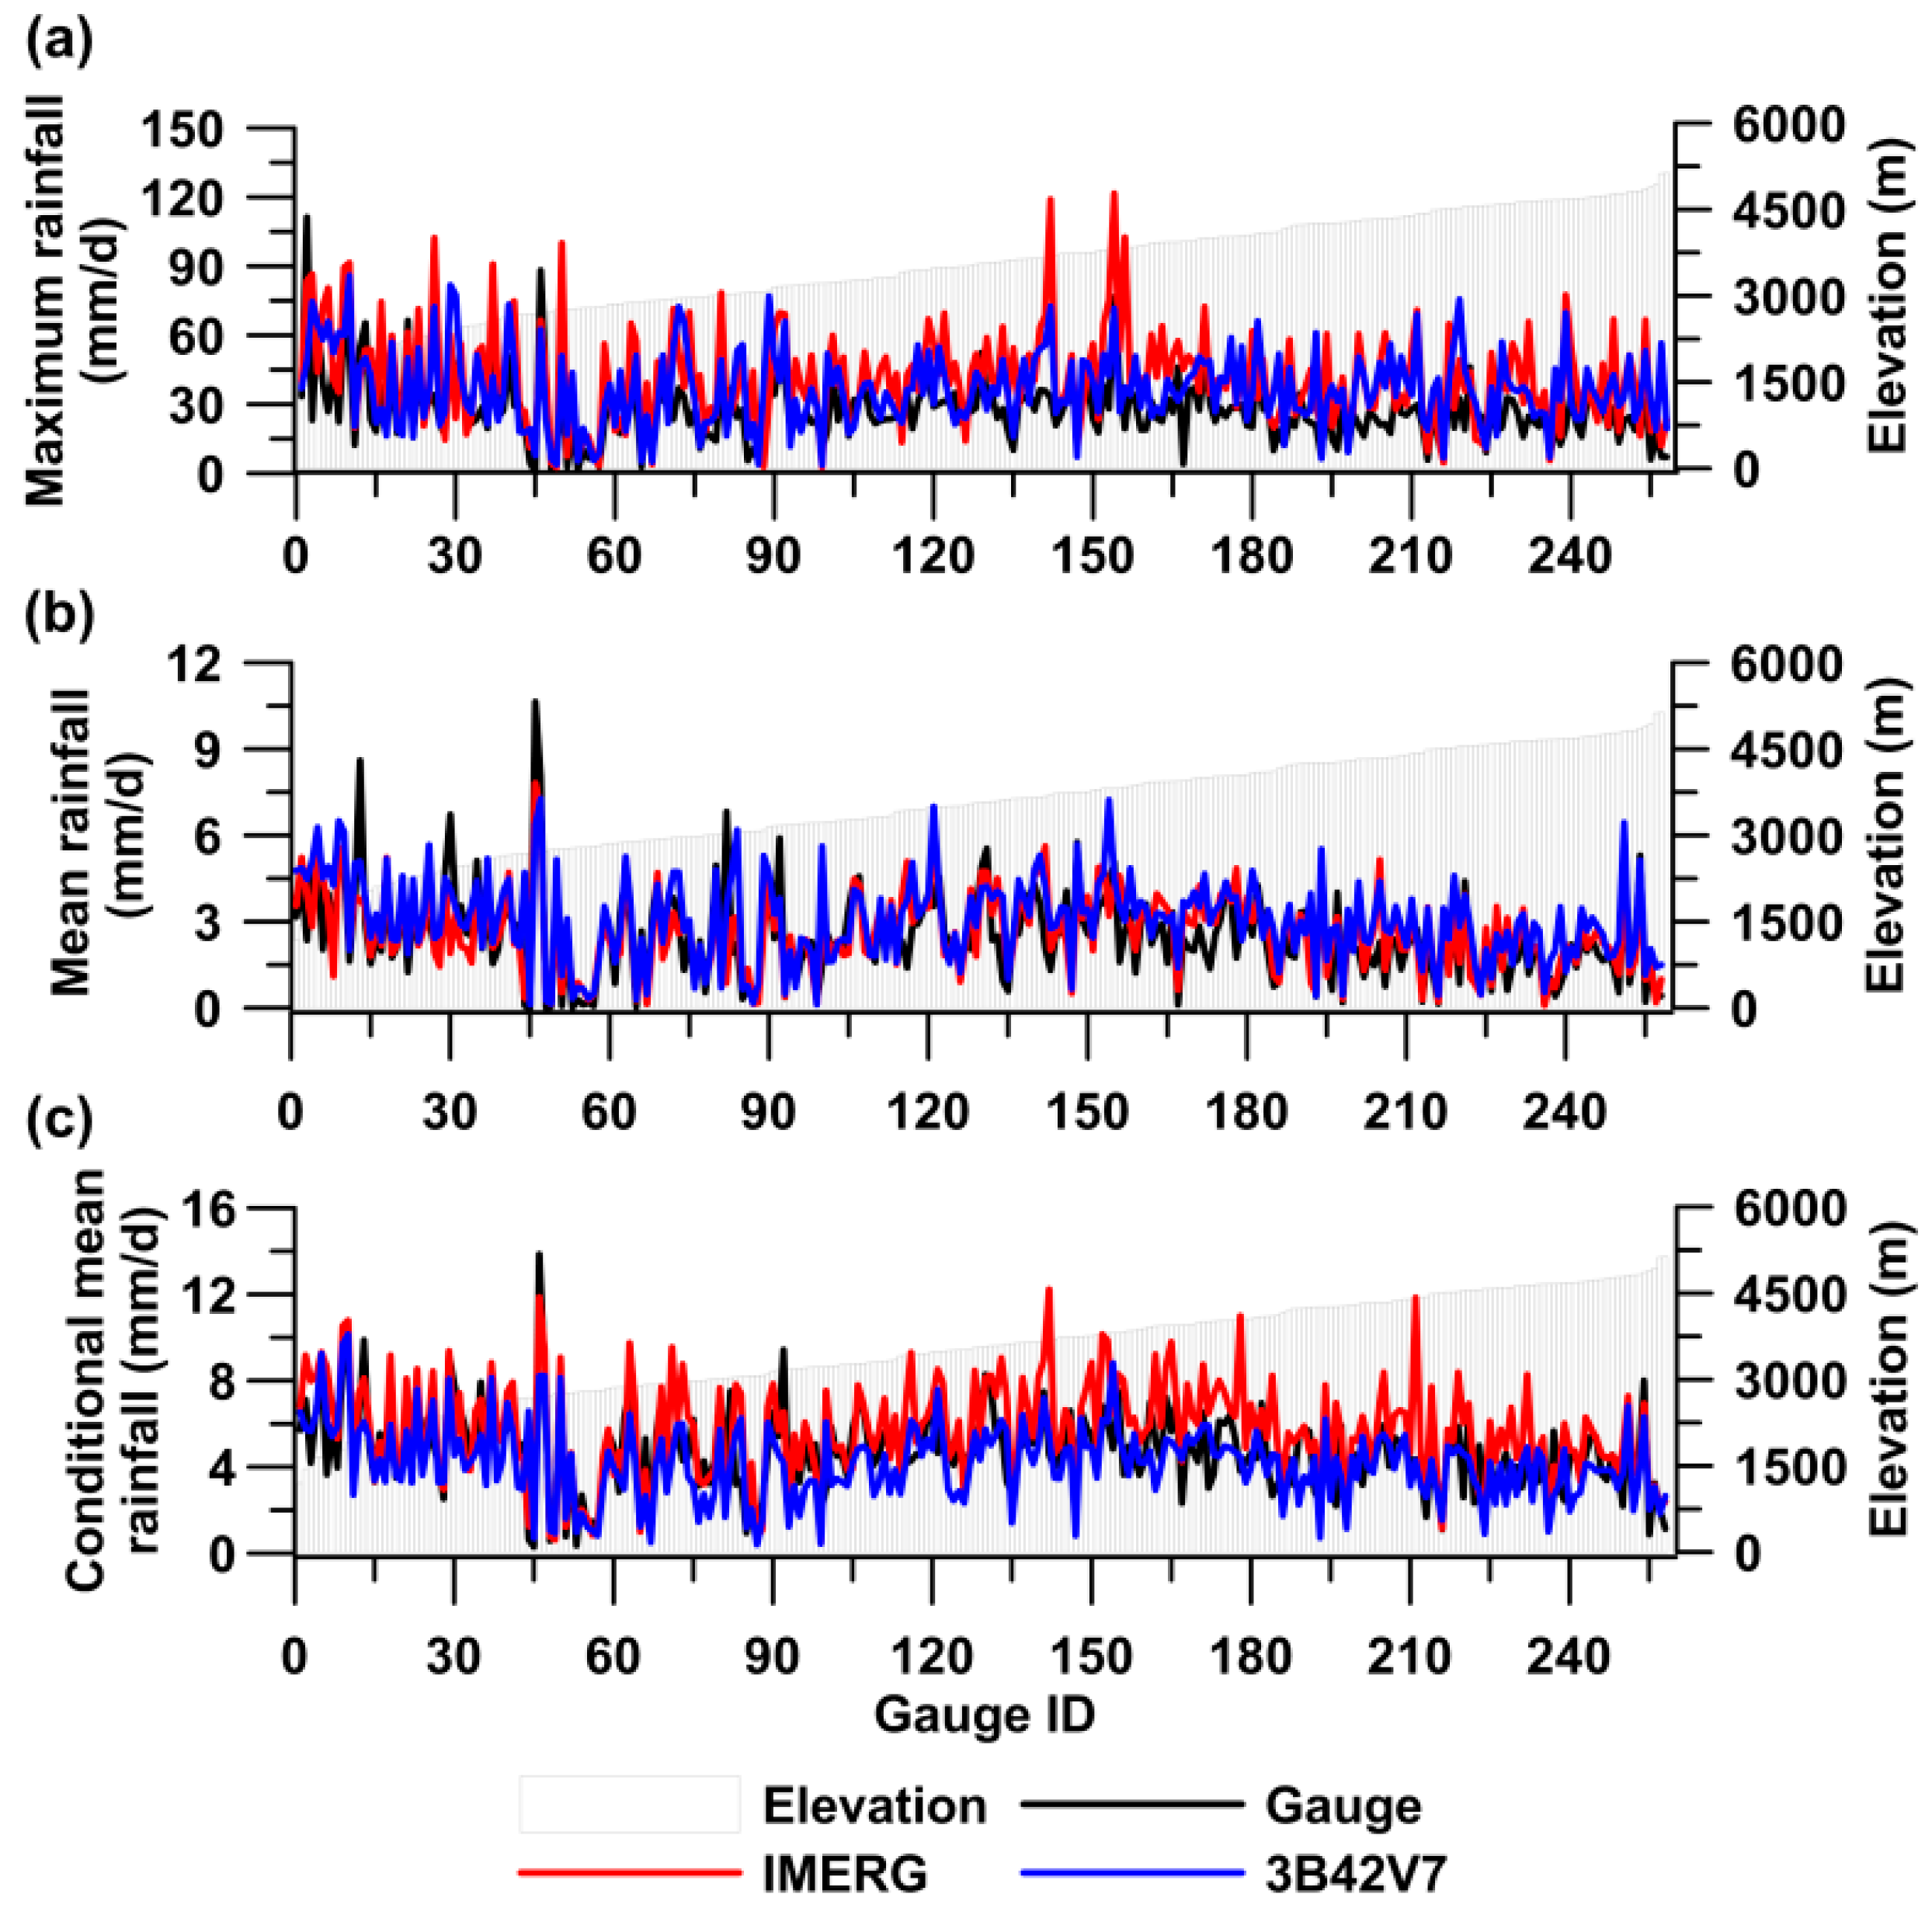
3.4. Elevation Impact Analyses

All gauges in the TP were rearranged in Figure 6, Figure 7 and Figure 8 according to their elevations ranging from 1200 m–5135 m. A comparison of CC, POD and FAR for IMERG and 3B42V7 along elevated sites is presented at the three-hourly scale in Figure 6. All of the metrics showed similar trends for both satellite products as elevations increased from 1200 m–5135 m. No significant CC differences occurred in the two satellite products along the elevated stations. Furthermore, there was no apparent difference for POD and FAR values between IMERG and 3B42V7 products with increasing elevations. 3B42V7, however, showed slightly higher POD for the elevation above 4200 m and obviously higher FAR for the elevation below 3000 m. This implied that regions characterized by higher altitudes (e.g., >4200 m) might still be problematic for the Day-1 multisatellite retrieval in GPM over the TP. Note that potential errors originating from different places under various rainfall regimes might influence the statistical results.
Figure 7 shows daily rainfall regimes, i.e., maximum, mean and conditional mean values, with elevations ranging from 1200 m–5135 m in the warm season of 2014 over the TP. The conditional mean rainfall is defined as the average value among the detected rainfall days within the warm season of 2014 at each station. There was a gradually downward trend for the daily rainfall, including maximum, mean and conditional mean values, below the elevation of 3000 m. When the elevation exceeds 3000 m, no clear trend was detected for each daily rainfall regime. Regarding the daily mean rainfall, high consistency was observed among IMERG, 3B42V7 products and gauge measurements for various elevations. However, there were large biases between IMERG and 3B42V7 in terms of daily maximum and conditional mean rain rates at elevations higher than 3000 m. This phenomenon was more significant in the conditional mean value due to the removal of multiple zero rainfall events. Compared to 3B42V7, IMERG showed higher biases regarding maximum daily rainfall at elevations of approximately 4200 m and slightly higher positive errors in the conditional mean daily estimates at most sites.
Rain probability is a description of the likelihood of rainfall within a specified period and location. We define the warm season of 2014 as the specified period and calculate the percentages of rainfall days during this period at each station. Along the elevated stations, there was no noticeable trend for the raining probability (Figure 8a). Significantly positive errors were observed from 3B42V7 estimates for raining probability, indicating that 3B42V7 overestimated rainfall events along the elevated gauges. The classification of raining intensities (i.e., 0–10 mm/d for light rainfall, 10–25 mm/d for moderate rainfall and >25 mm/d for heavy rainfall) is primarily from [9,36]. Less significant biases were found in IMERG for light rainfall (Figure 8b). Compared to light and heavy rainfall, moderate rainfall derived from the IMERG and 3B42V7 products matched the gauge measurements well along the elevated sites (Figure 8c). In addition, light rainfall events were far more frequent than moderate and heavy rainfall events for both satellite products, where the proportion of heavy rainfall was relatively low, with the mean value lower than 5%. This means that the sample sizes to verify heavy rainfall events from a single warm season are possibly small, which may introduce a potential uncertainty for satellite rainfall estimates.

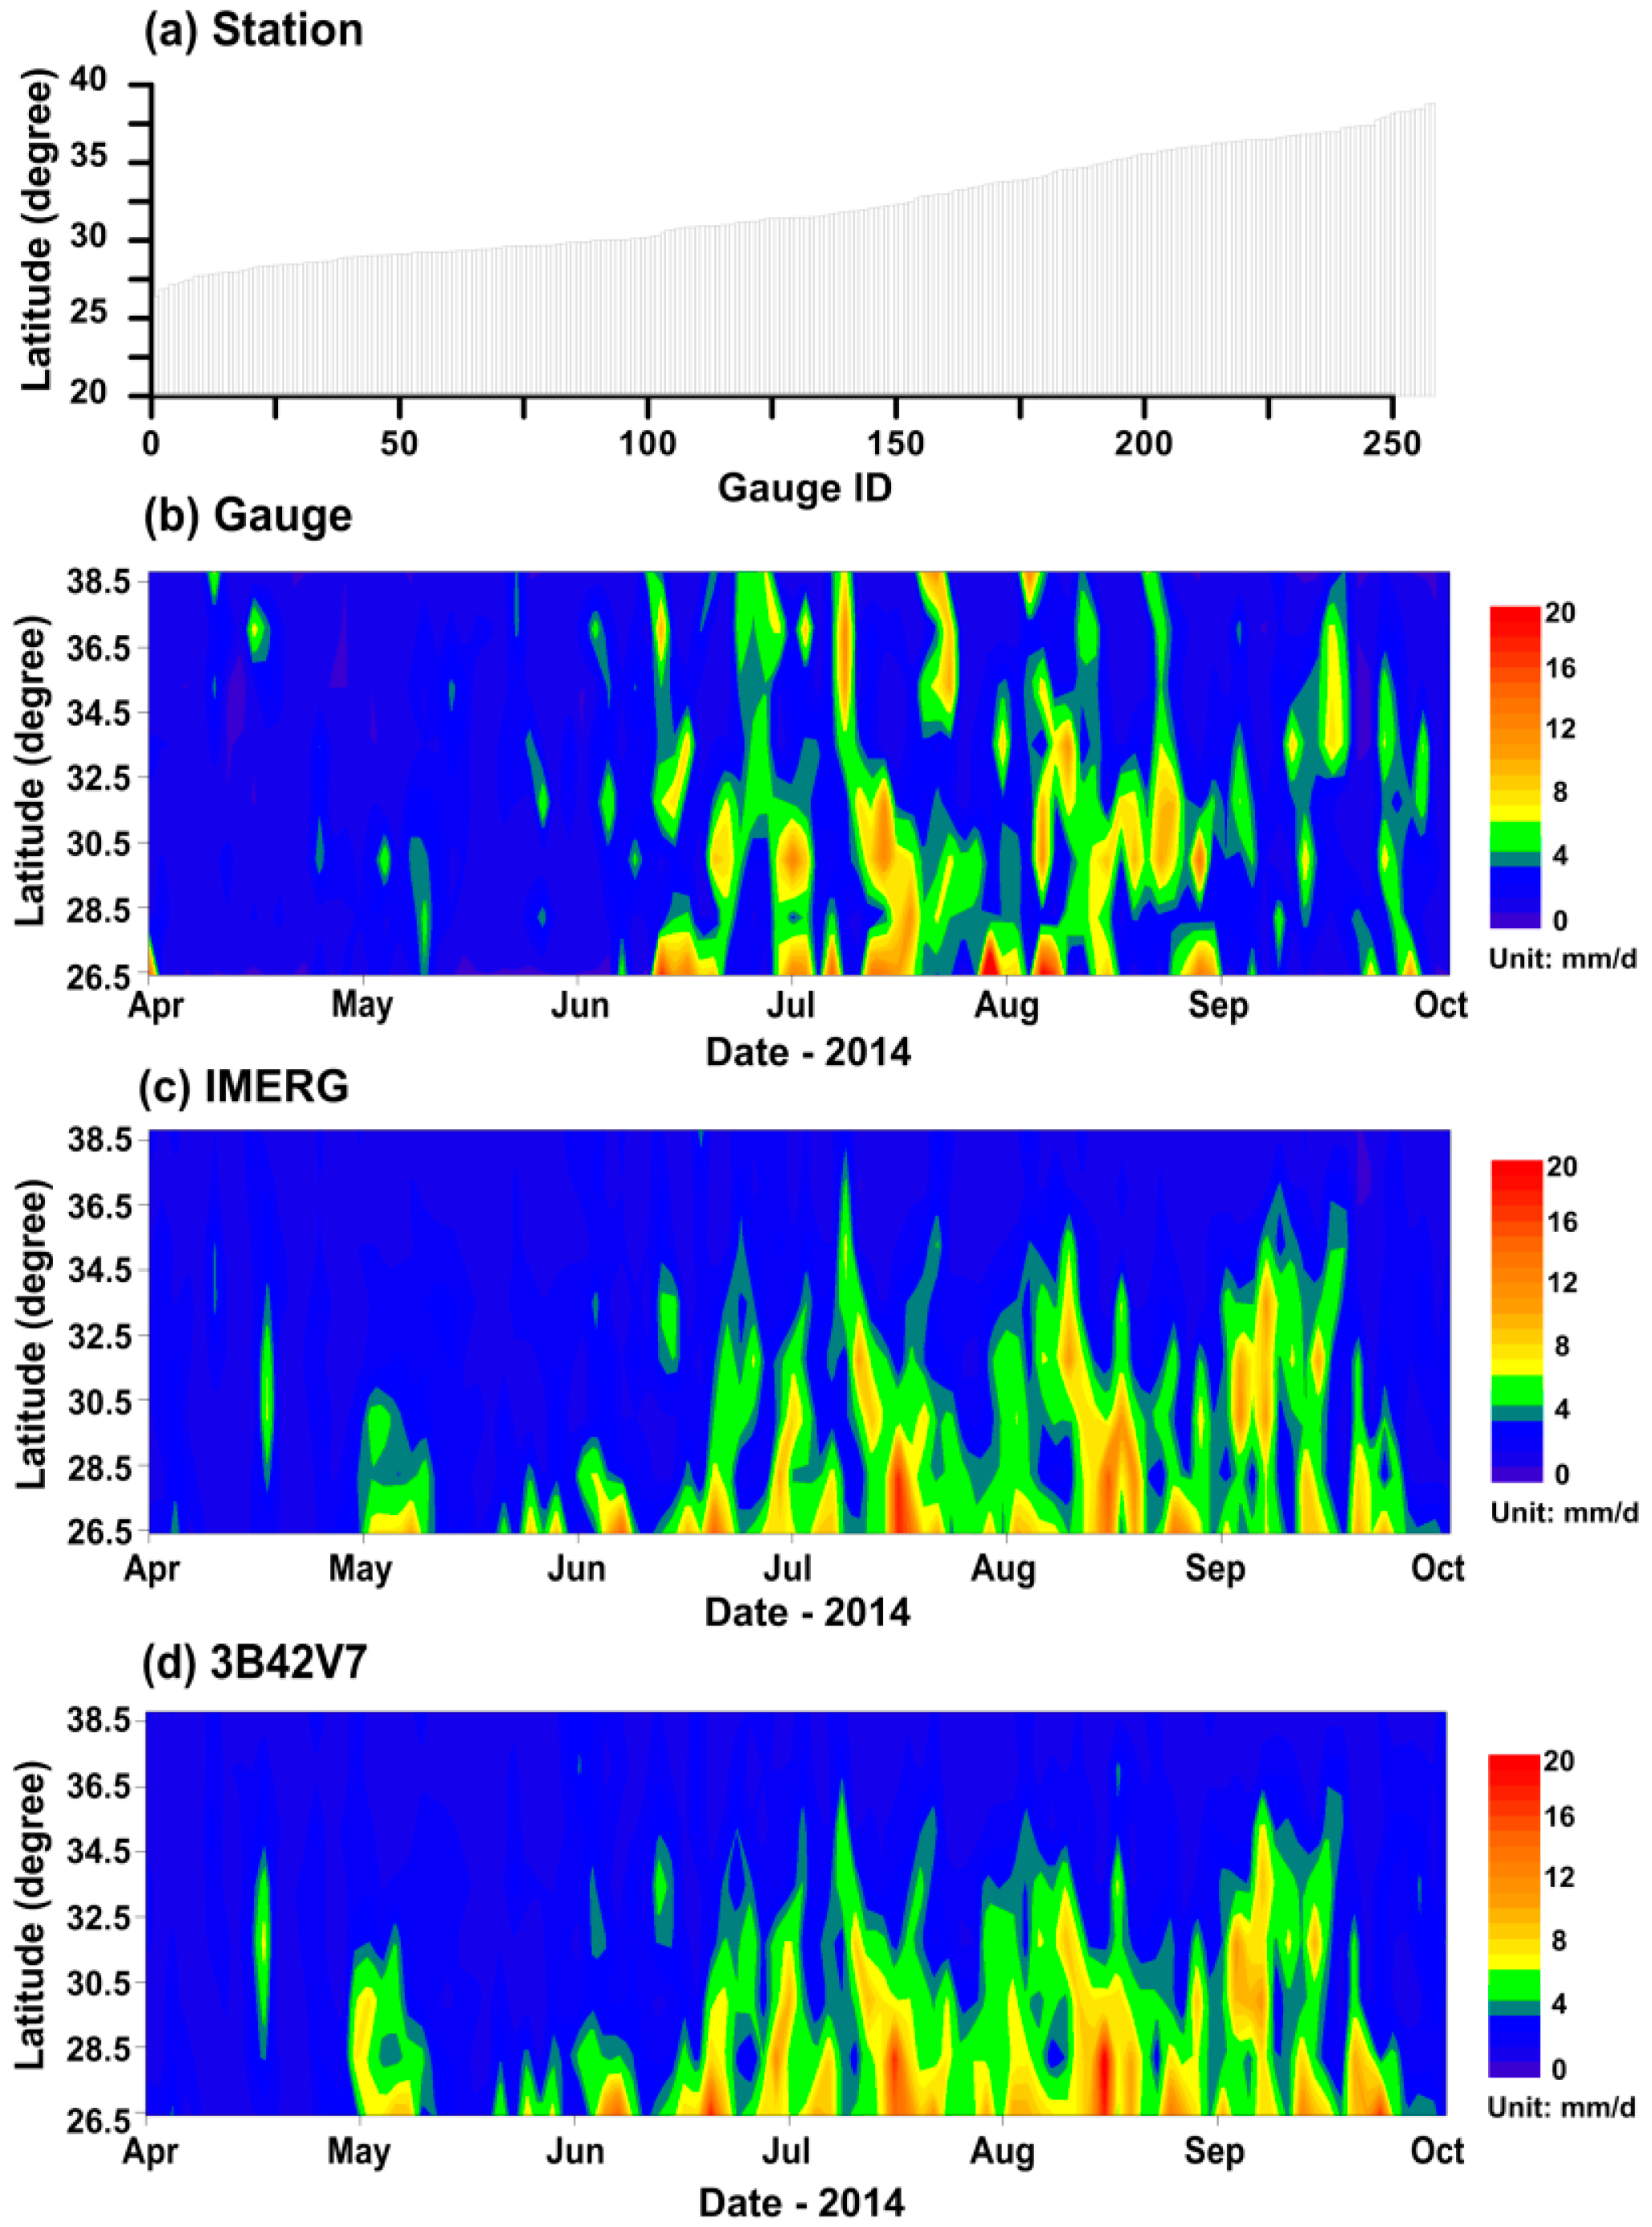
3.5. Latitude Impact Analyses

The 258 gauges over the TP were reorganized with increasing latitudes (northward), and their daily rainfall intensity was plotted according to time and latitude. Figure 9 presents a series of continuous rainfall events from the gauge, IMERG and 3B42V7 datasets in the warm season of 2014 when the Indian monsoon prevailed over the plateau. Before June, sporadic rainfall activities occurred from satellite products (i.e., IMERG and 3B42V7) and gauge measurements. Additionally, there was intermittent rainfall activity captured by both satellite products at the beginning of the Indian monsoon in early May 2014. It gradually weakened from latitudes of 26.5°–32.5° in the plateau.
Moisture surge events dominated the plateau from early June to mid-September in 2014, which were characterized by abundant rainfall activities from north to south for both satellite products and gauge observations. For instance, there were several latitudinal gradients of rainfall occurring from mid-June to the end of August, which were regarded as typical moisture surge events over the TP. Within the gauge-based domain, an insignificant latitudinal gradient existed during the mature phase of the Indian monsoon when rainfall should be relatively widespread across all latitudes. Over the plateau, rain gauges are often installed at low altitudes or sites with residents. It is worth noting that [37] proposed that moisture surge events tend to influence low-elevation stations more than middle or high elevations, and the gauge-based rainfall presented in Figure 9 might ignore such an elevation-specific response.
In addition, ground-based gauges failed to capture rainfall events during the end of the Indian monsoon period in September. We deduce that sparse gauges are the primary reason; however, the specific reason needs to be further investigated in the future. Overall, both satellite products could detect rainfall activities synchronously under the domination of Indian monsoon periods, and IMERG does not show obvious superiority to 3B42V7 during the comparison.

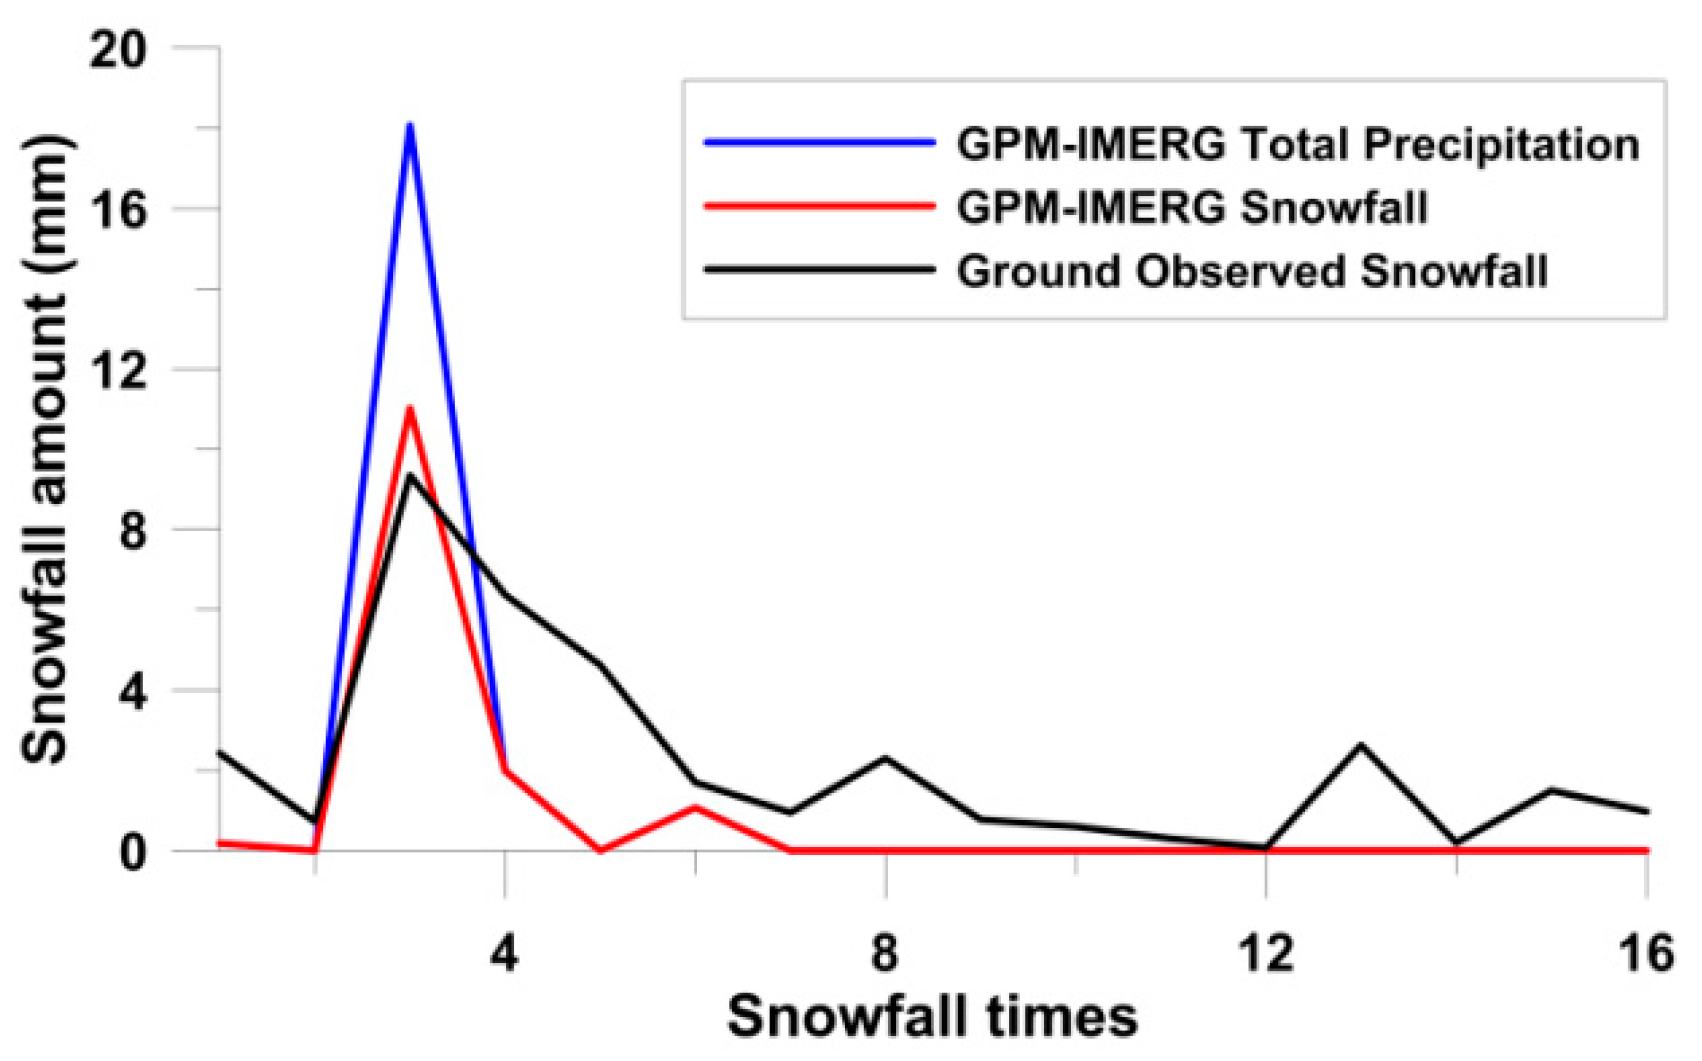
3.6. Snowfall Regime Analyses

Based on limited field snowfall data at a site of the northeastern TP (Figure 1), we initially analyzed IMERG-retrieved snowfall characteristics. During the sixteenth snowfall days, IMERG captured four times which primarily have larger snowfall amounts (Figure 10). Although the probability of detection on IMERG snowfall was not high (i.e., 25%) at the experimental site, the error values were not much reduced for the four right times in the high-elevation region (Table 3).

4. Discussion

Several studies [8,9,10,11] have been performed to evaluate satellite precipitation products over the TP. However, none of these studies were concerned with sub-daily scale examination in this region. It should also be emphasized that the performance of the GPM-era Day-1 IMERG product was examined over regions of high elevation and complex terrain for the first time. The differences between two satellite products (i.e., IMERG and 3B42V7) and gauge data showed clearly whether the IMERG datasets perform better. Note that the resampling and interpolation methods are used to make the different satellite (i.e., IMERG and 3B42V7) and gauge data comparable. More studies will be carried out to evaluate the possible errors introduced by the above two methods.
Satellite precipitation products can provide alternatives for estimating rainfall data and create new opportunities for hydrologists in understanding and applying remotely-sensed information. The work in [38] forced the Coupled Routing and Excess STorage (CREST) hydrological model with 3B42V7 products and yielded comparable skill scores with in situ gauges even without recalibration of the hydrological model by the satellite precipitation. TRMM-era research products also showed a satisfactory capability as the forcing of the Variable Infiltration Capacity (VIC) model to simulate streamflow in basins [11,39,40]. GPM is regarded as the successor of TRMM for satellite precipitation estimates. Although no significant advantages were observed for the GPR-era IMERG product at the sub-daily scale over the TP, it seems to be acceptable for regional hydrological studies. Given the sparse distribution of rain gauges over the TP, especially in the west and central part, the IMERG datasets are extremely valuable in deriving temporal and spatial patterns of precipitation with high resolution. It can also be a substitute for the TRMM-era rainfall product, such as 3B42V7.
The results of IMERG and 3B42V7 data assessment in river basins, especially over the upper reaches of the Yellow and Yangtze Rivers, showed a new opportunity for basin-scale hydrological applications. However, a few extreme high positive or negative relative biases (i.e., >100% and <−50%) were detected in the Brahmaputra basin. The work in [41] indicated that regions characterized by complex terrain and a rigid climate would still be problematic for the Day-1 IMERG and 3B42V7 products under current observing skills. We found that the complex terrain and local strong convectional weather significantly influence the satellite rainfall retrieval and result in unexpected errors between satellite estimates and gauge observations in the Brahmaputra basin. For satellite rainfall products over land, the passive microwave algorithms depend primarily on scattering by ice, but the orographic rains might not produce much ice aloft [42]. Thus, the noticeable IMERG and 3B42V7 rainfall errors in the Brahmaputra basin might be due to complex orography and associated warm-rain process [43,44]. Furthermore, it is noted that discrepancies between satellite products and gauge measurements might be due to the shortcomings in the automatic gauge network. Although the gauge data have gone through three levels of quality control, systematic biases induced by wind and blown snow undercatch, wetting and evaporation errors may contribute to potential sources of uncertainty in mountainous regions over the TP [2]. Moreover, nearly no rain gauges are installed over the western and central TP. More efforts are therefore urgently needed to build a denser rain gauge observation network in these regions.
The influence of the Indian monsoon is critical for the advection of heat and moisture and climate patterns in the TP region [17,45]. The continuous domains of IMERG and 3B42V7 precipitation estimates help characterize rainfall space-time structures under the domination of the Indian monsoon in the warm season over the TP. The onset, maturation and dissipation of the Indian monsoon were successfully reflected from the satellite rainfall estimates, whereas some moisture surge activities were not successfully detected by the sparse gauge-based observations. Our efforts of examining the variability in satellite rainfall estimates with latitude are helpful for understanding the moisture flux transport across the TP. Because of limited rainfall records, the Westerlies were not included for understanding the whole climate system in the plateau.

5. Conclusions

This study provides an early and timely quantitative study of the error characteristics for GPM and its predecessor-TRMM rainfall products with high temporal resolution (i.e., three-hourly) across the TP. The intercomparison is based on multiple evaluations with the best available rain gauge network at the grid cell and basin scales. Furthermore, we have investigated the impact of elevation and latitude on rainfall analysis. In addition to the IMERG and 3B42V7 satellite rainfall error analysis, the snowfall error analysis from IMERG is carried out at a site of the TP. Primary conclusions are summarized as follows:
(1)
Overall, IMERG and 3B42V7 show similar rainfall patterns across the TP, with a decreasing trend from the southeast to the northwest. However, IMERG performs better, with slightly higher correlation and lower bias than 3B42V7 at the three-hourly scale, although both datasets show similar spatial patterns for all assessment indicators.
(2)
As elevations increase, there is no obvious difference in CC between IMERG and 3B42V7. However, IMERG shows slightly lower POD for elevations above 4200 m and significantly smaller FAR for elevations below 3000 m. In addition, higher consistency is detected from the IMERG products for light rainfall than 3B42V7 estimates.
(3)
The latitudinal rainfall gradients of the Indian monsoon dynamics are successfully detected by the two satellite estimates. In particular, the relatively light rain from the early and end Indian monsoon moisture surge events is often not observed by the sparse gauges over the TP.
(4)
Over high and complex TP regions, this study provides the very first understanding of GPM at the hourly scale and confirms the desired results that the GPM-era Day-1 Level-3 products perform at least equally well, often times better for light and solid precipitation at high elevations, than the TRMM V7 mature products.
The GPM Core Observatory sensors are expected to have the ability to detect cold-season solid precipitation, but only one snowfall site in the northeastern TP is available for evaluating the IMERG snowfall product. Conducting snowfall observation and evaluation across the TP are our ongoing work.

Supplementary Materials

The following are available online at www.mdpi.com/2072-4292/8/7/569/s1, Figure S1: Spatial patterns of snowfall occurrence probability (unit: %) derived from IMERG products during the cold season (i.e., October to the next March) of 2014 over the TP. Figure S2: Spatial patterns of snowfall amounts (unit: mm) derived from IMERG products during the cold season (i.e., October to the next March) of 2014 over the TP. Table S1: The geographical location of 258 automatic gauges over the Tibetan Plateau and the 19 stations used for GPCC gridded gauge-analysis products.

Acknowledgments

The authors’ gratitude is extended to the China Meteorological Administration (CMA) for providing ground-based rainfall data for this study. The efforts of the GPM research community are also highly appreciated for making the satellite rainfall data available for this work. This work is financially supported by the National Natural Science Foundation of China (Grant Nos. 91437214 and 91547210). Y. Ma is partly supported through the China Postdoctoral Science Foundation (Grant No. 2015M581107).

Author Contributions

Y.M. analyzed the data and prepared the draft of the manuscript. G.T. prepared the satellite precipitation data and revised the manuscript. D.L. gave comments and significantly revised the manuscript. Both L.Z. and W.W. handled the gauge data. Y.H. conceived of this study, gave comments and revised the manuscript.

Conflicts of Interest

The authors declare no conflict of interest.

Abbreviations

The following abbreviations are used in this manuscript:
CCCorrelation Coefficients
CMAChina Meteorological Administration
CMORPHClimate Prediction Center (CPC) MORPHing Technique
CRESTCoupled Routing and Excess STorage
DPRDual-frequency Precipitation Radar
FARFalse Alarm Ratio
GMIGPM Microwave Imager
IDWInverse Distance Weighting
IFOVInstantaneous Field Of View
IMERGIntegrated Multi-satellitE Retrievals for the GPM mission
GPCCGlobal Precipitation Climatology Center
GPMGlobal Precipitation Measurement
GPROFGoddard Profiling Algorithm
PERSIANNPrecipitation Estimation from Remotely Sensed Information using Artificial Neural Networks
PERSIANN-CCSPERSIANN-Cloud Classification System
PODProbability Of Detection
RBRelative Bias
RMSERoot Mean Square Error
RTReal Time
SDStandard Deviation
TPTibetan Plateau
TRMMTropical Rainfall Measuring Mission
TMPRTRMM Multi-satellite Precipitation Analysis
VICVariable Infiltration Capacity

References

  1. Tong, K.; Su, F.; Yang, D.; Zhang, L.; Hao, Z. Tibetan Plateau precipitation as depicted by gauge observations, reanalysis and satellite retrievals. Int. J. Climatol. 2014, 34, 265–285. [Google Scholar] [CrossRef]
  2. Ma, Y.; Zhang, Y.; Yang, D.; Farhan, S. Precipitation bias variability versus various gauges under different climatic conditions over the Third Pole Environment (TPE) region. Int. J. Climatol. 2015, 35, 1201–1211. [Google Scholar] [CrossRef]
  3. Dinku, T.; Ceccato, P.; Connor, S. Challenges of satellite rainfall estimation over mountainous and arid parts of east Africa. Int. J. Remote Sens. 2011, 32, 5965–5979. [Google Scholar] [CrossRef]
  4. Sorooshian, S.; Kouchak, A.; Arkin, P.; Eylander, J.; Foufoula, E.; Harmon, R.; Hendrickx, J.; Imam, B.; Kuligowski, R.; Skahill, B.; et al. Advancing the remote sensing of precipitation. Bull. Am. Meteorol. Soc. 2011, 92, 1271–1272. [Google Scholar] [CrossRef]
  5. Tian, Y.; Peters-Lidard, C. A global map of uncertainties in satellite-based precipitation measurements. Geophys. Res. Lett. 2010, 14, 139–142. [Google Scholar] [CrossRef]
  6. Hou, A.; Kakar, R.; Neeck, S.; Azarbarzin, A.; Kummerow, C.; Kojima, M.; Oki, R.; Nakamura, K.; Iguchi, T. The Global Precipitation Measurement Mission. Bull. Am. Meteorol. Soc. 2014, 95, 701–722. [Google Scholar] [CrossRef]
  7. Yin, Z.; Liu, X.; Zhang, X.; Chung, C. Using a geographic information system to improve special sensor microwave imager (SSM/I) precipitation estimates over the Tibetan Plateau. J. Geophys. Res. 2004, 109, D03110. [Google Scholar] [CrossRef]
  8. Yin, Z.; Zhang, X.; Liu, X.; Colella, M.; Chen, X. An assessment of the biases of satellite rainfall estimates over the Tibetan Plateau and correction methods based on topographic analysis. J. Hydrometeorol. 2008, 9, 301–326. [Google Scholar] [CrossRef]
  9. Gao, Y.; Liu, M. Evaluation of high-resolution satellite precipitation products using rain gauge observations over the Tibetan Plateau. Hydrol. Earth Syst. Sci. 2013, 17, 837–849. [Google Scholar] [CrossRef]
  10. Shen, Y.; Xiong, A.; Hong, Y.; Yu, J.; Pan, Y.; Chen, Z.; Saharia, M. Uncertainty analysis of five satellite-based precipitation products and evaluation of three optimally merged multi-algorithm products over the Tibetan Plateau. Int. J. Remote Sens. 2014, 35, 6843–6858. [Google Scholar] [CrossRef]
  11. Tong, K.; Su, F.; Yang, D.; Hao, Z. Evaluation of satellite precipitation retrievals and their potential utilities in hydrologic modeling over the Tibetan Plateau. J. Hydrol. 2014, 519, 423–437. [Google Scholar] [CrossRef]
  12. Chen, S.; Hong, Y.; Cao, Q.; Gourley, J.J.; Kirstetter, P.; Yong, B.; Tian, Y.; Zhang, Z.; Shen, Y.; Hu, J.; et al. Similarity and difference of the two successive V6 and V7 TRMM multisatellite precipitation analysis performance over China. J. Geophys. Res. 2013, 118, 13060–13074. [Google Scholar] [CrossRef]
  13. Ye, B.; Yang, D.; Ding, Y.; Han, T.; Koike, T. A bias-corrected precipitation climatology for China. J. Hydrometeorol. 2004, 5, 1147–1160. [Google Scholar] [CrossRef]
  14. You, Q.; Kang, S.; Ren, G.; Fraedrich, K.; Pepin, N.; Yan, Y.; Ma, L. Observed changes in snow depth and number of snow days in the eastern and central Tibetan Plateau. Clim. Res. 2011, 46, 171–183. [Google Scholar] [CrossRef]
  15. Shen, Y.; Xiong, A.; Wang, Y.; Xie, P. Performance of high-resolution satellite precipitation products over China. J. Geophys. Res. 2010, 115, D02114. [Google Scholar] [CrossRef]
  16. Qiu, J. China: The third pole. Nat. News 2008, 454, 393–396. [Google Scholar] [CrossRef] [PubMed]
  17. Yao, T.; Thompson, L.; Yang, W.; Yu, W.; Gao, Y.; Guo, X.; Yang, X.; Duan, K.; Zhao, H.; Xu, B.; et al. Different glacier status with atmospheric circulations in Tibetan Plateau and surroundings. Nat. Clim. Chang. 2012, 2, 663–667. [Google Scholar] [CrossRef]
  18. Huffman, G.; Bolvin, D.; Braithwaite, D.; Hsu, K.; Joyce, R.; Xie, P. NASA Global Precipitation Measurement (GPM) Integrated Multi-Satellie Retrievals for GPM (IMERG); Algorithm Theoretical Basis Document, Version 4.4; NASA: Greenbelt, MD, USA, 2014; p. 30. [Google Scholar]
  19. GPM Data Downloads. Available online: http://pmm.nasa.gov/data-access/downloads/gpm (accessed on 28 March 2016).
  20. Joyce, R.; Xie, P.; Janowiak, J. Kalman filter–based CMORPH. J. Hydrometeorol. 2011, 12, 1547–1563. [Google Scholar] [CrossRef]
  21. Hong, Y.; Gochis, D.; Cheng, J.; Hsu, K.; Sorooshian, S. Evaluation of PERSIANN-CCS rainfall measurement using the NAME event rain gauge network. J. Hydrometeorol. 2007, 8, 469–482. [Google Scholar] [CrossRef]
  22. Huffman, G.; Bolvin, D.; Nelkin, E.; Wolff, D.; Adler, R.; Gu, G.; Hong, Y.; Bowman, K.; Stocker, E. The TRMM Multisatellite Precipitation Analysis (TMPA): Quasi-global, multiyear, combined-sensor precipitation estimates at fine scales. J. Hydrometeorol. 2007, 8, 38–55. [Google Scholar] [CrossRef]
  23. Habib, E.; Henschke, A.; Adler, R. Evaluation of TMPA satellite-based research and real-time rainfall estimates during six tropical-related heavy rainfall events over Louisiana, USA. Atmos. Res. 2009, 94, 373–388. [Google Scholar] [CrossRef]
  24. Yong, B.; Hong, Y.; Ren, L.; Gourley, J.; Huffman, G.; Chen, X.; Wang, W.; Khan, S. Assessment of evolving TRMM-based multisatellite real-time precipitation estimation methods and their impacts on hydrologic precipitation in a high latitude basin. J. Geophys. Res. 2012, 117, D09108. [Google Scholar] [CrossRef]
  25. Wang, S.; Liu, S.; Mo, X.; Peng, B.; Qiu, J.; Li, M.; Liu, C.; Wang, Z.; Bauer-Gottwein, P. Evaluation of remotely sensed precipitation and its performance for streamflow simulations in basins of the southeast Tibetan Plateau. J. Hydrometeorol. 2015, 16, 2577–2594. [Google Scholar] [CrossRef]
  26. Ren, Z.; Zhao, P.; Zhang, Q. Quality control procedures for hourly precipitation data from automatic weather stations in China. Meteorol. Mon. 2010, 36, 123–132. (In Chinese) [Google Scholar]
  27. Shen, Y.; Zhao, P.; Pan, Y.; Yu, J. A high spatiotemporal gauge-satellite merged precipitation analysis over China. J. Geophys. Res. 2014, 119, 3063–3075. [Google Scholar] [CrossRef]
  28. Chen, R.; Liu, J.; Kang, E.; Yang, Y.; Han, C.; Liu, Z.; Song, Y.; Qing, W.; Zhu, P. Precipitation measurement intercomparison in the Qilian Mountains, north-eastern Tibetan Plateau. Cryosphere 2015, 9, 1995–2008. [Google Scholar] [CrossRef]
  29. Ebert, E.; Janowiak, J.; Kidd, C. Comparison of near-real-time precipitation estimates from satellite observations and numerical models. Bull. Am. Meteorol. Soc. 2007, 88, 47–64. [Google Scholar] [CrossRef]
  30. Tian, Y.; Peters-Lidard, C.; Eylander, J.; Joyce, R.; Huffman, G.; Adler, R.; Hsu, K.; Turk, F.; Garcia, M.; Zeng, J. Component analysis of errors in satellite-based precipitation estimates. J. Geophys. Res. 2009, 114, D24101. [Google Scholar] [CrossRef]
  31. Garcia, M.; Peters-Lidard, C.; Goodrich, D. Spatial interpolation of precipitation in a dense gauge network for monsoon storm events in the southwestern United States. Water Resour. Res. 2008, 44, W05S13. [Google Scholar] [CrossRef]
  32. Yong, B.; Ren, L.; Hong, Y.; Wang, J.; Gourley, J.; Jiang, S.; Chen, X.; Wang, W. Hydrologic evaluation of multisatellite precipitation analysis standard precipitation products in basins beyond its inclined latitude band: A case study in Laohahe basin, China. Water Resour. Res. 2010, 46, W07542. [Google Scholar] [CrossRef]
  33. Bajracharya, S.; Palash, W.; Shrestha, M.; Khadgi, V.; Duo, C.; Das, P.; Dorji, C. Systematic evaluation of satellite-based rainfall products over the Brahmaputra basin for hydrologic applications. Adv. Meteorol. 2015, 2015. [Google Scholar] [CrossRef]
  34. Tang, G.; Zeng, Z.; Guo, X.; Long, D.; Yong, B.; Hong, Y. Statistical and hydrological comparison between IMERG and TMPA products over a mid-latitude basin: Is GPM a good successor for TRMM. J. Hydrometeorol. 2016, 17, 121–137. [Google Scholar] [CrossRef]
  35. Sandwell, D. Biharmonic spline interpolation of GEOS-3 and SEASAT altimeter data. Geophys. Res. Lett. 1987, 14, 139–142. [Google Scholar] [CrossRef]
  36. Chen, D.; Dai, Y. Characteristics of Northwest China rainfall intensity in recent 50 years. Chin. J. Atmos. Sci. 2008, 33, 923–935. (In Chinese) [Google Scholar]
  37. Gochis, D.; Jimenez, A.; Watts, C.; Garatuza-Payan, J.; Shuttleworth, W. Analysis of 2002 and 2003 warm-season precipitation from the North American Monsoon Experiment event rain gauge network. Mon. Weather Rev. 2004, 132, 2938–2953. [Google Scholar] [CrossRef]
  38. Xue, X.; Hong, Y.; Limaye, A.S.; Gourley, J.J.; Huffman, G.J.; Khan, S.I.; Dorji, C.; Chen, S. Statistical and hydrological evaluation of TRMM-based Multi-satellite Precipitation Analysis over the Wangchu Basin of Bhutan: Are the latest satellite precipitation products 3B42V7 ready for use in ungauged basins? J. Hydrol. 2013, 499, 91–99. [Google Scholar] [CrossRef]
  39. Su, F.; Gao, H.; Huffman, G.J.; Lettenmaier, D.P. Potential utility of the real-time TMPA-RT precipitation estimates in streamflow prediction. J. Hydrometeorol. 2011, 12, 444–455. [Google Scholar] [CrossRef]
  40. Hao, Z.; Tong, K.; Liu, X.; Zhang, L. Capability of TMPA products to simulate streamflow in upper Yellow and Yangtze River basins on Tibetan Plateau. Water Sci. Eng. 2014, 7, 237–249. [Google Scholar]
  41. Yong, B.; Liu, D.; Gourley, J.; Tian, Y.; Huffman, G.; Ren, L.; Hong, Y. Global view of real-time TRMM Multisatellite precipitation analysis: Implications for its successor Global Precipitation Measurement mission. Bull. Am. Meteorol. Soc. 2015, 96, 283–296. [Google Scholar] [CrossRef]
  42. Dinku, T.; Chidzambwa, S.; Ceccato, P.; Connor, S.; Ropelewski, C. Validation of high-resolution satellite rainfall products over complex terrain in Africa. Int. J. Remote Sens. 2008, 29, 4097–4110. [Google Scholar] [CrossRef]
  43. Shige, S.; Kida, S.; Ashiwake, H.; Kubota, T.; Aonashi, K. Improvement of TMI rain retrievals in mountainous areas. J. Appl. Meteorol. Climatol. 2013, 52, 242–254. [Google Scholar] [CrossRef]
  44. Behrangi, A.; Andreadis, K.; Fisher, J.B.; Turk, F.J.; Granger, S.; Painter, T.; Das, N. Satellite-based precipitation estimation and its application for streamflow prediction over mountainous western U.S. basins. J. Appl. Meteorol. Climatol. 2014, 53, 2823–2842. [Google Scholar] [CrossRef]
  45. Yao, T.; Masson-Delmotte, V.; Gao, J.; Yu, W.; Yang, X.; Risi, C.; Sturm, C.; Werner, M.; Zhao, H.; He, Y.; et al. A review of climatic controls on δ18O in precipitation over the Tibetan Plateau: Observations and simulations. Rev. Geophys. 2013, 51, 525–548. [Google Scholar] [CrossRef] [Green Version]
Figure 1. Overview of the geographical and topographical location of the Tibetan Plateau (TP) and three main river basins, where the red, blue and black polygons indicate the basin of the Yellow River, Yangtze River and Brahmaputra, respectively; the black dots show rain gauges, and the red rectangle shows the field experimental site for snowfall observation.
Remotesensing 08 00569 g001
Figure 2. Maps of the mean three-hourly (a) IMERG and (b) 3B42V7 rainfall estimates in the warm season of 2014 over the TP.
Remotesensing 08 00569 g002
Figure 3. Maps of (a,b) Relative Bias (RB); (c,d) Root Mean Square Error (RMSE); (e,f) Correlation Coefficients (CC) and (g,h) scatter diagram between satellite and gauge-based three-hourly rainfall estimates in the warm season (April–September) of 2014 over the TP. Notes: the left panel, i.e., (a,c,e,g), stands for IMERG rainfall estimates, and the right panel, i.e., (b,d,f,h) stands for 3B42V7 products.
Remotesensing 08 00569 g003
Figure 4. Spatial patterns of averaged three-hourly relative bias (RB) (left and middle column) and its percentage of RB basin area (%) (right column) derived from satellite products and gauge observations in the three main river basins, where the top panel, i.e., (ac), is the Yellow River basin; the middle panel, i.e., (df), is the Yangtze River basin; and the bottom panel, i.e., (gi), is the Brahmaputra basin. The left column stands for the IMERG rainfall estimates and the middle side is the 3B42V7 data.
Remotesensing 08 00569 g004
Figure 5. Variation of area mean daily rainfall for each river basin, i.e., (a) Yellow River; (b) Yangtze River and (c) Brahmaputra, in the warm season of 2014. The black line denotes gauge observations; the red one stands for the IMERG estimates; and the blue one is the 3B42V7 products.
Remotesensing 08 00569 g005
Figure 6. Elevation-related analyses of three-hourly rainfall indices in the warm season of 2014: (ac) the Correlation Coefficients (CC), Probability Of Detection (POD) and False Alarm Ratio (FAR) between satellite data and gauge observations as the elevation increases. Note that the grey square stands for 258 gauges recorded according to elevation; the red lines stand for IMERG estimates; the blue lines stand for 3B42V7 products and the comparison was calculated at 3-hourly scale.
Remotesensing 08 00569 g006
Figure 7. Comparison of IMERG and gauge-based daily rainfall in the warm season of 2014 over the TP: (ac) the maximum, mean and conditional mean of daily rainfall in the warm season as the elevation increases. Note that the grey square stands for 258 gauges recorded according to elevation; the black line denotes gauge observations; the red one stands for the IMERG estimates; and the blue one is the 3B42V7 products.
Remotesensing 08 00569 g007
Figure 8. Comparison of IMERG and gauge-based daily rainfall in the warm season of 2014 over the TP: (ad) the probability of raining days, light rainfall (0–10 mm/d), moderate rainfall (10–25 mm/d) and heavy rainfall (>25 mm/d) in the warm season as the elevation increases. Note that the grey square stands for 258 gauges recorded according to elevation; the black line denotes gauge observations; the red one stands for the IMERG estimates; and the blue one is the 3B42V7 products.
Remotesensing 08 00569 g008
Figure 9. Comparison of satellite products and gauge observations with latitudes in the warm season of 2014 over the TP: (a) the 258 gauges recorded according to their latitudes; (bd) the surging of Indian monsoon illustrated from the gauge, IMERG and 3B42V7 datasets. Note that the unit in (bd) is mm per day (mm/d).
Remotesensing 08 00569 g009
Figure 10. IMERG retrieved total precipitation and snowfall amount comparison within the ground observed snowfall at the field experimental site of northeastern TP.
Remotesensing 08 00569 g010
Table 1. Mean values of Correlation Coefficients (CC), Root Mean Square Error (RMSE) (mm) and Relative Bias (RB) (%) for IMERG and 3B42 Version 7 (3B42V7) rainfall estimates at hourly and 3-hourly timescales in the warm season of 2014 over the Tibetan Plateau (TP).
CCRMSE (mm)RB (%)
HourlyIMERG0.322.9430.6
3-HourlyIMERG0.453.2628.1
3B42V70.423.4748.6
Table 2. List of Relative Bias (RB) features (i.e., minimum, mean and maximum) and corresponding Standard Deviation (SD) for IMERG and 3B42V7 rainfall estimates at hourly and 3-hourly timescales in the Yellow River, Yangtze River and Brahmaputra basins in the warm season of 2014 over the Tibetan Plateau (TP).
Minimum (%)Mean (%)Maximum (%)SD (%)
Yellow RiverhourlyIMERG−40.54.4236.228.7
3-hourlyIMERG−40.33.7149.026.1
3B42V7−33.15.8192.924.2
Yangtze RiverhourlyIMERG−46.912.0118.221.7
3-hourlyIMERG−46.810.8118.220.4
3B42V7−35.413.8129.319.4
BrahmaputrahourlyIMERG−77.835.6422.649.9
3-hourlyIMERG−77.735.6410.849.5
3B42V7−41.092.6340.359.6
Table 3. The successfully detected snowfall amounts’ comparison between IMERG retrieval and field snowfall observation at a site of northeastern TP.
DateIMERG (mm)Field Snowfall
Total PrecipitationSnowfallObservation (mm)
1 April 20140.20.22.4
10 October 201418.111.09.4
11 October 20142.02.06.3
30 October 20141.11.11.7

