
Three-Dimensional Surface Displacement Field Associated with the 25 April 2015 Gorkha, Nepal, Earthquake: Solution from Integrated InSAR and GPS Measurements with an Extended SISTEM Approach

Abstract
:
1. Introduction
2. Methods
2.1. SISTEM Approach
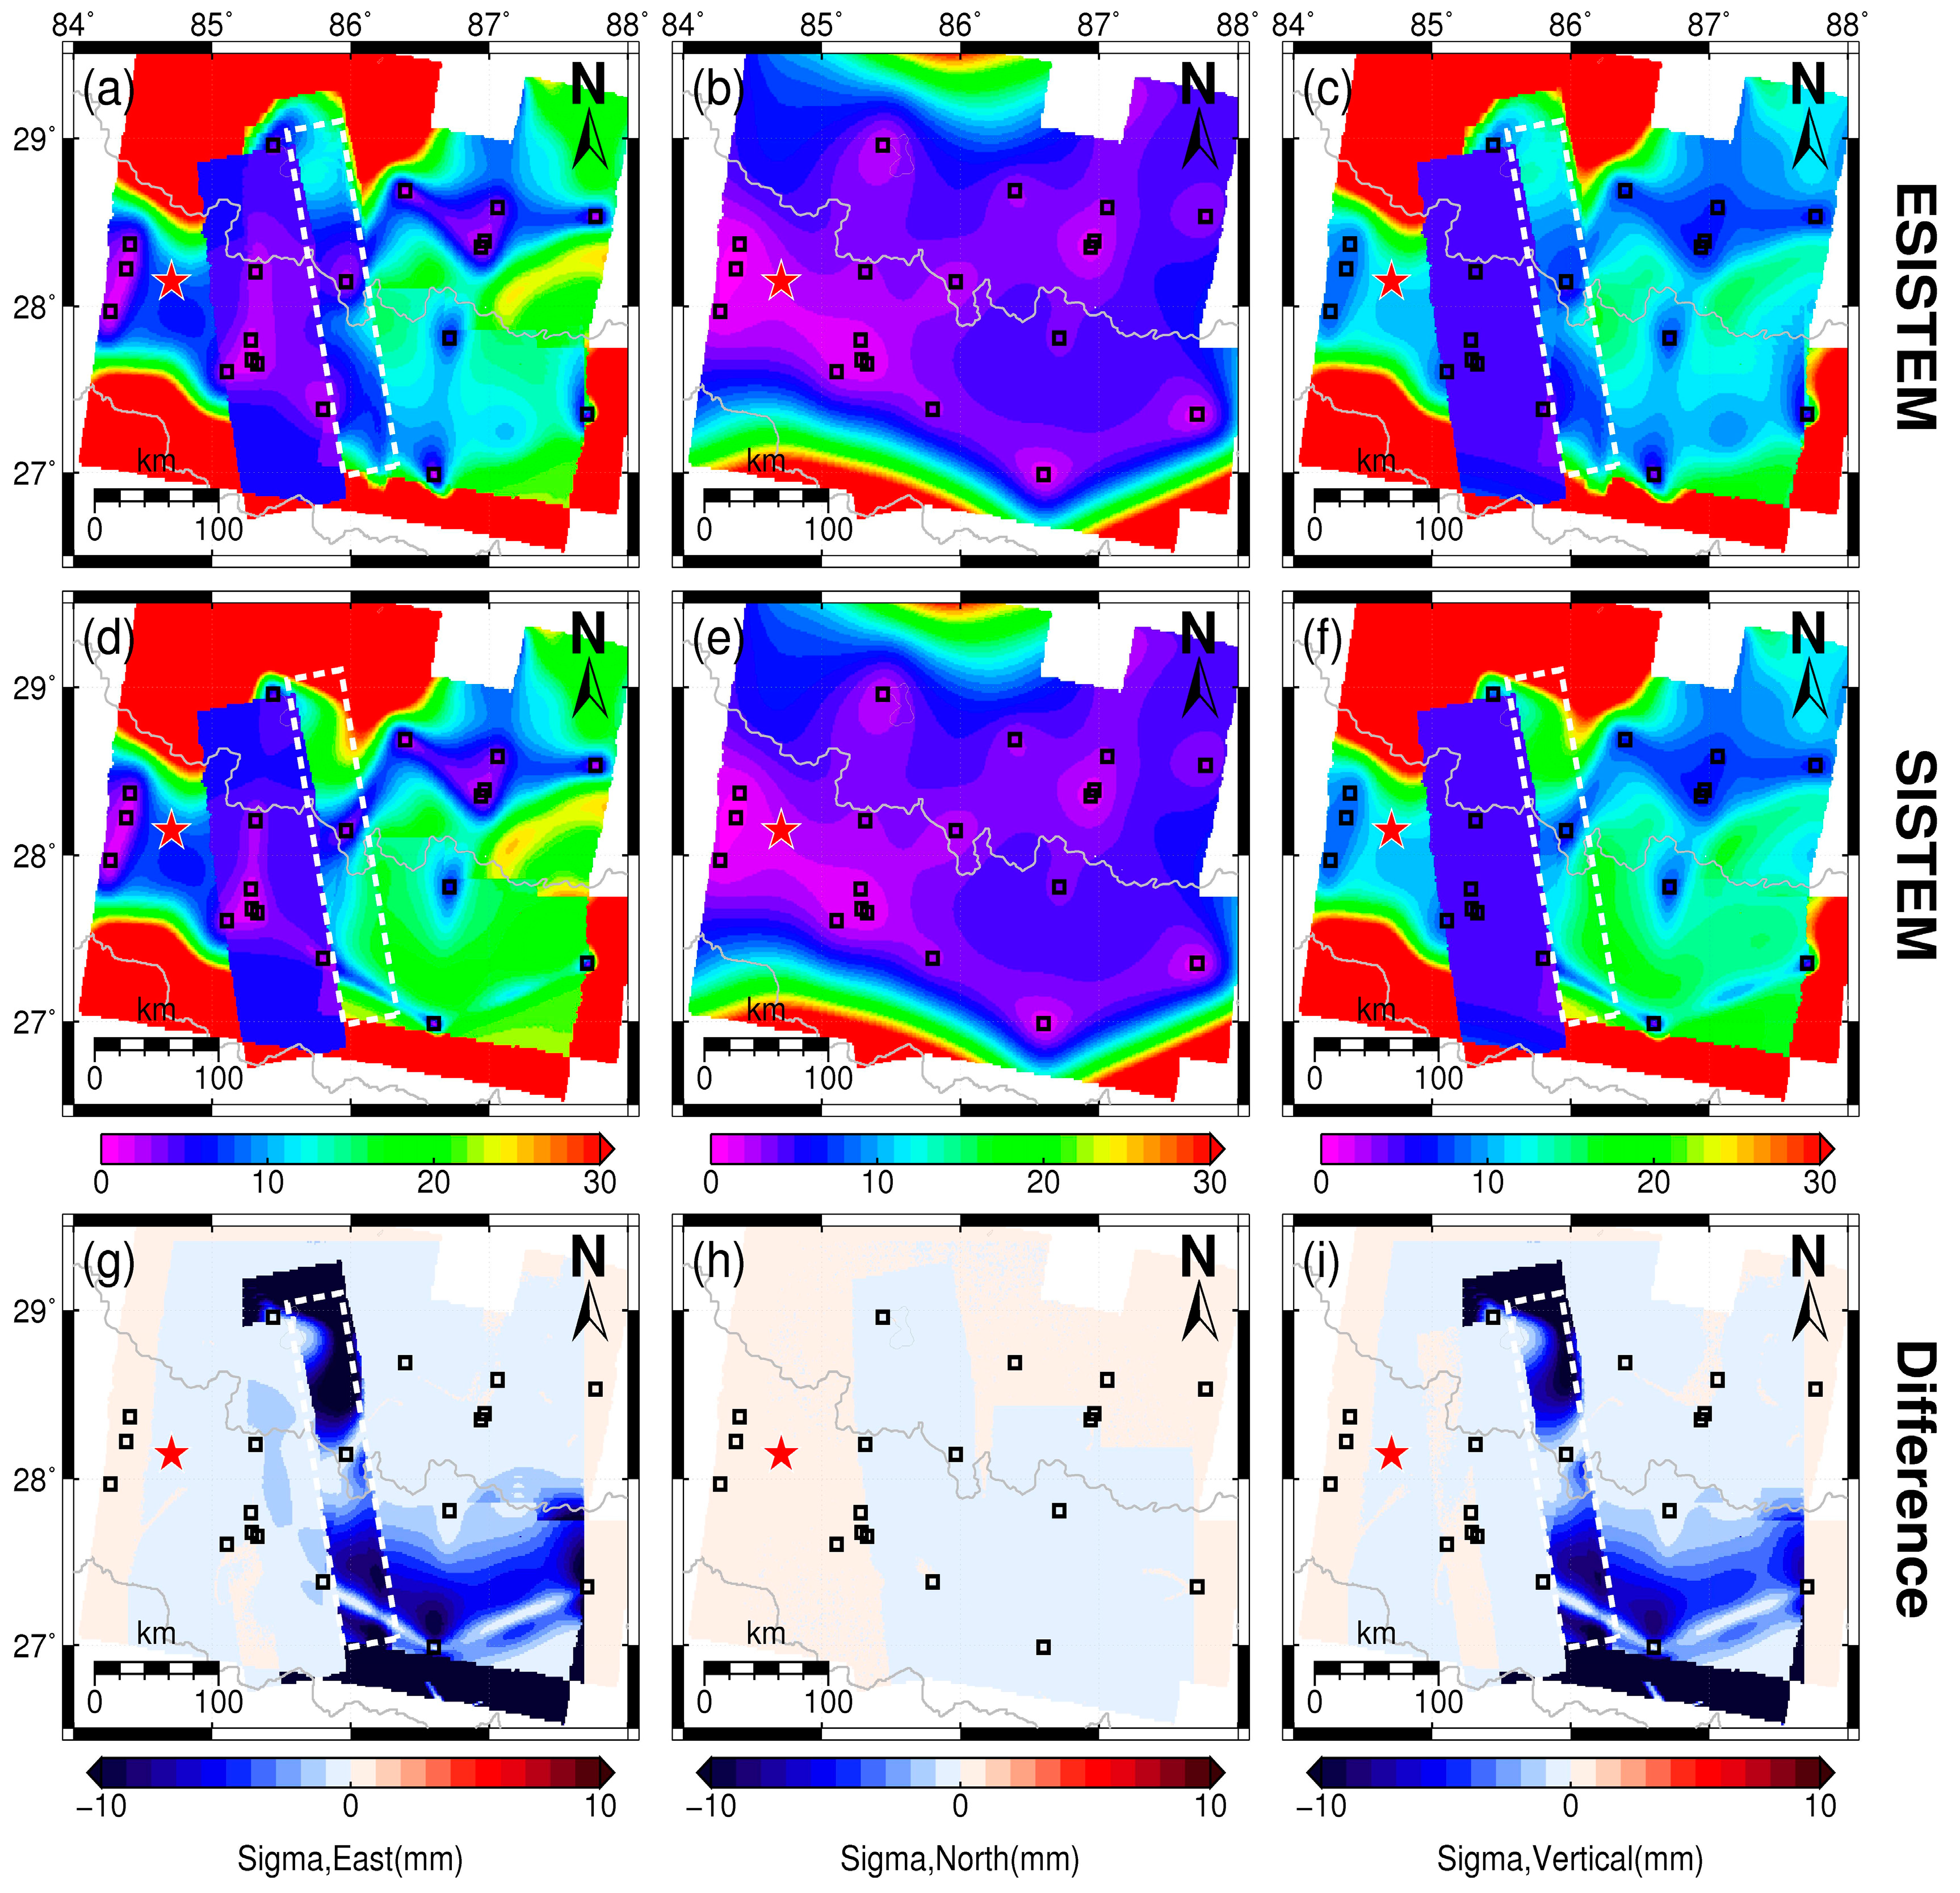
2.2. ESISTEM Approach
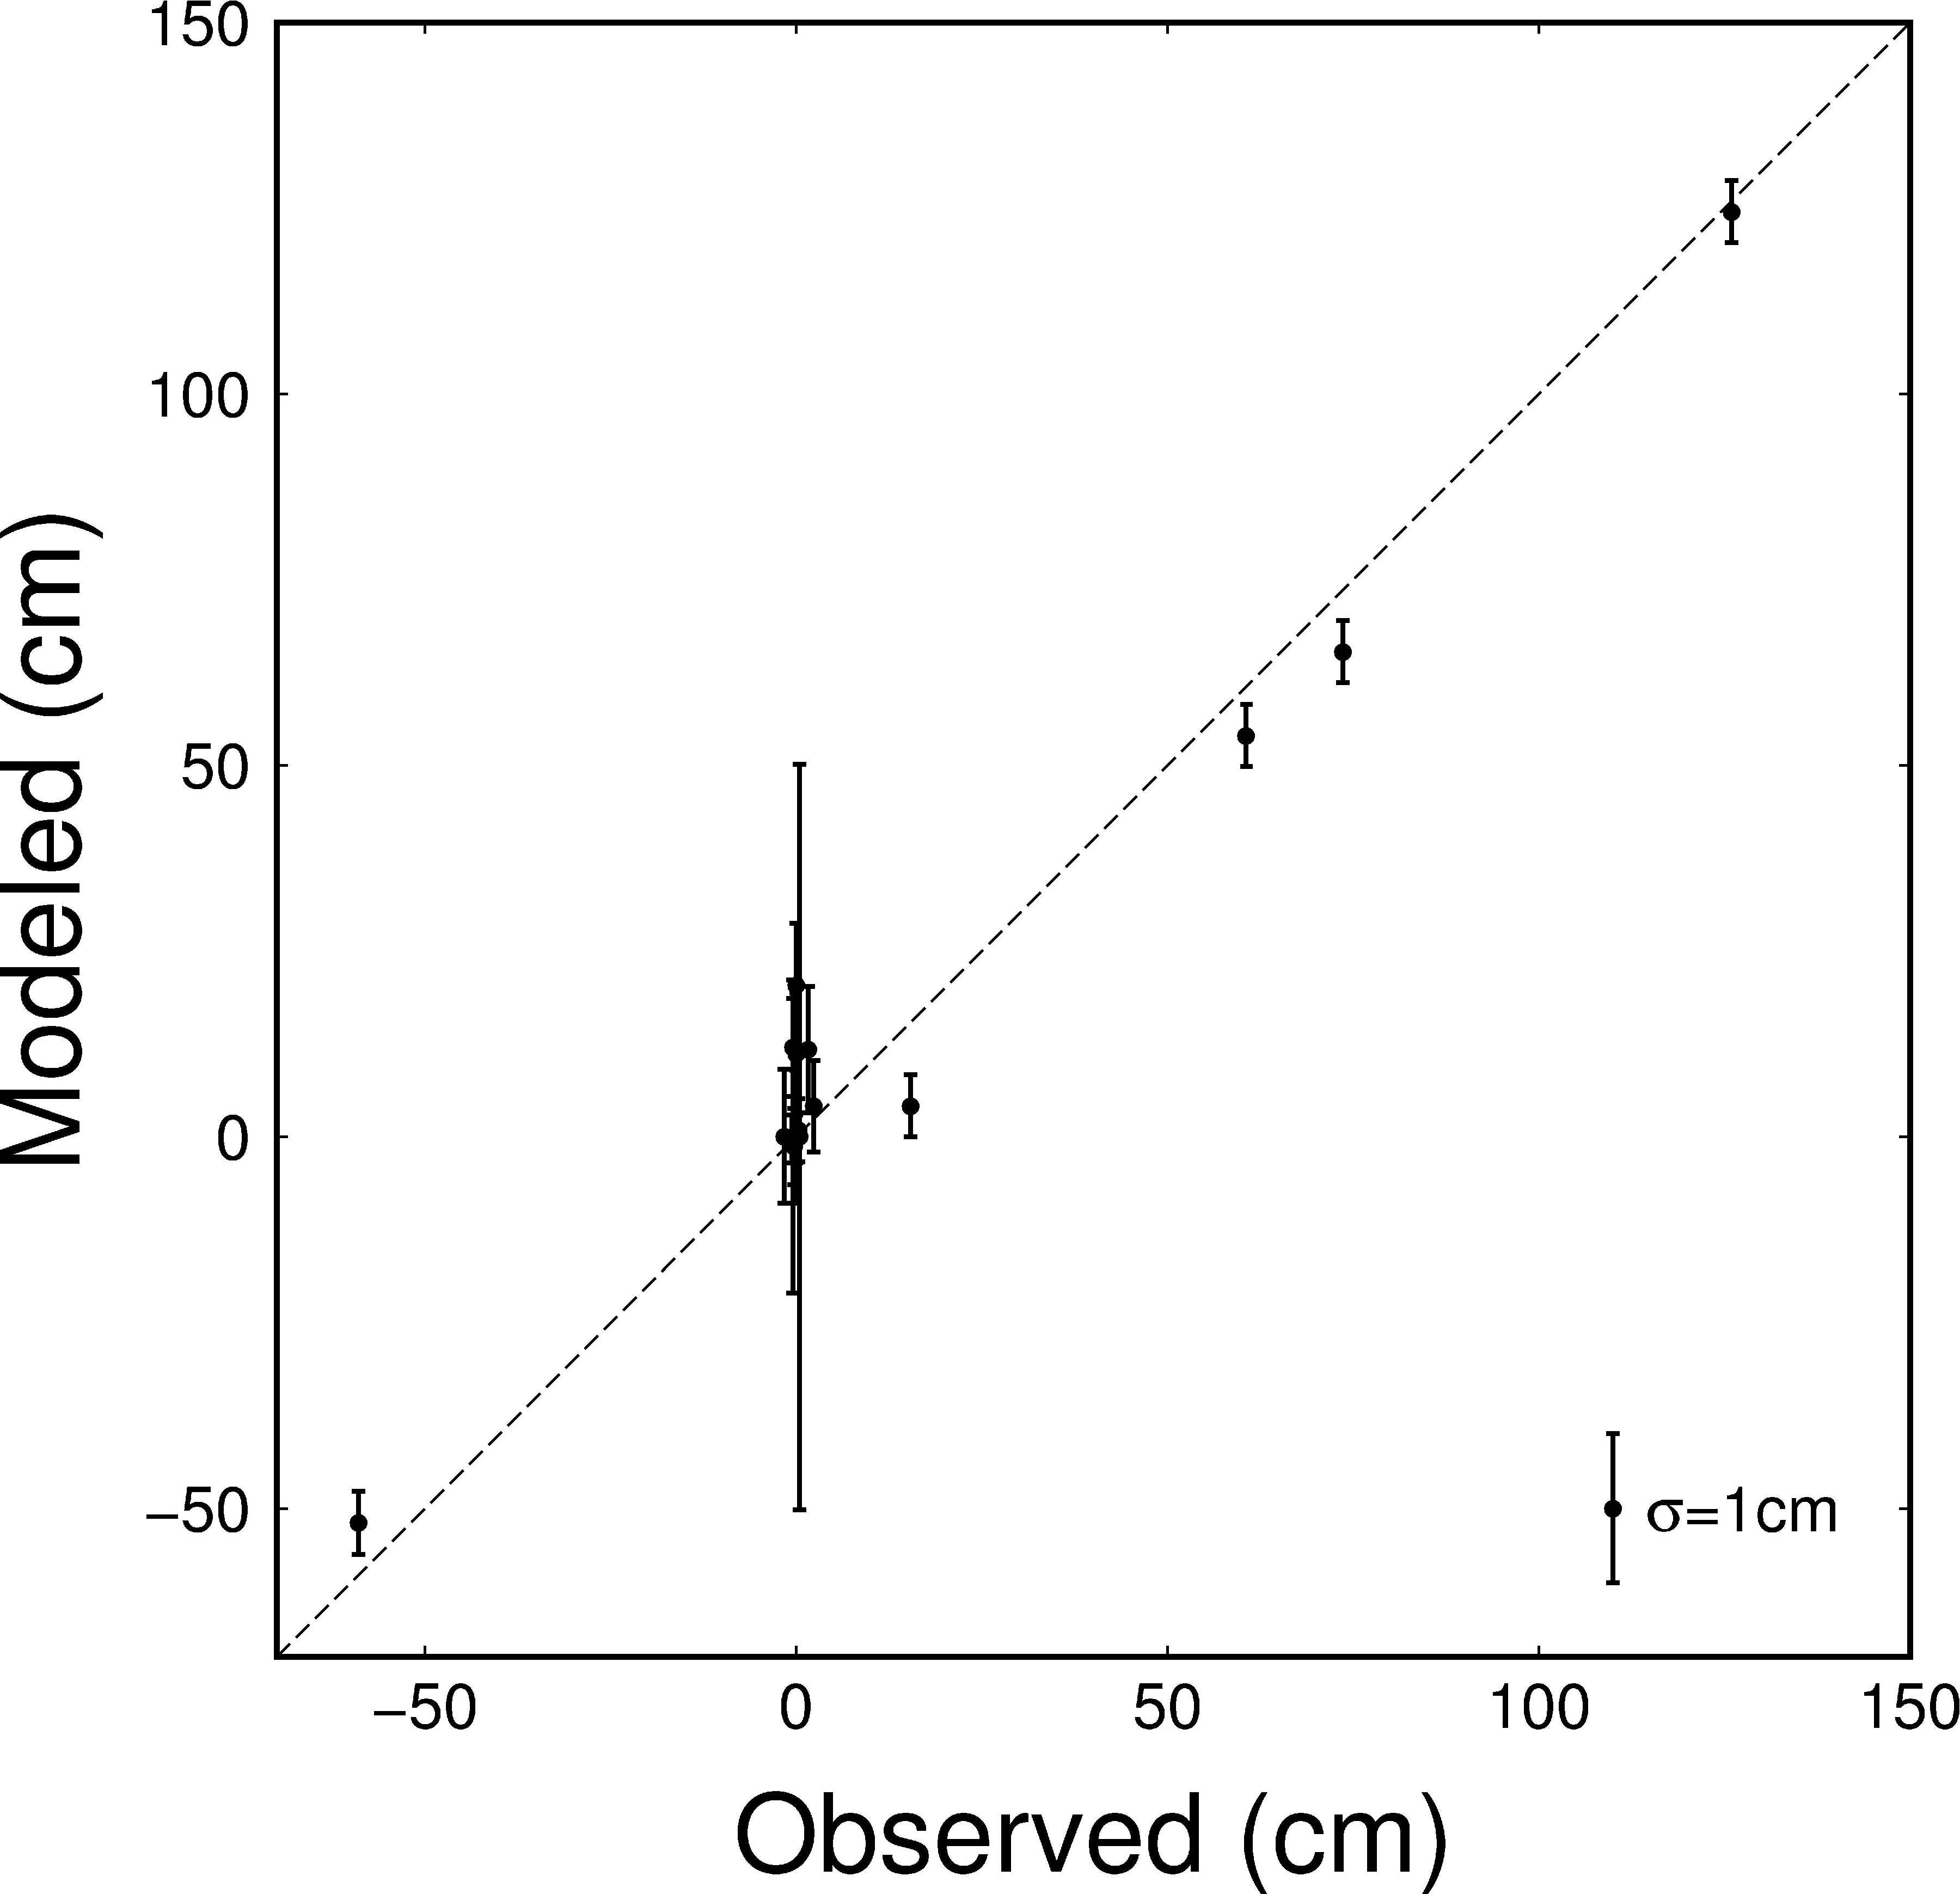
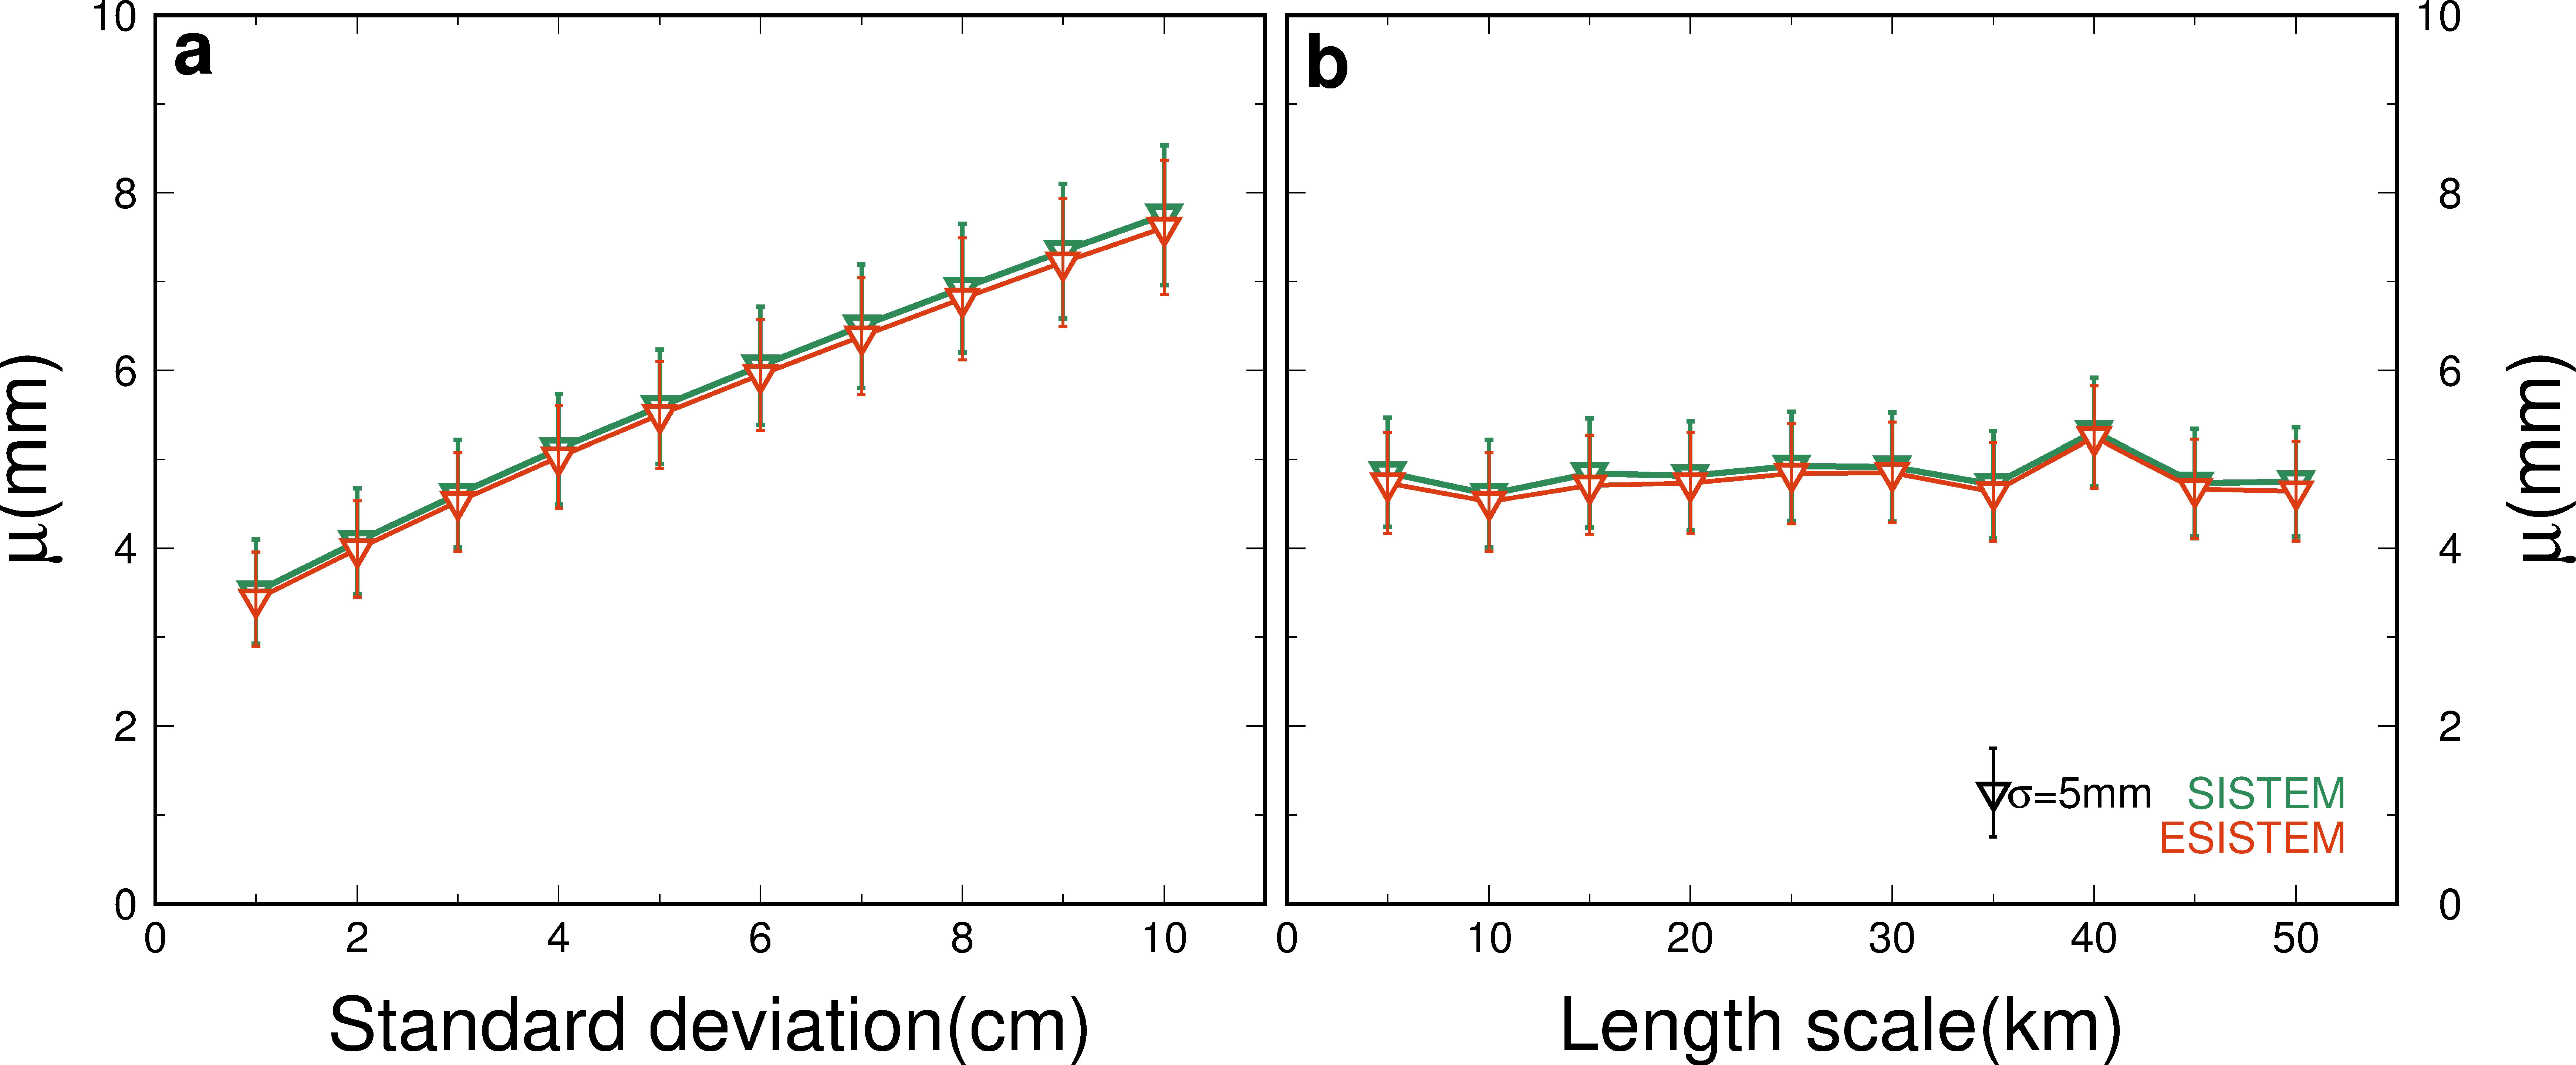
2.3. Synthetic Validation
3. Data
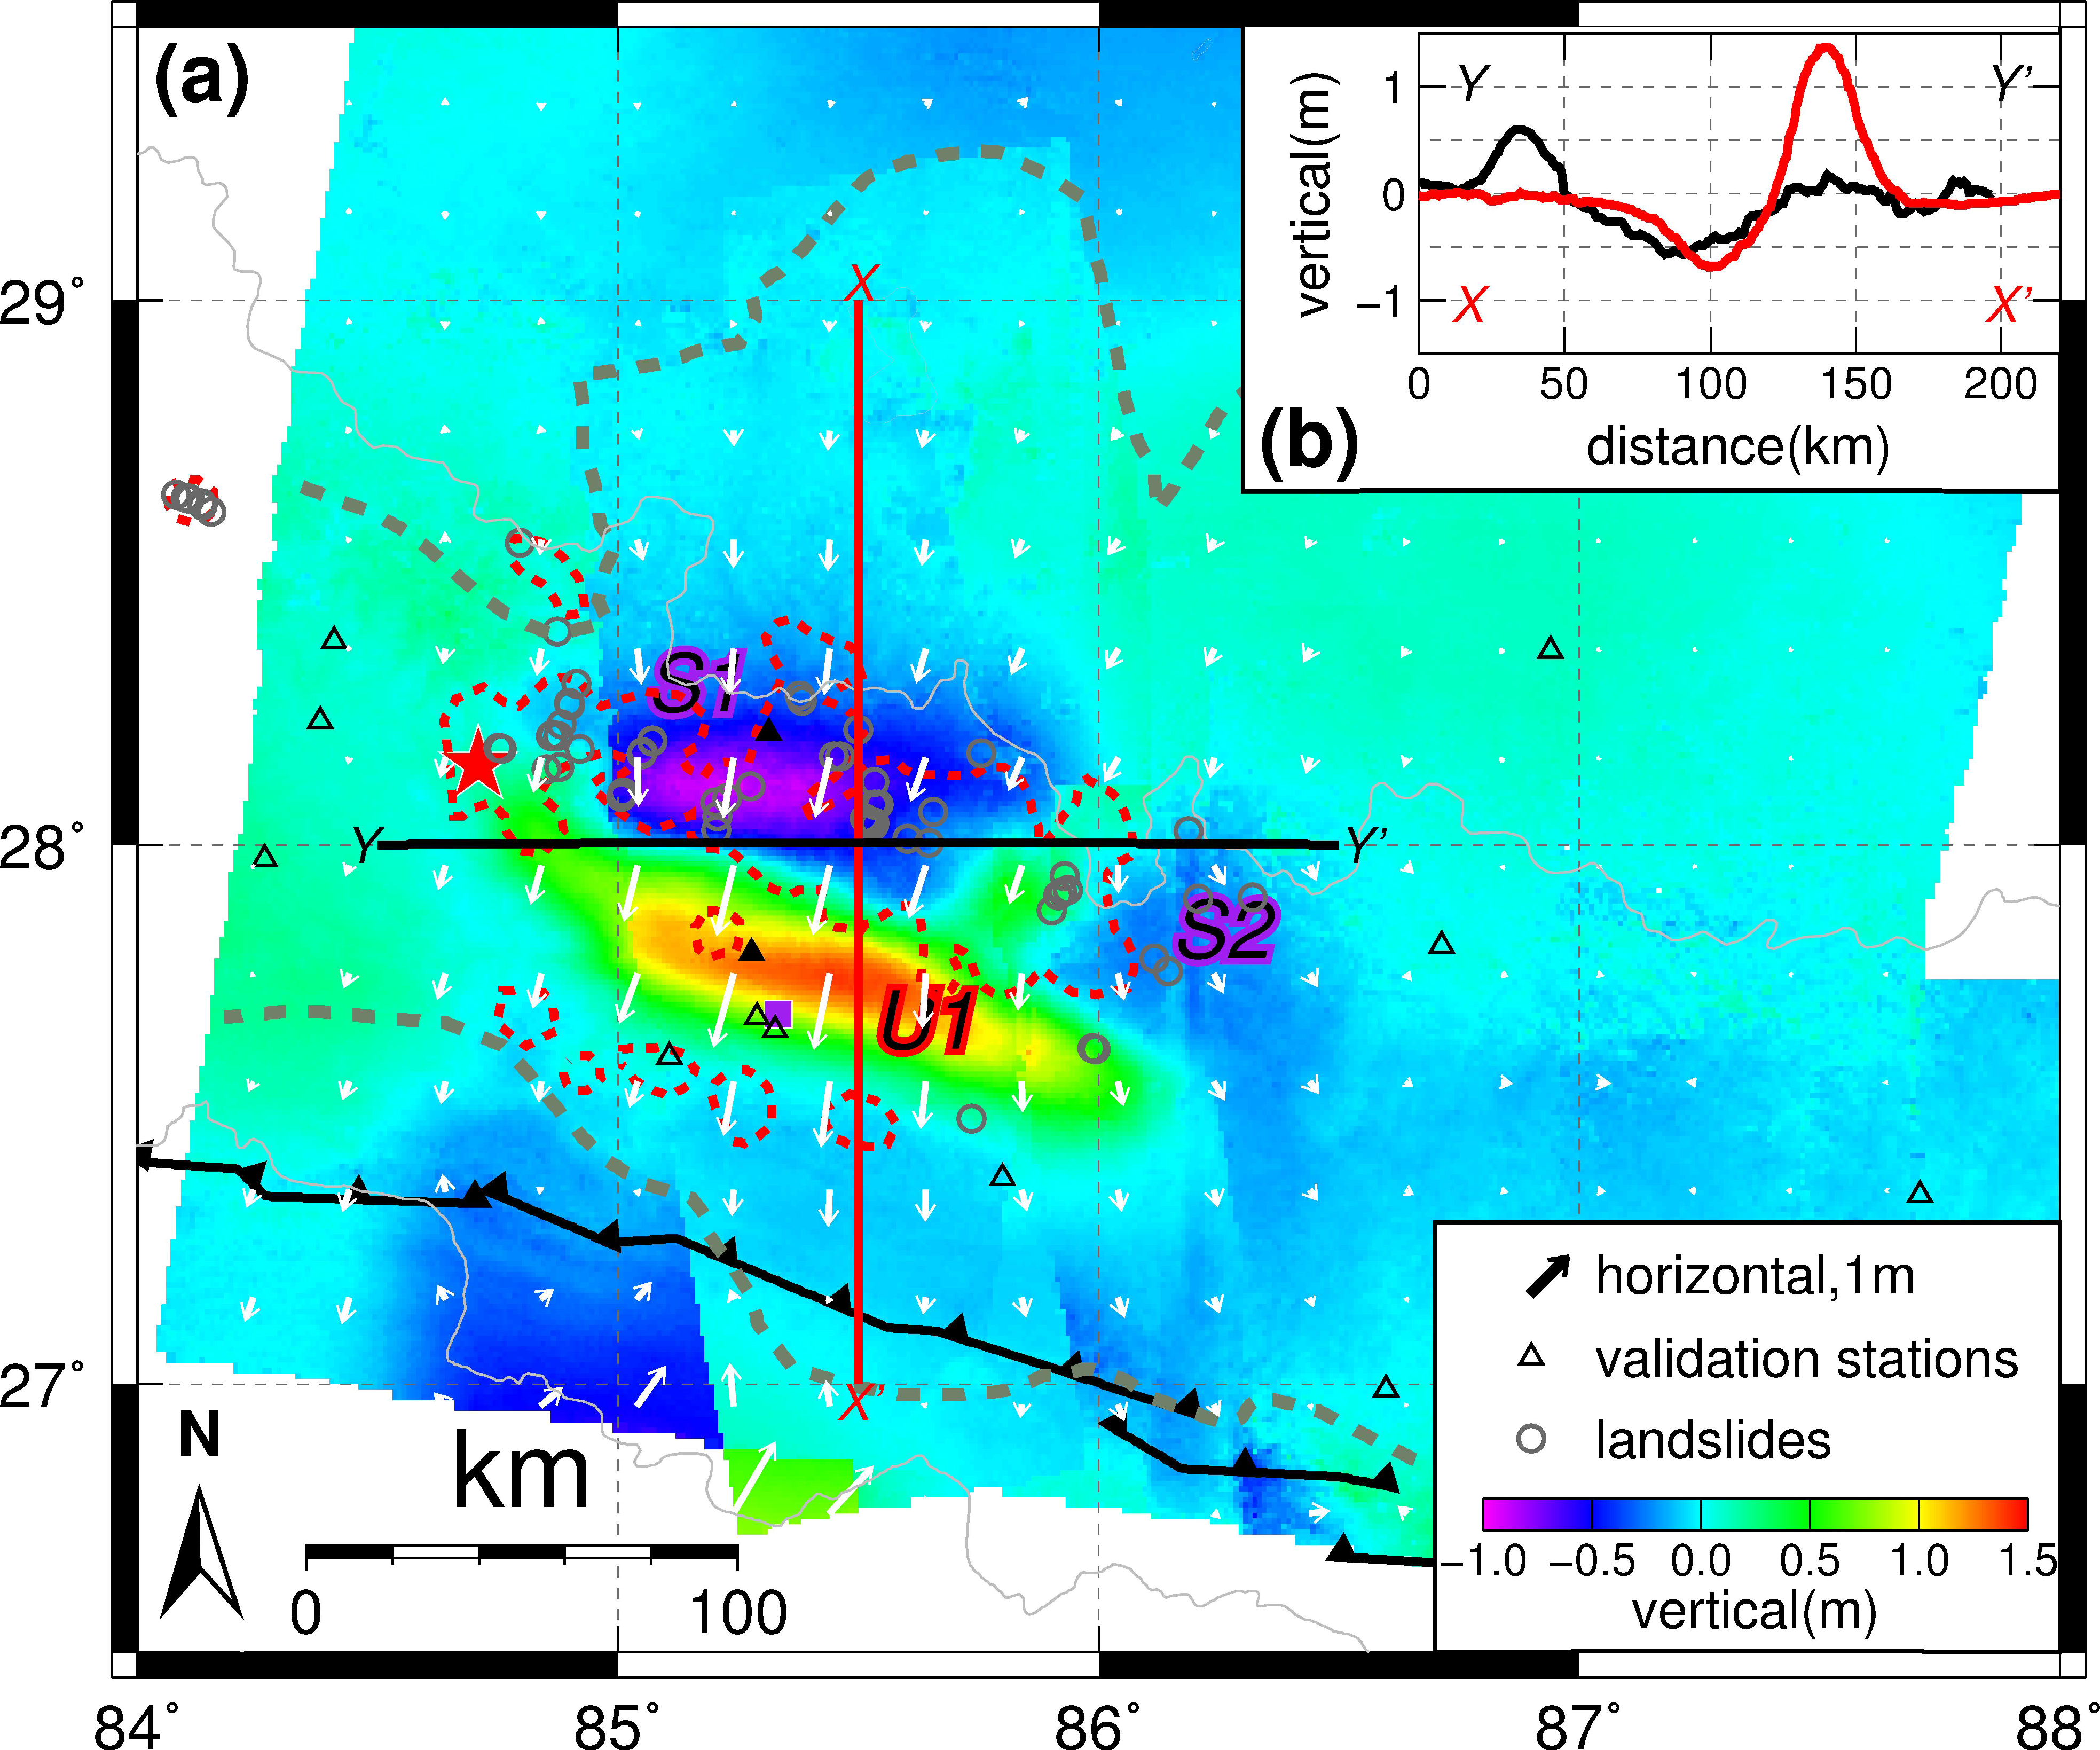
4. Results
5. Discussion
5.1. Robust Estimate in Regions Significantly Deformed
5.2. Relation to Earthquake-Induced Landslides
5.3. Sensitivity of ESISTEM to InSAR Errors
6. Conclusions
Supplementary Materials
Acknowledgments
Author Contributions
Conflicts of Interest
References
- Avouac, J.; Meng, L.; Wei, S.; Wang, T.; Ampuero, J. Lower edge of locked Main Himalayan Thrust unzipped by the 2015 Gorkha earthquake. Nat. Geosci. 2015, 8, 708–711. [Google Scholar] [CrossRef]
- Kargel, J.S.; Leonard, G.J.; Shugar, D.H.; Haritashya, U.K.; Bevington, A.; Fielding, E.J.; Fujita, K.; Geertsema, M.; Miles, E.S.; Steiner, J.; et al. Geomorphic and geologic controls of geohazards induced by Nepals 2015 Gorkha earthquake. Science 2016, 351, c8353. [Google Scholar] [CrossRef] [PubMed]
- Kobayashi, T.; Morishita, Y.; Yarai, H. Detailed crustal deformation and fault rupture of the 2015 Gorkha earthquake, Nepal, revealed from ScanSAR-based interferograms of ALOS-2. Earth Planets Space 2015. [Google Scholar] [CrossRef]
- Moss, R.E.S.; Thompson, E.M.; Scott Kieffer, D.; Tiwari, B.; Hashash, Y.M.A.; Acharya, I.; Adhikari, B.R.; Asimaki, D.; Clahan, K.B.; Collins, B.D.; et al. Geotechnical effects of the 2015 magnitude 7.8 Gorkha, Nepal, earthquake and aftershocks. Seismol. Res. Lett. 2015, 86, 1514–1523. [Google Scholar] [CrossRef]
- Galetzka, J.; Melgar, D.; Genrich, J.F.; Geng, J.; Owen, S.; Lindsey, E.O.; Xu, X.; Bock, Y.; Avouac, J.P.; Adhikari, L.B.; et al. Slip pulse and resonance of the Kathmandu basin during the 2015 Gorkha earthquake, Nepal. Science 2015, 349, 1091–1095. [Google Scholar] [CrossRef] [PubMed]
- Angster, S.; Fielding, E.J.; Wesnousky, S.; Pierce, I.; Chamlagain, D.; Gautam, D.; Upreti, B.N.; Kumahara, Y.; Nakata, T. Field Reconnaissance after the 25 April 2015 M 7.8 Gorkha Earthquake. Seismol. Res. Lett. 2015, 86, 1506–1513. [Google Scholar] [CrossRef]
- Feng, G.; Li, Z.; Shan, X.; Zhang, L.; Zhang, G.; Zhu, J. Geodetic model of the 2015 April 25 MW 7.8 Gorkha Nepal Earthquake and MW 7.3 aftershock estimated from InSAR and GPS data. Geophys. J. Int. 2015, 203, 896–900. [Google Scholar] [CrossRef]
- Grandin, R.; Vallée, M.; Satriano, C.; Lacassin, R.; Klinger, Y.; Simoes, M.; Bollinger, L. Rupture process of the MW = 7.9 2015 Gorkha earthquake (Nepal): Insights into Himalayan megathrust segmentation. Geophys. Res. Lett. 2015, 42, 8373–8382. [Google Scholar] [CrossRef]
- Hayes, G.P.; Briggs, R.W.; Barnhart, W.D.; Yeck, W.L.; McNamara, D.E.; Wald, D.J.; Nealy, J.L.; Benz, H.M.; Gold, R.D.; Jaiswal, K.S.; et al. Rapid characterization of the 2015 MW 7.8 Gorkha, Nepal, earthquake sequence and its seismotectonic context. Seismol. Res. Lett. 2015, 86, 1557–1567. [Google Scholar] [CrossRef]
- Wang, K.; Fialko, Y. Slip model of the 2015 MW 7.8 Gorkha (Nepal) earthquake from inversions of ALOS-2 and GPS data. Geophys. Res. Lett. 2015, 42, 7452–7458. [Google Scholar] [CrossRef]
- Collins, B.D.; Jibson, R.W. Assessment of existing and potential landslide hazards resulting from the 25 April 2015 Gorkha, Nepal earthquake sequence. U.S. Geol. Surv. 2015. [Google Scholar] [CrossRef]
- Avouac, J. Mountain building, erosion, and the seismic cycle in the Nepal Himalaya. Adv. Geophys. 2003, 46, 1–80. [Google Scholar]
- Ader, T.; Avouac, J.; Liu-Zeng, J.; Lyon-Caen, H.; Bollinger, L.; Galetzka, J.; Genrich, J.; Thomas, M.; Chanard, K.; Sapkota, S.N.; et al. Convergence rate across the Nepal Himalaya and interseismic coupling on the Main Himalayan Thrust: Implications for seismic hazard. J. Geophys. Res. 2012. [Google Scholar] [CrossRef]
- Gudmundsson, S.; Sigmundsson, F.; Carstensen, J.M. Three-dimensional surface motion maps estimated from combined interferometric synthetic aperture radar and GPS data. J. Geophys. Res. Solid Earth 2002, 107, 11–13. [Google Scholar] [CrossRef]
- Guglielmino, F.; Nunnari, G.; Puglisi, G.; Spata, A. Simultaneous and integrated strain tensor estimation from geodetic and satellite deformation measurements to obtain three-dimensional displacement maps. IEEE Trans. Geosci. Remote 2011, 49, 1815–1826. [Google Scholar] [CrossRef]
- Luo, H.; Liu, Y.; Chen, T.; Xu, C.; Wen, Y. Derivation of 3-D surface deformation from an integration of InSAR and GNSS measurements based on Akaike’s Bayesian Information Criterion. Geophys. J. Int. 2016, 204, 292–310. [Google Scholar] [CrossRef]
- Samsonov, S.; Tiampo, K. Analytical optimization of a DInSAR and GPS dataset for derivation of three-dimensional surface motion. IEEE Geosci. Remote Sens. 2006, 3, 107–111. [Google Scholar] [CrossRef]
- Guglielmino, F.; Bignami, C.; Bonforte, A.; Briole, P.; Obrizzo, F.; Puglisi, G.; Stramondo, S.; Wegmüller, U. Analysis of satellite and in situ ground deformation data integrated by the SISTEM approach: The 3 April 2010 earthquake along the Pernicana fault (Mt. Etna—Italy) case study. Earth Planet. Sci. Lett. 2011, 312, 327–336. [Google Scholar] [CrossRef]
- Guglielmino, F.; Anzidei, M.; Briole, P.; Elias, P.; Puglisi, G. 3D displacement maps of the 2009°L′Aquila earthquake (Italy) by applying the SISTEM method to GPS and DInSAR data. Terra Nova 2013, 25, 79–85. [Google Scholar] [CrossRef]
- Okada, Y. Surface deformation due to shear and tensile faults in a half-space. Seismol. Soc. Am. 1985, 75, 1135–1154. [Google Scholar]
- Lohman, R.B.; Simons, M. Some thoughts on the use of InSAR data to constrain models of surface deformation: Noise structure and data downsampling. Geochem. Geophys. Geosyst. 2005, 6. [Google Scholar] [CrossRef]
- Barnhart, W.D.; Lohman, R.B. Automated fault model discretization for inversions for coseismic slip distributions. J. Geophys. Res. 2010, 115. [Google Scholar] [CrossRef]
- De Michele, M.; Raucoules, D.; de Sigoyer, J.; Pubellier, M.; Chamot-Rooke, N. Three-dimensional surface displacement of the 2008 May 12 Sichuan earthquake (China) derived from Synthetic Aperture Radar: Evidence for rupture on a blind thrust. Geophys. J. Int. 2010, 183, 1097–1103. [Google Scholar] [CrossRef]
- Fukuda, J.; Johnson, K.M. A Fully Bayesian inversion for spatial distribution of fault slip with objective smoothing. Bull. Seismol. Soc. Am. 2008, 98, 1128–1146. [Google Scholar] [CrossRef]
- Fukuda, J.; Johnson, K.M. Mixed linear-non-linear inversion of crustal deformation data: Bayesian inference of model, weighting and regularization parameters. Geophys. J. Int. 2010, 181, 1441–1458. [Google Scholar] [CrossRef]
- Lindsey, E.O.; Natsuaki, R.; Xu, X.; Shimada, M.; Hashimoto, M.; Melgar, D.; Sandwell, D.T. Line-of-sight displacement from ALOS-2 interferometry: MW 7.8 Gorkha Earthquake and MW 7.3 aftershock. Geophys. Res. Lett. 2015, 42, 6655–6661. [Google Scholar] [CrossRef]
- Feng, W.; Lindsey, E.; Barbot, S.; Samsonov, S.; Dai, K.; Li, P.; Li, Z.; Almeida, R.; Chen, J.; Xu, X. Source characteristics of the 2015 MW 7.8 Gorkha (Nepal) earthquake and its MW 7.2 aftershock from space geodesy. Tectonophysics 2016. [Google Scholar] [CrossRef]
- Su, X.; Wang, Z.; Meng, G.; Xu, W.; Ren, J. Pre-seismic strain accumulation and co-seismic deformation of the 2015 Nepal Ms 8.1 earthquake observed by GPS. Chin. Sci. Bull. 2015, 60, 2115–2123. (In Chinese) [Google Scholar] [CrossRef]
- Zhao, B.; Du, R.; Zhang, R.; Tan, K.; Qiao, X.; Huang, Y.; Zhang, C. Co-seismic displacements associated with the 2015 Nepal MW 7.9 earthquake and MW 7.3 aftershock constrained by Global Positioning System Measurements (in Chinese). Chin. Sci. Bull. 2015, 60, 2758–2764. [Google Scholar] [CrossRef]
- Elliott, J.R.; Jolivet, R.; González, P.J.; Avouac, J.P.; Hollingsworth, J.; Searle, M.P.; Stevens, V.L. Himalayan megathrust geometry and relation to topography revealed by the Gorkha earthquake. Nat. Geosci. 2016, 9, 174–180. [Google Scholar] [CrossRef]
- Parameswaran, R.M.; Natarajan, T.; Rajendran, K.; Rajendran, C.P.; Mallick, R.; Wood, M.; Lekhak, H.C. Seismotectonics of the April–May 2015 Nepal earthquakes: An assessment based on the aftershock patterns, surface effects and deformational characteristics. J. Asian Earth Sci. 2015, 111, 161–174. [Google Scholar] [CrossRef]
- Awmoore. M7.8 Gorkha, Nepal Earthquake, 25 April 2015. Available online: http://aria.jpl.nasa.gov/node/43 (accessed on 29 June 2016).
- Fialko, Y.; Sandwell, D.; Simons, M.; Rosen, P. Three-dimensional deformation caused by the Bam, Iran, earthquake and the origin of shallow slip deficit. Nature 2005, 435, 295–299. [Google Scholar] [CrossRef] [PubMed]
- Pathier, E.; Fielding, E.J.; Wright, T.J.; Walker, R.; Parsons, B.E.; Hensley, S. Displacement field and slip distribution of the 2005 Kashmir earthquake from SAR imagery. Geophys. Res. Lett. 2006. [Google Scholar] [CrossRef]
- Tronin, A.A. Satellite remote sensing in seismology: A review. Remote Sens. Basel 2010, 2, 124–150. [Google Scholar] [CrossRef]
- Hu, J.; Wang, Q.; Li, Z.; Zhao, R.; Sun, Q. Investigating the ground deformation and source model of the Yangbajing geothermal field in Tibet, China with the WLS InSAR technique. Remote Sens. 2016, 8. [Google Scholar] [CrossRef]
- Dai, F.C.; Xu, C.; Yao, X.; Xu, L.; Tu, X.B.; Gong, Q.M. Spatial distribution of landslides triggered by the 2008 Ms 8.0 Wenchuan earthquake, China. J. Asian Earth Sci. 2011, 40, 883–895. [Google Scholar] [CrossRef]
- Xu, C.; Xu, X.; Yao, X.; Dai, F. Three (nearly) complete inventories of landslides triggered by the 12 May 2008 Wenchuan MW 7.9 earthquake of China and their spatial distribution statistical analysis. Landslides 2014, 11, 441–461. [Google Scholar] [CrossRef]
- Yin, Y.; Wang, F.; Sun, P. Landslide hazards triggered by the 2008 Wenchuan earthquake, Sichuan, China. Landslides 2009, 6, 139–152. [Google Scholar] [CrossRef]
- Kamp, U.; Growley, B.J.; Khattak, G.A.; Owen, L.A. GIS-based landslide susceptibility mapping for the 2005 Kashmir earthquake region. Geomorphology 2008, 101, 631–642. [Google Scholar] [CrossRef]
- Sato, H.P.; Hasegawa, H.; Fujiwara, S.; Tobita, M.; Koarai, M.; Une, H.; Iwahashi, J. Interpretation of landslide distribution triggered by the 2005 Northern Pakistan earthquake using SPOT 5 imagery. Landslides 2007, 4, 113–122. [Google Scholar] [CrossRef]
- Hanssen, R.A. Radar Interferometry: Data Interpretation and Error Analysis; Springer: New York, NY, USA, 2001. [Google Scholar]
- Wessel, P.; Smith, W.H.F. New, improved version of the generic mapping tools released. Eos Trans. AGU 1998, 579. [Google Scholar] [CrossRef]


© 2016 by the authors; licensee MDPI, Basel, Switzerland. This article is an open access article distributed under the terms and conditions of the Creative Commons Attribution (CC-BY) license (http://creativecommons.org/licenses/by/4.0/).
Share and Cite
Luo, H.; Chen, T. Three-Dimensional Surface Displacement Field Associated with the 25 April 2015 Gorkha, Nepal, Earthquake: Solution from Integrated InSAR and GPS Measurements with an Extended SISTEM Approach. Remote Sens. 2016, 8, 559. https://doi.org/10.3390/rs8070559
Luo H, Chen T. Three-Dimensional Surface Displacement Field Associated with the 25 April 2015 Gorkha, Nepal, Earthquake: Solution from Integrated InSAR and GPS Measurements with an Extended SISTEM Approach. Remote Sensing. 2016; 8(7):559. https://doi.org/10.3390/rs8070559
Chicago/Turabian StyleLuo, Haipeng, and Ting Chen. 2016. "Three-Dimensional Surface Displacement Field Associated with the 25 April 2015 Gorkha, Nepal, Earthquake: Solution from Integrated InSAR and GPS Measurements with an Extended SISTEM Approach" Remote Sensing 8, no. 7: 559. https://doi.org/10.3390/rs8070559
APA StyleLuo, H., & Chen, T. (2016). Three-Dimensional Surface Displacement Field Associated with the 25 April 2015 Gorkha, Nepal, Earthquake: Solution from Integrated InSAR and GPS Measurements with an Extended SISTEM Approach. Remote Sensing, 8(7), 559. https://doi.org/10.3390/rs8070559