Abstract
Beijing is one of the most water-stressed cities in the world. Due to over-exploitation of groundwater, the Beijing region has been suffering from land subsidence since 1935. In this study, the Small Baseline InSAR technique has been employed to process Envisat ASAR images acquired between 2003 and 2010 and TerraSAR-X stripmap images collected from 2010 to 2011 to investigate land subsidence in the Beijing region. The maximum subsidence is seen in the eastern part of Beijing with a rate greater than 100 mm/year. Comparisons between InSAR and GPS derived subsidence rates show an RMS difference of 2.94 mm/year with a mean of 2.41 ± 1.84 mm/year. In addition, a high correlation was observed between InSAR subsidence rate maps derived from two different datasets (i.e., Envisat and TerraSAR-X). These demonstrate once again that InSAR is a powerful tool for monitoring land subsidence. InSAR derived subsidence rate maps have allowed for a comprehensive spatio-temporal analysis to identify the main triggering factors of land subsidence. Some interesting relationships in terms of land subsidence were found with groundwater level, active faults, accumulated soft soil thickness and different aquifer types. Furthermore, a relationship with the distances to pumping wells was also recognized in this work.
1. Introduction
Located at the northern end of the North China Plain, Beijing is ranked as the 5th most water-stressed city in the world [1], and groundwater is the main water source for industrial, agricultural and household activities. With its rapid urban growth, there has been increasing water demand in Beijing. Previous studies [2,3] reveal that the Beijing region has been suffering from land subsidence due to over-exploitation of groundwater since 1935, and more seriously, the rate and extent of land subsidence shows an increasing trend. Land subsidence is a severe geohazard threating the safety of the public and urban infrastructure. Hence, continuous monitoring of land subsidence is critical for detecting potential hazards and designing compensation strategies.
Interferometric Synthetic Aperture Radar (InSAR) is a powerful tool widely used to map land subsidence over wide regions with high spatial-temporal resolutions. InSAR time series techniques such as Persistent Scatterer Interferometry (PSI) [4,5] and the Small Baseline Subset (SBAS) [6,7,8] can minimise the limitations of traditional InSAR (e.g., spatial and temporal decorrelation and atmospheric effects) and have been demonstrated to be able to map ground displacements with precision comparable to traditional geodetic techniques such as leveling [9,10,11,12]. In this work, the Small Baseline InSAR technique has been employed to investigate land subsidence in the Beijing region and its relationship with different triggering and conditioning factors.
Gong et al. [13] explored the application of PSI method to monitor land subsidence in Beijing with C-band Envisat ASAR data acquired from 2003 to 2006. Their results showed that the spatial pattern of the subsidence is influenced by Quaternary faults, and land subsidence often develops in areas with clay layer thicker than 50 m. Li et al. [14] employed SBAS InSAR to investigate city subsidence in Beijing with two adjacent tracks of C-band Envisat ASAR images, reporting a maximum subsidence rate reaching 100 mm/year in Chaoyang district. Chen et al. [15] studied the spatial and temporal evolution of the groundwater depression funnels in the Beijing plain and the 2D and 3D spatial evolution of land subsidence from a model based on the combination of piezometric, GPS, and radar data. Liang et al. [16] monitored the accumulated crustal deformation and its characteristics in Beijing and its surrounding areas by traditional D-InSAR method with L-band SAR data. They reported that the maximum deformation rate along Line of Sight (LOS) was about 125 mm/year between 2007 and 2010. Ng et al. [17] applied PS InSAR to 41 Envisat ASAR images (acquired from 2003 to 2009) and 24 ALOS PALSAR images (acquired from 2007 to 2009) to investigate the land deformation rate maps over Beijing showing that the vertical displacement rates were in the range of −115 to 6 mm/year. Zhu et al. [18] analyzed the spatial relationship between land subsidence and three factors (groundwater level, compressible soil thickness and building areas) by means of remote sensing and Geographical Information System (GIS) tools and used the Back Propagation Neural Network (BPN) model combined with Genetic Algorithm (GA) to simulate regional distribution of land subsidence. Hu et al. [19] used 52 Envisat ASAR images acquired from 2003 to 2010 to derive land deformation information in Beijing, and found a maximum subsidence velocity of up to 110 mm/year. Zhang et al. [20] utilized stress-strain analysis and oedometer tests to characterize the hydraulic and mechanical properties of the five hydrogeologic units at different depths in the Beijing plain. The results revealed that the second (64.5–82.3 m) and third (102–117 m) aquitards contributed 39% of the total compression deformation, and the second (82.3–102 m) and third (117–148 m) confined aquifers exhibited elasto-plastic mechanical behaviour. Zhu et al. [21] used SAR images, optical images and hydrogeological data to study the land subsidence in the northern Beijing plain. PS InSAR was applied to C-band Envisat ASAR images acquired from 2003 to 2010 to estimate land subsidence on this area. The results indicated that the largest subsidence rates reached 52 mm/year and the silty clay layers contribute to the larger land subsidence.
Compared with medium resolution SAR imagery such as C-band Envisat ASAR and L-band ALOS PALSAR data, recent advanced imaging radar sensors such as the TerraSAR-X SAR system (X-band radar wavelength and a shorter revisiting interval) can provide higher spatial resolution and geometric accuracy imagery, which makes it possible to monitor land subsidence at a finer scale [22,23]. Chen et al. [24] utilized C-band Envisat ASAR data and X-band COSMO-SkyMED images to detect land subsidence rates in Shanghai and validated the results by spirit leveling measurements. The results indicated the location of a significant subsidence funnel and the root mean square error of differences of the point targets between two band SAR images was 3 mm/year. Luo et al. [25] extracted land deformation information from L-band ALOS PALSAR data between 2007 and 2010 and X-band TerraSAR-X data from 2009 to 2010. The obtained results indicated that the subsidence rate was in the range of −90 mm/year to −10 mm/year from TerraSAR-X data and −190 to −10 mm/year from PALSAR data, which was in good agreement with leveling and GPS data.
Although existing investigations have tried different ways of monitoring land subsidence in the Beijing region [13,14,15,16,17,18,19,20,21], the consistency of the land subsidence monitoring results in this densely populated area in the world acquired by multi-wavelength InSAR time series analysis and validation by GPS data is rarely covered. Furthermore, the comprehensive and quantitative spatio-temporal analysis to identify the main conditioning and triggering factors of land subsidence still need to be systematically researched further. This paper aims to use TerraSAR-X (X-band) stripmap images collected from 2010 to 2011 and Envisat ASAR (C-band) images acquired between 2003 and 2010 to provide a new insight into the spatial and temporal distribution characteristics and main conditioning and triggering factors of land subsidence in the Beijing plain. The joint cross analysis of radar-derived deformation data and existing geo-information will help to improve the knowledge of the mechanisms that govern land subsidence to be used for the development of suitable groundwater management policies in this area. The paper is organized as follows: Section 2 describes the geographical and geological setting of the study area. SAR images and InSAR processing used in this work is described in Section 3. Section 4 shows the main InSAR-derived products, validation of the results and the spatial-temporal characteristics of land subsidence over the study area. Section 5 discusses and analyses the effect of different conditioning and triggering factors on land subsidence. The main conclusions are summarized in Section 6.
2. Description of the Beijing Basin
Beijing is the political, cultural and economic centre of China. As one of the most populated cities in the world, its population has reached 20 million [26]. As one of the most water-scarce cities in the world, the major water source for the Beijing municipality is groundwater, accounting for about two thirds of water use [27].
Beijing is located in northern China (Figure 1a), at 39°28′–41°05′ north latitude and 115°25′–117°30′ east longitude, with an area of 16,807 square kilometers, of which 6390 square kilometers are the plain. The northern and north-eastern parts of Beijing are dominated by (Figure 1b) the Jundu Mountains, while the western part of Beijing is framed by the Taihang Mountains. The southeastern part of Beijing is alluvial-pluvial plains crossed by five rivers (Figure 1b): Chaobai, Yongding, Wenyu, Ju and Juma. The terrain of Beijing is high in the west-north area but low in south-east part, sloping from the front of the mountain to the south-east. The elevations range from around 60–80 m.a.s.l. in the front of mountains to around 20–60 m.a.s.l. in the plains.
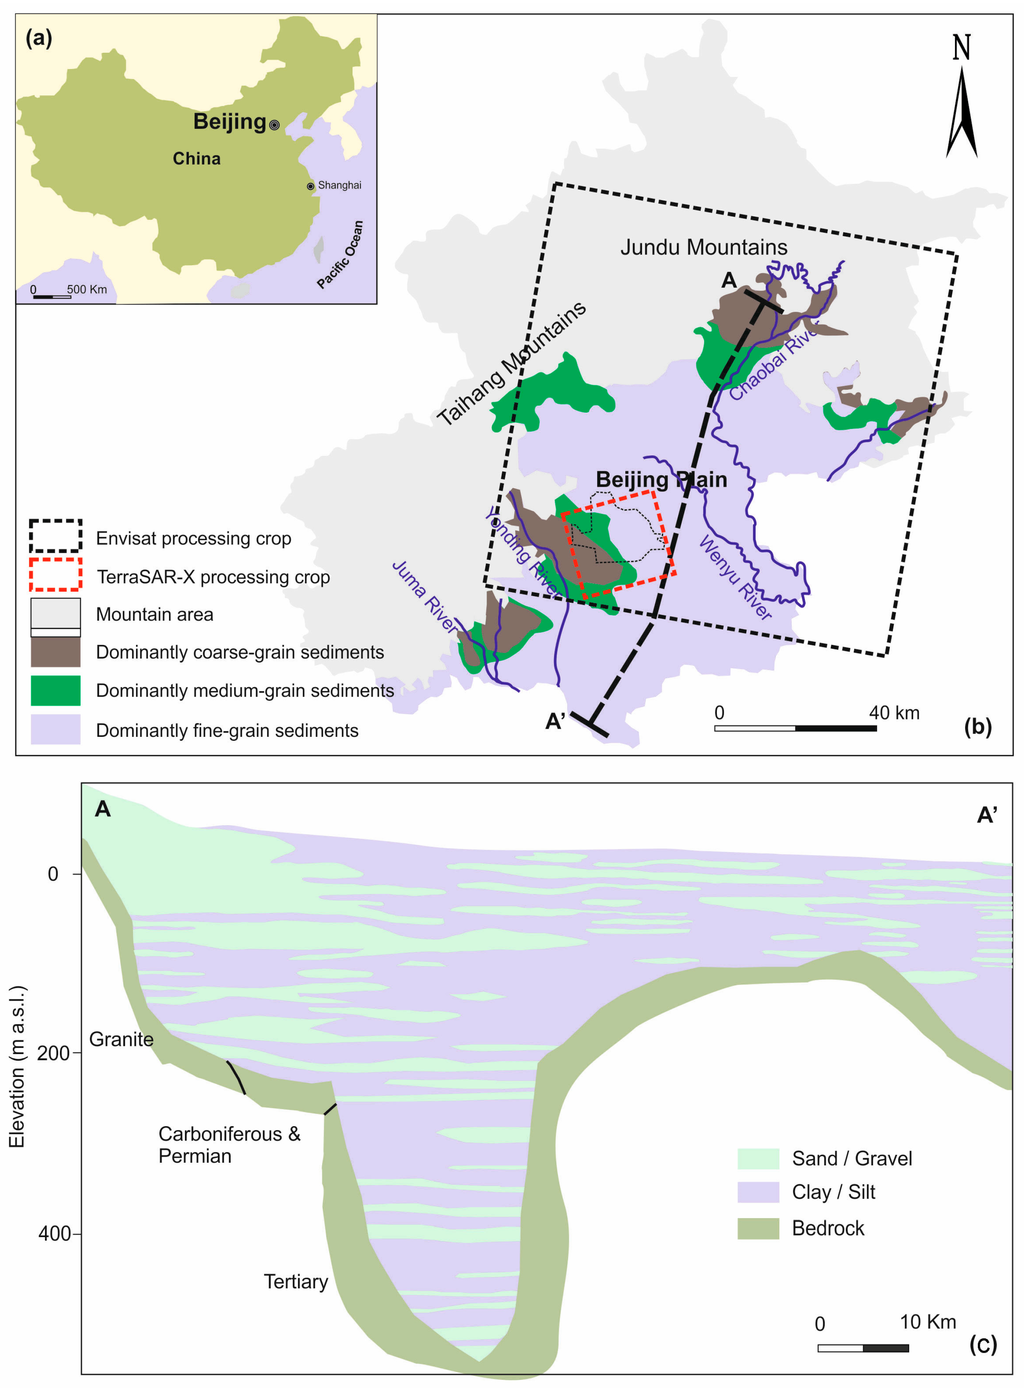
Figure 1.
(a) Location of the study area; (b) geology of the Beijing plain (China); (c) hydrogeological cross-section of the studied aquifer (adapted from [20]).
The study area is characterized by a monsoon-influenced semi-arid and semi-humid continental climate [20]. The average annual temperature is around 11.7 °C. Annual precipitation, mainly concentrated in summer months (from June to September), is around 570 millimetres and constitutes the main source of water resources in Beijing [27].
The thickness of quaternary deposits, whose lithologies change from single gravel to multilayer structures of clay with sand interbeds and whose grain-size turns from coarse to fine, varies from a few meters over the mountain-front area to hundreds of meters in the plain zone [20,21]. Groundwater levels change from deep to shallow and the groundwater varies greatly from phreatic to multilayer confined water throughout the study area, increasing from tens of meters in the mountain-front zone to several hundred meters in the central or southeast plain area [28].
The sediment, forming the principal aquifer system units, predominantly consists of gravel, fine-to-coarse sand, silt and clays (Figure 1c). Figure 1b,c illustrate the gradual transition from fine-to-coarse sand and gravel in the proximal fan to fine sand, silt or clay in the mid and distal-fan areas.
The Quaternary aquifers of Beijing plain can be divided into three aquifer groups [2,20,29]: (a) The first aquifer group (late Pleistocene-Holocene) is widespread over the Beijing plain. The depths of the bottom of this group are less than 100 m. In this aquifer group, the phreatic aquifer with single gravel structure located in the top area of the alluvial-diluvial fan and over the middle and lower parts of the alluvial-proluvial fan, distributes phreatic aquifer and the shallow confined water with a multilayer structure; (b) The second aquifer group (middle Pleistocene) is mainly located over the middle and lower segments of the alluvial-diluvial fan, which is the middle and deep confined aquifers with depths of the roof from 80 to 100 m, and depths of the bottom plate around 300 m. This aquifer group presents a multilayer structure, which is mainly made up of medium-coarse sand and small amounts of gravel; (c) The third aquifer group (early Pleistocene) consists on deep confined aquifers with the depth of the top over 300 m. This aquifer group, mainly distributed over the north-east part and the south-east part of the centre of the depression land in Beijing plain, is mainly composed of medium-coarse sand and gravel, with clay aquiclude thicker than 30 m covering the top.
The unconfined aquifer and the first confined aquifer are intensely exploited for irrigation providing about 68% of the total groundwater pumpage of the aquifer system. However, the deeper aquifer units are not significantly exploited [20].
Corresponding to the classification of the aquifers, three compressible layers responsible of land subsidence can be recognized in Beijing [2,29]. The first compressible layer is widely distributed over the Beijing plain. The depth of the bottom of this layer, which is composed of normally consolidated silt, silty clay and clay with plastic or hard plastic states, is less than 100 m. The second compressible layer is widely distributed over the middle and lower parts of the alluvial-proluvial fan in Beijing. The main lithologics of this layer are silt, silty clay and clay. The depth of the bottom over the south-west part of Beijing is less than 150 m, while the depth of the bottom over the east and north parts of Beijing can reach a depth of 280 m. The compressible over-consolidated layers with plastic or hard plastic clays account for 60~80 percent of the overall thickness. The third compressible layer is distributed mainly over the centre of the depression of the Beijing plain. The depth of the roof of this layer is larger than 270 m. This layer is mainly composed of over-consolidated clays with a solid state [28].
3. InSAR Processing
The SAR dataset used in this study consists of 41 images from Envisat-ASAR acquired from 2003 to 2010 and 14 images from TerraSAR-X (TSX) acquired from 2010 to 2011. The Envisat ASAR images were collected in Stripmap mode from descending track with VV polarisation, and the TSX images were obtained in Stripmap mode from ascending track with HH polarisation (Figure 1). The interferograms were generated from single-look complex (SLC) images using DORIS (Delft object oriented radar interferometric software) [30]. Among all the total amount of possible interferograms formed by pairs of images, only 91 interferograms from Envisat ASAR images and 36 interferograms from TerraSAR-X images were selected for further processing. The selection of interferograms was restricted to those interferograms with spatial and temporal baselines smaller than 1070 m and 1500 days for Envisat ASAR images, and temporal baselines smaller than 200 m and 200 days for TerraSAR-X images. The external Shuttle Radar Topography Mission (SRTM) DEM with 90 m resolution was used to remove the topographic component of the interferometric phase and geocode the interferograms.
In this study, land subsidence information was obtained by using a small baseline subset of interferograms with the StaMPS (Stanford Method for Persistent Scatterer/Multi-Temporal InSAR) technique [31]. The processing includes three main steps:
Firstly, a network of multi-master differential interferograms was created by taking into account small spatial and temporal baselines and reduced Doppler centroid frequency differences to minimize the spatial and temporal decorrelation and topographic errors for the group of small baseline interferograms. Figure 2 shows the network of the small baseline interferograms used for the SBAS analysis of the land subsidence in Beijing.
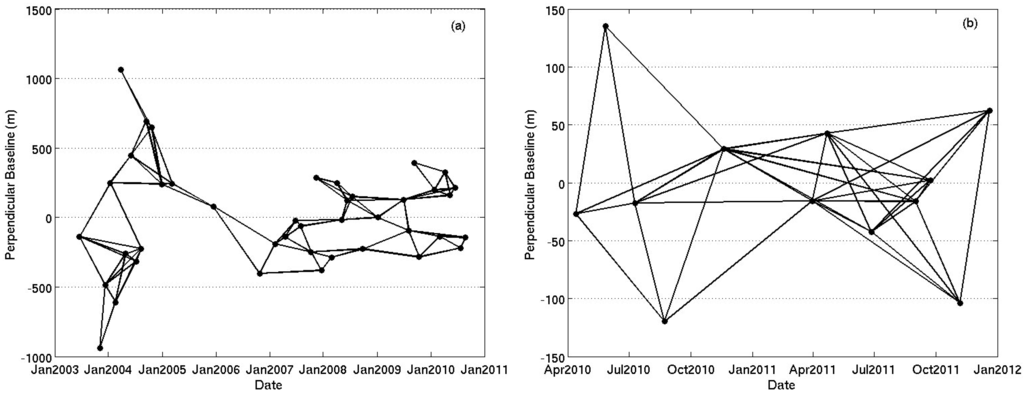
Figure 2.
Networks of the small baseline interferograms obtained from (a) Envisat ASAR and (b) TerraSAR-X images used for SBAS InSAR analysis for land subsidence in Beijing.
Secondly, after filtering the azimuth and range spectra to reduce decorrelation effects due to geometry and non-overlapping Doppler frequencies, the slowly decorrelating filtered phase (SDFP) pixels whose phase shows slow decorrelation over short time intervals were selected. For computational efficiency, the SDFP candidates were initially selected by setting a threshold for the amplitude difference dispersion, which is the standard deviation of the amplitude difference between the master and slave divided by the mean amplitude. Afterwards, an iteratively conducted phase analysis yielded the phase stability estimation of each candidate to generate the final set of SDFP pixels [31]. The amplitude dispersion index threshold was set at 0.6 to generate the largest set of candidate pixels.
Thirdly, after the iteratively robust process of SDFP selection and correcting for spatially uncorrelated look angle errors, a three-dimensional phase unwrapping was applied on the final sets of SDFP pixels by using a statistical cost flow algorithm [32,33]. The time series of displacement for each SDFP pixel was derived through a least-squares inversion method [34]. This technique estimates displacement time series without prior consideration of a temporal model for the deformation and thus allows the derivation of temporally varying deformation processes. From these values, long-wavelength atmospheric effects and orbit error are estimated from the SDFP pixels using a spatial-temporal filter method.
4. Results
4.1. InSAR-Derived Land Subsidence Maps
Figure 3 shows the result of deformation pattern along line of sight (LOS) for the multi-temporal SBAS processing of the available Envisat ASAR dataset. In this area, a high concentration of SDFP pixels (i.e., an average density 400 SDFP pixels per square kilometre) is recognized mainly due to the dense urbanization of the scene. The Beijing plain area exhibits high displacement rates with an average velocity of up to 110 mm/year in the LOS direction from 2003 to 2010.
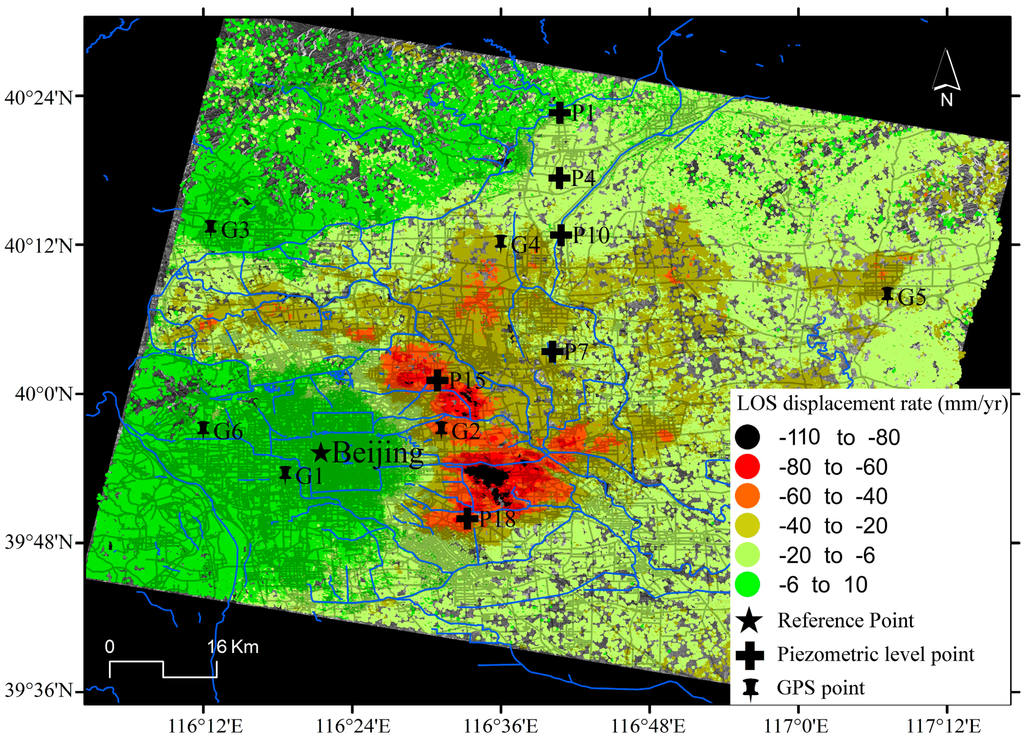
Figure 3.
Mean LOS displacement rates derived from Envisat ASAR (2003~2010) in the Beijing basin.
Figure 4 illustrates the spatio-temporal evolution of the accumulated LOS surface displacements at approximately one-year intervals derived from Envisat ASAR images. It is clear that land subsidence gradually increases with time, mainly in those areas located at the northeast part of the city in which subsidence rates are higher (Figure 3).
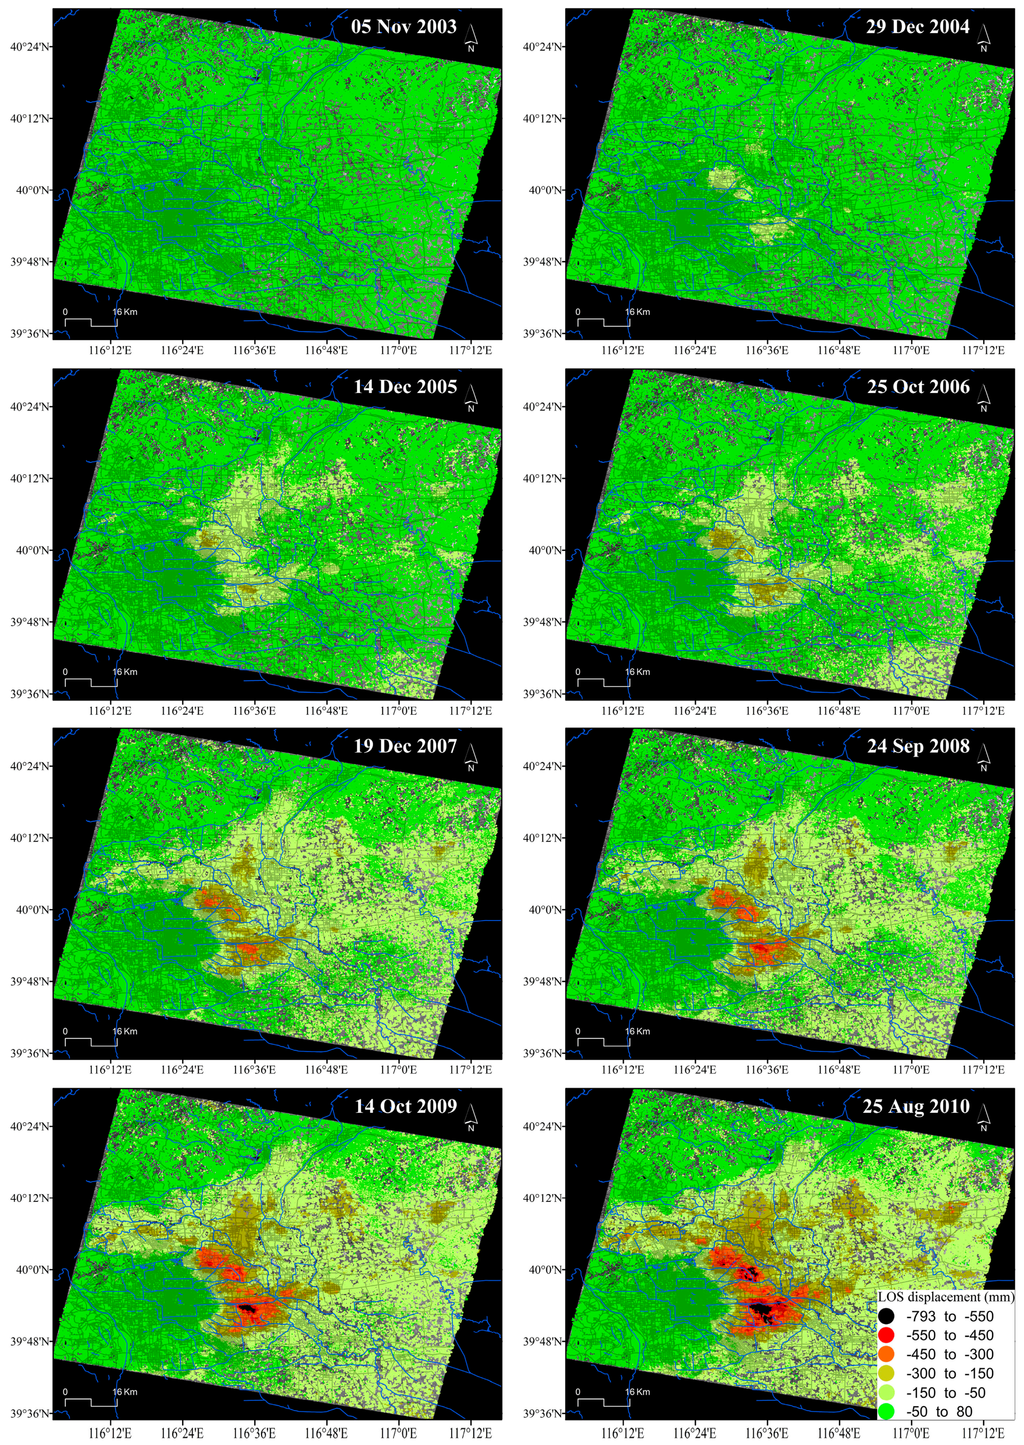
Figure 4.
Spatio-temporal evolution of InSAR-derived accumulated LOS displacement in Beijing from Envisat-ASAR images. Note that for simplicity, the displacement patterns of only 8 of the 41 acquisition dates are shown (i.e., one per year).
4.2. InSAR Data Validation
To evaluate the quality of the InSAR derived land subsidence rate map from Envisat ASAR, a comparison with in situ instrumental data acquired by means of GPS measurement was conducted. Six GPS points that approximately cover the studied period (i.e., from 2007 to 2010) were utilized as checkpoints. The GPS data were projected along the LOS according to [35]. Figure 5 shows the scatter plot of GPS and InSAR solutions over the six GPS points. Note that InSAR-derived displacement rates considered for the comparison of both techniques are here calculated while averaging displacement rate values from all SDFP pixels contained in a 50 m vicinity for the regional comparison of deformation patterns. It can be seen that the maximum discrepancy (MaxD) is 5.34 mm/year, and the minimum one (mD) is 0.14 mm/year. The mean absolute discrepancies (MD) at six checkpoints is 2.41 mm/year, the standard deviation of the discrepancies is ±1.84 mm/year and the root mean square (RMS) is 2.94 mm/year. The data correlation between GPS data and InSAR measurement is over 0.98. This fact indicates that the overall SBAS results agree well with GPS, suggesting the reliability of InSAR-derived land subsidence rates.
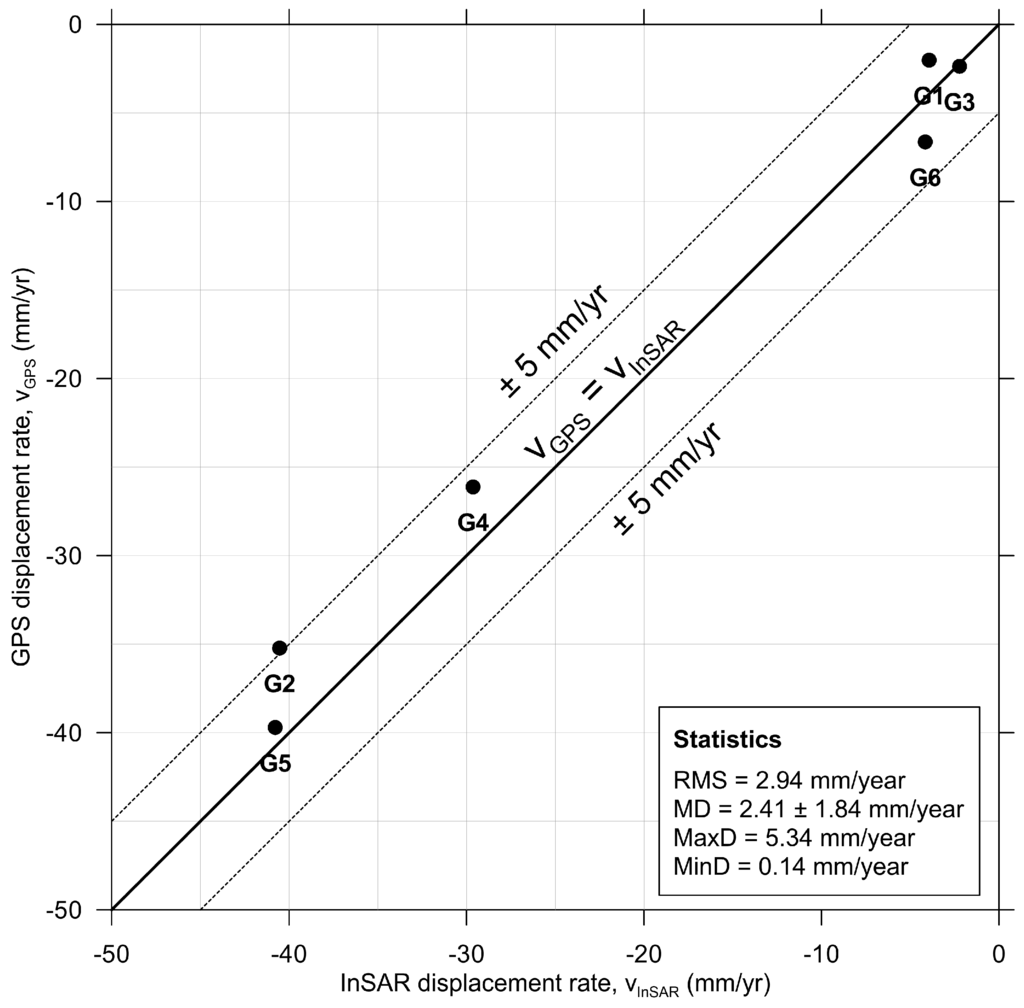
Figure 5.
Comparison of GPS and Envisat InSAR results for points G1–G6. See GPS stations location in Figure 3.
Ten thousand samples of InSAR-derived subsidence rates between multi-wavelength SAR data (i.e., C- and X- bands) were also compared for further validation. Figure 6 shows the correlation and differences between the two data sets used in this work. A high correlation coefficient of 0.92 was observed with an RMS difference of 7.48 mm/year, further indicating the reliability of InSAR retrievals of land subsidence rate maps.
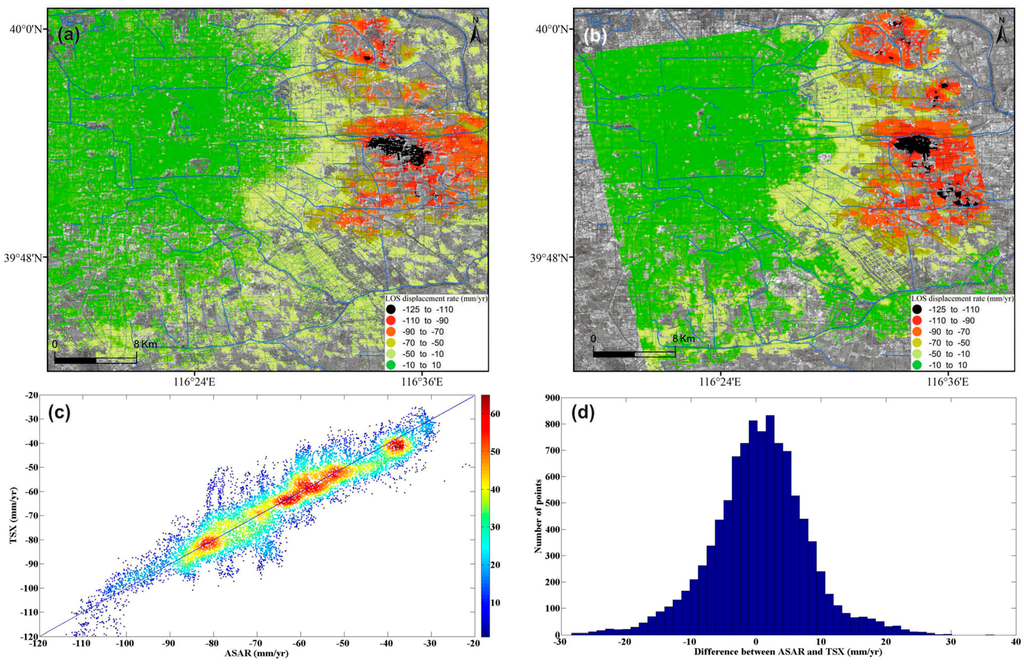
Figure 6.
Displacement rates along LOS derived from (a) Envisat ASAR (2007~2010) and (b) TerraSAR-X (2010~2011) images. (c) Correlation and (d) differences analysis between Envisat ASAR and TerraSAR-X data.
The overall good agreement at least suggests (1) the study region exhibited similar linear motions during these two time intervals; and (2) it is sensible to use InSAR derived subsidence rates (rather than displacement time series) for further analysis (e.g., to identify controlling factors and etc.).
4.3. Spatio-Temporal Analysis of Land Subsidence
There are more than 2.5 million high coherent points extracted in the study region with a total area of around 8000 km2. The reference point, located in the centre of Beijing, shows a relative stable state without significant subsidence appearance, as shown in Figure 7. The settlement amounts are relatively minor over the downtown, west, south-east and south-west parts of Beijing city with a mean subsidence rate of around 10 mm/year. The fillings covering the West part of Beijing mainly consists of coarse-grain and medium-grain sediments (Figure 1) from proximal fans with low compressibility [20], resulting in small settlements. Nevertheless, the sediments over the east, north and south parts of Beijing mainly consist of high compressibility fine-grain sediments [20] with thick quaternary deposits (Figure 1). The aquifers units of these areas have been intensely over-exploited, generating severe land subsidence.
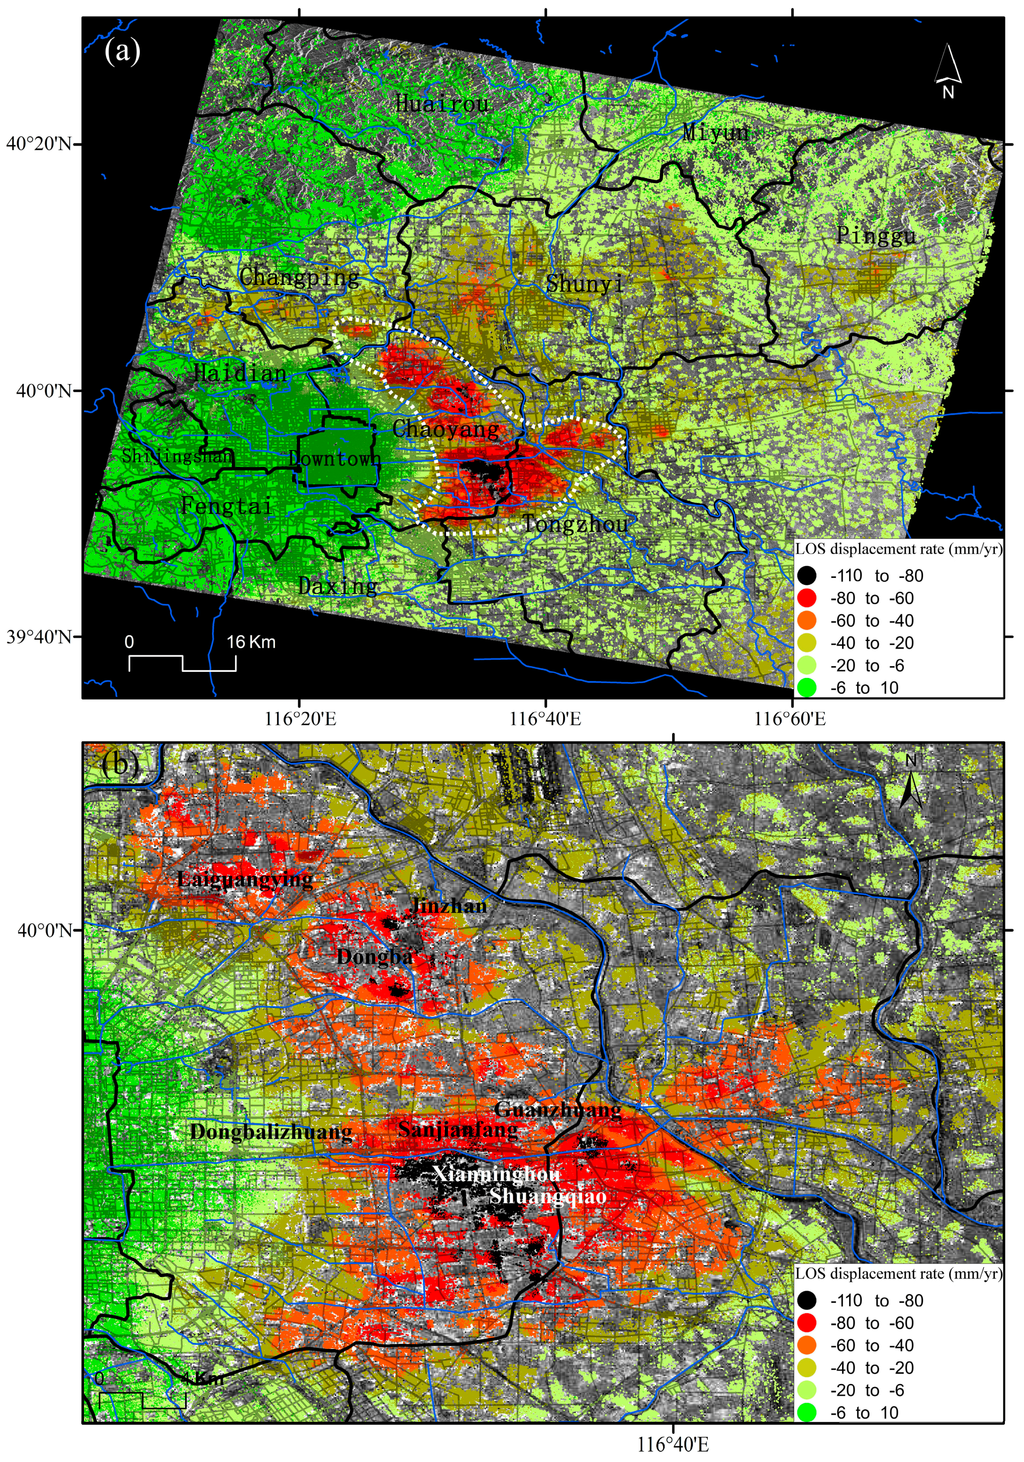
Figure 7.
(a) Subsidence bowls located in the NE of Beijing; (b) extension of the subsidence bowls. Mapped InSAR results along LOS have been derived from Envisat ASAR images acquired from 2003 to 2010.
The main subsidence bowls are distributed over the Chaoyang, Changping, Shunyi and Tongzhou Districts. It can be observed in Figure 7 and Figure 8 that the subsidence bowls located in the east, north-east and north parts of Beijing have been gradually connected, indicating the serious situation in these areas. Consequently, this bowl, which appeared for the first time in 1975 [15], has gradually increased in depth and extension until the present.
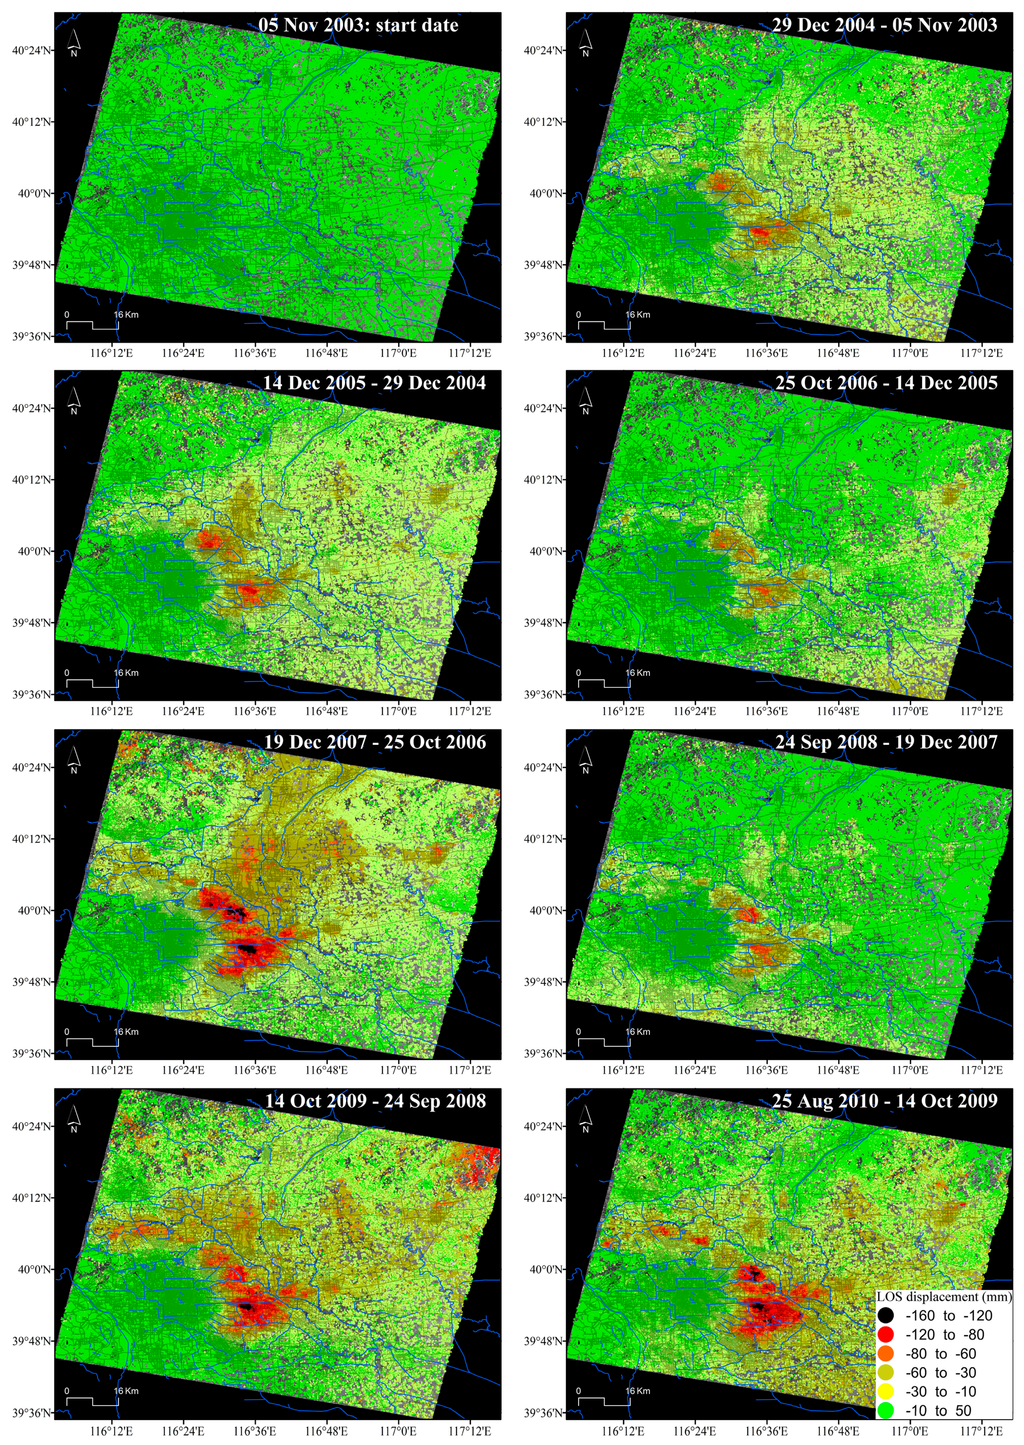
Figure 8.
LOS displacements difference in Beijing obtained from Envisat ASAR images between the acquisition dates selected in Figure 4.
The Xianninghou-Shuangqiao subsidence area, located in the eastern suburbs of Chaoyang District, is in the maximum settlement centre from the East bowl. The maximum subsidence rate in this area for the period 2003–2010 is 110 mm/year (Figure 7). The maximum subsidence from the Northeast bowl is located in Jinzhan-Dongba area with a subsidence rate over 80 mm/year (Figure 7). The Laiguangying subsidence area over Chaoyang District is one of the areas affected by severe land subsidence with displacement rates over 80 mm/year. As mentioned earlier, the subsidence bowls over the east, northeast and north parts of Beijing have gradually merged, indicating the serious subsidence situation in these districts.
In the north part of the Haidian-Changping subsidence area, the maximum displacement rate reaches 60 mm/year. The Dongbalizhuang-Dajiaoting subsidence area (including Sanjianfang, Guanzhuang) over the eastern suburbs of Chaoyang District measured settlements exceeding 50 mm/year (with local values up to 80 mm/year) from 2003 to 2010. The subsidence rate in the Shunyi subsidence area reaches 40 mm/year.
Figure 7 and Figure 8 clearly indicate that the bowls of subsidence in Beijing present a growth trend. The mean subsidence rate around the centres of subsidence in Chaoyang district, located in the eastern part of the city, reaches 80 mm/year, and a maximum subsidence rate higher than 100 mm/year.
Figure 8 illustrates the temporal evolution of the accumulated displacements with an approximately one-year interval, showing that the magnitudes of the annual accumulated displacement vary from one year to another. However, the subsidence rate clearly decreases in 2008. For example, comparing the average accumulated subsidence for a group of SDFP pixels located within the main deformation area (39.898°N, 116.572°E) in different years (December 2007–September 2008 with annual displacement of −99.86 mm and September 2008–October 2009 with annual displacement of −119.77 mm), a decrease of the annual accumulated subsidence of 16.6% is observed.
5. Discussion
In this section, different InSAR products including mean displacement rates and displacement time-series are used for the analysis of InSAR-derived surface displacement in the Beijing plain and compared with different triggering and conditioning factors.
5.1. Relationships between Land Subsidence and Groundwater Level
The over-exploitation of groundwater in the study region has caused a regional drop of piezometric levels, decreasing pore pressure and increasing effective stresses according to Terzaghi’s [36] theory. Consequently, when groundwater is pumped from the aquifer system, both the aquifers and the aquitards that constitute the aquifer system undergo deformation, but to different degrees, as most of the permanent subsidence occurs due to the irreversible compression or consolidation of aquitards [37]. Thus, the deformation of an aquifer-system can be inelastic (the aquifer-system undergoes permanent rearrangement resulting in irreversible compaction and only a part of the total deformation is recovered when water level rises) or elastic (when water level rises, the skeleton of the aquifer-system expands, recovering from the previous occurred deformation) depending on whether or not the applied stresses are beyond its previous maximum level (preconsolidation stress threshold) [37].
When land subsidence data are used in conjunction with good well logs and water-level data from adjacent observation wells, the deformation history can provide the basis for stress-strain analysis [38] and inverse modeling that defines the average compressibility and vertical hydraulic conductivity of the aquitards [39]. In the study region, hundreds of observation wells are used to monitor the evolution of groundwater levels. Figure 9 shows the relationship between piezometric level and land subsidence for some piezometers from the study region. It is worth noting that the displacements measured by InSAR on the ground surface are the addition of the deformations occurred in the different aquitard and aquifer layers underlying the ground surface and, thus, the stress-strain curves shown in Figure 9 correspond to the whole aquifer system. The analysis of the different stress-strain relationship clearly indicate that the aquifer system presents different behaviour (Figure 9).
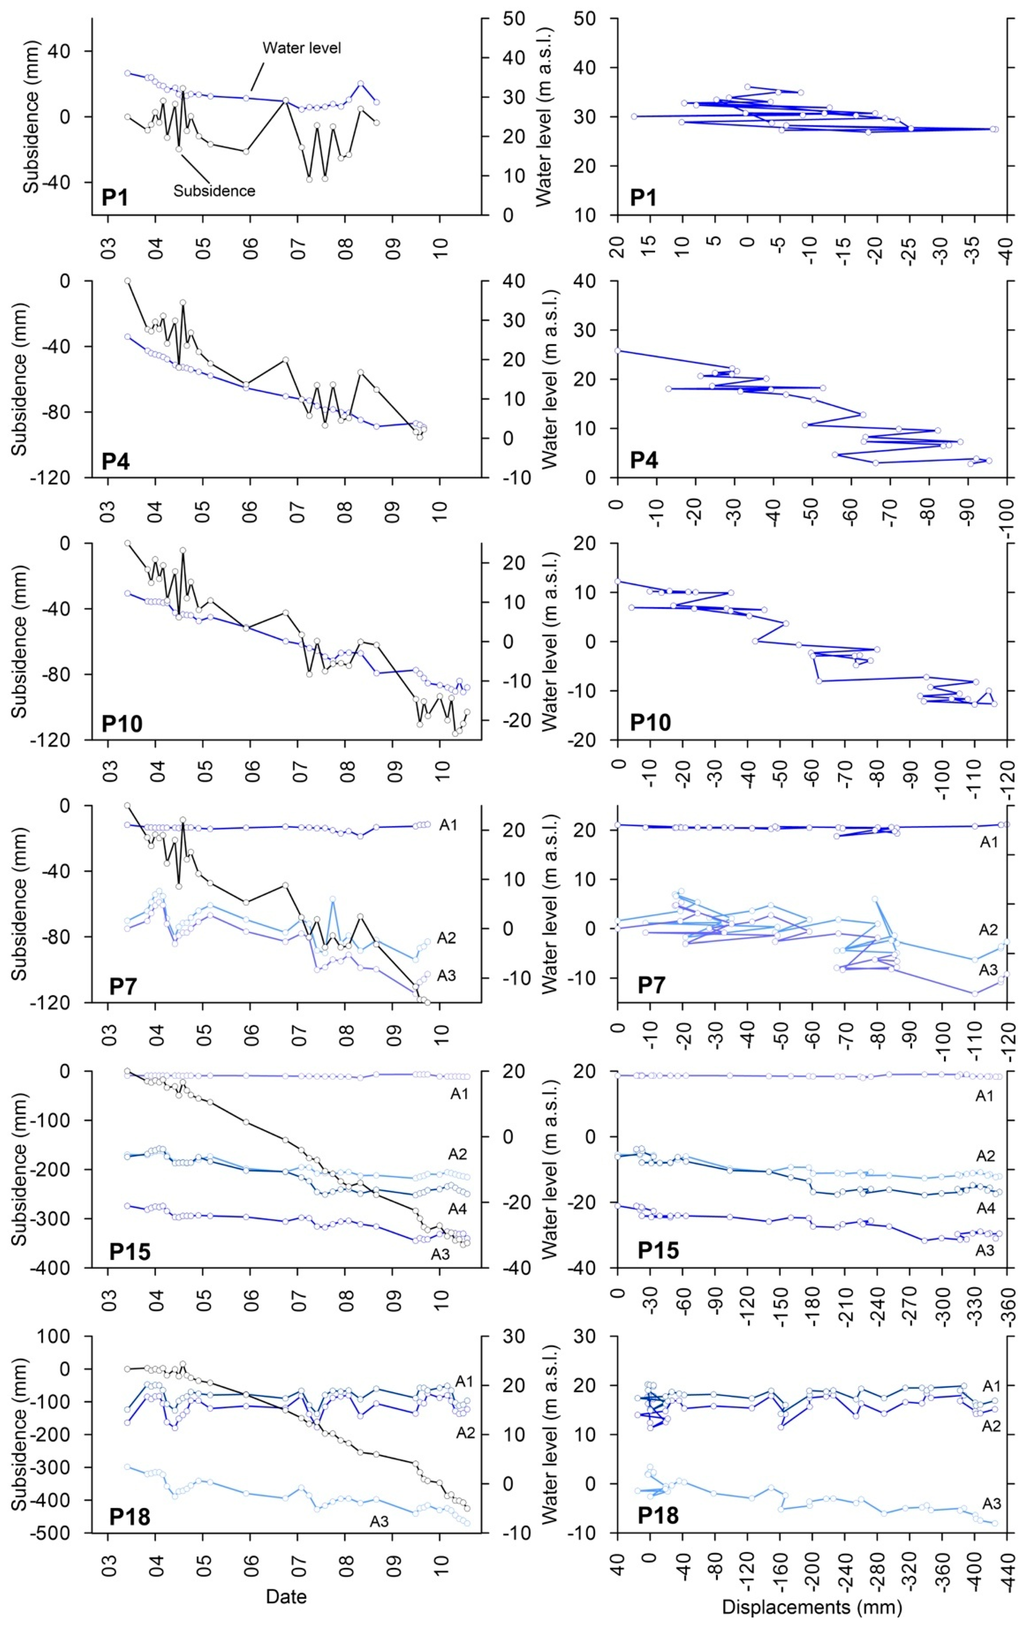
Figure 9.
Time series of piezometric level and land subsidence measured by means of InSAR (left); and strain-stress curves, for different areas of Beijing (right). The location of the observation wells is shown in Figure 3. Note that the wells are ordered from north (top) to south (bottom). A1 to A4 refers to different aquifers units described in Section 2.
If we analyse the general trend of water level and InSAR time series from P1 (see location in Figure 3) we can realise that from June 2003 to February 2007 the water level fell from 36.1 to 26.87 m.a.s.l. (i.e., −9.23 m) and the accumulated subsidence was up to 38.2 mm. However, after this period, the water level recovered up to 33.5 m.a.s.l. in May 2008 (i.e., it increased +6.6 m, near the original water level) and the ground surface also rose 43.0 mm (the previous deformation was recovered). So, according to the general trend of both time series (water level and displacements), we can see that they both follow a similar trend, i.e., they mainly exhibit an elastic behaviour as when the support provided by the fluid is removed or partially removed (i.e., when water level falls), the support provided by the pore pressure is gradually transferred to the soil skeleton, causing subsidence. Conversely, when the pore pressure recovers (i.e., increase due to water level recovery), the support provided by the skeleton is gradually transferred to the pore pressure, which in turn leads to soil expansion (i.e., uplift) [37].
On the other hand, observation wells P4, P10, P7, P15 exhibit a predominantly inelastic behaviour as the aquifer system presents a continuous subsidence associated with the gradual water level decrease (Figure 9). As the fine sediment layers of the study area are normally consolidated [21] (i.e., the present effective overburden pressure is the maximum pressure that the soil was subjected to in the past), then the geomechanical behaviour of the aquifer-system is characterized by the inelastic storage coefficient (Skv). Skv is a dimensionless parameter which is proportional to the deformability of the aquifer system (i.e., the largest the Skv value, the higher the settlement induced by a water level change). This parameter has been calculated as the inverse slope of the stress-displacement data trend line, according to the graphical methodology proposed by Riley [38], for the observational wells P4 to P18 shown in Figure 9, providing values varying from 4.2 × 10⁻³ in P4 to 5.6 × 10⁻² in P18 and confirming that the deformability of the aquifer apparently increases from the north towards the south of the studied area.
5.2. Relationships between Land Subsidence and Geological Structures
The distribution and development trend of the land subsidence over the study region are controlled by geological structures, shown in Figure 10a. Tectonic movements cause tectonic units to decline entirely and slowly under the regional stress field and, complementarily, the relative displacement of the hanging walls and the footwalls induces differences in the land subsidence patterns on both sides of the fault [40]. There are several active high angle normal faults in the Beijing plain. Huangzhuang-Gaoliying, Shunyi and Nanyuan-Tongzhou faults present a SW-NE direction. The Huangzhuang-Gaoliying fault dips to the SE with an angle of 55°~75°. The Shunyi fault with a SE dipping angle is a boundary fault controlling the Houshayu Quaternary depression, and the Nanyuan-Tongzhou fault dips towards the NW. The Nankou-Sunhe fault is the unique active NW-SE oriented fault in the Beijing basin. The Northwestern segment of the Nankou-Sunhe fault (from Nankou to Baishan) dipping SW controls the Machikou Quaternary depression with a maximum thickness of Quaternary sediments about 600 m, and the Southeastern segment of the Nankou-Sunhe fault (from Baishan to Tongzhou) dipping towards NE controls the depocenter of Dongba, in the southern part of the Shunyi Quaternary depression [27,41,42,43,44,45,46]. In the Beijing basin, Dongbalizhuang-Dajiaoting subsidence area over the eastern subsidence zone is collectively controlled by the Shuyi fault and the Nanyuan-Tongzhou fault. The Laiguangying subsidence area over northeast subsidence district is mainly controlled by the Shuyi fault and the northwest subsidence zone is mostly led by the Nankou-Sunhe and Huangzhuang-Gaoliying faults, for which the main deformation direction is basically parallel to the fracture direction.
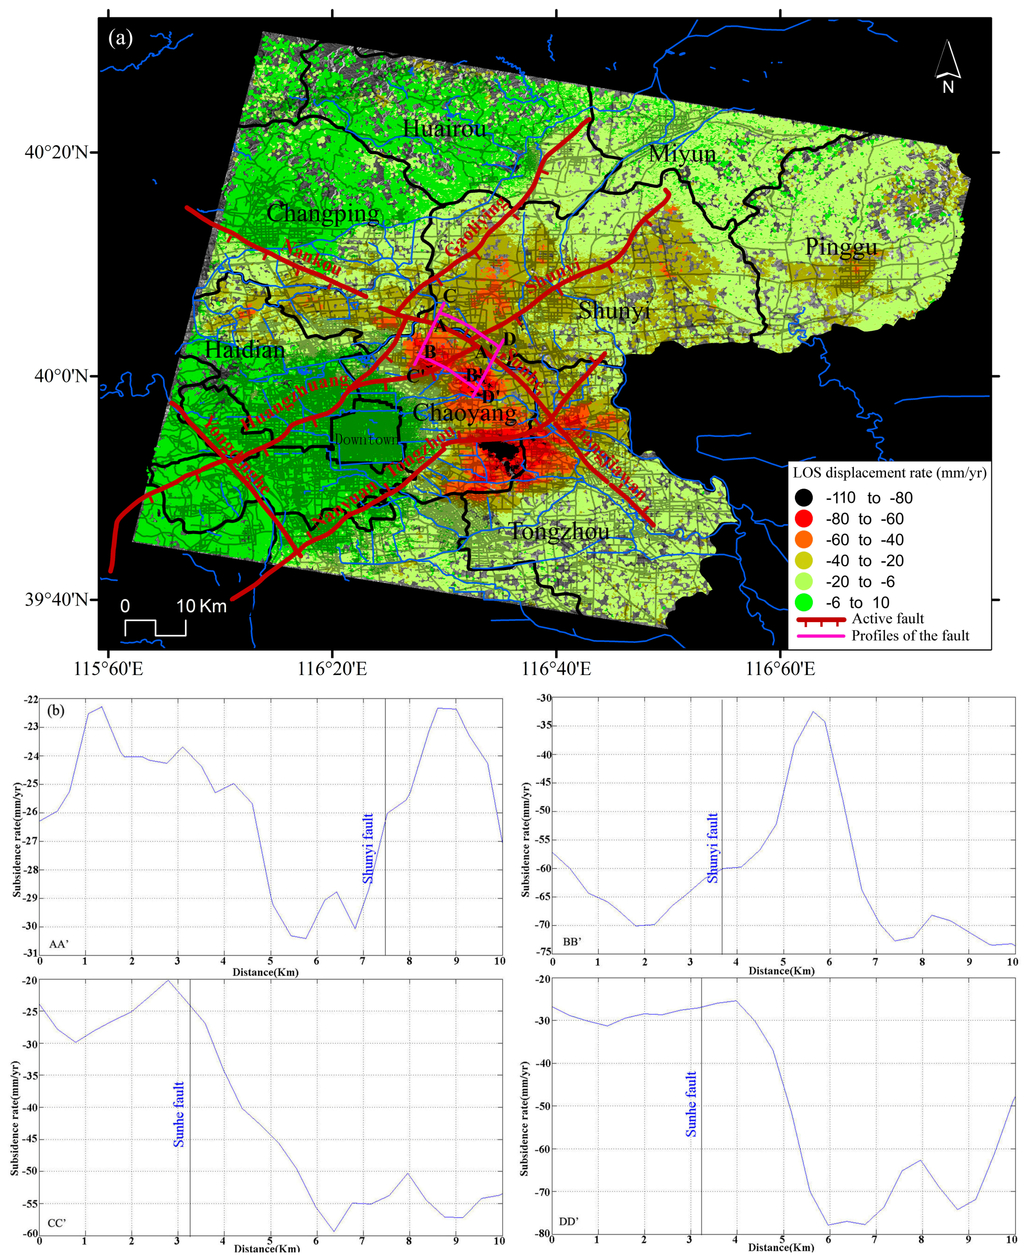
Figure 10.
(a) Overlap of main active faults (based on [40]) to InSAR displacement rates; (b) Land subsidence profiles along the Nankou-Sunhe fault.
The examples of four profiles of the average subsidence rate for Nankou-Sunhe fault can be found in Figure 10b. Profiles AA′ and BB′ parallel to the Nankou-Sunhe fault and Profiles CC′ and DD′ perpendicular to the Nankou-Sunhe fault with a length of about 10 km are chosen to analyze the spatial characteristics of land subsidence along this fault zone. It can be found that the ground surface displacement along Profile AA′ located at the north of the Nankou-Sunhe fault shows a relative stable displacement rate of around 25 mm/year. However, the profile of average subsidence rate for BB′ located in the south of the fault exhibits a significant increasing trend with the maximum subsidence rate exceeding 70 mm/year. The profiles of the average displacement rate for CC′ and DD′ perpendicular to the Nankou-Sunhe fault also show a high ground surface displacement gradient along the profile with maximum values up to 77 mm/year, indicating the markedly differential settlement existing on both sides of the fault.
5.3. Relationships between Land Subsidence and Compressible Soil Thickness
As is well known, when piezometric levels decrease, the thicker the accumulated compressible soil is, the greater the land subsidence rates are [47,48]. Land subsidence over the Beijing plain mainly develops in the sand, gravel and clayey layer of Quaternary system. Among the biggest contributors to land subsidence is clayey layer. Researches have revealed that given the same underground water exploitation situation, the clayey units (aquitards made of fine soils) are two or three times more deformable than those of sand and gravel (coarse soils) [2]. Figure 11a shows the thickness distribution of the clayey layer existing in the first 100 m depth from surface over the Beijing plain area which is superimposed on the land subsidence rate map. Figure 11b shows the statistics of InSAR subsidence rates for the considered soft soil ranges. As can be seen in Figure 11a, the subsidence bowls, which present displacement rates ranging from −110 to −60 mm/year (i.e., about 123329 SDFP pixels within this area from ASAR data), are mostly situated in the zone with a clayey layer thickness of around 50 to 70 m (i.e., about 98190 SDFP pixels within this zone from ASAR data), accounting for 79.6% of the whole amount of subsidence.
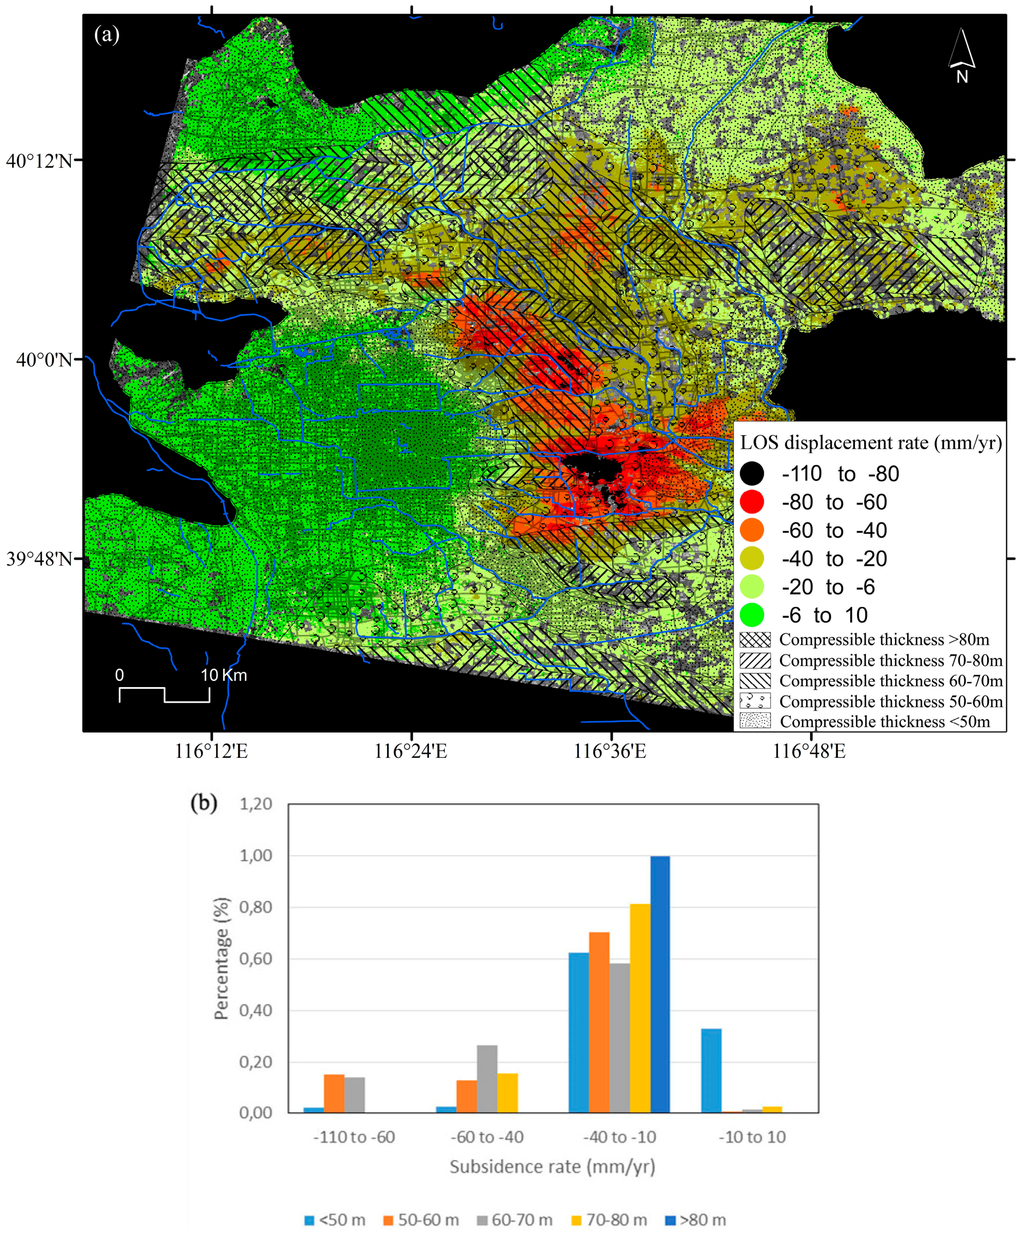
Figure 11.
(a) Distribution of clayey layers on the study area [28]; (b) Statistics of InSAR-derived land subsidence rate data for the different soft soil ranges.
5.4. Relationships between Land Subsidence and the Aquifer Structure
The structure of the aquifer system in the Beijing plain consists of [20]: (a) coarse-grain sediments with single sandy gravel; (b) median-grain sediments with multiple layers of pebbles and gravels; and (c) fine-grain sediments with multiple sand layers and gravel layers. Figure 12 shows the statistics of InSAR subsidence data for the different types of aquifers systems. It can be seen that the subsidence bowls with displacement values varying from −110 to −60 mm/year are located over predominantly fine-grain sediments, accounting for 8% of the total subsidence rate data.
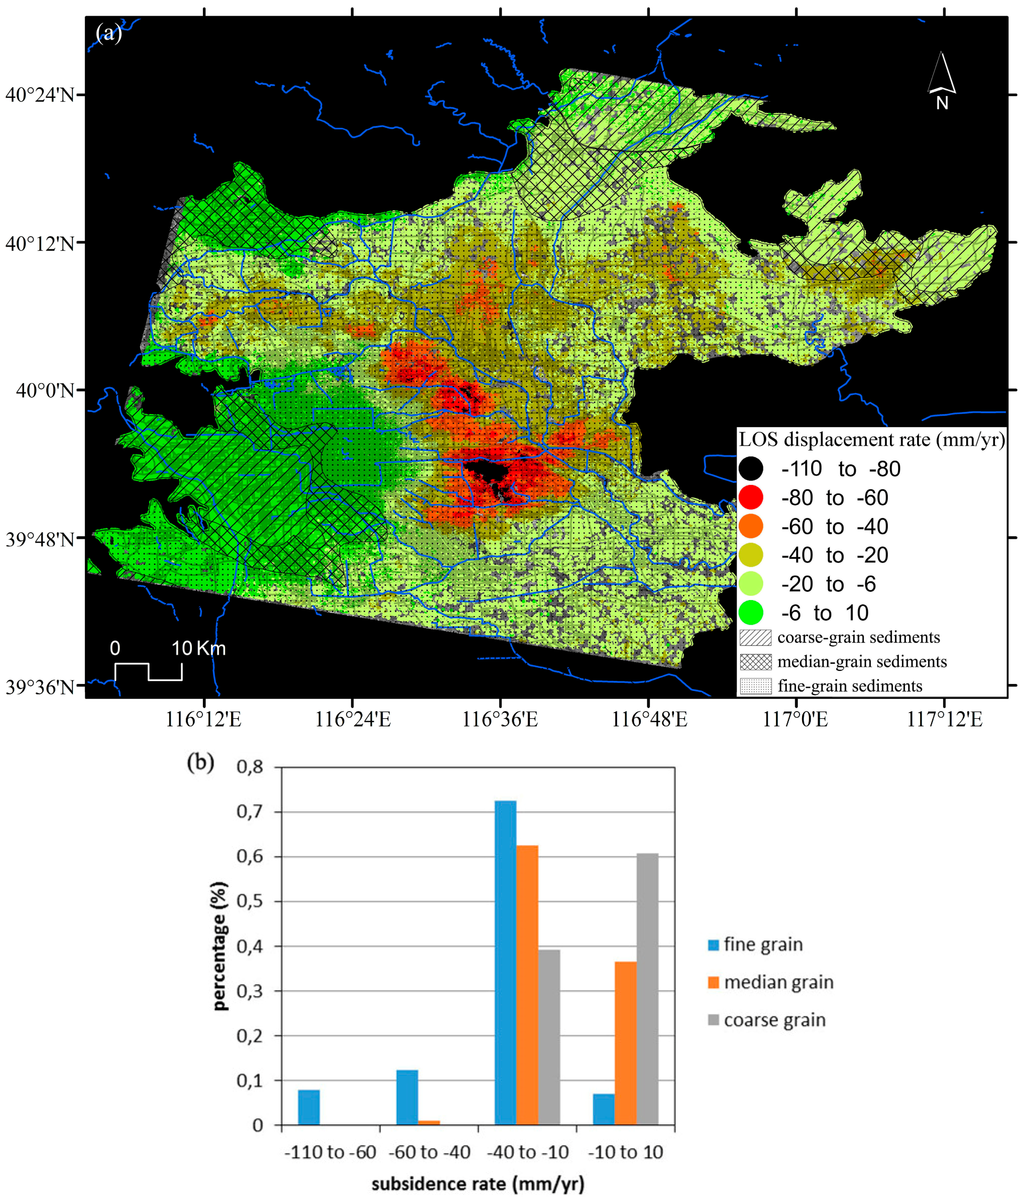
Figure 12.
(a) Distribution and (b) statistics of InSAR derived data for the different types of aquifers.
5.5. Relationships between Land Subsidence and Main Groundwater Extraction Areas
Groundwater extraction is the main water supply source in the study region [21]. Groundwater is extracted from different depths for agricultural, industrial and domestic uses. In this section, we evaluate the effect of groundwater extraction from the Huairou emergency wells drilled in 2003 located along the banks of Huai, Sha and Yanxi Rivers and the well field located along the Chaobai River which were drilled in the 70s (Figure 13).
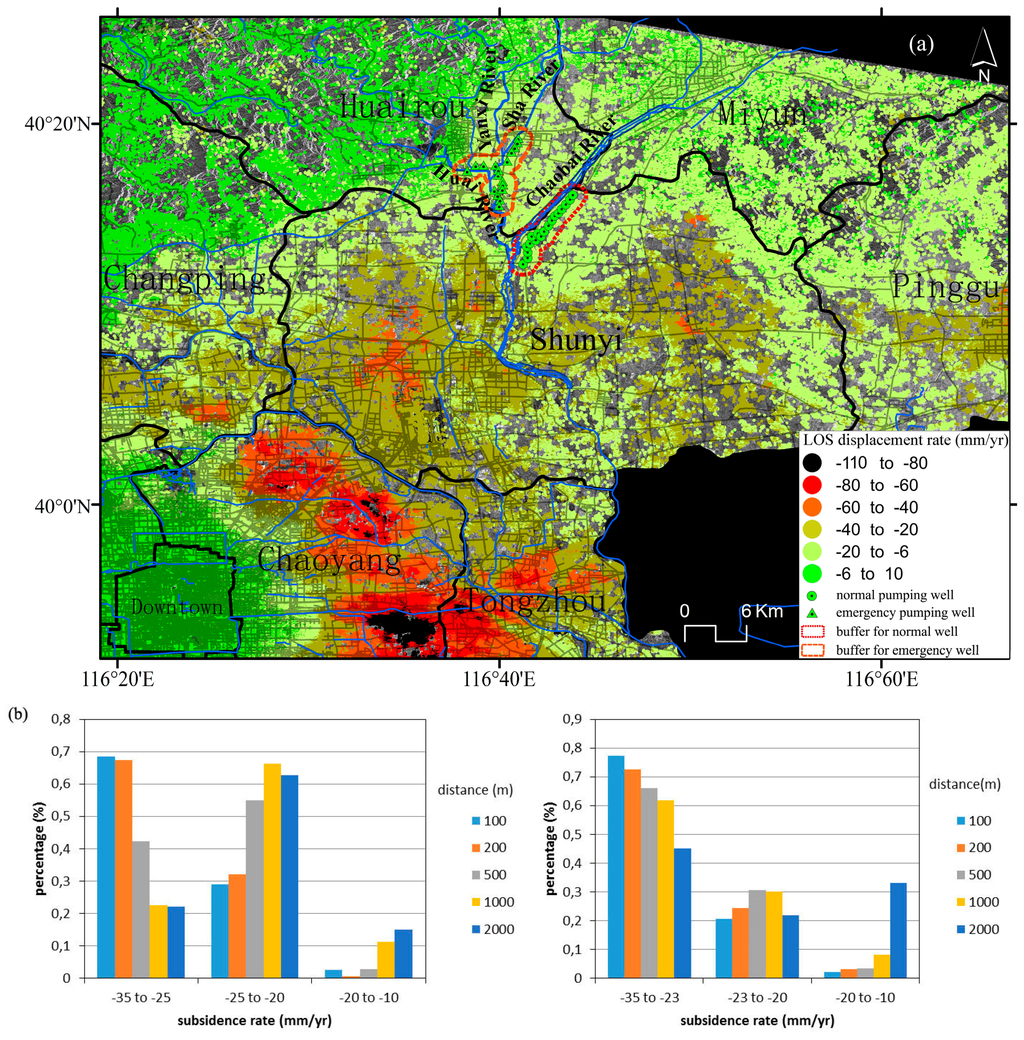
Figure 13.
(a) Location of the Huairou emergency wells and the well field located along the Chaobai River overlapped to the InSAR subsidence rate map; (b) Statistics of InSAR-derived data against the distance to the Chaobai River (left) and Huairou (right) pumping wells.
To evaluate the influence of the pumping wells on land subsidence, different buffers at specified distances were created as shown in Figure 13a. The subsidence rates varied from −35 to −5 mm/year in the buffer areas. The statistics of InSAR subsidence rates against the distance to the wells are plotted in Figure 13b. It shows that the proportion of maximum subsidence rates from −35 to −25 mm/year decrease as the distance to the normal pumping wells increases. A similar relationship is found for the emergency pumping wells (Figure 13b). It indicates that, as expected, land subsidence rates decrease with the distance to pumping wells according to the shape of the cone of depression that develops around active pumping wells.
6. Conclusions
In this study, land subsidence due to over-extraction of groundwater in the Beijing region was investigated with SBAS InSAR using 41 Envisat ASAR and 14 TSX images. The results reveal that the Beijing region has experienced significant ground subsidence from 2003 to 2010 with a maximum accumulative displacement of 790 mm. The SBAS results have been validated by GPS measurements with a mean difference of 2.41 ± 1.84 mm/year and a RMS of 2.94 mm/year, demonstrating that SBAS InSAR can effectively monitor and detect complicated settlements. A high correlation coefficient of 0.92 and a standard deviation of 7.48 mm/year between both TerraSAR-X and Envisat ASAR InSAR-derived subsidence rates was observed, indicating the reliability of InSAR derived land subsidence rate maps.
The spatiotemporal analysis of land subsidence indicates an increasing trend in the rate and extent of land subsidence. The join spatial and/or temporal analysis of InSAR data and conditioning and triggering factors shows that land subsidence is correlated with groundwater levels, active faults, different soft soil ranges and aquifer types. Furthermore, a relationship between land subsidence and the distance to the pumping wells has been found.
The analysis of different stress-strain relationships shows that the aquifer-system exhibits different behaviour, such as quite elastic behaviour and predominantly inelastic behaviour. Additionally, the analysis of the variation of the inelastic storage coefficient (Skv) of the aquifer system computed from the stress-strain curves shows that the deformability of the aquifer system increases from the north towards the south.
The distribution and development trends of the land subsidence over the study area are obviously controlled by its geological structures. Among the biggest contributors to land subsidence are the clayey layers. The subsidence bowls located in the east, north-east and north are mostly placed over a zone with a clayey layer underneath, with a thickness around 50 to 70 m, and those subsidence bowls are located over predominantly fine-grain sediments. The InSAR data statistics and the distance to the pumping wells show that land subsidence rates are higher near the pumping wells, as expected according to the shape of a well’s cone of depression.
To summarize, accurate InSAR-derived data from two different sensors have allowed us to perform a comprehensive spatial and temporal study of the land subsidence in Beijing basin from 2003 to 2011. Complementarily, these data and existing geo-information have been used to perform a study of the role of the main conditioning and triggering factors controlling land subsidence mechanisms in this area, providing useful information for improved development of future models for the prediction of land subsidence affecting this area.
Acknowledgments
This work was supported by the National Natural Science Foundation of China under Grant 41201419 and a China Scholarship Council (CSC) scholarship to Mi Chen. Roberto Tomás was supported by the Ministry of Education, Culture and Sport through the project PRX14/00100. Part of this work is also supported by the Spanish Ministry of Economy and Competitiveness and EU FEDER funds under projects TIN2014-55413-C2-2-P, by the UK Natural Environmental Research Council (NERC) through the LICS and IRNHiC projects (ref. NE/K010794/1 and NE/N012151/1, respectively), the ESA-MOST DRAGON-3 projects (ref. 10607 and 10665) and the Open Fund from the Key Laboratory of Earth Fissures Geological Disaster, Ministry of Land and Resources (Geological Survey of Jiangsu Province). TerraSAR-X data are copyright of German Aerospace Agency (DLR) and were provided under the research proposal motagh_GEO1916.
Author Contributions
Mi Chen and Roberto Tomás performed experiments, analyzed the data and prepared the manuscript. Zhenhong Li provided crucial guidance and support through the research. Mahdi Motagh made important suggestions on data processing and analysis. Tao Li, Leyin Hu, Huili Gong, Xiaojuan Li, Jun Yu and Xulong Gong contributed significantly to the validation work and data interpretation.
Conflicts of Interest
The authors declare no conflict of interest.
References
- McDonald, R.I.; Weber, K.; Padowski, J.; Flörke, M.; Schneider, C.; Green, P.A.; Gleeson, T.; Eckman, S.; Lehner, B.; Balk, D.; et al. Water on an urban planet: Urbanization and the reach of urban water infrastructure. Glob. Environ. Chang. 2014, 27, 96–105. [Google Scholar] [CrossRef]
- Jia, S.; Wang, H.; Zhao, S.; Luo, Y. A tentative study of the mechanism of land subsidence in Beijing. City Geol. 2007, 2, 20–26. [Google Scholar]
- Xu, Y.; Shen, S.; Cai, Z.; Zhou, G. The state of land subsidence and prediction approaches due to groundwater withdrawal in china. Nat. Hazards 2008, 45, 123–135. [Google Scholar] [CrossRef]
- Ferretti, A.; Prati, C.; Rocca, F. Non-linear subsidence rate estimation using permanent scatterers in differential SAR interferometry. IEEE Trans. Geosci. Remote Sens. 2000, 38, 2202–2212. [Google Scholar] [CrossRef]
- Ferretti, A.; Prati, C.; Rocca, F. Permanent scatterers in SAR interferometry. IEEE Trans. Geosci. Remote Sens. 2001, 39, 8–20. [Google Scholar] [CrossRef]
- Berardino, P.; Fornaro, G.; Lanari, R.; Sansosti, E. A new algorithm for surface deformation monitoring based on small baseline differential SAR interferograms. IEEE Trans. Geosci. Remote Sens. 2002, 40, 2375–2383. [Google Scholar] [CrossRef]
- Mora, O.; Mallorqui, J.J.; Broquetas, A. Linear and nonlinear terrain deformation maps from a reduced set of interferometric SAR images. IEEE Trans. Geosci. Remote Sens. 2003, 41, 2243–2253. [Google Scholar] [CrossRef]
- Li, Z.; Fielding, E.J.; Cross, P. Integration of InSAR time-series analysis and water-vapor correction for mapping postseismic motion after the 2003 Bam (Iran) earthquake. IEEE Trans. Geosci. Remote Sens. 2009, 47, 3220–3230. [Google Scholar]
- Prati, C.; Ferretti, A.; Perissin, D. Recent advances on surface ground deformation measurement by means of repeated space-borne SAR observations. J. Geodyn. 2010, 49, 161–170. [Google Scholar] [CrossRef]
- Li, Z.; Pasquali, P.; Cantone, A.; Singleton, A.; Funning, G.; Forrest, D. MERIS atmospheric water vapor correction model for wide swath interferometric synthetic aperture radar. IEEE Geosci. Remote Sens. Lett. 2012, 9, 257–261. [Google Scholar] [CrossRef]
- Tomás, R.; Li, Z.; Liu, P.; Singleton, A.; Hoey, T.; Cheng, X. Spatiotemporal characteristics of the Huangtupo landslide in the Three Gorges region (China) constrained by radar interferometry. Geophys. J. Int. 2014, 197, 213–232. [Google Scholar] [CrossRef]
- Motagh, M.; Wetzel, H.; Roessner, S.; Kaufmann, H. A TerraSAR-X InSAR study of landslides in southern Kyrgyzstan, Central Asia. Remote Sens. Lett. 2013, 4, 657–666. [Google Scholar] [CrossRef]
- Gong, H.; Zhang, Y.; Li, X.; Lu, X.; Chen, B.; Gu, Z. Land subsidence research in Beijing based on the Permanent Scatterers InSAR technology. Prog. Nat. Sci. 2009, 19, 1261–1266. [Google Scholar]
- Li, Y.; Zhang, J.; Li, Z.; Luo, Y. Land subsidence in Beijing City from InSAR time series analysis with small baseline subset. Geomatics Inf. Sci. Wuhan Univ. 2013, 38, 1374–1377. [Google Scholar]
- Chen, B.; Gong, H.; Li, X.; Lei, K.; Zhang, Y.; Li, J.; Gu, Z.; Dang, Y. Spatial-temporal characteristics of land subsidence corresponding to dynamic groundwater funnel in Beijing municipality, China. Chin. Geogra. Sci. 2011, 21, 753–764. [Google Scholar] [CrossRef]
- Liang, F.; Sun, J.; Shen, Z.; Xu, X. Accumulated crustal deformation and its characteristics in Beijing and surrounding regions in 2007–2010 from L-band InSAR. Earthquake 2013, 33, 43–54. [Google Scholar]
- Ng, A. H.; Ge, L.; Li, X.; Zhang, K. Monitoring ground deformation in Beijing, China with persistent scatterer SAR interferometry. J. Geod. 2012, 86, 375–392. [Google Scholar] [CrossRef]
- Zhu, L.; Gong, H.; Li, X.; Li, Y.; Su, X.; Guo, G. Comprehensive analysis and artificial intelligent simulation of land subsidence of beijing, China. Chin. Geogra. Sci. 2013, 23, 237–248. [Google Scholar] [CrossRef]
- Hu, B.; Wang, H.; Sun, Y.; Hou, J.; Liang, J. Long-term land subsidence monitoring of Beijing (China) using the Small Baseline Subset (SBAS) technique. Remote Sens. 2014, 6, 3648–3661. [Google Scholar]
- Zhang, Y.; Gong, H.; Gu, Z.; Wang, R.; Li, X.; Zhao, W. Characterization of land subsidence induced by groundwater withdrawals in the plain of Beijing city, China. Hydrogeol. J. 2014, 22, 397–409. [Google Scholar] [CrossRef]
- Zhu, L.; Gong, H.; Li, X.; Wang, R.; Chen, B.; Dai, Z.; Teatini, P. Land subsidence due to groundwater withdrawal in the northern Beijing plain, China. Eng. Geol. 2015, 193, 243–255. [Google Scholar] [CrossRef]
- Wegmuller, U.; Walter, D.; Spreckels, V.; Werner, C.L. Nonuniform ground motion monitoring with TerraSAR-X persistent scatterer interferometry. IEEE Trans. Geosci. Remote Sens. 2010, 48, 895–904. [Google Scholar] [CrossRef]
- Liu, G.; Jia, H.; Zhang, R.; Zhang, H.; Jia, H.; Yu, B.; Sang, M. Exploration of Subsidence Estimation by persistent scatterer InSAR on time series of high resolution TerraSAR-X images. IEEE J. Sel. Topics Appl. Earth Observ. Remote Sens. 2011, 4, 159–170. [Google Scholar] [CrossRef]
- Chen, J.; Wu, J.; Zhang, L.; Zou, J.; Liu, G.; Zhang, R.; Yu, B. Deformation trend extraction based on multi-temporal InSAR in Shanghai. Remote Sens. 2013, 5, 1774–1786. [Google Scholar] [CrossRef]
- Luo, Q.; Perissin, D.; Zhang, Y.; Jia, Y. L- and X-band multi-temporal InSAR analysis of Tianjin subsidence. Remote Sens. 2014, 6, 7933–7951. [Google Scholar] [CrossRef]
- Swerts, E.; Denis, E. Megacities: The Asian Era. In Urban Development Challenges, Risks and Resilience in Asian Mega Cities; Singh, R.B., Ed.; Springer: Tokyo, Japan, 2015; pp. 1–28. [Google Scholar]
- Beijing Geology and Mineral Resources Exploration and Development Bureau; Hydrogeology and Engineering Geology Team of Beijing. Physical geography and regional geological settings. In Groundwater of Beijing; China Land Publishing House: Beijing, China, 2008; pp. 1–23. [Google Scholar]
- Beijing Geology and Mineral Resources Exploration and Development Bureau; Beijing Institute of Geology. Land subsidence. In Geological Hazard of Beijing; China Land Publishing House: Beijing, China, 2008; pp. 149–175. [Google Scholar]
- Liu, Y.; Ye, C.; Jia, S. Division of water-bearing zones and compressible layers in Beijing’s land subsidence areas. City Geol. 2007, 2, 10–15. [Google Scholar]
- Kampes, B.; Usai, S. Doris: The Delft object-oriented radar interferometric software. In Proceedings of the 2nd ITC ORS Symposium, Enschede, The Netherlands, 16–20 August 1999.
- Hooper, A. Persistent Scatterer Radar Interferometry for Crustal Deformation Studies and Modeling of Volcanic Deformation. Ph.D. Thesis, Stanford University, Stanford, CA, USA, 2006. [Google Scholar]
- Chen, C.W.; Zebker, H.A. Two-dimensional phase unwrapping with use of statistical models for cost functions in nonlinear optimization. J. Opt. Soc. Am. A 2001, 18, 338–351. [Google Scholar] [CrossRef]
- Hooper, A.; Zebker, H.A. Phase unwrapping in three dimensions with application to InSAR time series. J. Opt. Soc. Am. A 2007, 24, 2737–2747. [Google Scholar] [CrossRef]
- Schmidt, D.A.; Bürgmann, R. Time-dependent land uplift and subsidence in the Santa Clara valley, California, from a large interferometric synthetic aperture radar data set. J. Geophys. Res. 2003, 108. [Google Scholar] [CrossRef]
- Fialko, Y.; Simons, M.; Agnew, D. The complete (3-D) surface displacement field in the epicentral area of the 1999 Mw7.1 hector mine earthquake, California, from space geodetic observations. Geophys. Res. Lett. 2001, 28, 3063–3066. [Google Scholar] [CrossRef]
- Terzaghi, K. Settlement and consolidation of clay. Eng. News Rec. 1925, 95, 874–878. [Google Scholar]
- Galloway, D.L.; Jones, D.R.; Ingebritsen, S.E. Land Subsidence in the United States: U.S. Geological Survey Circular 1182; U.S. Geological Survey: Reston, Virginia, USA, 1999; p. 177.
- Riley, F.S. Analysis of borehole extensometer data from central California. Land Subsid. 1969, 2, 423–431. [Google Scholar]
- Helm, D.C. One-dimensional simulation of aquifer system compaction near Pixley, California: 1. Constant parameters. Water Resour. Res. 1975, 11, 465–478. [Google Scholar] [CrossRef]
- Yang, Y.; Luo, Y.; Liu, M.; Wang, R.; Wang, H. Research of features related to land subsidence and ground fissure disasters in the Beijing plain. In Proceedings of the International Association of Hydrological Sciences, Nagoya, Japan, 15–19 November 2015; pp. 239–242.
- Beijing Geology and Mineral Resources Exploration and Development Bureau; Beijing Institute of Geological Survey. Condition of geological tectonics and estimation of stability. In City Geology of Beijing; China Land Publishing House: Beijing, China, 2008; pp. 24–33. [Google Scholar]
- Zhang, L.; Bai, L.; Cai, X.; Wang, J.; Liu, Y.; He, F.; Wang, Z.; He, J. An analysis of the activity of the northwest part of Nankou-Sunhe fault. Geol. China 2014, 41, 902–911. [Google Scholar]
- Zhang, L.; Bai, L.; Cai, X.; Wang, J.; Liu, Y.; Guo, G.; Yang, T.; Wu, H.; He, J.; Zhao, Y. Magnetostratigraphy study on the south segment of Nankou-Sunhe fault at Beijing plain and its implications for the fault activity during quaternary. Quat. Sci. 2014, 34, 381–390. [Google Scholar]
- Jiang, W.; Hou, Z.; Xie, X. Research on paleoearthquakes in Jiuxian trenches across Nankou-Sunhe fault zone in Changping County of Beijing plain. Sci. China Ser. D-Earth Sci. 2002, 45, 160–173. [Google Scholar] [CrossRef]
- Zhang, S.; Wang, D.; Liu, X.; Zhang, G.; Zhao, J.; Luo, M.; Ren, J.; Wang, R.; Zhang, Y. Using borehole core analysis to reveal Late Quaternary paleoearthquakes along the Nankou-Sunhe Fault, Beijing. Sci. China Ser. D-Earth Sci. 2008, 51, 1154–1168. [Google Scholar] [CrossRef]
- Gao, Z.; Chen, Q.; Huang, J.; Qi, C.; Li, H. Velocity Structure Beneath Active Faults and Seismic Tectonic Characteristics in the Beijing Area. Res. Earthquake China 2011, 25, 59–69. [Google Scholar]
- Tomás, R.; Herrera, G.; Lopez-Sanchez, J.M.; Vicente, F.; Cuenca, A.; Mallorquí, J.J. Study of the land subsidence in Orihuela city (SE Spain) using PSI data: Distribution, evolution and correlation with conditioning and triggering factors. Eng. Geol. 2010, 115, 105–121. [Google Scholar] [CrossRef]
- Tomás, R.; Herrera, G.; Cooksley, G.; Mulas, J. Persistent scatterer interferometry subsidence data exploitation using spatial tools: The vega media of the Segura river basin case study. J. Hydrol. 2011, 400, 411–428. [Google Scholar] [CrossRef]
© 2016 by the authors; licensee MDPI, Basel, Switzerland. This article is an open access article distributed under the terms and conditions of the Creative Commons Attribution (CC-BY) license (http://creativecommons.org/licenses/by/4.0/).