Abstract
Land monitoring using temporal series of Synthetic Aperture Radar (SAR) images requires radiometrically well calibrated sensors. In this paper, the radiometric stability of the new SAR Sentinel-1A “S-1A” sensor was first assessed by analyzing temporal variations of the backscattering coefficient (σ°) returned from invariant targets. Second, the radiometric level of invariant targets was compared from S-1A and Radarsat-2 “RS-2” data. The results show three stable sub-time series of S-1A data. The first (between 1 October 2014 and 19 March 2015) and third (between 25 November 2015 and 1 February 2016) sub-time series have almost the same mean σ°-values (a difference lower than 0.3 dB). The mean σ°-value of the second sub-time series (between 19 March 2015 and 25 November 2015) is higher than that of the first and the third sub-time series by roughly 0.9 dB. Moreover, our results show that the stability of each sub-time series is better than 0.48 dB. In addition, the results show that S-1A images of the first and third sub-time series appear to be well calibrated in comparison to RS-2 data, with a difference between S-1A and RS-2 lower than 0.3 dB. However, the S-1A images of the second sub-time series have σ°-values that are higher than those from RS-2 by roughly 1 dB.
1. Introduction
Synthetic Aperture Radar (SAR) space-borne sensors have been widely used for soil and vegetation parameters estimation. SAR sensors operate in all temporal (day or night) and meteorological conditions, rendering SAR data operational for surface monitoring. Over recent decades, SAR sensors have been designed to fulfill a growing need for scientific land monitoring. The recent Sentinel-1 constellation has been scheduled to ensure continuous monitoring. The first Sentinel-1 sensor, S-1A, was launched on 3 April 2014, and the launch of the second Sentinel-1 sensor, S-1B, is scheduled for 2016. The two satellite constellations offer a 6-day repeat cycle (a 12-day repeat cycle for each Sentinel-1 satellite). Aboard Sentinel-1 is a C-band (~5.4 GHz) SAR sensor that facilitates high-resolution image acquisition according to four standard operational modes: the Strip Map (SM), Interferometric Wide swath (IW), Extra Wide swath (EW), and WaVe (WV) modes. In SM, IW, and EW, imaging can be carried out for single and dual-polarizations (HH, VV, HH–VV, and VH–VV), whereas in the WV mode imaging can only be carried out under single polarization conditions (HH and VV).
SAR data of radiometric stability and quality are essential to accurate surface monitoring [1,2]. Indeed, radar signal variations should only occur due to variations in soil and vegetation conditions and not due to the imprecise calibration of radar images. The S-1 IPF (Instrument Performance Facility) performs a number of radiometric corrections to achieve required S-1A image radiometric accuracy levels. During the commissioning phase (completed on 23 September 2014), the S-1 IPF only corrects for the gain of EAP (Elevation Antenna Patterns). As an outcome of the S-1A commissioning phase, the S-1 IPF was upgraded to also correct for the EAP phase. This correction was introduced to the S-1A images acquired on 19 March 2015 with the new IPF version (V243) [3]. Moreover, an expected gain imbalance on acquired S-1A data was reported during the commission phase. This gain imbalance generated an overall gain offset of roughly 0.666 dB for all polarization and imagining modes [4]. The gain offset correction was applied to S-1A images acquired on 25 November 2015 at 10:40 UTC.
The goal of the paper is to investigate the radiometric stability and quality of S-1A signals using a times series of S-1A images acquired over continental areas. To assess radiometric stability levels, S-1A images were first calibrated. Second, temporal variations in S-1A backscattering coefficients (σ°) averaged over invariant targets were analyzed. To assess radiometric quality levels, a comparison between S-1A and RS-2 σ° returned from the same invariant target was performed. This paper includes four sections. The second section of the paper describes the SAR images and studied areas. The third section presents the methodology and results. Finally, the fourth section presents our main conclusions.
2. Dataset Description
In this study, 154 S-1A images of both Ascending and Descending modes acquired between October 2014 and February 2016 over France (two different places) and Gabon (the southern region) were used. All of the images used the IW imagining mode with VH and VV polarizations. Moreover, all of the images were generated from the high-resolution Level-1 Ground Range Detected (GRD) product. Other image products were less accessible. The GRD product consists of focused SAR data that have been detected, multi-looked (5 and 1 looks according to slant ranges and azimuthal directions, respectively), and projected to a ground range based on an Earth ellipsoid model. The high-resolution GRD product uses roughly square resolution pixels of 20 m × 22 m. The Sentinel-1 Toolbox [5] was used to calibrate and geocode images. The calibration aims to convert digital number values of the raw images into backscattering coefficients (σ°). Our geocoded S-1A images have pixel sizes of ~10 m × 10 m.
Moreover, three SAR images acquired from Radarsat-2 (RS-2) (C-band ~ 5.3 GHz) at the fine quad-polarization mode (HH, HV, VH, VV) and at incidence angles of 38° (one image) and 43° (two images) were used. These images were acquired 12 June 19 and 2014 and on 6 July 2014 at a spatial resolution of 12.5 m. The PolSARPro v4.2.0 software program [6] was used to calibrate RS-2 images. A 7 × 7 boxcar filter was used to reduce image speckle effects. These images were then geocoded using the MapReady 2.3 software program [7]. Our geocoded RS-2 images include pixels of ~8 m × 8 m.
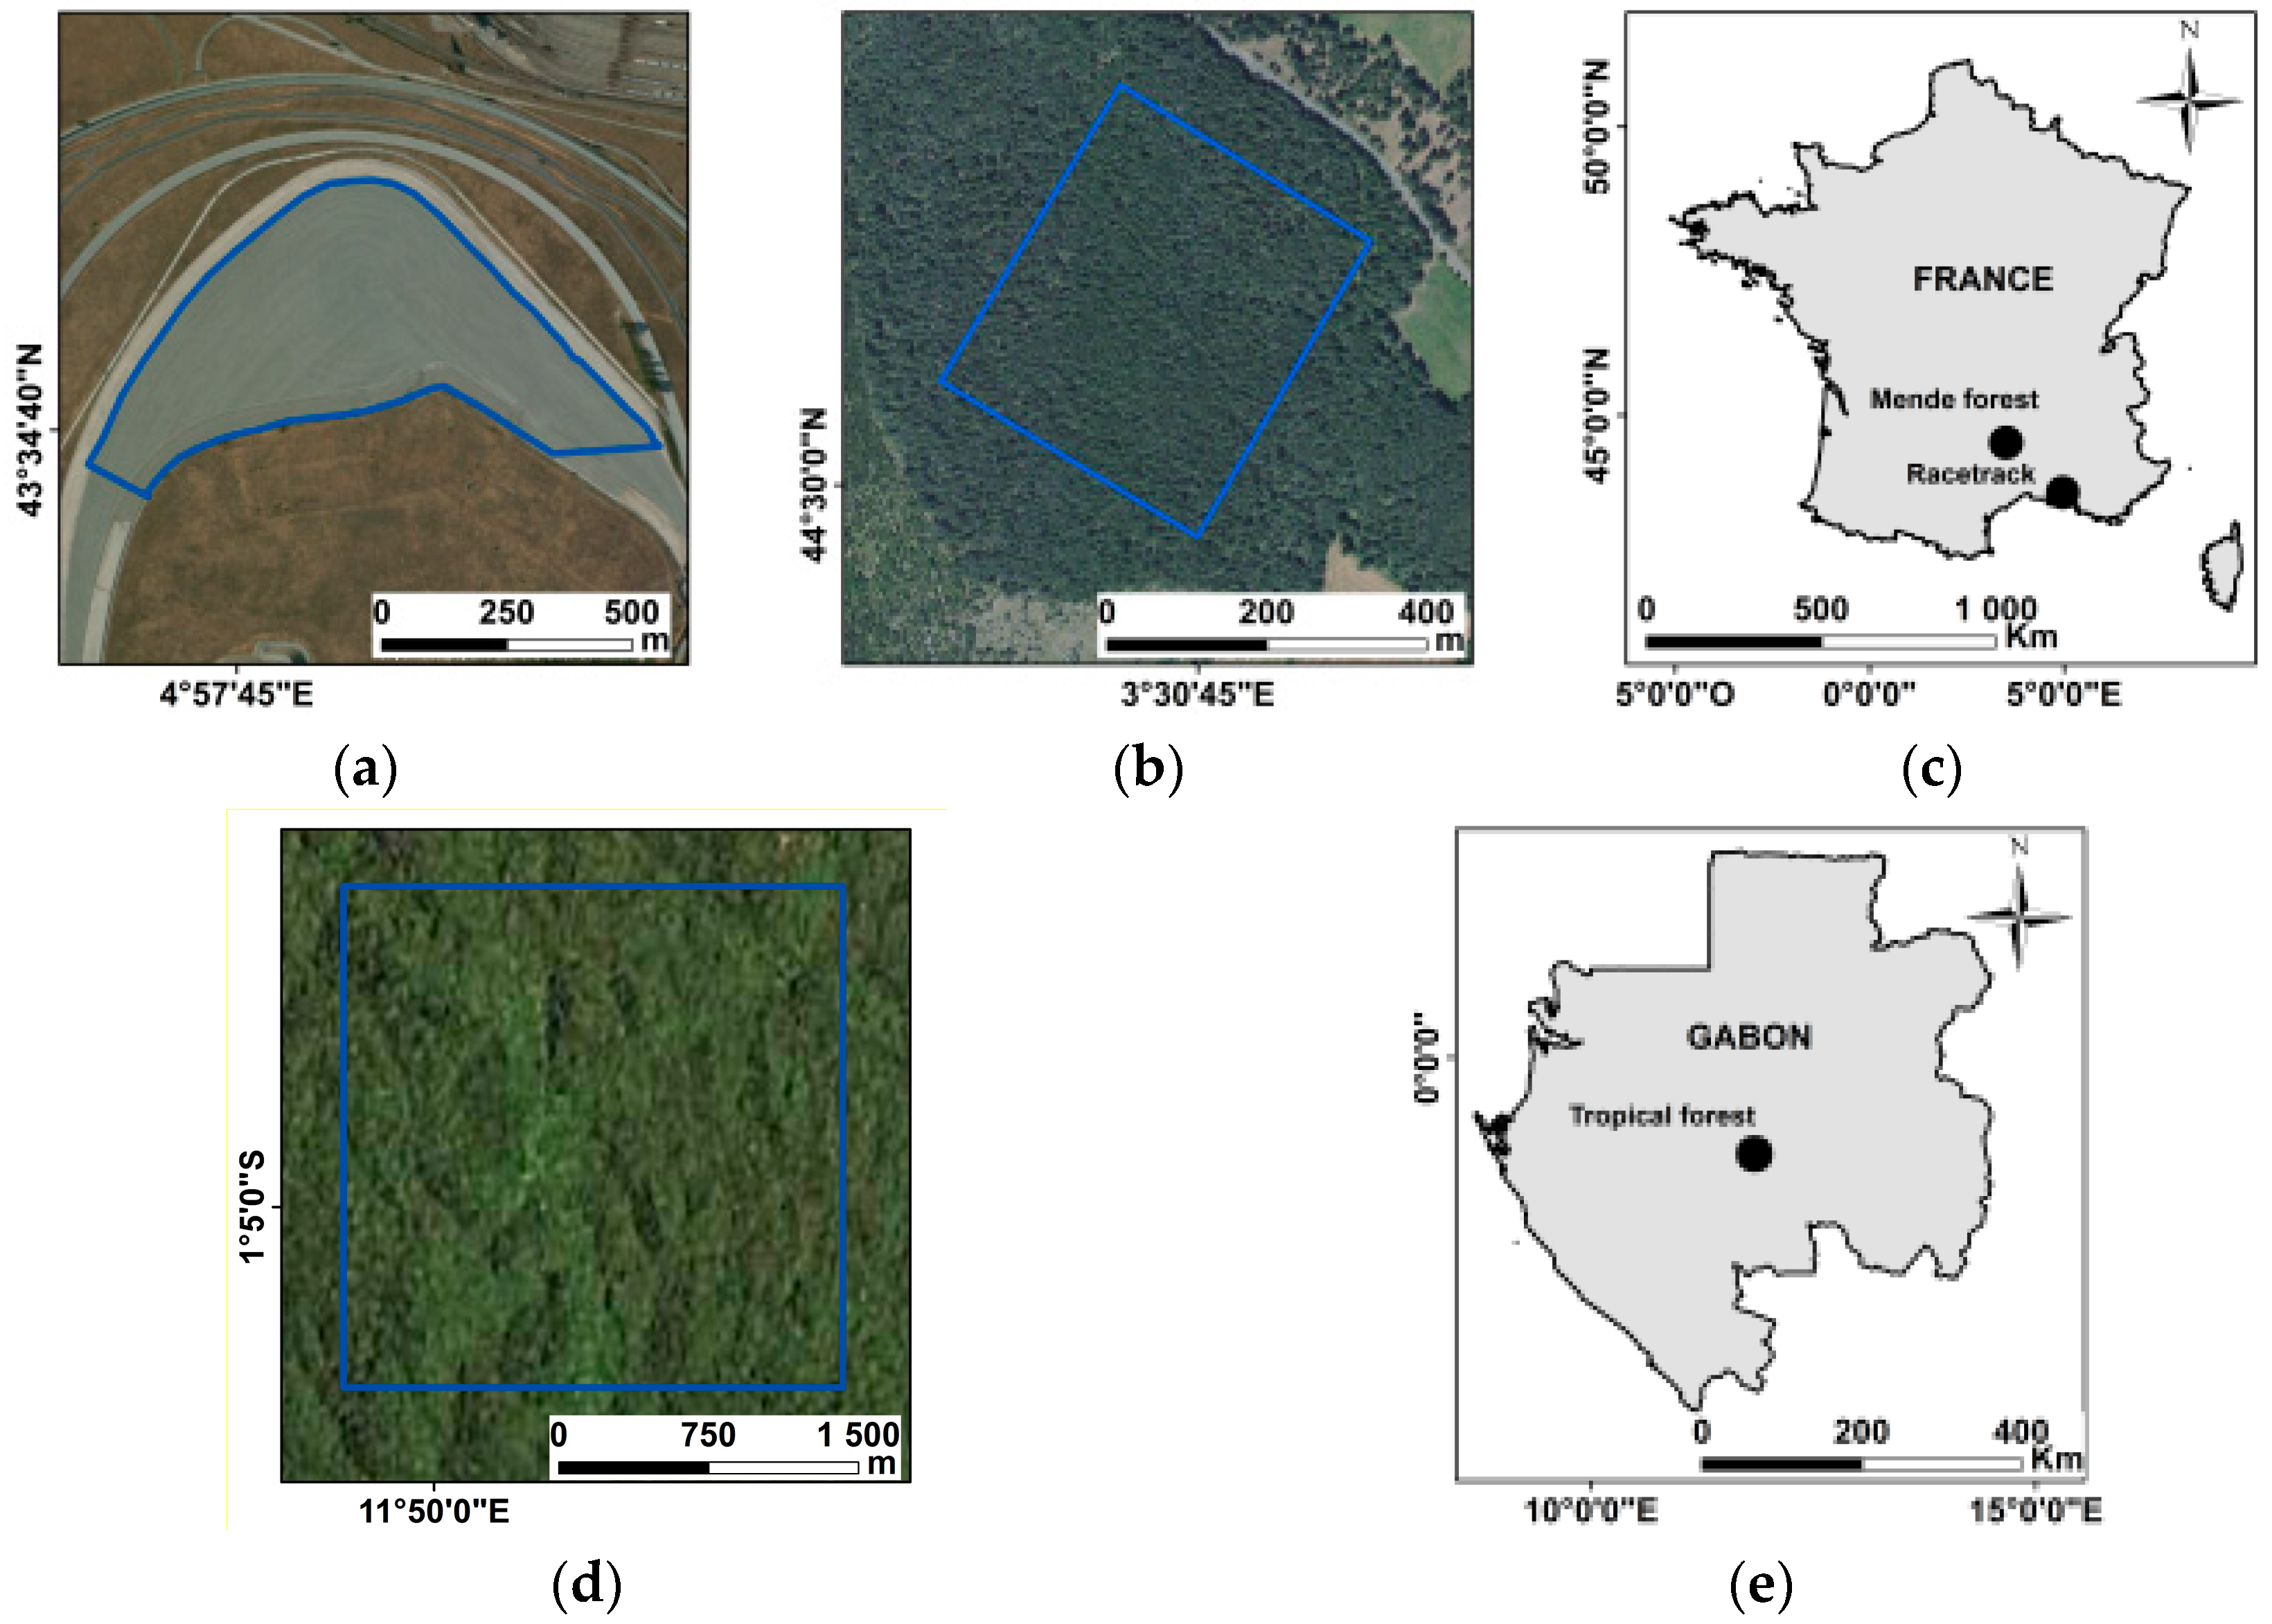
Three invariant targets were chosen to assess the radiometric stability of returned S-1A signals (Figure 1). The first target is an asphalt racetrack located in southeastern France (43°34’47’’N, 04°57’53’’E) that covers an area of 14.7 ha (1561 and 2406 pixels for S-1A and RS-2, respectively). The second target is a forest situated in Southern France referred to as the “Mende forest”. Austrian Pine is the main species found in this forest, which is located at 43°30’04’’N and 03°30’41’’E. The forest covers an area of approximately 8.1 ha (856 pixels in S-1A). Finally, the third target represents a dense evergreen tropical forest located south of Gabon (01°08’19’’N and 11°50’07’’E) that is referred to as the “Gabon forest”. Gabon forest covers an area of approximately 635.2 ha (63882 pixels in S-1A images). Both the Mende and Gabon forests have evergreen canopies that retain foliage throughout the year. The S-1A images cover all of the invariant targets, whereas the RS-2 images only cover the racetrack target.

Figure 1.
Locations of the three invariant targets. (a) Racetrack; (b) Mende forest; (c) location of the racetrack and the Mende forest targets in France map; (d) Gadon forest; (e) location of the Gabon forest target in Gabon map.
For the racetrack, hourly temperature and precipitation data acquired from a meteorological station located 8 km away from the racetrack were available. For the Mende forest, hourly temperature and precipitation data were also available. Meteorological data for the Gabon forest were not available.
3. Data Analysis
For each S-1A image, the values of all pixels within each invariant target were averaged to determine the mean backscattering coefficients (σ°). σ°-values were then converted into dB units.
3.1. S-1A Radiometric Stability
To assess the radiometric stability of the S-1A data, σ°-value temporal variations of each invariant target were analyzed in VH and VV polarizations (Figure 2). This analysis was performed separately for radar signals at medium (32°–33°) and high incidence angles (40°–45°) (Figure 2). To explain potential temporal variations in σ°-values, the effects of rainfall were considered.
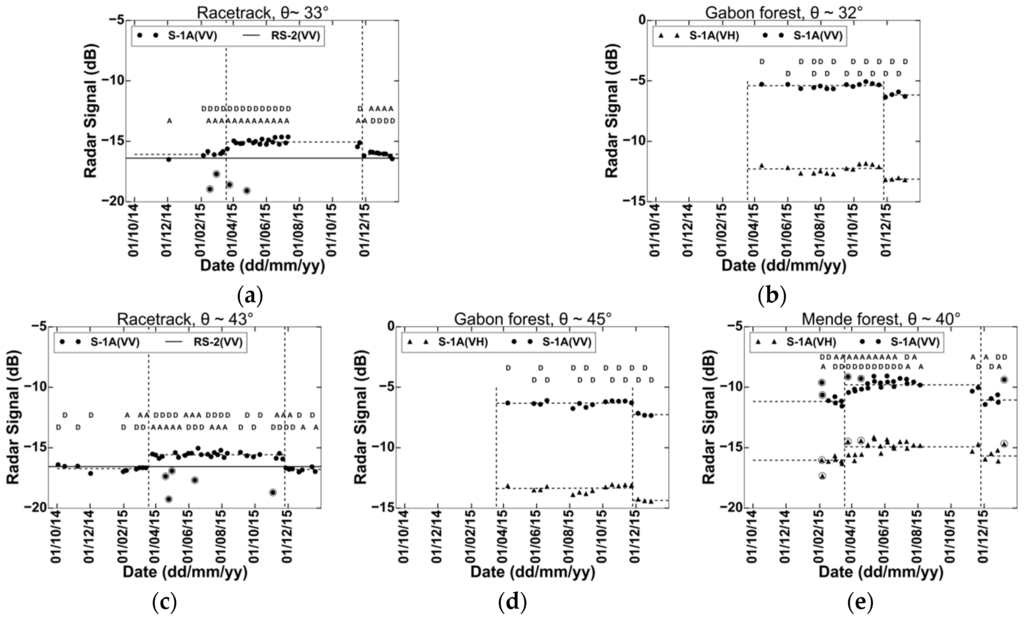
Figure 2.
Temporal variations of S-1A σ° in both VH and VV polarizations at medium (a,b) and high (c–e) incidence angles. Dashed vertical lines to the left and right refer to trends for 19 March 2015 and 25 November 2015, respectively. Continuous horizontal black lines in (a) and (c) denote RS-2 σ° for VV polarization. A: Ascending mode; D: Descending mode. Circles denote the S-1A σ° affected by rainfall.
For the racetrack, temporal variations in σ° for VH polarization (roughly −22 and −24 dB at 33° and 43°, respectively) are not presented in Figure 2, as they are less than or similar to the Noise Equal Sigma Zero (NESZ) value for S-1A (−22 dB) [8].
For all of the targets, it is possible to identify three nearly stable sub-time series of σ° (Figure 2). The end of the first sub-time series (the beginning of the second: 19 March 2015) and the end of the second sub-time series (the beginning of the third: 25 November 2015) closely correspond to dates that enhance the calibration of S-1A products [3,4]. However, for the racetrack and Mende forest, certain σ°-values within a given sub-time series present lower or higher signal levels relative to other σ°-values of the same sub-time series (σ° points circled in Figure 2). For the racetrack, a σ° level (in VV at 34° and 42°) that was lower by roughly 3.7 dB was found due to rainfall events occurring at the same time as S-1A acquisitions. The presence of water on the racetrack reduces backscatter phenomena and spurs signal specular reflection, thus generating weaker σ°-values. Moreover, for the Mende forest, rainfall events occurring during acquisition increase σ°-values (roughly 1 dB in both VH and VV at 40°). Rain droplets on leaves also increase σ°-values.
To quantify the S-1A signal stability for both VH and VV polarizations, mean (M) and standard deviation (SD) statistical indexes were computed for each stable sub-time series of σ°-values independent of Ascending and Descending mode images and at medium and high incidence angles (Table 1). σ°-values that were perturbed due to rainfall (circled in Figure 2) were eliminated from each sub-time series. For each sub-time series, the results show stability levels better than 0.48 dB (SD ≤ 0.48 dB) for both Ascending and Descending modes regardless of the invariant target used (Table 1). As an example, for the Gabon forest, the stability of σ°-values in the second and third sub-time series is better than 0.30 dB (Table 1). Miranda et al. [9] assessed the stability of ENVISAT data using transponders instruments and found that the stability of ENVISAT signals is roughly 0.55 dB. Moreover, Hawkins et al. [10] found that the stability of RADARSAT signals returned from rain forests is better than 0.60 dB.

Table 1.
For each invariant target, the mean (M) and standard deviation (SD) of σ°-values for each sub-time series. The format is: M ± std (number of points). σ°-values perturbed by rainfall were not used in the statistical calculations. A: Ascending mode; D: Descending mode.
Moreover, the effects of IPF upgrades on σ°-values were assessed by calculating the difference between mean σ°-values of sub-time series for each target (Table 1). For all invariant targets, correcting the EAP phase increases mean σ°-values of the second sub-series by roughly 1 dB (between 0.8 and 1.1 depending on the target) relative to that of the first sub-time series (Table 1). Moreover, correcting for gain imbalances decreases mean σ°-values of the third sub-series by roughly 0.9 dB (between 0.8 and 1.1 depending on the target) relative to that of the second sub-time series (Table 1). Thus, the mean σ°-values of the first and third sub-time series are almost equal (with a difference of less than 0.3 dB) (Table 1). Moreover, the mean σ°-values of the second sub-time series are higher than those of the first and third by roughly 0.9 dB on average (Table 1).
3.2. S-1A Radiometric Quality
The radiometric qualities of S-1A data were investigated by calculating the difference between S-1A and RS-2 σ° (in VV at 34° and 42°) (Δσ° = σ°S-1A − σ°RS-2) returned for the racetrack. The acquisition dates of the three RS-2 images do not fall within the S-1A period of acquisition. However, we assume that S-1A and RS-2 radar signals returned from this target could be comparable. The results show that S-1A σ°-values in the first and the third sub-time series are closer to RS-2 σ° than σ°-values of the second sub-time series. At 33°, Δσ° is equal to 0.3, 1.3, and 0.3 dB for the first, second, and third sub-time series, respectively. At 42°, this difference is equal to −0.1, 0.8, and −0.2 dB for the first, second, and third sub-time series, respectively. Thus, S-1A images acquired prior to 19 March 2015 (first sub-time series) and after 25 September 2015 (third sub-time series) appear to be well calibrated. However, S-1A data acquired between 19 March 2015 and 25 September 2015 (second sub-time series) present an offset of roughly 1 dB (σ° S-1A higher than σ° RS-2).
4. Conclusions
The purpose of this study was to assess the radiometric stability and quality of the new SAR sentinel-1A “S-1A” sensor. Our results reveal three stable sub-time series with different mean σ°-values. The mean σ°-values of the first sub-time (between 1 October 2014 and 19 March 2015) series are approximately equal to those of the third (between 25 November 2015 and 1 February 2016) sub-time series (difference lower than 0.3 dB). The σ°-values of the second sub-time series (between 19 March 2015 and 25 November 2015) are higher than those of the first and third by roughly 0.9 dB. In addition, our results show that the radiometric stability of the S-1A data of the Ascending and Descending modes is better than 0.48 dB. A comparison with RS-2 data shows that S-1A images acquired prior to 19 March 2015 and after 25 November 2015 appear to be well calibrated with a difference of between S-1A and RS-2 σ° (in VV polarization at 32° and 42°) lower than 0.3 dB. However, σ° S-1A from images acquired between 19 March 2015 and 25 November 2015 are greater than the σ° of RS-2 by roughly 1 dB for both 33° and 43°. This study presents initial results on the radiometric stability and quality of S-1A images acquired prior to February 2016. The use of a longer time series of S-1A images and more reference data are recommended to fully assess S-1A radiometric stability and quality levels.
Acknowledgments
The authors wish to thank the National Research Institute of Science and Technology for Environment and Agriculture (Irstea) and the French Space Study Center (CNES, TOSCA 2016) for supporting this work.
Author Contributions
Mohammad El Hajj and Nicolas Baghdadi conceived and designed the experiments; Mohammad El Hajj performed the experiments; Mohammad El Hajj and Nicolas Baghdadi analyzed the results; Mohammad El Hajj wrote the paper; Nicolas Baghdadi, Mehrez Zribi, and Sébastien Angelliaume revised the paper.
Conflicts of Interest
The authors declare no conflict of interest.
References
- Baghdadi, N.; El Hajj, M.; Dubois-Fernandez, P.; Zribi, M.; Belaud, G.; Cheviron, B. Signal level comparison between TerraSAR-X and COSMO-SkyMed SAR sensors. IEEE Geosci. Remote Sens. Lett. 2015, 12, 448–452. [Google Scholar] [CrossRef]
- Baghdadi, N.; Zribi, M.; Delorme, A. Assessment of the ASAR sensor radiometric quality in comparison to ERS-2 and RADARSAT-1 SAR data. Int. J. Remote Sens. 2008, 29, 4653–4665. [Google Scholar] [CrossRef]
- Miranda, N. Sentinel-1 Instrument Processing Facility: Impact of the Elevation Antenna Pattern Phase Compensation on the Interferometric Phase Preservation; European Space Agency: Paris, France, 2015. [Google Scholar]
- Miranda, N. Sentinel-1A TOPS Radiometric Calibration Refinement; European Space Agency: Paris, France, 2015. [Google Scholar]
- SENTINEL-1 Toolbox. Available online: https://sentinel.esa.int/web/sentinel/toolboxes/sentinel-1/ (accessed on 9 May 2016).
- Polsarpro Software. Available online: http://earth.eo.esa.int/polsarpro/ (accessed on 9 May 2016).
- MapReady Software. Available online: https://www.asf.alaska.edu/data-tools/mapready/ (accessed on 9 May 2016).
- Geudtner, D.; Torres, R.; Snoeij, P.; Davidson, M.; Rommen, B. Sentinel-1 System capabilities and applications. In Proceedings of the 2014 IEEE International Geoscience and Remote Sensing Symposium (IGARSS), Quebec, QC, Canada, 13–18 July 2014.
- Miranda, N.; Rosich, B.; Meadows, P.J.; Haria, K.; Small, D.; Schubert, A.; Lavalle, M.; Collard, F.; Johnsen, H.; Guarnieri, A.M. The EnviSAT ASAR Mission: A Look Back At 10 Years of Operation; European Space Agency Special Publication: Paris, France, 2013. [Google Scholar]
- Hawkins, R.; Attema, E.; Crapolicchio, R.; Lecomte, P.; Closa, J.; Meadows, P.J.; Srivastava, S.K. Stability of Amazon Backscatter at C-Band: Spaceborne Results from ERS-1/2 and RADARSAT-1. In Proceedings of the SAR Workshop: CEOS Committee on Earth Observation Satellites, Toulouse, France, 26–29 October 1999.

© 2016 by the authors; licensee MDPI, Basel, Switzerland. This article is an open access article distributed under the terms and conditions of the Creative Commons Attribution (CC-BY) license (http://creativecommons.org/licenses/by/4.0/).