Article

Using NDVI and EVI to Map Spatiotemporal Variation in the Biomass and Quality of Forage for Migratory Elk in the Greater Yellowstone Ecosystem

by
Erica L. Garroutte
1,*,
Andrew J. Hansen
1 and
Rick L. Lawrence
2
1
Department of Ecology, Montana State University, PO Box 173460, Bozeman, MT 59717, USA
2
Department of Land Resources & Environmental Sciences, Montana State University, PO Box 173120, Bozeman, MT 59717, USA
*
Author to whom correspondence should be addressed.
Remote Sens. 2016, 8(5), 404; https://doi.org/10.3390/rs8050404
Submission received: 17 February 2016 / Revised: 29 April 2016 / Accepted: 3 May 2016 / Published: 11 May 2016
(This article belongs to the Special Issue Remote Sensing of Biodiversity)

Abstract

:
The Normalized Difference Vegetation Index (NDVI) and the Enhanced Vegetation Index (EVI) have gained considerable attention in ecological research and management as proxies for landscape-scale vegetation quantity and quality. In the Greater Yellowstone Ecosystem (GYE), these indices are especially important for mapping spatiotemporal variation in the forage available to migratory elk (Cervus elaphus). Here, we examined how the accuracy of using MODIS-derived NDVI and EVI as proxies for forage biomass and quality differed across elevation-related phenology and land use gradients, determined if polynomial NDVI/EVI, site, and season effects improved these models, and then mapped spatiotemporal variation in the abundance of high quality forage available to elk across the Upper Yellowstone River Basin (UYRB) of the GYE. Models with a polynomial NDVI effect explained 19%–55% more variation in biomass than the linear NDVI and EVI models. Models with linear season effect explained 14%–20% more variation in chlorophyll, 37%–69% more variation in crude protein, and 26%–50% more variation in in vitro dry matter digestibility (IVDMD) than the linear NDVI and EVI models. Linear NDVI models explained more variation in biomass and quality across the UYRB than the linear EVI models. The accuracy of these models was lowest in grasslands with late onset of growth, in irrigated agriculture, and after the peak in biomass. Forage biomass and quality varied across the elevation-related phenology and land use gradients in the UYRB throughout the season. At their seasonal peak, the abundance of high quality forage for elk was 50% greater in grasslands with late onset of growth and 200% greater in irrigated agriculture than in all other grasslands, suggesting that these grasslands play an especially important role in the movement and fitness of migratory elk. These results provide novel information on the utility of NDVI and EVI for mapping spatiotemporal patterns of forage biomass and quality.

Graphical Abstract

1. Introduction

Remote sensing-based vegetation indices have gained considerable attention in ecological research and management as proxies for landscape-scale vegetation biomass and quality [1,2,3]. Among the existing indices, the satellite-derived Normalized Difference Vegetation Index (NDVI) and the Enhanced Vegetation Index (EVI) are the most commonly used indices because of their simplicity, availability, and demonstrated utility in a variety of ecosystems [2,3,4]. NDVI and EVI are ratios that contain red and near infrared (NIR) reflectance bands that are thought to be correlated with the “greenness” of the vegetation canopy, which is a property of photosynthetic activity, leaf area, and structure of vegetation [5,6]. Because of this link, NDVI and EVI have been used as proxies for the aboveground biomass [7], chlorophyll content [8,9], primary productivity [10], phenology [11], and quality [2] of vegetation in a variety of ecosystems. Once limited by field-based forage assessments, the availability of NDVI and EVI at large spatiotemporal scales has made them particularly useful for understanding the role of forage patterns on the movement and population dynamics of herbivores [12,13,14]. This is especially true as climate warming and human land use increasingly alter the timing of growth and patterns of forage available to herbivores [12,15,16]. Despite their utility, however, more information is needed on how the accuracy of NDVI and EVI as proxies for forage biomass and quality differs by site, land use, and season.
NDVI is widely used in ecological research and management as a proxy for the biomass and quality of forage available to herbivores [3]. A ratio of reflectance from red wavelengths absorbed by photosynthetic pigments (e.g., chlorophyll) and NIR wavelengths scattered by leaf mesophyll cells, NDVI [NDVI = (NIR − red)/(NIR + red)] is thought to be directly and causally related to the quantity of photosynthetically active vegetation on terrestrial surfaces [1,3,5]. Furthermore, because the crude protein content and digestibility of vegetation decline with seasonal growth as fibrous, cell wall structures accumulate [17], NDVI has also been shown to be correlated with the quality of forage for herbivores early in the season [2,8,18]. Because of these relationships, NDVI has been used to map spatiotemporal variation in the biomass and quality of forage available to herbivores across a variety of ecosystems [3,11,12,14,19].
The accuracy of NDVI as a proxy for forage biomass and quality, however, is known to be influenced by soil exposure, topography, senescent vegetation, atmospheric contaminants, and dense biomass [5,20]. In sparsely vegetated areas, variation in the moisture and brightness of exposed soil increases the irradiance of the NIR band and, thus, biases NDVI estimates [21,22]. In topographically diverse landscapes, variation in the viewing geometry, surface albedo, and sun elevation angle are known to degrade NDVI [20]. NDVI is also sensitive to scattering and elevated NIR irradiance from heterogeneous plant structure, senescent biomass, and atmospheric contaminants [5,23,24]. Lastly, NDVI is known to saturate in dense vegetation [5,23,25,26]. Because of these limitations, the accuracy of NDVI as a proxy for vegetation biomass and quality is known to differ by site, land use, and season [5,27,28,29]. Garonna et al. [30], for example, found that atmospheric contaminants were more likely to bias NDVI estimates in wet climates and seasons than in dry climates and seasons. Tittebrand et al. [27] also documented that the accuracy of NDVI differed with land cover type. Also, Porter et al. [28] found that NDVI explained more variation in biomass in early growth stages than in senescent stages. To account for these limitations, previous studies have found that including polynomial NDVI and site effects in NDVI models improved their performance by accounting for the saturation of NDVI in dense biomass and for differences in soil properties [31,32,33]. Although the limitations of NDVI are well known [3,33,34], a comprehensive understanding of how the accuracy of NDVI as a proxy for forage biomass and quality differs across the landscape is needed.
EVI has been proposed as a more robust proxy for forage biomass and quality than NDVI because of its improved resilience to saturation and resistance to soil and atmospheric contamination [5,20]. Like NDVI, EVI [EVI = 2.5 × (NIR − Red)/(NIR + C1 × Red − C2 × Blue + L)] is a ratio of red and NIR reflectance, but also includes an adjustment factor to account for the non-linear distortion from soil (L = 1), a blue band to reduce atmospheric contamination of the red band, and aerosol resistance coefficients (C1 = 6, C2 = 7.5) [5,35]. These adjustments are designed to make EVI more robust than NDVI in areas with high soil exposure and in dense vegetation [5,36]. These adjustments, however, are also known to make EVI more sensitive than NDVI to variation in the viewing geometry, surface albedo, and sun elevation angle across variable terrain [20,37]. More information is needed, therefore, on how the accuracy of EVI as a proxy for forage biomass and quality differs from NDVI across variable sites, land uses, and seasons.
Using NDVI and EVI as proxies for forage biomass and quality has become especially important for the research and management of migratory elk (Cervus elaphus) in the Greater Yellowstone Ecosystem (GYE). Throughout the season, elk require a sufficient quantity of forage with adequate levels of crude protein and digestibility to meet the nutritional and energy demands of growth, reproduction, and survival [17,38]. Because digestibility declines with seasonal vegetation growth, elk are thought to preferentially graze on grasses and forbs (e.g., elk sedge, Idaho fescue, etc.) in early growth stages because they provide an optimal trade-off of biomass and quality [39,40,41,42]. In the GYE, migratory elk are known to follow variation in grassland phenology from their low-elevation winter range to their high-elevation summer range to maximize their access to forage in early growth stages with adequate levels of crude protein and digestibility [43,44]. Recent concern has grown, however, that advances in the timing of spring green-up due to climate warming and shifts in anthropogenic land use may be altering the forage patterns available to migratory elk [16,45,46]. Given this concern, vegetation indices have become especially important for mapping and monitoring spatiotemporal variation in the biomass and quality of forage available to migratory elk across the GYE [11,47]. Thein et al. [11] and Piekielek [47], for example, used NDVI to map variation in grassland phenology and primary productivity across elevation and land use gradients in the GYE. Also, Christianson and Creel [8] linked seasonal variation in NDVI to elk fecal chlorophyll. In addition, Middleton et al. [16] used NDVI to link variation in the timing of spring green-up to the reproductive rates of elk in the GYE. Few studies, however, have directly assessed how the accuracy of NDVI as a proxy for forage biomass and quality differs across the elevation-related phenology and land use gradients used by migratory elk in the GYE [11,33,34]. In addition, few studies have examined whether EVI-based models or models containing polynomial effects, site differences, and season may provide improved estimates of biomass and quality across the GYE. This information is needed for a more comprehensive understanding of the utility and biological significance of using NDVI and EVI to map spatiotemporal variation in the biomass and quality of forage available to migratory elk.
In this study, we examined how the accuracy of NDVI and EVI models of biomass and quality differed across the landscape and then used these models to map spatiotemporal variation in the biomass and quality of forage available to migratory elk across the Upper Yellowstone River Basin (UYRB) of the GYE. NDVI and EVI were derived from the Moderate Resolution Imaging Spectroradiometer (MODIS) sensor onboard the Terra satellite because its wide coverage and availability at large spatial and frequent temporal scales have made them popular in ecological research and management [36,48,49]. The specific objectives of this study were to: (1) examine how the accuracy of linear NDVI and EVI models of biomass and quality differed across elevation-related phenology and land use gradients throughout the growing season; (2) determine if including polynomial NDVI/EVI, phenology, land use, and season effects in NDVI and EVI models improved their estimates of biomass and quality; and then (3) use these models and the nutritional requirements of elk [38] to map spatiotemporal variation in the abundance of high quality forage available to migratory elk across the UYRB.

2. Study Area

The 7400 km2 UYRB encompasses the low-elevation floodplains of the Yellowstone and Lamar Rivers and the high-elevation grassland plateaus in the northern range of Yellowstone National Park [47]. The 100,000 ha of grasslands and shrub-grasslands in the UYRB form the primary grazing habitat for the northern Yellowstone elk herd as well as bison (Bison bison), pronghorn (Antilocapra americana), mule deer (Odocoileus hemionus), and bighorn sheep (Ovis canadensis) [49,50]. Human land uses in the UYRB consist of privately-owned irrigated agriculture and low-density rural development primarily located in the low-elevation Paradise Valley [46]. The UYRB exhibits strong variation in climate and edaphic properties across its 1524–2743 m elevation gradient [11]. Average annual temperature ranges from 8 °C to −2 °C and average annual precipitation ranges from 300 mm to 1500 mm from low to high elevations [47]. Glacial erosion has resulted in a mixture of rhyolite alluvium in low elevations, mixed colluviums in mid elevations, and shallow andesitic soils in high elevations [46]. Vegetation species vary across these gradients, with mesic meadows and sagebrush found primarily in the moisture-retaining, andesitic soils and dry grasses and shrubs found in dry, rhyolitic soils [51]. Low elevations contain bluebunch wheatgrass (Pseudoroegnaria spicata) and Sandberg’s bluegrass (Poa secunda) as well as non-native crested wheatgrass (Agropyron cristatum), cheatgrass (Bromus tectorum), and annual wheatgrass (Eremopyrum triticeum) [47,51]. Mid elevations contain Idaho fescue (Fetuca idhoensis), big sagebrush (Artemisia tridentate), and bluebunch wheatgrass (Pseudoroegneria spicata) [47,51]. High elevations include sheep fescue (Fetuca ovina), rushes (Juncus), and Rydberg’s fleabane (Erigeron rydbergii) [47,51] (Figure 1).

3. Data

3.1. Identification and Classification of Grassland Pixels

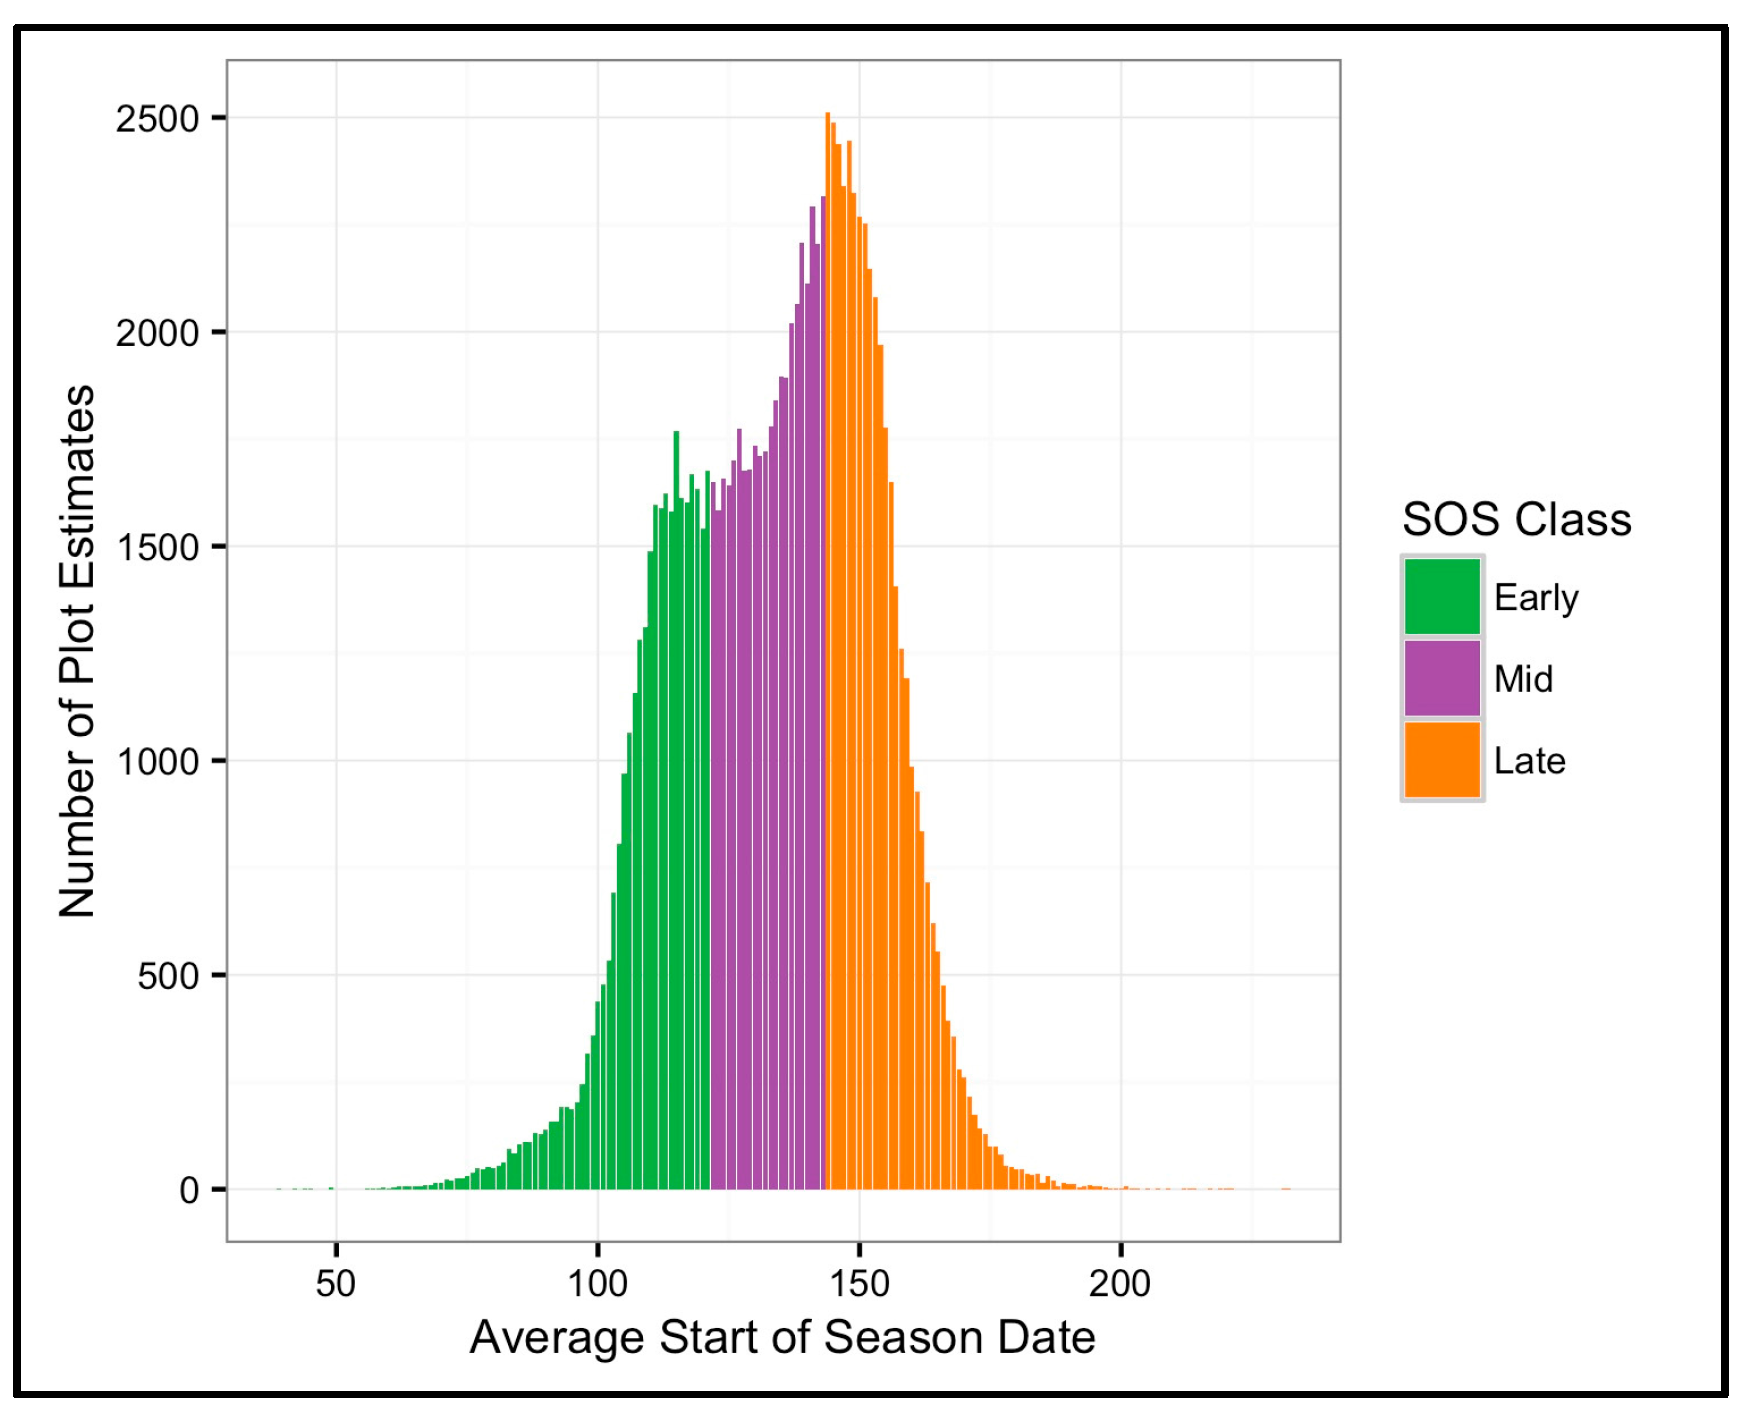
We identified grassland pixels that started growth at different times (SOS classes) and had different land uses (land use classes) in the UYRB. A map of grasslands from Piekielek [47], derived from vector-delineated habitat types from Despain [51] and the National Land Cover Dataset (2011), was used to identify all 250 m grassland pixels in the UYRB. Then, a previous NDVI analysis [47] of the average start of season date (average date that pixels reached half of their seasonal NDVI amplitude from 2001–2009) was used to categorize the grassland pixels into early (Julian days 39–121), mid (Julian days 122–143), and late (Julian days 144–221) SOS classes (Figure 2). Next, we used Montana cadastral data, the National Land Cover Dataset (2011), and field observations to classify grassland pixels into irrigated agriculture, private grassland (all non-irrigated private grasslands), and public grassland land use classes [47,52]. To ensure that these grasslands were relevant to migratory elk, we selected grassland pixels within the summer migratory range of elk carrying GPS collars between 2007 and 2012 (MacNulty and Kohl from Utah State University and Montana Fish, Wildlife, and Parks, pers. comm). Finally, to maximize the number of pixels that could logistically be sampled, we selected pixels less than 3 km from roads and trails. While we acknowledge that this proximity to roads and trails may have deterred elk from using these pixels, we did not see any noticeable different in elk presence and, therefore, we expect that these pixels are representative of grasslands used by elk across the UYRB. To reduce the influence of multiple cover types on the reflectance of pixels (i.e., mixed pixel effects), we used satellite images and field observation to select pixels covered with at least 90% sage-grasslands. From this final selection, we randomly selected four pixels in early, mid, and late SOS classes and four pixels in irrigated agriculture, private grasslands, and public grasslands. In total, we sampled 20 grassland pixels throughout the summer growing seasons of 2013 and 2014. This selection, however, did not constitute a full factorial design. Because irrigated agriculture only occurred in low elevations with early onset of growth, our land use analysis was restricted to the early SOS class. Likewise, because the mid and late SOS classes were only present in public grasslands, the SOS analysis was restricted to public grasslands.

3.2. Field Estimation of Biomass, Chlorophyll, Crude Protein, and Digestibility

We estimated the average aboveground biomass, chlorophyll content (spectral density of 666 nm wavelengths related to chlorophyll a), crude protein (percent of degradable and rumen assimilated proteins), and in vitro dry matter digestibility (IVDMD) (percent of biomass digested in vitro with the rumen fluid of a cow) of the 20 selected grassland pixels throughout the growing season [17]. We harvested all aboveground biomass (<1 cm from soil) from ten, 0.25 m2 quadrats in 2013 and twenty, 0.25 m2 quadrats in 2014 randomly located across each of the 20 selected pixels every ten days throughout the growing season. To avoid repeat sampling, quadrats were moved within a 5 m2 area at each sampling period using a handheld GPS. Sampling in the early and mid SOS classes occurred from Julian day 119 to 275, while sampling in the late SOS class started after the snow melted on Julian day 155 and ended on Julian day 265. The harvested biomass from each quadrat was stored in paper bags, dried at 55 °C, weighed to the nearest 0.01 g, ground over a 1 mm screen, and then pooled by pixel and sampling period [8]. To estimate the average aboveground biomass of each pixel, we averaged the dry biomass from all quadrats within each pixel and then converted the estimates to the g/m2 scale. To estimate the average chlorophyll content of each pixel, we used the methods outlined by Christianson and Creel [8] to extract and quantify the average chlorophyll content of four samples from the pooled quadrats in each pixel. To calculate the average crude protein of each pixel, we analyzed the nitrogen content of four 0.12 ± 0.01 g samples from the pooled quadrats in each pixel with a LECO FP-228 Nitrogen Determinator Combustion tool and then averaged and multiplied the nitrogen estimate by 6.25. To estimate the average IVDMD of each pixel, we digested four 0.5 ± 0.1 g samples from the pooled quadrats in each pixel in the rumen fluid of an inoculated cow (fed an alfalfa and hay diet) for 48 h in an ANKOM Daisy II incubator and then estimated the average IVDMD [IVDMD = (total mass − undigested mass)/total mass] of each pixel. In total, we analyzed 321 pixel estimates of biomass, chlorophyll, crude protein, and IVDMD.

3.3. NDVI and EVI Data

NDVI and EVI estimates were derived from the daily, 250 m MODIS MOD09GQ images and the daily, 500 m MOD09GA images on each field sampling date. MOD09GQ and MOD09GA images were downloaded from the USGS Land Processes Distributed Active Archive Center in their original sinusoidal projection, resampled using the nearest neighbor method, and reprojected to Albers equal area so they were consistent with Piekielek [47]. GPS points from notable land features within pixels were used to ensure that satellite and field pixels lined up. NDVI was calculated from the red (band 1: 620–670 nm) and the NIR (band 2: 841–876 nm) bands from the daily, 250 m MOD09GQ image [NDVI = (band 2 − band 1)/(band 2 + band 1)] [53]. EVI was calculated from the red and NIR bands from the daily, 250m MODIS MOD09GQ image and the blue band (band 3: 459–479 nm) from the daily, 500 m MOD09GA image [EVI = (band 2 − band 1)/(band 2 + (6 × band 1) − (7.5 × band 3) + 1)] [53]. The blue band was acquired from the 500 m MOD09GA data because the 250 m MOD09GQ data did not include a blue band [6]. Because the blue band is included in EVI to reduce atmospheric contamination of the red band and does not contribute any biophysical information to the index [6], we expected that the greater spatial resolution of the blue band did not influence the EVI estimates. MODIS quality assurance data, which is an estimate of the degree of error from instrument contact, striping, geolocation, and cloud contamination, were used to assess the quality of the pixel estimates [53]. When pixels were low quality, estimates from the next closest date were used. All NDVI and EVI estimates were acquired within five days of the field sampling dates.

4. Methods

4.1. Accuracy of NDVI and EVI Differed Across Phenology and Land Use Gradients

We examined how the performance of linear NDVI and EVI models of biomass and quality differed between SOS classes, land use classes, and before and after the peak in biomass [54]. Because all land uses were not represented in all SOS classes (i.e., irrigated agriculture was only present in the low-elevation grasslands with early onset of growth), we fit separate models to the SOS data (only public grasslands) and to the land use data (only early SOS). First, to examine how the performance of these models varied across all SOS and land use classes, we fit linear regression models with biomass, chlorophyll, crude protein, or IVDMD as the response variable and NDVI or EVI as the explanatory variable to the SOS data and to the land use data. The corrected Akaike Information Criterion (AICc), adjusted coefficient of determination (R2), and F-statistics and p-values from these models were presented and residual plots were used to determine if the model errors were normally distributed and had homogeneous variation. Then, to assess how the predictive accuracy of these models differed between classes, we used repeat cross validation without replacement to estimate the average root mean squared error (RMSE) of the linear NDVI and EVI models in each SOS class, land use class, and before and after the peak in biomass. Specifically, we repeatedly fit (×1000) the models to a random 70% of the data within a specific SOS or land use class and then used the remaining 30% of the data to calculate the average RMSE of each model in each class. Weighted regression was used to analyze how the RMSEs differed by SOS class, land use class, and before/after the peak in biomass.

4.2. Top Models of Grassland Biomass and Quality

To determine if polynomial NDVI/EVI, site, and season effects improved NDVI and EVI models of forage biomass and quality, we compared multiple mixed effects models with different combinations of fixed effects, interactions, linear and polynomial functions, and correlation structures to identify the top models of forage biomass and quality (Table A1). Again, because not all land uses were represented in all SOS classes, we selected separate top models for the SOS data and the land use data. In these models, the response variable was biomass, chlorophyll, crude protein, or IVDMD and the fixed explanatory variables were NDVI or EVI, SOS or land use class, and date. All models included a random effect for pixel to account for the variability between pixel estimates [55]. The fixed effects in these models explained variation in biomass and quality at the grouping level (i.e., SOS or land use class), while the random effect described variability in forage biomass and quality at the individual pixel level [55]. To determine the shape of the relationship between NDVI/EVI and forage biomass and quality [31], we compared models with linear, quadratic, cubic, and basis spline polynomial functions for NDVI and EVI. Basis spline functions (piecewise polynomial functions) with two knots were included to determine if the shape of the relationship differed before, during, and after the peak in biomass [55]. To determine if the shape of this relationship differed by site or season, we compared models with an interaction between NDVI/EVI and SOS/land use class and an interaction between NDVI/EVI and date. To determine if the variation in biomass and quality differed by class, we compared models with variance structures (i.e., varIdent [55]) for SOS and land use class. Lastly, we compared models with temporal and spatial autocorrelation structures to determine if there was correlation between estimates from sequential sampling periods and from similar locations [55,56]. The corrected Akaike Information Criterion (AICc) was used in forward-backward model selection to select the top models (>2 AICc units less than the other models), maximum likelihood estimation was used to estimate the model parameters, an F-test was used to compare the models, and the intra-class correlation (ICC) was used to calculate the correlation between the random pixel effects in each model [55]. While AICc was used to select models, we also reported the marginal coefficient of determination (R2) (which is the variance explained by the fixed effects [57]), the partial R2 for each fixed effect (rp2) (which is the variance explained by each fixed effect), and the F-statistics and p-values. Finally, we used the repeat cross validation methods described above to examine how the RMSEs from the top models compared to the NDVI and EVI models in the different SOS classes, land use classes, and before/after the peak in biomass.
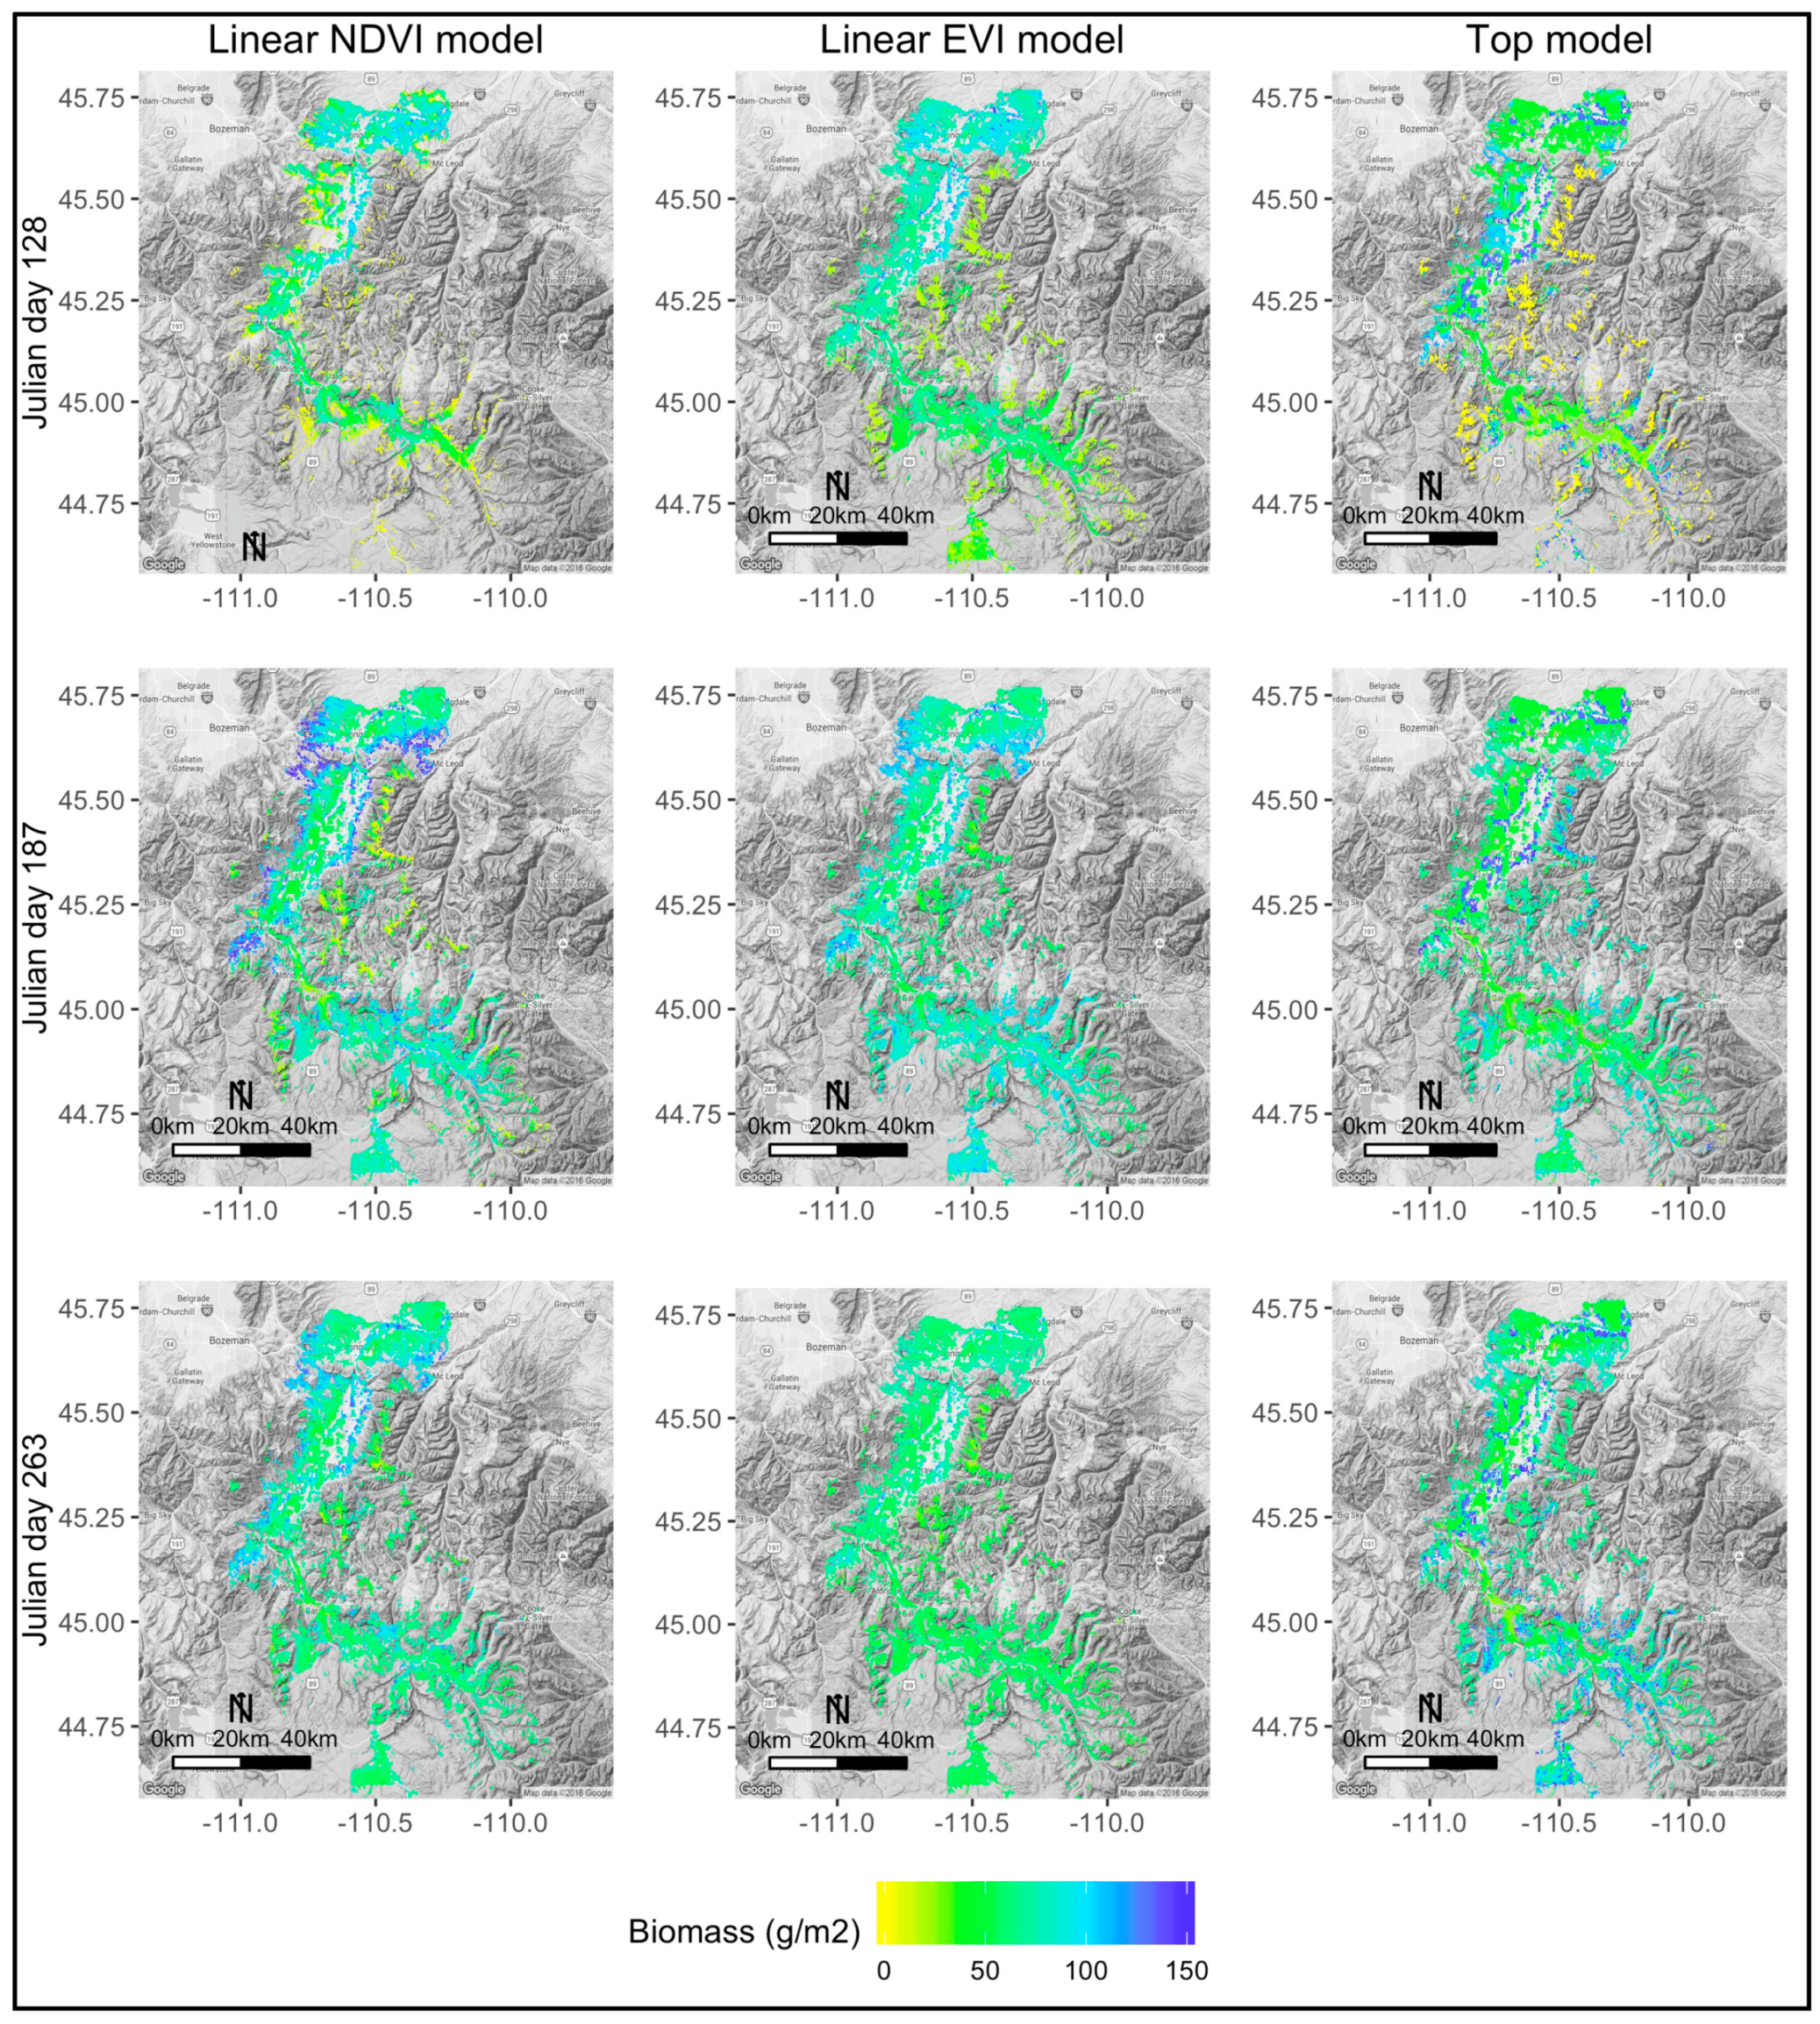
To examine how the spatiotemporal patterns of forage biomass and quality differed by model, we used the linear NDVI, linear EVI, and top models to generate spatially explicit maps of biomass, chlorophyll, crude protein, and IVDMD across the UYRB throughout the season. NDVI and EVI rasters, which were derived from red and NIR bands from the 250 m MOD09GQ images and the downscaled blue bands from the 500 m MOD09GA images, were used in these models to interpolate biomass and quality across the UYRB. Because separate models were selected for the SOS and land use data, we extracted all pixels within each SOS and land use class and then used the corresponding model to interpolate biomass and quality across the specific class and then merged the rasters into one image. In the top models, a categorical effect for the specific SOS and land use class was included in the model to project biomass and quality across the pixels within that specific class. The SOS model was used to interpolate biomass and quality across the low-elevation grassland pixels that were categorized as both early SOS and public grassland classes. To assess how these patterns differed through the season, we generated maps on Julian day 128 to represent a date before most grasslands reached their seasonal peak in biomass, on Julian day 187 to represent a date when most grasslands were at their seasonal peak in biomass, and on Julian day 263 to represent a date when biomass was declining [47]. Weighted regression was used to analyze how biomass and quality differed by model.

4.3. Spatiotemporal Variation in the Abundance of High Quality Forage for Elk

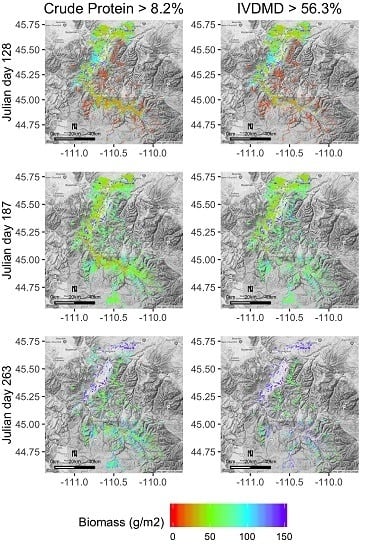
To assess the relevance of these forage patterns for elk, we used the top models and the nutritional requirements of captive elk from Cook et al. [38] to map spatiotemporal variation in the abundance of forage of adequate quality for elk across the UYRB. First, we used the nutritional thresholds for elk [38], which were the minimum crude protein (≥8.2%) and digestibility (≥56.3%) levels that supported the summer weight gain of lactating elk, to identify all crude protein and IVDMD pixel estimates from the top models that were above these thresholds. We then used the top biomass models to generate spatially explicit maps of the abundance of forage with adequate crude protein and IVDMD for elk across the UYRB on Julian days 128, 187, and 263. Weighted regression was used to assess how the abundance of high quality forage varied by class and season.

5. Results

5.1. Linear NDVI and EVI Models Explained Minimal Variation in Biomass and Quality

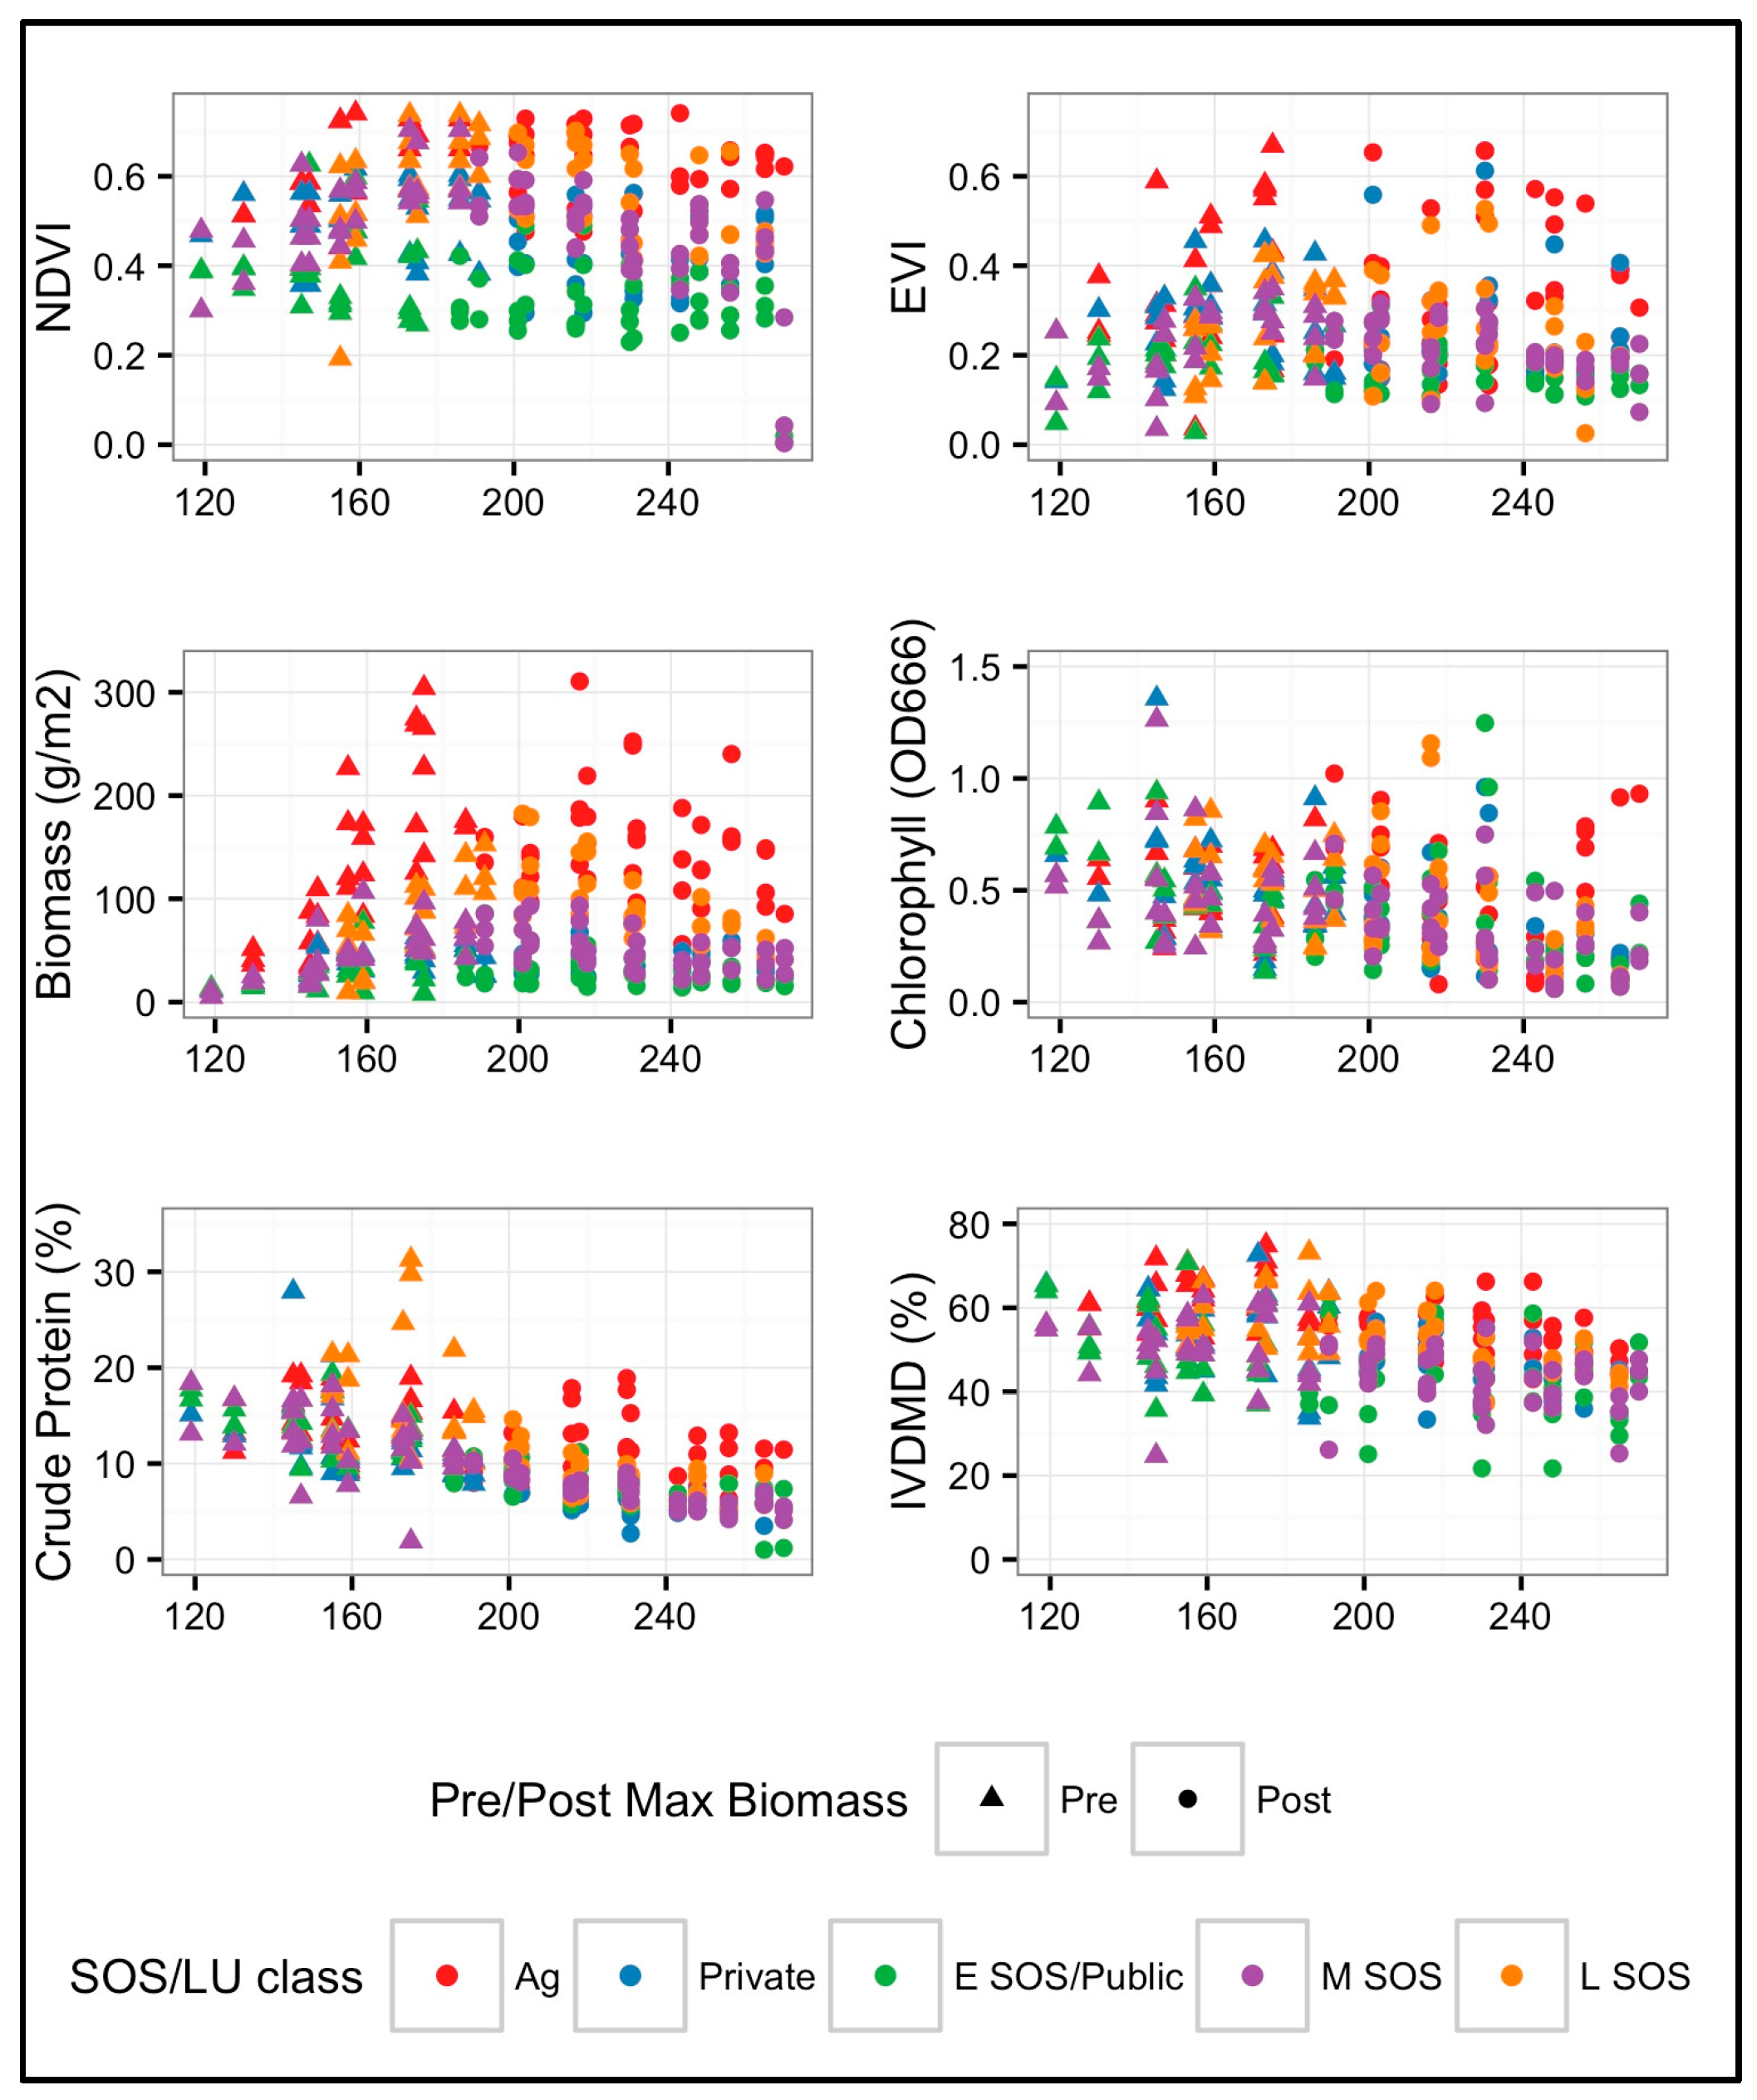
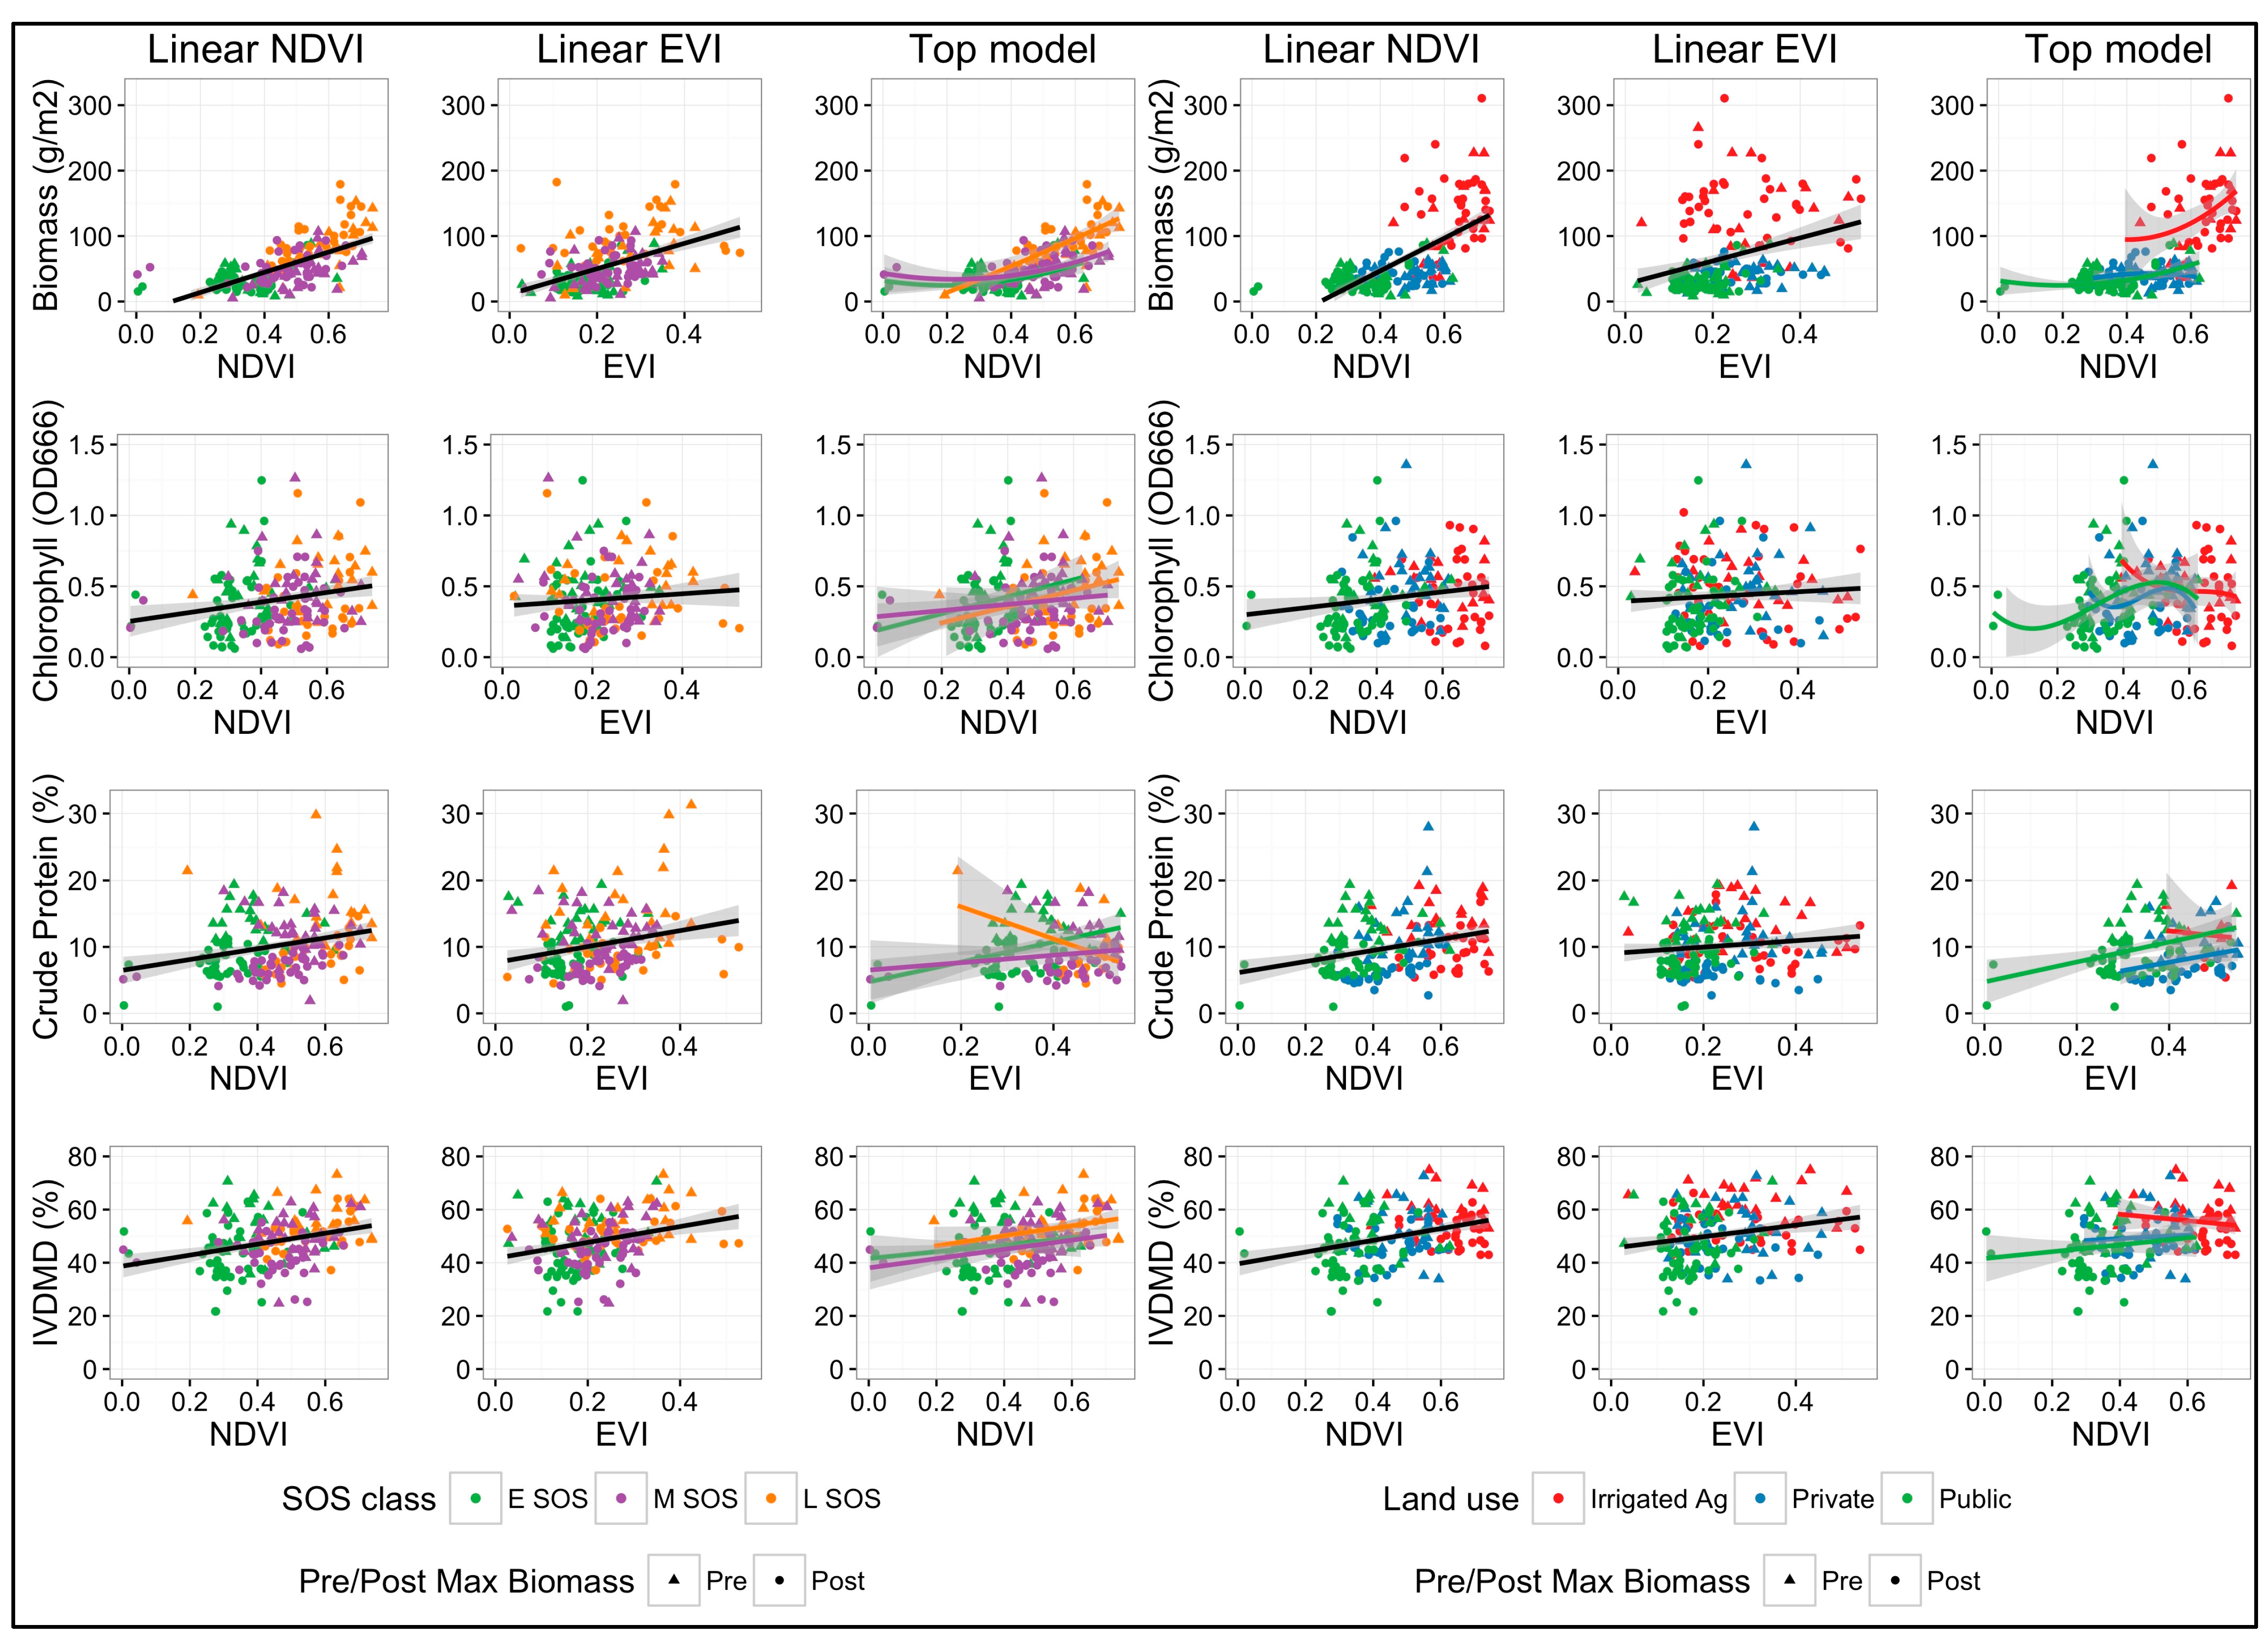
Linear NDVI and EVI models explained 42%–53% of the variation in biomass, 2%–4% of the variation in chlorophyll, 9%–14% of the variation in crude protein, and 11%–18% of the variation in IVDMD across the SOS and land use classes in the UYRB throughout the season (Figure 3 and Figure 4 and Table 1 and Table 2). The residuals from these models were normally distributed but had heterogeneous variance. The RMSEs from the linear NDVI and EVI models were greater in the late SOS class than in the early and mid SOS classes (p < 0.001), greater in irrigated agriculture than in private and public grasslands (p < 0.001), and greater after the peak in biomass than before (p < 0.01). The linear NDVI models explained 18%–36% more variation in biomass, 2%–3% more variation in chlorophyll, 4%–9% more variation in crude protein, and 3%–12% more variation in IVDMD than the linear EVI models across the UYRB throughout the season. RMSEs from the linear NDVI models were lower than in the linear EVI models in all SOS classes (p < 0.04), land use classes (p < 0.001), and before/after the peak in biomass (p > 0.05).

5.2. Polynomial NDVI and Date Effects Improved Models of Biomass and Quality

Models with a polynomial NDVI effect explained 19%–55% more variation in biomass than the linear NDVI and EVI models in all SOS classes (p < 0.001) and land use classes (p < 0.001) in the UYRB (Figure 3 and Figure 4 and Table 1 and Table 2). The top model in the SOS classes included an interaction between a basis spline function for NDVI and SOS class, a variance structure for SOS class, and a random effect for pixel (AICc = 1662.5). The top model in the land use classes included an interaction between a quadratic NDVI effect and date, a land use effect, a variance structure for land use, and a random pixel effect (AICc = 1826.7). In these models, the polynomial NDVI effect was responsible for most of the explained variation in biomass (Rp2 = 0.59 and 0.62). The residuals from these models were normally and homogeneously distributed and there was moderate correlation between pixel estimates (ICC = 0.41 and 0.14). RMSEs from the top models were greater in the late SOS class than in the early and mid SOS classes (p < 0.001), greater in irrigated agriculture than in private and public grasslands (p < 0.001), and greater after the peak in biomass than before (p < 0.001). Between models, the RMSEs from the top models were lower than the linear NDVI and EVI models in all SOS classes (p < 0.01), all land use classes (p < 0.02), and before/after the peak in biomass (p < 0.01).
Models with an effect for date explained substantially more variation in forage quality across the UYRB than the linear NDVI and EVI models (Figure 3 and Figure 4 and Table 1 and Table 2). For chlorophyll, a model with a linear NDVI effect, a date effect, and a random pixel effect explained 14%–20% more variation in chlorophyll than the linear NDVI and EVI models in all SOS classes (p < 0.001) and land use classes (p < 0.001) in the UYRB. In these models, the date effect was responsible for most of this explained variation in chlorophyll (rp = 0.15 and 0.11) and there was moderate correlation between pixel estimates (ICC = 0.02 and 0.01). For crude protein, a model with a basis spline function for EVI, a SOS/land use class effect, a date effect, a variance structure for SOS/land use class, and a random pixel effect explained 37%–69% more variation in crude protein than the linear NDVI and EVI models in all SOS classes (p < 0.001) and land use classes (p < 0.001) in the UYRB. In these models, the date effect explained most of this variation in crude protein (rp = 0.54 and 0.31) and there was some correlation between pixel estimates (ICC = 0.17 and 0.18). For IVDMD, a model with an NDVI and date interaction, a SOS class effect, a variance structure for SOS class, and a random pixel effect explained 26% more variation in IVDMD than the linear NDVI and EVI models in all SOS classes (p < 0.001). A model with a quadratic NDVI effect, a land use effect, a date effect, a variance structure for land use class, and a random pixel effect explained 50% more variation in IVDMD than the linear NDVI and EVI models in all land use classes (p < 0.001). In these models, the date effect explained most of the variation in IVDMD (rp = 0.18 and 0.28) and there was little correlation between pixel estimates (ICC = 0.19 and 0.01). The residuals from these models were normally and homogeneously distributed. The RMSEs from the top models were greater in the late SOS class than in the early and mid SOS classes (p < 0.01), greater in irrigated agriculture than in private and public grasslands (p < 0.01), and greater after the peak in biomass than before (p < 0.04). Between models, the RMSEs from the top models were lower than the linear NDVI and EVI models in all SOS classes (p < 0.03), all land use classes (p < 0.01), and before/after the peak in biomass (p < 0.04).

5.3. Spatiotemporal Variation in Grassland Biomass and Quality Across the UYRB

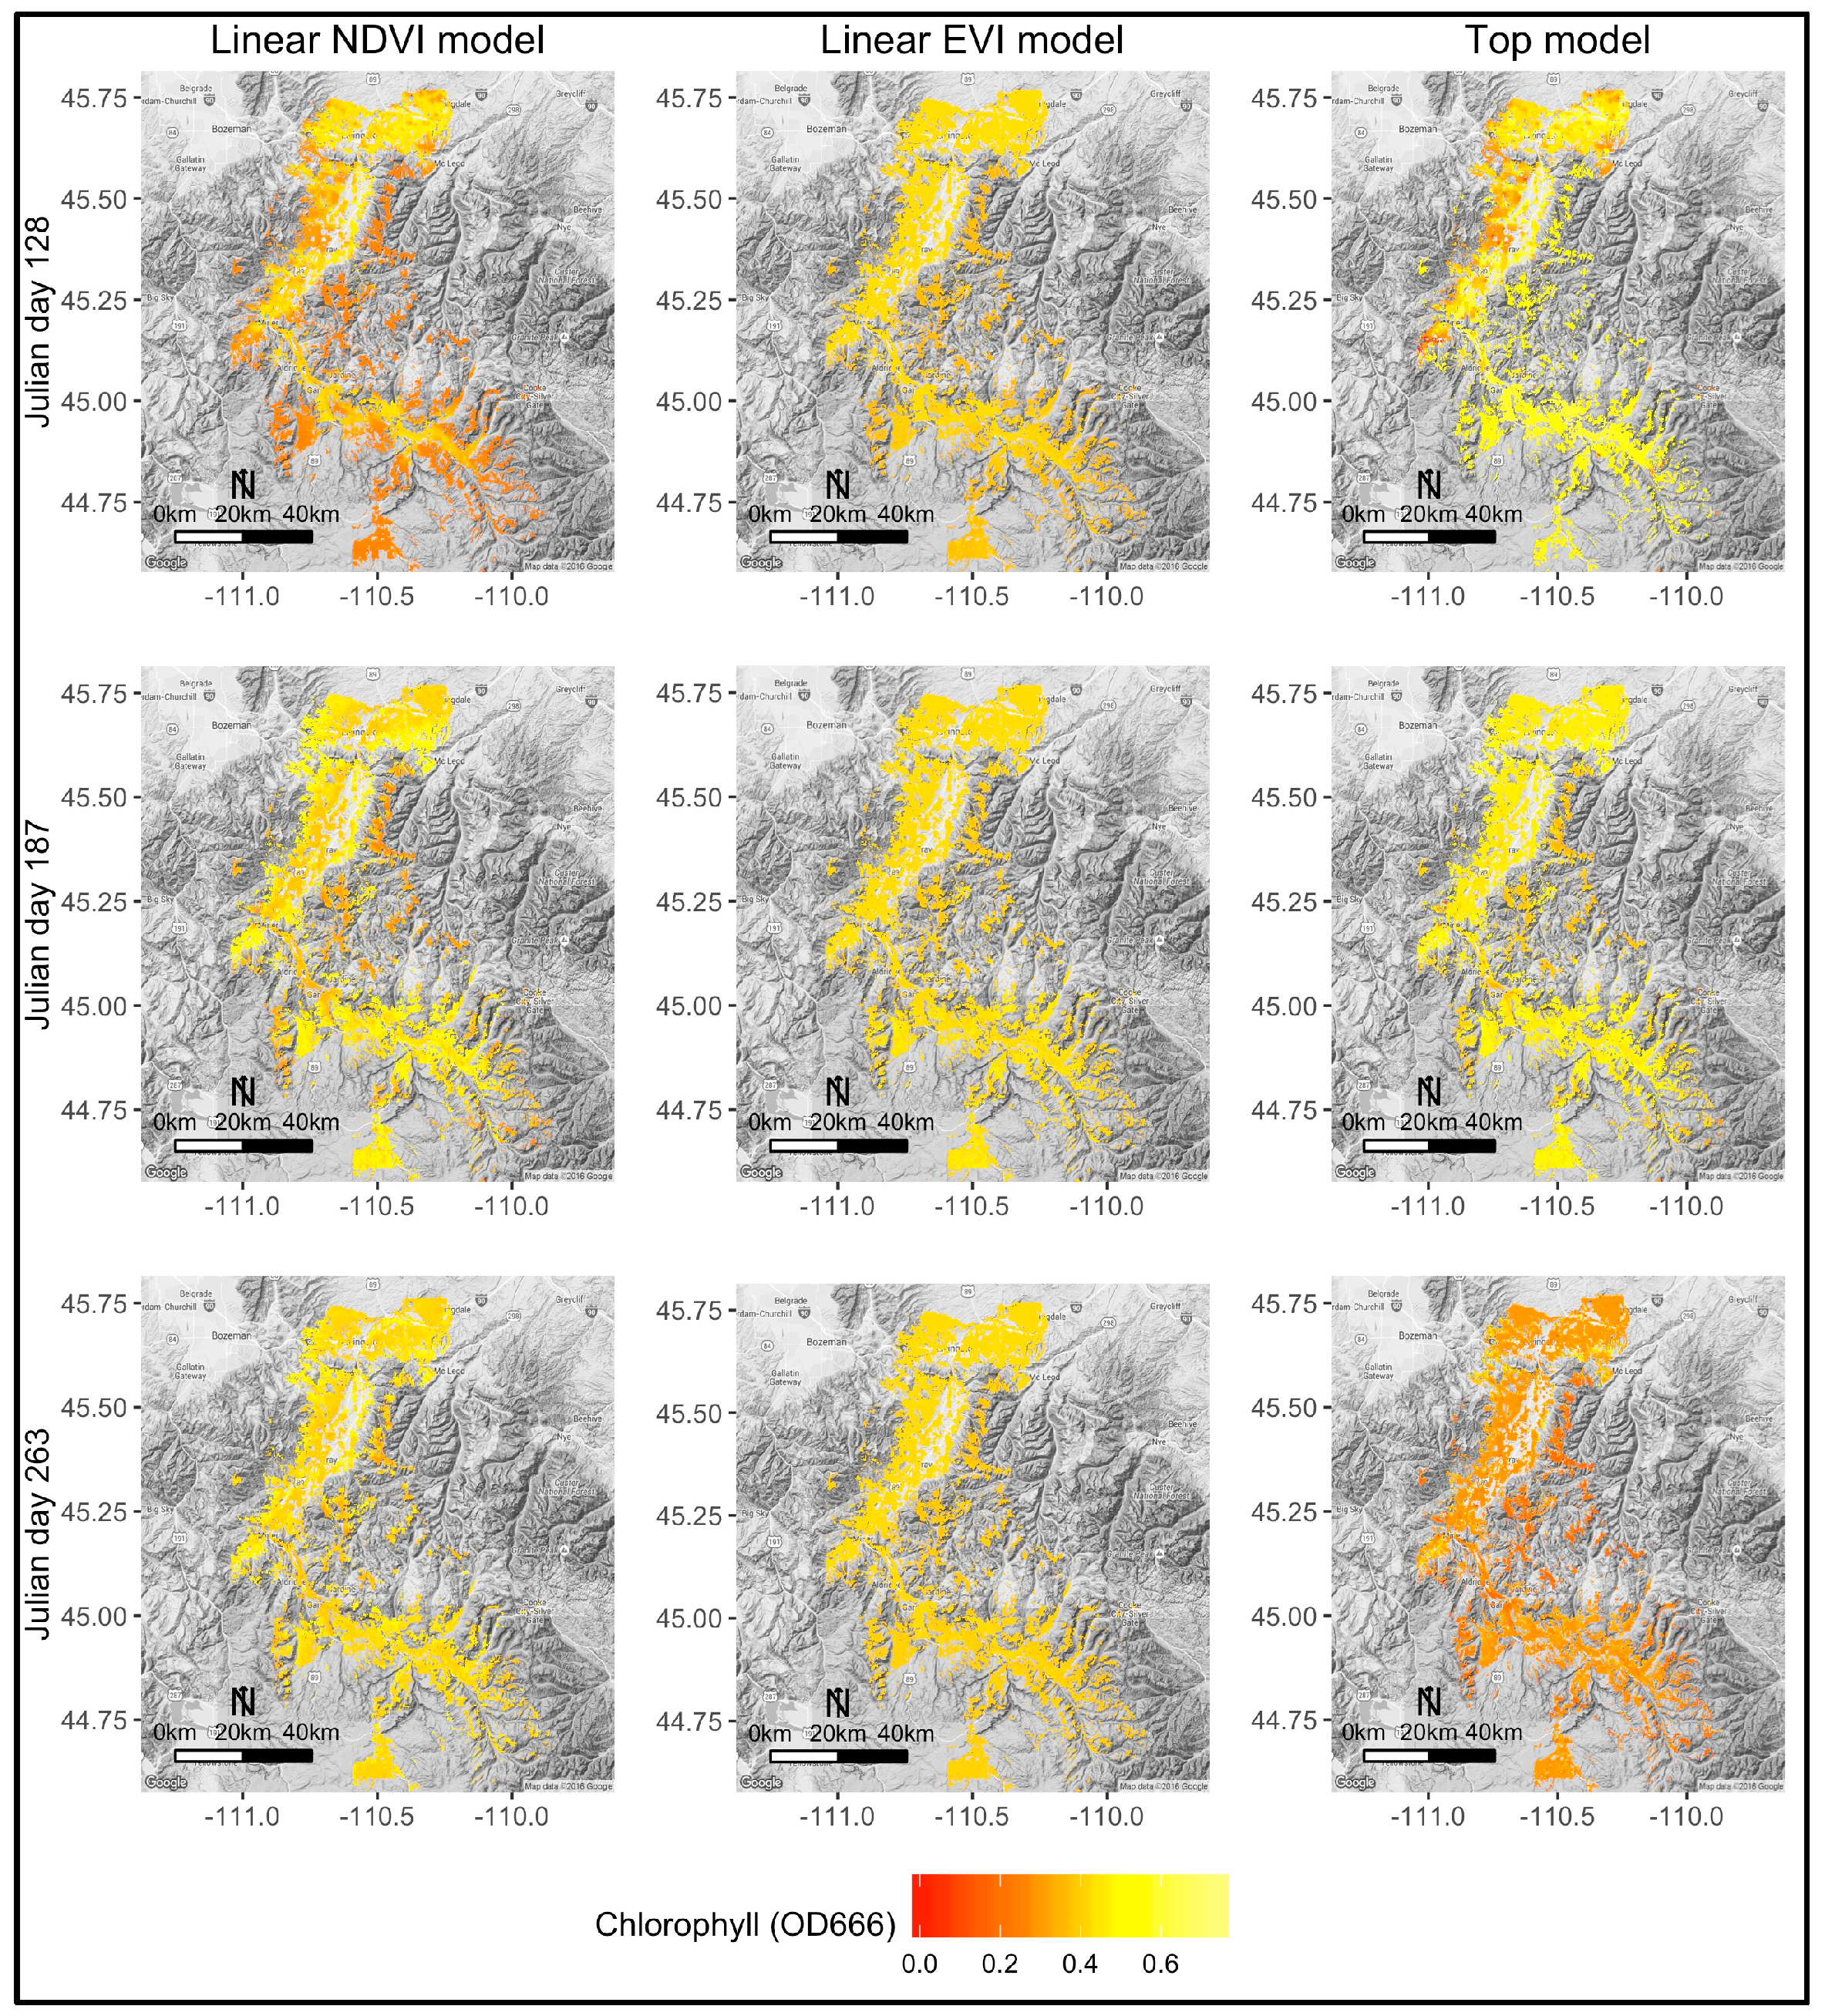
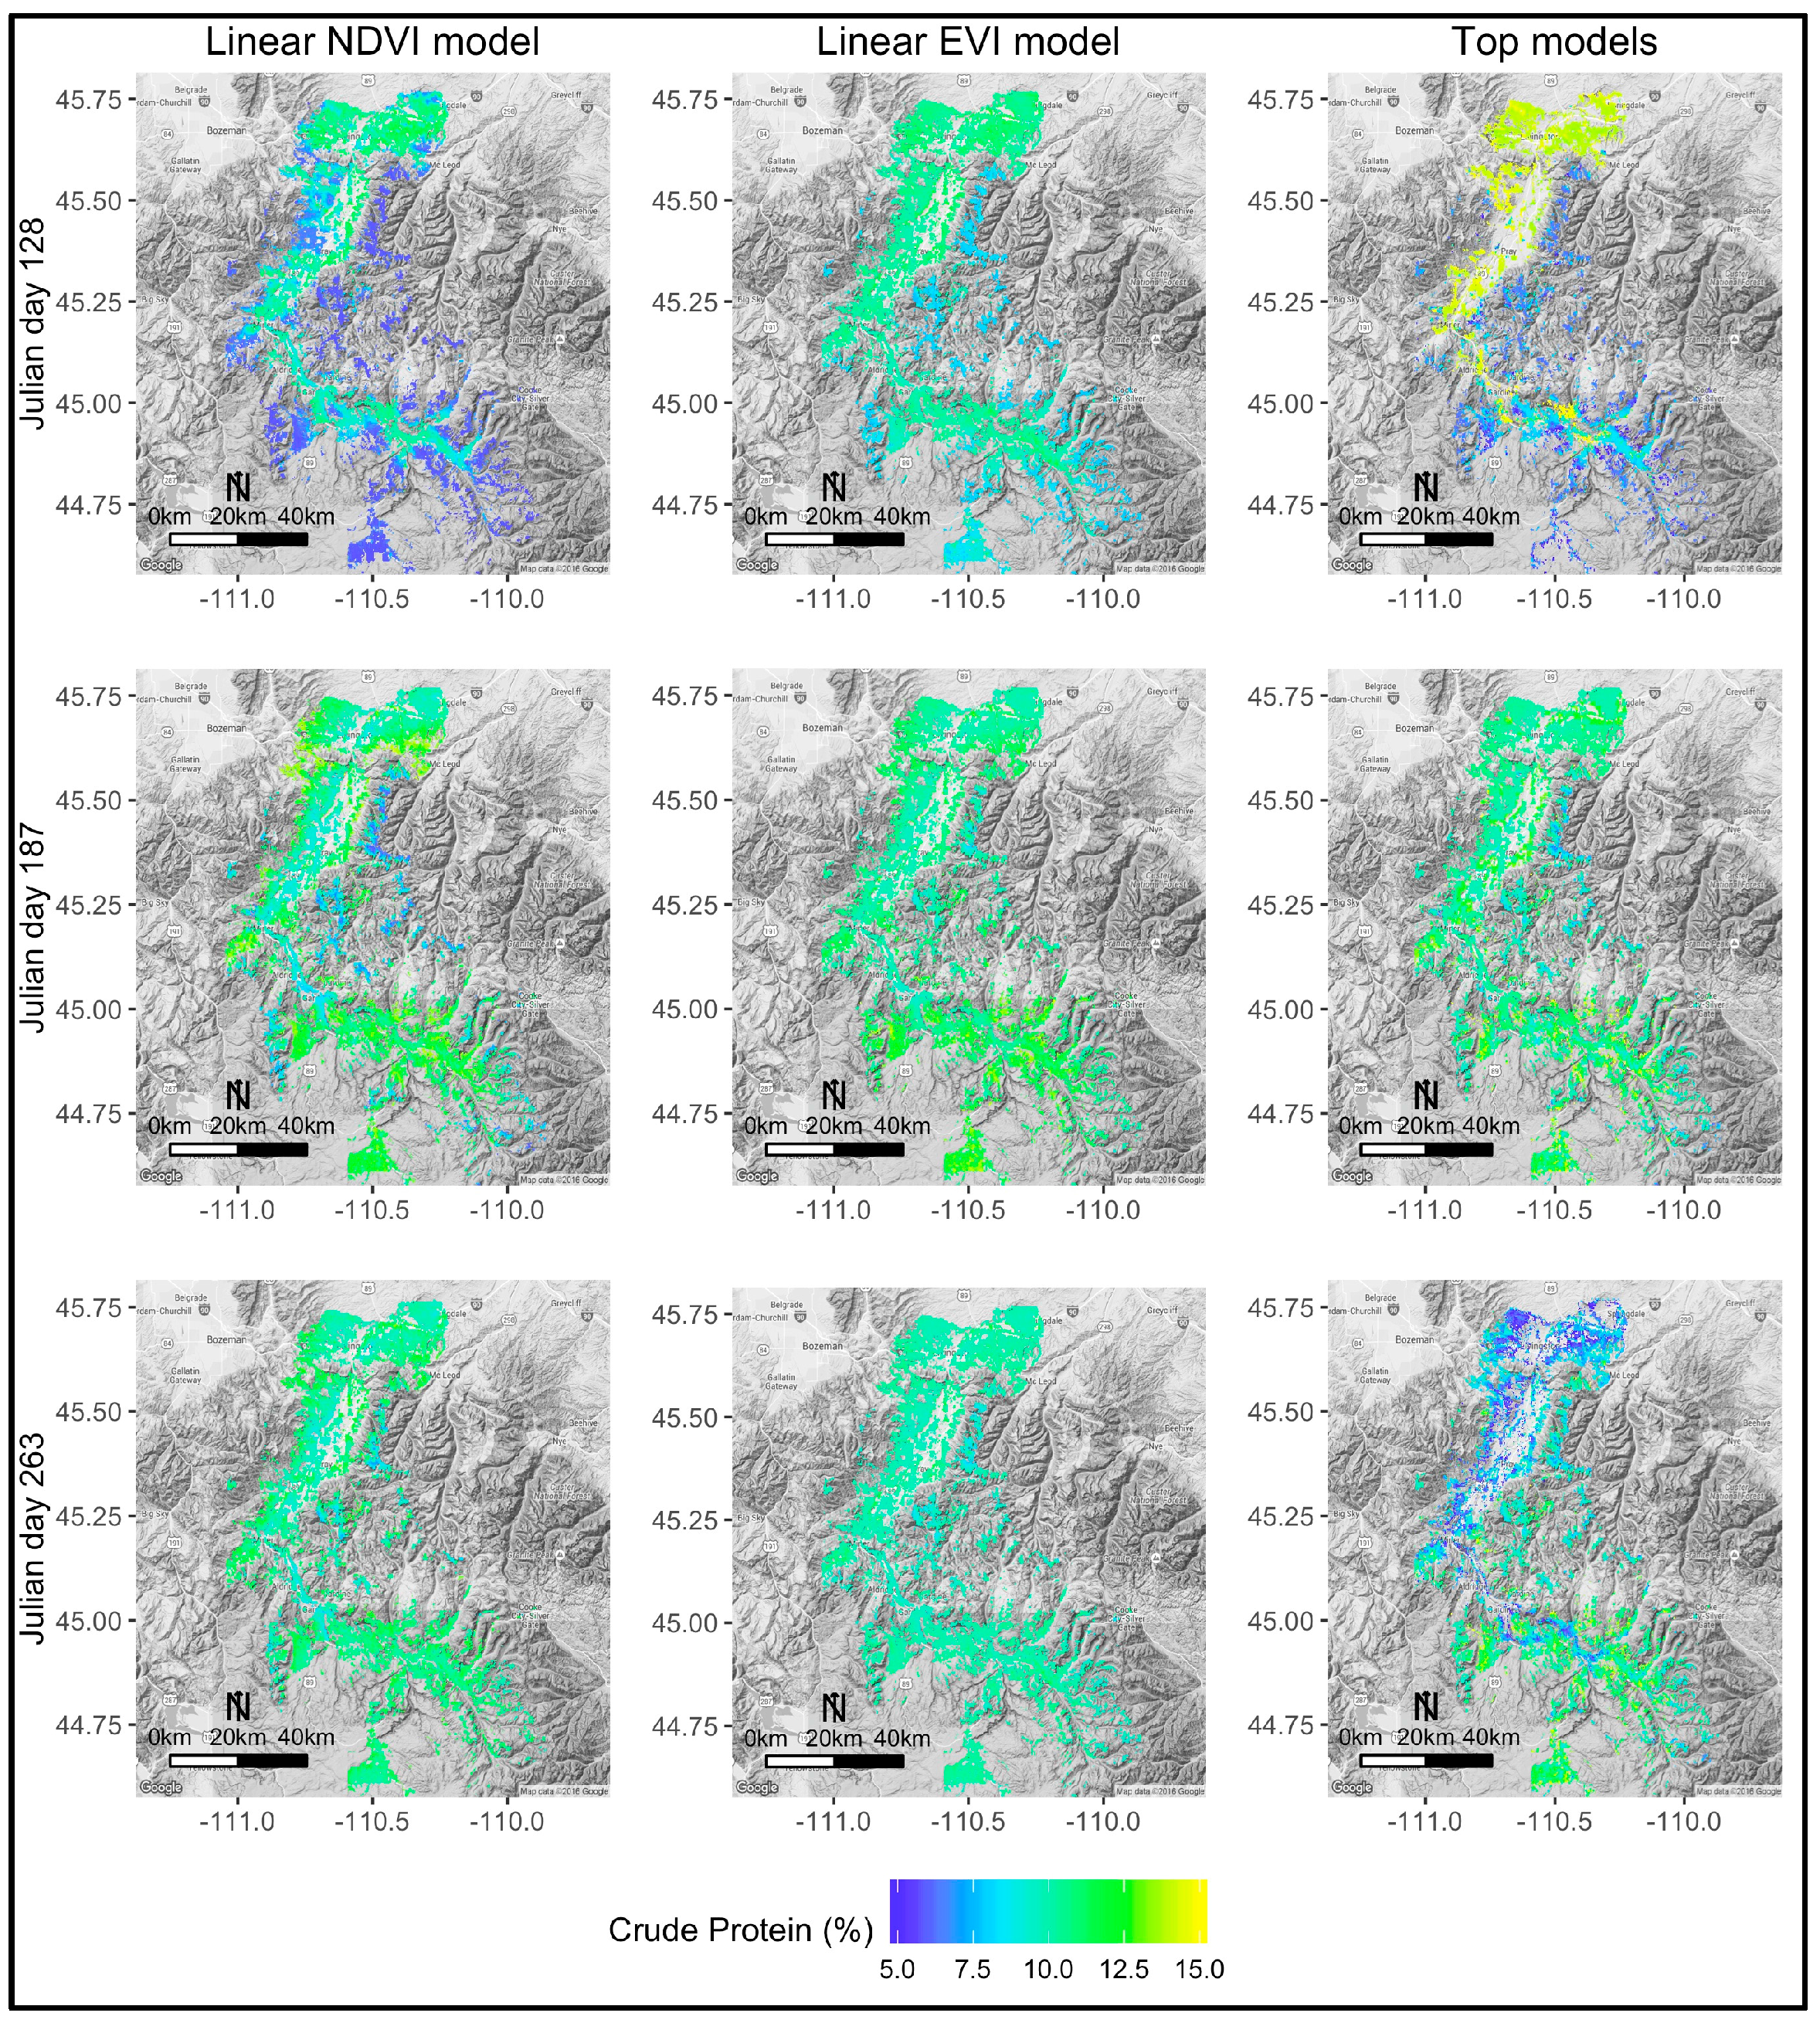
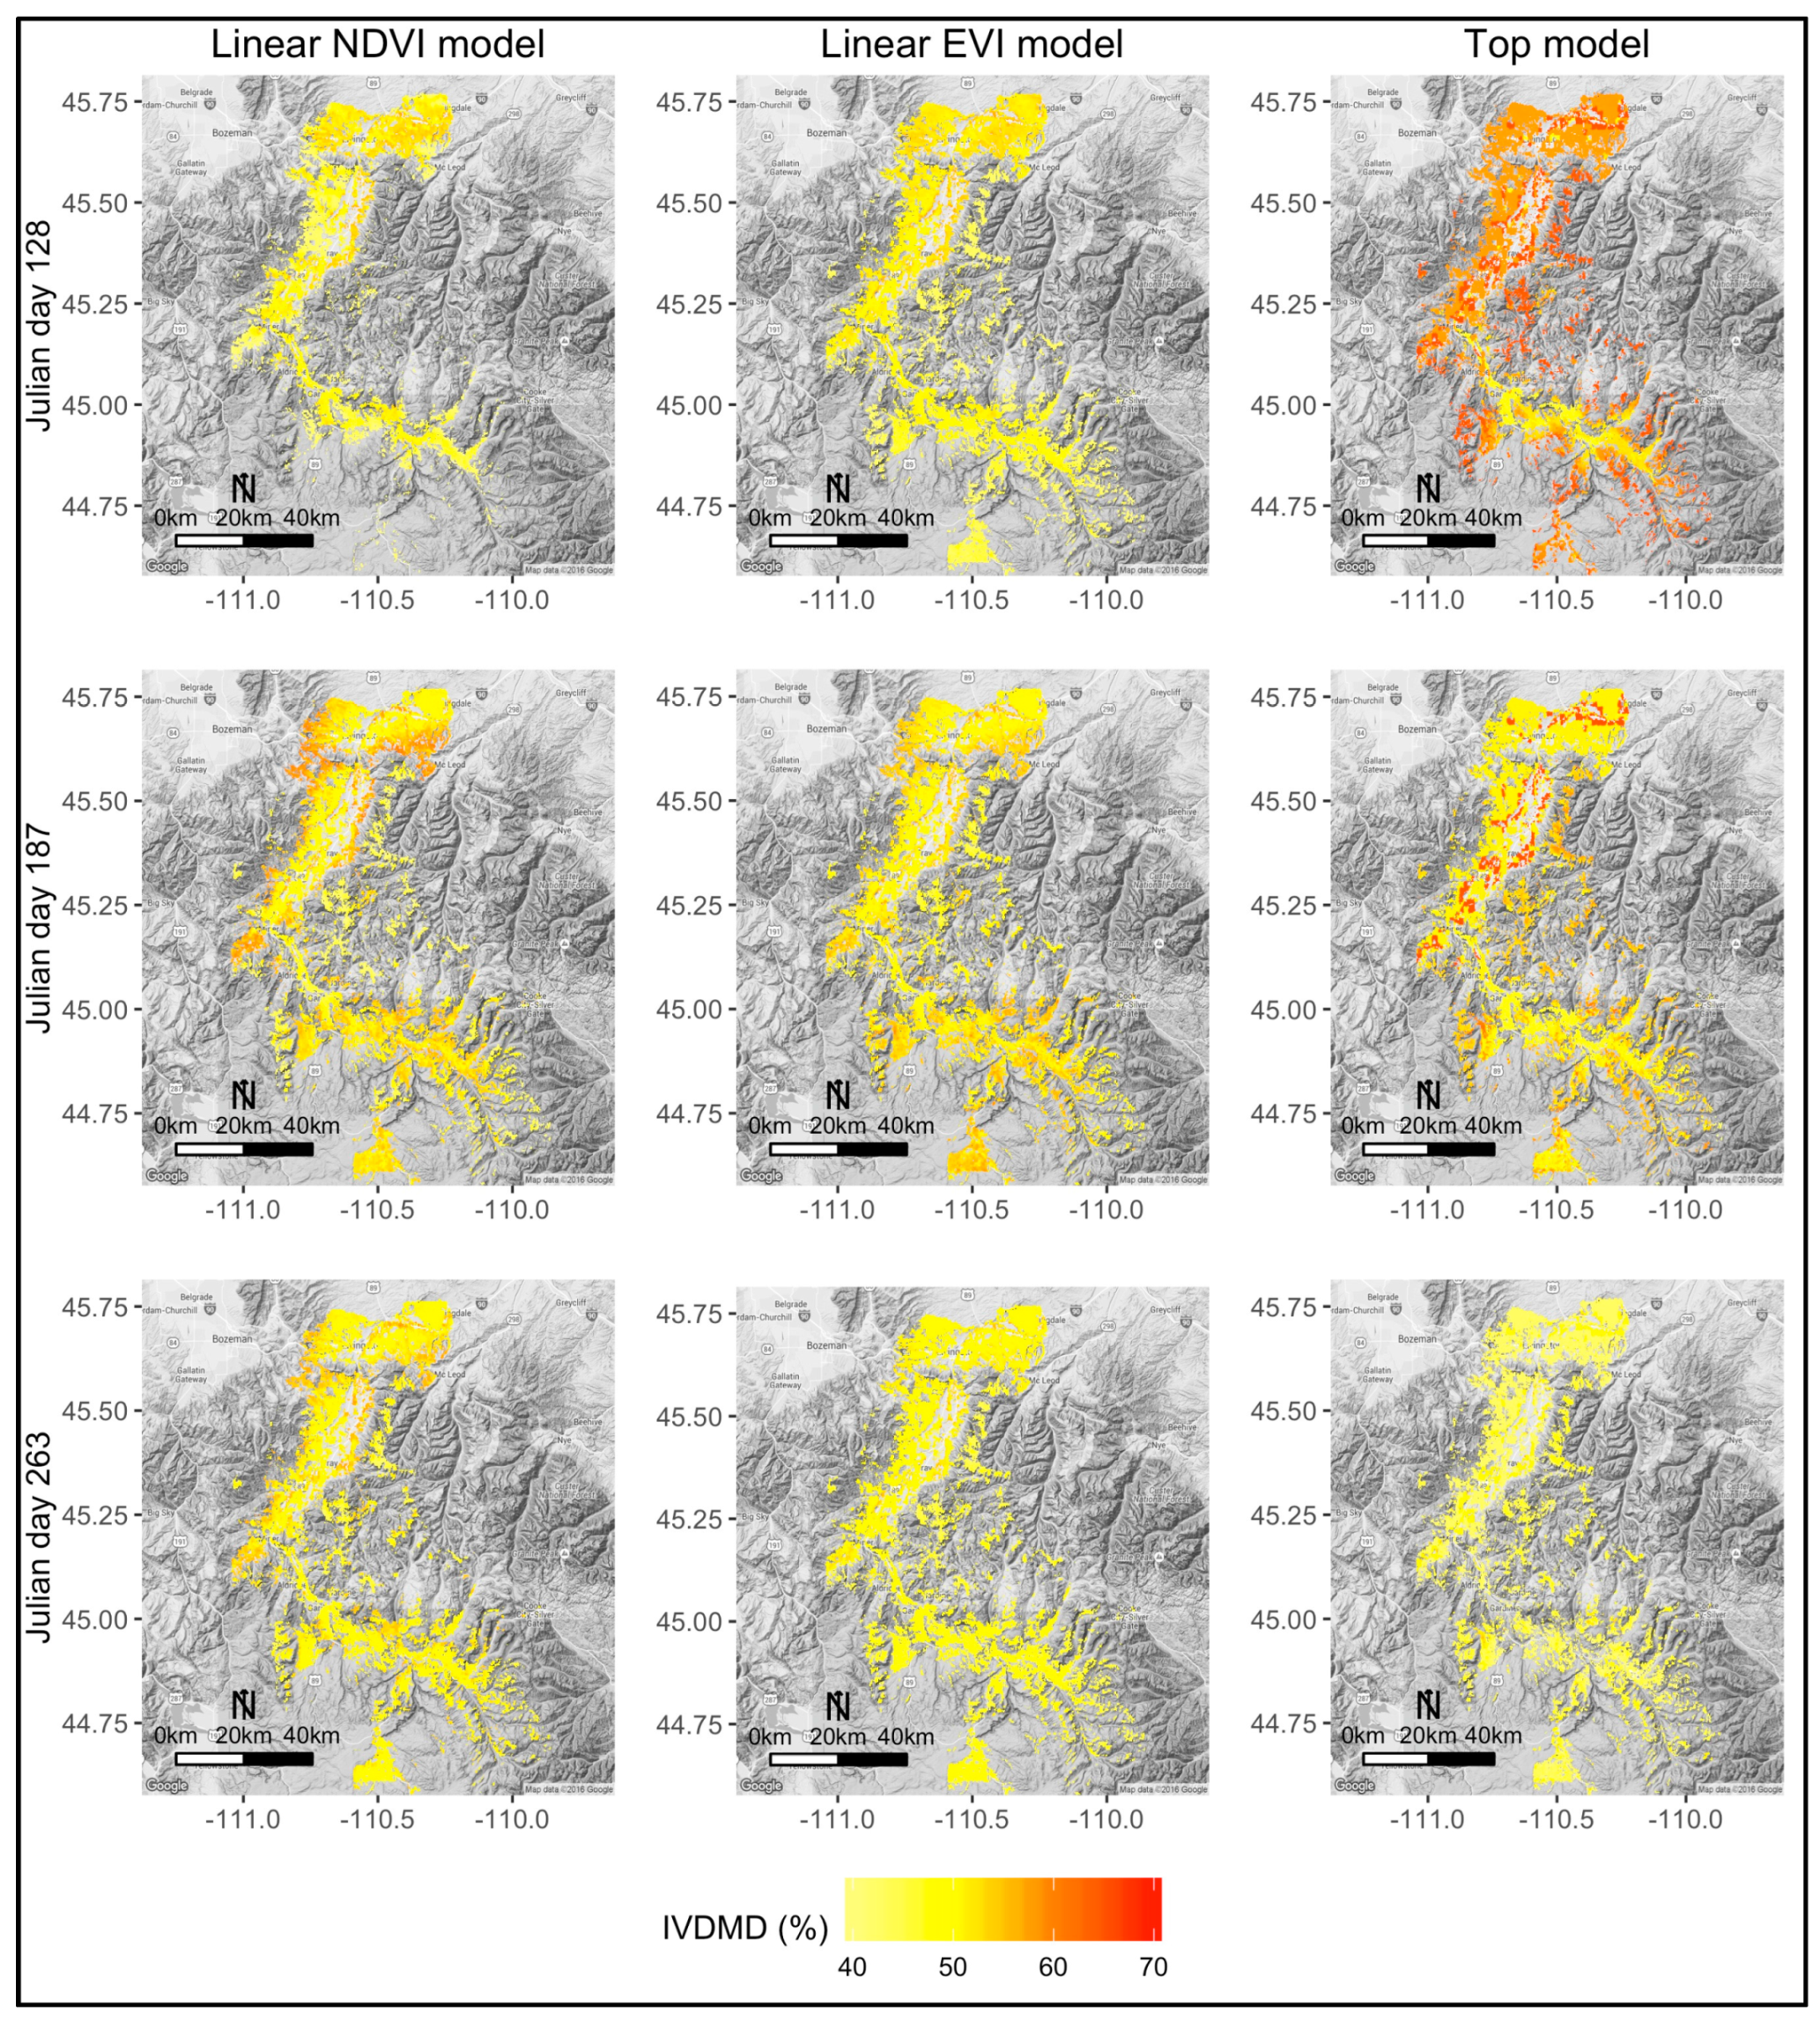
The top models showed greater spatiotemporal heterogeneity in forage biomass and quality across the UYRB than the linear NDVI and EVI models (Figure 5, Figure 6, Figure 7 and Figure 8). Throughout the season, the top models estimated that biomass was up to 46.8 ± 1.4 g/m2 greater in the high-elevation grasslands and 71.2 ± 0.8 g/m2 greater in irrigated agriculture than the linear NDVI and EVI models (p < 0.001). Early in the season, the top models estimated that chlorophyll was 0.12 ± 0.01 greater, crude protein was 3.1% ± 0.02% greater, and IVDMD was 12.6% ± 0.03% greater across the UYRB compared to the linear NDVI and EVI models. Late in the season, however, the top models estimated that chlorophyll was 0.14 ± 0.01 lower, crude protein was 1.7% ± 0.1% lower, and IVDMD was 5.1% ± 0.3% lower across the UYRB than the linear NDVI and EVI models.
The top models projected that grassland biomass and quality varied across the elevation-related phenology and land use gradients throughout the sampling period (Figure 5, Figure 6, Figure 7 and Figure 8). Across the elevation-related phenology gradient, biomass ranged from 50.6 ± 0.1–6.3 ± 0.6 g/m2 early in the season, 53.1 ± 36.1–82.4 ± 18.4 g/m2 mid-season, and 53.8 ± 16.2–86.1 ± 33.6 g/m2 late in the season (p < 0.01). Chlorophyll varied from 0.54 ± 0.14–0.49 ± 0.21 across the elevation gradient early in the season, was an average of 0.46 ± 0.31 across the UYRB mid-season, and was an average of 0.28 ± 0.11 across the landscape late in the season (p < 0.01). Crude protein ranged from 14.5% ± 0.7%–7.3% ± 0.9% across the elevation gradient early in the season, was an average of 11.1% ± 2.4% across the UYRB mid-season, and varied from 5.6% ± 1.6%–10.8% ± 2.1% from low to high elevations late in the season (p < 0.01). IVDMD ranged from 52.9% ± 0.1%–63.5% ± 1.6% early in the season, from 50.8% ± 0.1%–54.5% ± 2.1% mid-season, and from 38.6% ± 0.1%–47.1% ± 2.1% late in the season across the elevation gradient (p < 0.01). At their seasonal peak, high-elevation grasslands with late onset of growth had up to 45.7 ± 5.3 g/m2 greater biomass, 0.2% ± 0.1% greater crude protein, and 7.4% ± 0.1% greater IVDMD than grasslands that started growth early and mid-season. Irrigated agriculture, however, had up to 102.3 ± 0.4 g/m2 greater biomass, 2.4% ± 0.1% greater crude protein, and 11.2% ± 0.1% greater IVDMD than all other grasslands throughout the season (p < 0.01).

5.4. Spatiotemporal Variation in the Abundance of High Quality Forage for Elk

The top models projected that crude protein and IVDMD were above the minimum quality threshold required by elk [38] in the low-elevation grasslands early in the season, across most of the grasslands in the UYRB mid-season, and in small grassland patches in high elevations late in the season (Figure 9). The abundance of this high quality forage for elk varied across the elevation-related phenology and land use gradients in the UYRB throughout the season. Early in the season, the abundance of high quality forage ranged from 41.2 ± 27.6–18.1 ± 29.4 g/m2 from low to high elevations, and was 54.8 ± 42.7 g/m2 in irrigated agriculture. Mid-season, the abundance of high quality forage varied from 45.4 ± 23.6–75.9 ± 16.5 g/m2 across the elevation gradient, but was 134.8 ± 20.7 g/m2 in irrigated agriculture. Late in the season, the abundance of high quality forage ranged from 50.9 ± 21.1–85.8 ± 32.6 g/m2 from low to high elevations, and was 144.6 ± 14.6 g/m2 in irrigated agriculture. At their seasonal peak, the abundance of high quality forage for elk was up to 22.6 ± 2.6 g/m2 greater in high-elevation grasslands with late onset of growth than in grasslands that started growth early and mid-season, but was 78.6 ± 5.1 g/m2 greater in irrigated agriculture than in all other grasslands in the UYRB.

6. Discussion

6.1. NDVI and EVI Explained Minimal Variation in Forage Biomass and Quality

Linear NDVI and EVI models explained half of the variation in grassland biomass, but minimal variation in chlorophyll, crude protein, and IVDMD across the UYRB throughout the summer growing season. We speculate that this was due to the difference in the scale of site versus satellite estimates, the contamination of NDVI/EVI from exposed soil, variable terrain, heterogeneous vegetation structure, and senescent biomass across the UYRB [1,5,24,36]. For biomass, we expect that this relatively low explained variation was because these models did not account for the curvilinear relationship between NDVI and biomass in dense vegetation [31]. For forage quality, this poor performance may suggest that NDVI and EVI are only correlated with the quality of forage early in the season or are related to the quantity of high quality forage rather than the quality of forage [34,36]. Previous studies, although conducted at smaller spatial scales, have similarly found that NDVI explained 18%–41% of the variation in biomass and 1% of the variation in crude protein in grasslands across Montana [33,34]. This poor performance for chlorophyll is surprising since NDVI and EVI are thought to be strongly related to the absorption of red wavelengths by photosynthetic pigments (e.g., chlorophyll) [5], and indicates that this relationship is not strong throughout the season. Overall, these results indicate that NDVI and EVI are adequate proxies for seasonal variation in biomass, but that caution should be used when using NDVI and EVI as proxies for forage quality across the UYRB.
The predictive accuracy of the linear NDVI and EVI models was lower in grasslands that started growth late in the season than in grasslands that started growth early and mid-season, lower in irrigated agriculture than in private and public grasslands, and lower after the peak in biomass than before. The low accuracy in grasslands with late onset of growth was likely due to the increased contamination from moisture (due to the increased precipitation in high elevations [47]) and the variable terrain in these high-elevation grasslands and was because the models did not account for the curvilinear relationship between NDVI and biomass in these grasslands’ dense biomass [37,58]. The low accuracy in irrigated agriculture was likely due to moisture contamination from irrigation and because the models did not account for the curvilinear relationship between NDVI and biomass in the dense crops [5,27,29]. Finally, the low accuracy after the peak in biomass was likely due to contamination from senescent biomass, soil exposure, and exposed heterogeneous terrain late in the season [28]. While previous studies have similarly shown that the relationship between NDVI and biomass was influenced by variable terrain [27,37], moisture contamination in wet climates and seasons [3], and senescent biomass at the end of the season [28], this study is one of the first to provide a comprehensive understanding of how the accuracy of both NDVI and EVI as proxies for forage biomass and quality varied across the GYE throughout the growing season. Understanding how the accuracy of NDVI and EVI differs spatiotemporally across the landscape, therefore, is necessary when mapping forage patterns available to herbivores.
Linear NDVI models explained more variation in forage biomass and quality than the linear EVI models across the UYRB. This is likely because the adjustment factors made EVI more sensitive to terrain effects than NDVI across the topography gradients in the UYRB [20,37]. Previous studies have similarly shown that NDVI outperformed EVI as a proxy for biomass and quality in the Sonoran Desert [37] and Mongolia [36]. These results indicate that resilience to variable terrain may be more important than accounting for soil and atmospheric contamination when using indices to map spatiotemporal patterns of forage biomass and quality.

6.2. Polynomial NDVI and Date Effects Improved Models of Biomass and Quality

Models including polynomial NDVI, season, and random pixel effects explained substantially more variation in forage biomass and quality across the UYRB than the linear NDVI and EVI models. Models containing a polynomial NDVI effect explained up to 55% more variation in biomass than the linear NDVI and EVI models. As previously documented [23,24,31], this improved performance is likely because these models accounted for the curvilinear relationship between NDVI and biomass. Specifically, this curvilinear relationship is because NDVI represents the greenness of the two-dimensional structure of vegetation rather than the biomass of forage [23,24,31]. For forage quality, models including a linear season effect explained up to 50% more variation in forage quality than the linear NDVI and EVI models. This improved performance is likely because the date effect accounted for the seasonal decline in forage quality unaccounted for by NDVI and EVI, possibly due to contamination from senescent biomass or the weak relationship between NDVI/EVI and forage quality late in the season [28]. Finally, the improved performance of models with a random effect for pixel indicates that there was local variation in forage biomass and quality, driven by local variation in biophysical properties, that was unaccounted for by NDVI and EVI [55]. Previous studies have similarly found that accounting for curvilinear relationships, site, and seasonal differences improved the performance of NDVI models across heterogeneous landscapes [3,24,31,33]. While we recognize that it is often not feasible to account for season and site differences when using vegetation indices in the absence of field data, these results suggest that it is important to consider the limitations of NDVI and EVI when mapping forage patterns for elk across the UYRB. Specifically, we suggest that: (1) consideration should be given to error imposed from differences in site versus satellite estimates, (2) polynomial NDVI functions may improve estimates of forage biomass; (3) NDVI and EVI should not be used as proxies for seasonal variation in forage quality; and (4) that consideration should be given to the unaccounted for local variation in biomass and quality when using NDVI and EVI across the UYRB.
Models that accounted for the curvilinear relationship between NDVI and biomass, the seasonal decline in forage quality, and local variation in pixels showed greater spatiotemporal heterogeneity in forage biomass and quality across the UYRB than the linear NDVI and EVI models. By accounting for the curvilinear relationship between NDVI and biomass, the top models estimated that biomass was greater in high-elevation grasslands and irrigated agriculture than the linear NDVI and EVI models. By accounting for a seasonal decline in forage quality, the top models projected that forage quality was greater across the UYRB early in the season and lower across the UYRB late in the season than the linear NDVI and EVI models. These results suggest that linear NDVI and EVI models may underestimate biomass in high-elevation grasslands and irrigated agriculture, may underestimate forage quality early in the season, and may overestimate forage quality late in the season.
Given that even small differences in the quality of forage have been shown to impact the fitness of elk [38], variation in the accuracy of NDVI and EVI across the UYRB and between models may have important implications for elk. Cook et al. [38] found that when forage was near the quality thresholds required by elk (crude protein > 8.2% and digestibility > 56.3%), a 0.5% decline in crude protein and a 5% decline in digestibility had a negative impact on the summer weight gain of lactating elk. Because crude protein and IVDMD were close to these levels late in the season, variation in the accuracy of NDVI and EVI across the landscape may influence whether these grasslands are projected to have adequate or inadequate quality for elk. Consideration for how the accuracy of NDVI and EVI models varies across the landscape and between models is necessary, therefore, when mapping forage patterns available to migratory elk.

6.3. Spatiotemporal Variation in Grassland Biomass and Quality Across the UYRB

As previously documented [11,47], the top models projected that grassland biomass and quality varied across the elevation-related phenology gradients in the UYRB throughout the growing season. Biomass increased from low to high elevations following the timing of growth and then declined throughout the season. Forage quality peaked early in the season and then declined across the UYRB. At their seasonal peak, high-elevation grasslands with late onset of growth had up to 50% more biomass, 5% greater crude protein, and 20% greater IVDMD than grasslands that started growth early and mid-season. This was likely due to the high moisture and nutrient content of soils, the cooler temperatures, the increased precipitation, and the greater forb cover in these high-elevation grasslands [51,58,59,60,61]. Specifically, we expect that the nitrogen deposition and high soil moisture from prolonged snow cover and the increased nutrient and moisture content of andesitic soils increased the productivity and nitrogen content of grasslands in these high elevations [58,61,62,63]. Because snow collects atmospheric nitrogen as it falls, we expect that the greater quantity of snow and the prolonged snowmelt in high elevations likely resulted in a slow-release of nitrogen into the soils throughout the spring [58]. In addition, the reduced evapotranspiration and increased precipitation in high elevations likely increased the photosynthetic rates and nitrogen content of vegetation [63]. Finally, because forbs have inherently higher crude protein and digestibility than grasses and shrubs [42], we expect that the greater forb cover observed in high elevations likely contributed to the greater magnitude of forage quality in these high-elevation grasslands [51]. These results are consistent with the NDVI analyses from Piekielek [47] and Thein et al. [11] showing high primary productivity in the high-elevation grasslands of the GYE. They are also consistent with previous studies showing that crude protein and digestibility increased across elevation gradients in Norway [64] and in the Canadian Rockies [65]. While previous studies have shown that the biomass and quality of forage varies across elevation-related phenology gradients, this study is one of the first to document that the magnitude of biomass and quality differs across these gradients throughout the season.
These results suggest that there is a co-variation between the timing of growth and the magnitude of grassland biomass and quality in the UYRB (i.e., grasslands that started growth late in the season had a greater seasonal magnitude in biomass and quality than grasslands that started growth earlier in the season). This would indicate that the same biophysical factors that drive the timing that grasslands start their growth (e.g., snow cover, temperature, precipitation) also dictate the seasonal magnitude of biomass and quality [66]. Among these biophysical factors, we speculate that prolonged snow cover is primarily responsible for this co-variation because it delays the timing of growth and promotes forage biomass and quality by increasing the nitrogen content of soils and protecting grasses from early season freeze events [66,67]. Duparc et al. [66] similarly found that more productive grasslands reached their peak in forage later in the season than less productive grasslands in the French Alps. Albon and Langvatn [64] also found that forage quality varied along an elevation gradient throughout the season in Norway.
The top models projected that irrigated agriculture had up to 200% greater biomass and up to 5%–10% greater forage quality than all other grasslands in the UYRB throughout the growing season. The greater magnitude of biomass was likely due to the high nutrient and moisture content of soils from irrigation and fertilization and was due to the inherently greater biomass of crop species [47,68]. The greater forage quality was a likely due to the prolonged growth from irrigation and the surge in forage quality after the seasonal harvest [47]. Previous studies have similarly documented that irrigated agriculture had a prolonged period of growth and greater productivity than non-irrigated grasslands [47,65,68,69].

6.4. Spatiotemporal Variation in the Abundance of High Quality Forage for Elk

Forage with adequate crude protein and IVDMD to promote the summer weight gain of elk [38] was available across the low-elevation grasslands early in the season, across most of the landscape mid-season, and in small grassland patches in high elevations late in the season in the UYRB. The abundance of forage of adequate quality for elk varied across this elevation-related phenology gradient throughout the season. While previous studies have documented that high quality forage varies along the phenology gradient in the GYE [11], this study is one of the first to provide quantitative evidence that forage with adequate levels of crude protein and IVDMD for elk is available along this phenology gradient throughout the season. These results indicate that the availability of high quality forage for elk is limited to small patches in high elevations late in the season [16].
At their seasonal peak, high-elevation grasslands with late onset of growth had up to 50% more forage with adequate quality for elk than grasslands that started growth early and mid-season. This is likely due to the increased nitrogen and moisture content of soils and the reduced evapotranspiration rates in these high-elevation grasslands [11,51,61,70]. These results may indicate that high-elevation grasslands with late onset of growth provide the bulk of the energy and nutrients for elk in the critical foraging period late in the season [16,17,71]. Mysterud et al. [72] similarly found that access to forage across an elevation gradient was responsible for the increased weight gain of migratory ungulates in Norway. Furthermore, these results may provide evidence that migratory elk “jump” rather than “ride” the green wave of phenology in order to increase their access to abundant high quality forage in high-elevation grasslands [73]. In the context of climate change, these results may suggest that potential shifts in the timing of growth in the high-elevation grasslands may have profound impacts on the fitness of migratory elk in the UYRB [16]. Future research is needed, therefore, to assess the role of this abundant high quality forage in high-elevation grasslands on the fitness and movement of migratory elk in the UYRB.
Irrigated agriculture had up to 200% more forage of adequate quality for elk than all other grasslands in the UYRB throughout the growing season. These results may suggest that residential elk foraging on irrigated agriculture may have access to a greater abundance of high quality forage throughout the season than migratory elk following the elevation-related phenology gradient in the UYRB, which may alter the benefits of residential versus migratory behavior for elk [45,74]. More information is needed on the quantity of high quality forage required by elk throughout the season, however, before we can understand the role of irrigated agriculture on the benefits of migratory versus residential strategies for elk in the UYRB. In the context of land use change [46], these results may indicate that a projected decline in irrigated agriculture across the GYE could reduce the abundance of forage available to elk in low elevations. Future research should use these results to assess the role of irrigated agriculture on the movement and fitness of elk.

6.5. Limitations

These results should be considered with the limitations of this study in mind. Because the aim of this study was to assess the utility of NDVI and EVI as proxies for grassland biomass and quality across the UYRB, we did not directly control or assess which factors (e.g., senescent biomass, soil exposure, topography, etc.) affected the accuracy of these models [5,22]. Future research is needed, therefore, to identify the specific factors that influenced the accuracy of these models across the UYRB. Moreover, because this study was only conducted from April to September, future research is needed to determine how the accuracy of these models differs throughout the entire growing season from March to October. Although the pixel selection methods were intended to reduce the effects of mixed pixel issues, we expect that the presence of other land use types (e.g., forest, bare ground) in the pixels may have influenced the accuracy of the NDVI and EVI models. In addition, while landscape-scale forage patterns are known to influence the fitness and movement of elk [19], it is important to consider that elk fitness is also influenced by forage selection at the plant and community scale and by predation, winter severity, hunting pressure, and the mineral and tannin content of forage [17,43,75]. Finally, more research is needed to determine if these results are consistent across the GYE and other temperate landscapes. Overall, these methods provided simple and interpretable information on the utility of NDVI and EVI for mapping the forage patterns available to elk. The limitations of these methods were that they relied upon the accuracy of the field data, they did not provide information on the specific factors that influenced these indices, and they were not intended to identify the best predictive models of biomass and quality.

7. Conclusions

Remote sensing NDVI and EVI are widely used in ecological research and management as proxies for the biomass and quality of forage available to herbivores. In this study, we examined how the accuracy of using MODIS-derived NDVI and EVI as proxies for forage biomass and quality differed across elevation-related phenology and land use gradients, determined if accounting for curvilinear relationships, site differences, and season improved NDVI and EVI models, and then mapped spatiotemporal variation in the abundance of high quality forage for elk across the Upper Yellowstone River Basin (UYRB) of the Greater Yellowstone Ecosystem. The novel results from this study were that:
(1)
Linear NDVI and EVI models explained half of the variation in grassland biomass (R2 = 0.42–0.53), but minimal variation in chlorophyll (R2 = 0.03–0.04), crude protein (R2 = 0.09–0.14), and digestibility (R2 = 0.11–0.18) across the UYRB. The accuracy of these models was lowest in grasslands with late onset of growth due to contamination from variable terrain, in irrigated agriculture due to moisture contamination, and late in the season due to contamination from senescent vegetation. NDVI-based models explained more variation in forage biomass and quality than EVI-based models, potentially because of the sensitivity of EVI to heterogeneous terrain. Caution should be used, therefore, when using NDVI and EVI as proxies for forage biomass and quality in the UYRB.
(2)
Models that accounted for the curvilinear relationship between NDVI and biomass, the seasonal decline in forage quality, and local variation between pixels explained 19%–55% more variation in biomass and 14%–69% more variation in forage quality than the linear NDVI and EVI models. These models projected greater spatiotemporal heterogeneity in forage biomass and quality across the landscape compared to the linear NDVI and EVI models. Understanding the limitations of NDVI and EVI is necessary, therefore, when using these indices to map the patterns of forage available to elk across the UYRB.
(3)
Forage biomass and quality varied along the elevation-related phenology gradient, but remained consistently high in irrigated agriculture throughout the growing season. At their seasonal peak, the abundance of forage of adequate quality for elk was up to 50% greater in grasslands with late onset of growth and up to 200% greater in irrigated agriculture than in all other grasslands throughout the growing season. These results may indicate that high-elevation grasslands and irrigated agriculture may play an especially important role in the movement and fitness of elk in the UYRB.
While previous studies have documented the limitations of using NDVI and EVI as proxies for vegetation biomass and quality, this study provides novel information for researchers and managers on the reliability and biological significance of using these indices to map spatiotemporal variation in the forage available to herbivores.

Acknowledgments

We thank the University of Wyoming-National Park Service Research Center, the Montana NSF EPSCoR, and the Montana Academy of Sciences for their support. We thank Scott Creel, Jim Robison-Cox, Nathan Piekielek, Mark Greenwood, Tony Chang, Kathryn Ireland, and Thad Weaver for their valuable input and feedback. We thank P.J. White, Roy Renkin, Dan Stahler, Christie Hendrix, and Stacey Gunther from Yellowstone National Park and Karen Loveless and Kelley Proffitt from Montana FWP for their advice and logistical support. Thank you to Michel Kohl and Dan MacNulty from Utah State University and Montana FWP for access to their elk GPS collar data. We also thank Phil Merta and David McGuire for their help with forage quality analyses. This study would not have been possible without the assistance from John Linsley, Jakob Woodland, Birch Malotky, Janel Schietzelt, Russell Spann, John Landsiedel, and numerous citizen science volunteers. Finally, we would like to thank the landowners of the Paradise Valley for their hospitality and dedication to the conservation of the GYE.

Author Contributions

Erica L. Garroutte implemented the study and wrote the manuscript. Andy J. Hansen and Rick L. Lawrence assisted with the design of the study, the analysis, and provided feedback on the manuscript.

Conflicts of Interest

The authors declare no conflict of interest.

Appendix

Table A1. Mixed effect models compared to select the top models of biomass, chlorophyll, crude protein and IVDMD. Model selection was done separately for all SOS classes (in public grassland land use) and for all land use classes (in early SOS class).
Model DescriptionVariable Combinations 1
Linear NDVI/EVI only NDVI/EVI + random (pixel)
Linear NDVI/EVI with SOS/LU NDVI/EVI + SOS/LU + random (pixel)
Linear NDVI/EVI with Date NDVI/EVI + Date + random (pixel)
Linear NDVI/EVI with SOS/LU and DateNDVI/EVI+SOS/LU + Date + random (pixel)
Linear NDVI/EVI with NDVI/EVI*SOS/LU interactionNDVI/EVI*SOS/LU + random (pixel)
Linear NDVI/EVI with NDVI/EVI*Date interactionNDVI/EVI*Date + random (pixel)
Linear NDVI/EVI with NDVI/EVI*SOS/LU interaction and DateNDVI/EVI*SOS/LU + Date + random (pixel)
Linear NDVI/EVI with NDVI/EVI*Date interaction and SOS/LUNDVI/EVI*Date + SOS/LU + random (pixel)
Models 1–8 with quadratic NDVI/EVI effectNDVI/EVI2 + “ ”
Models 1–8 with cubic NDVI/EVI effectNDVI/EVI3 + “ “
Models 1–8 with basis spline NDVI/EVI effectbs(NDVI/EVI, df = 5) + “ “
All previous models with variance structure “ ” + varIdent (SOS/LU)
All previous models with temporal autocorrelation“ ” + corAR1 (Date)
All previous models with spatial autocorrelation“ ” + corExp (Site)
All previous models with variance structure and temporal autocorrelation“ ” + varIdent (SOS/LU) + corAR1 (Date)
All previous models with variance structure and spatial autocorrelation“ ” +varIdent(SOS/LU) + corExp (Site)
1 Variables included NDVI and EVI, start of season (SOS) class or land use (LU) class, and date (Julian day). VarIdent accounted for different variance in each class, corAR1 represented a temporal autocorrelation structure, and corExp represented a spatial autocorrelation structure.

References

  1. Myneni, R.B.; Hall, F.G.; Sellers, P.J.; Marshak, A.L. Interpretation of spectral vegetation indexes. IEEE Trans. Geosci. Remote Sens. 1995, 33, 481–486. [Google Scholar] [CrossRef]
  2. Hamel, S.; Garel, M.; Festa-Bianchet, M.; Gaillard, J.M.; Côté, S.D. Spring Normalized Difference Vegetation Index (NDVI) predicts annual variation in timing of peak faecal crude protein in mountain ungulates. J. Appl. Ecol. 2009, 46, 582–589. [Google Scholar] [CrossRef]
  3. Pettorelli, N.; Ryan, S.; Mueller, T.; Bunnefeld, N.; Jedrzejewska, B.; Lima, M.; Kausrud, K. The Normalized Difference Vegetation Index (NDVI): Unforeseen successes in animal ecology. Clim. Res. 2011, 46, 15–27. [Google Scholar] [CrossRef]
  4. Kerr, J.T.; Ostrovsky, M. From space to species: Ecological applications for remote sensing. Trends Ecol. Evol. 2003, 18, 299–305. [Google Scholar] [CrossRef]
  5. Huete, A.; Didan, K.; Miura, T.; Rodriguez, E.P.; Gao, X.; Ferreira, L.G. Overview of the radiometric and biophysical performance of the MODIS vegetation indices. Remote Sens. Environ. 2002, 83, 195–213. [Google Scholar] [CrossRef]
  6. Jiang, Z.; Huete, A.R.; Didan, K.; Miura, T. Development of a two-band enhanced vegetation index without a blue band. Remote Sens. Environ. 2008, 112, 3833–3845. [Google Scholar] [CrossRef]
  7. Tucker, C.; Vanpraet, C.; Boerwinkel, E.; Gaston, A. Satellite remote sensing of total dry matter production in the Senegalese Sahel. Remote Sens. Environ. 1983, 13, 461–474. [Google Scholar] [CrossRef]
  8. Christianson, D.; Creel, S. Fecal chlorophyll describes the link between primary production and consumption in a terrestrial herbivore. Ecol. Appl. 2009, 19, 1323–1335. [Google Scholar] [CrossRef] [PubMed]
  9. Jones, C.L.; Weckler, P.R.; Maness, N.O.; Jayasekara, R.; Stone, M.L.; Chrz, D. Remote sensing to estimate chlorophyll concentration in spinach using multi-spectral plant reflectance. Am. Soc. Agric. Biol. Eng. 2007, 50, 2267–2273. [Google Scholar]
  10. Paruelo, J.M.; Epstein, H.E.; Lauenroth, W.K.; Burke, I.C. ANPP estimates from NDVI for the central grassland region of the United States. Ecology 1997, 78, 953–958. [Google Scholar] [CrossRef]
  11. Thein, T.R.; Watson, F.G.R.; Cornish, S.S.; Anderson, T.N.; Newman, W.B.; Lockwood, R.E. Chapter 7 Vegetation Dynamics of Yellowstone’s Grazing System. Terr. Ecol. 2008, 3, 113–133. [Google Scholar]
  12. Lendrum, P.E.; Anderson, C.R.; Monteith, K.L.; Jenks, J.A.; Bowyer, R.T. Relating the movement of a rapidly migrating ungulate to spatiotemporal patterns of forage quality. Mamm. Biol. 2014, 79, 369–375. [Google Scholar] [CrossRef]
  13. Neumann, W.; Martinuzzi, S.; Estes, A.B.; Pidgeon, A.M.; Dettki, H.; Ericsson, G.; Radeloff, V.C. Opportunities for the application of advanced remotely-sensed data in ecological studies of terrestrial animal movement. Mov. Ecol. 2015, 3, 8. [Google Scholar] [CrossRef] [PubMed]
  14. Borowik, T.; Pettorelli, N.; Sönnichsen, L.; Jedrzejewska, B. Normalized difference vegetation index (NDVI) as a predictor of forage availability for ungulates in forest and field habitats. Eur. J. Wildl. Res. 2013, 59, 675–682. [Google Scholar] [CrossRef]
  15. Parmesan, C.; Parmesan, C.; Yohe, G.; Yohe, G. A globally coherent fingerprint of climate change impacts across natural systems. Nature 2003, 421, 37–42. [Google Scholar] [CrossRef] [PubMed]
  16. Middleton, A.D.; Kauffman, M.J.; Mcwhirter, D.E.; Cook, J.G.; Cook, R.C.; Nelson, A.A.; Jimenez, M.D.; Klaver, R.W. Animal migration amid shifting patterns of phenology and predation: Lessons from a Yellowstone elk herd. Ecology 2013, 94, 1245–1256. [Google Scholar] [CrossRef] [PubMed]
  17. Van Soest, P.J. Nutritional Ecology of the Ruminant, 2nd ed.; Cornstock Publishing Associates: Ithaca, NY, USA, 1982; pp. 40–290. [Google Scholar]
  18. Ryan, S.J.; Knechtel, C.U.; Getz, W.M. Range and habitat selection of African buffalo in South Africa. J. Wildl. Manag. 2006, 70, 764–776. [Google Scholar] [CrossRef]
  19. Hebblewhite, M.; Merrill, E.; McDermid, G. A multi-scale test of the forage maturation hypothesis in a partially migratory ungulate population. Ecol. Monogr. 2008, 78, 141–166. [Google Scholar] [CrossRef]
  20. Matsushita, B.; Yang, W.; Chen, J.; Onda, Y.; Qiu, G. Sensitivity of the Enhanced Vegetation Index (EVI) and Normalized Difference Vegetation Index (NDVI) to topographic effects: A case study in high-density cypress forest. Sensors 2007, 7, 2636–2651. [Google Scholar] [CrossRef]
  21. Gao, X.; Huete, A.R.; Ni, W.; Miura, T. Optical-biophysical relationships of vegetation spectra without background contamination. Remote Sens. Environ. 2000, 74, 609–620. [Google Scholar] [CrossRef]
  22. Huete, A.R.; Jackson, R.D.; Post, D.F. Spectral response of a plant canopy with different soil backgrounds. Remote Sens. Environ. 1985, 17, 37–53. [Google Scholar] [CrossRef]
  23. Tucker, C.J. Asymptotic nature of grass canopy spectral reflectance. Appl. Opt. 1977, 16, 1151–1156. [Google Scholar] [CrossRef] [PubMed]
  24. Lawrence, R.L.; Ripple, W.J. Comparisons among vegetation indices and bandwise regression in a highly disturbed, heterogeneous landscape: Mount St. Helens, Washington. Remote Sens. Environ. 1998, 64, 91–102. [Google Scholar] [CrossRef]
  25. Tanre, D.; Holben, B.N.; Kaufman, Y.J. Atmospheric correction algorithm for NOAA-AVHRR products: Theory and application. IEEE Trans. Geosci. Remote Sens. 1992, 30, 231–248. [Google Scholar] [CrossRef]
  26. Tucker, C.J. A critical review of remote sensing and other methods for non-destructive estimation of standing crop biomass. Grass Forage Sci. 1980, 35, 177–182. [Google Scholar] [CrossRef]
  27. Tittebrand, A.; Spank, U.; Bernhofer, C.H. Comparison of satellite and ground-based NDVI above different land-use types. Theor. Appl. Climatol. 2009, 98, 171–186. [Google Scholar] [CrossRef]
  28. Porter, T.F.; Chen, C.; Long, J.A.; Lawrence, R.L.; Sowell, B.F. Estimating biomass on CRP pastureland: A comparison of remote sensing techniques. Biomass Bioenergy 2014, 66, 268–274. [Google Scholar] [CrossRef]
  29. Guerschman, J.P.; Paruelo, J.M.; Burke, I.C. Land use impacts on the normalized difference vegetation index in temperate Argentina. Ecol. Appl. 2003, 13, 616–628. [Google Scholar] [CrossRef]
  30. Garonna, I.; Fazey, I.; Brown, M.E.; Pettorelli, N. Rapid primary productivity changes in one of the last coastal rainforests: the case of Kahua, Solomon Islands. Environ. Conserv. 2009, 36, 253–260. [Google Scholar] [CrossRef]
  31. Santin-Janin, H.; Garel, M.; Chapuis, J.L.; Pontier, D. Assessing the performance of NDVI as a proxy for plant biomass using non-linear models: A case study on the kerguelen archipelago. Polar Biol. 2009, 32, 861–871. [Google Scholar] [CrossRef]
  32. Gurung, R.B.; Breidt, F.J.; Dutin, A.; Ogle, S.M. Predicting Enhanced Vegetation Index (EVI) curves for ecosystem modeling applications. Remote Sens. Environ. 2009, 113, 2186–2193. [Google Scholar] [CrossRef]
  33. Maynard, C.; Lawrence, R.; Nielsen, G.; Decker, G. Modeling vegetation amount using bandwise regression and ecological site descriptions as an alternative to vegetation indices. GISci. Remote Sens. 2007, 44, 68–81. [Google Scholar] [CrossRef]
  34. Thoma, D.P.; Bailey, D.W.; Long, D.S.; Nielsen, G.A.; Henry, M.P.; Breneman, M.C.; Montagne, C. Short-term monitoring of rangeland forage conditions with AVHRR imagery. J. Range Manag. 2002, 55, 383–389. [Google Scholar] [CrossRef]
  35. Liu, H.Q.; Huete, A. A feedback based modification of the NDVI to minimize canopy background and atmospheric noise. IEEE Trans. Geosci. Remote Sens. 1995, 33, 457–465. [Google Scholar]
  36. Kawamura, K.; Akiyama, T.; Yokota, H.; Tsutsumi, M.; Yasuda, T.; Watanabe, O.; Wang, S. Comparing MODIS vegetation indices with AVHRR NDVI for monitoring the forage quantity and quality in Inner. Grassl. Sci. 2005, 51, 33–40. [Google Scholar] [CrossRef]
  37. Sesnie, S.E.; Dickson, B.G.; Rosenstock, S.S.; Rundall, J.M. A comparison of Landsat TM and MODIS vegetation indices for estimating forage phenology in desert bighorn sheep (Ovis canadensis nelsoni) habitat in the Sonoran Desert, USA. Int. J. Remote Sens. 2011, 33, 276–286. [Google Scholar] [CrossRef]
  38. Cook, J.; Johnson, B.; Cook, R.; Riggs, R.; Delcurto, T.; Bryant, L.; Irwin, L. Effects of summer-autumn nutrition and parturition date on reproduction and survival of elk. Wildl. Monogr. 2004, 155, 1–61. [Google Scholar]
  39. Fryxell, J.M. Forage quality and aggregation by large herbivores. Am. Nat. 1991, 138, 478. [Google Scholar] [CrossRef]
  40. Christianson, D.; Creel, S. Effects of grass and browse consumption on the winter mass dynamics of elk. Oecologia 2009, 158, 603–613. [Google Scholar] [CrossRef] [PubMed]
  41. Baker, D.L.; Hobbs, N.T. Composition and quality of elk (Cervus elaphus nelsoni) summer diets in Colorado, USA. J. Wildl. Manag. 1982, 46, 694–703. [Google Scholar] [CrossRef]
  42. Alldredge, M.W.; Peek, J.M.; Wall, W. Nutritional quality of forages used by elk in northern Idaho. J. Range Manag. 2002, 55, 253–259. [Google Scholar] [CrossRef]
  43. Houston, D. The Northern Yellowstone Elk: Ecology and Management, 1st ed.; Collier Macmillan: New York, NY, USA, 1982; pp. 1–474. [Google Scholar]
  44. Frank, D.A.; McNaughton, S.J.; Tracy, B.F. The ecology of the earth’s grazing ecosystems. Bioscience 1998, 48, 513–521. [Google Scholar] [CrossRef]
  45. Haggerty, J.H.; Travis, W.R. Out of administrative control: Absentee owners, resident elk and the shifting nature of wildlife management in southwestern Montana. Geoforum 2006, 37, 816–830. [Google Scholar] [CrossRef]
  46. Parmenter, A.W.; Hansen, A.; Kennedy, R.E.; Cohen, W.; Langner, U.; Lawrence, R.; Maxwell, B.; Gallant, A.; Aspinall, R. Land use and land cover change in the Greater Yellowstone Ecosystem: 1975–1995. Ecol. Appl. 2003, 13, 687–703. [Google Scholar] [CrossRef]
  47. Piekielek, N.B. Remote Sensing Grassland Phenology in the Greater Yellowstone Ecosystem: Biophysical Correlates, Land Use Effects and Patch Dynamics. Ph.D. Thesis, Montana State University, Bozeman, MT, USA, 2012. [Google Scholar]
  48. Son, N.T.; Chen, C.F.; Chen, C.R.; Minh, V.Q.; Trung, N.H. A comparative analysis of multitemporal MODIS EVI and NDVI data for large-scale rice yield estimation. Agric. For. Meteorol. 2014, 197, 52–64. [Google Scholar] [CrossRef]
  49. Fontana, F.; Rixen, C.; Jonas, T.; Aberegg, G.; Wunderle, S. Alpine grassland phenology as seen in AVHRR, VEGETATION, and MODIS NDVI time series—A comparison with in situ measurements. Sensors 2008, 8, 2833–2853. [Google Scholar] [CrossRef] [Green Version]
  50. Houston, D.B. Elk as winter-spring food for carnivores in Northern Yellowstone National Park. J. Appl. Ecol. 1978, 15, 653–661. [Google Scholar] [CrossRef]
  51. Despain, D. Yellowstone Vegetation: Consequences of Environment and History in a Natural Setting; Roberts Rinehart Inc.: Boulder, MT, USA, 1990. [Google Scholar]
  52. Homer, C.G.; Dewitz, J.A.; Yang, L.; Jim, S.; Daniselson, P.; Xian, G.; Coulston, J.; Herold, N.D.; Wickham, J.D.; Megown, K. Completion of the 2011 National Land Cover Database for the conterminous United States-Representing a decade of land cover change information. Photogramm. Eng. Remote Sens. 2015, 81, 345–354. [Google Scholar]
  53. Justice, C.O.; Townshend, J.R.G.; Vermote, E.F.; Masuoka, E.; Wolfe, R.E.; Saleous, N.; Roy, D.P.; Morisette, J.T. An overview of MODIS Land data processing and product status. Remote Sens. Environ. 2002, 83, 3–15. [Google Scholar] [CrossRef]
  54. Garroutte, E.; Hansen, A. Spatiotemporal variation in the biomass and quality across elevation-related phenology and land use gradients in the Upper Yellowstone River Basin. Unpublished work. 2016. [Google Scholar]
  55. Zuur, A.F.; Ieno, E.N.; Walker, N.J.; Saveliev, A.A.; Smith, G.M. Mixed effects models and extensions in ecology with R. J. R. Stat. Soc.: Ser. A 2010, 173, 938–939. [Google Scholar]
  56. Box, G.E.P.; Jenkins, G.M. Time Series Analysis: Forecasting and Control, 4th ed.; Wiley: Englewood Cliffs, NJ, USA, 1994; Volume 3. [Google Scholar]
  57. Nakagawa, S.; Schielzeth, H. A general and simple method for obtaining R2 from generalized linear mixed-effects models. Methods Ecol. Evol. 2013, 4, 133–142. [Google Scholar] [CrossRef]
  58. Baptist, F.; Yoccoz, N.G.; Choler, P. Direct and indirect control by snow cover over decomposition in alpine tundra along a snowmelt gradient. Plant Soil 2010, 328, 397–410. [Google Scholar] [CrossRef]
  59. Bowman, W.D.; Theodose, T.A.; Schardt, J.C.; Conant, R.T. Constraints of nutrient availability on primary production in two alpine tundra communities. Ecology 1993, 74, 2085–2097. [Google Scholar] [CrossRef] [Green Version]
  60. Blumthaler, M.; Ambach, W.; Ellinger, R. Increase in solar UV radiation with altitude. J. Photochem. Photobiol. B Biol. 1997, 39, 130–134. [Google Scholar] [CrossRef]
  61. Brooks, P.D.; Williams, M.W. Snowpack controls on nitrogen cycling and export in seasonally snow-covered catchments. Hydrol. Process. 1999, 13, 2177–2190. [Google Scholar] [CrossRef]
  62. Borner, A.P.; Kielland, K.; Walker, M.D. Effects of simulated climate change on plant phenology and Nitrogen mineralization in Alaskan Arctic Tundra. Arct. Antarct. Alp. Res. 2008, 40, 27–38. [Google Scholar] [CrossRef]
  63. Kudo, G.; Nordenhall, U.; Molau, U. Effects of snowmelt timing on leaf traits, leaf production, and shoot growth of alpine plants: Comparisons along a snowmelt gradient in northern Sweden. Ecoscience 1999, 6, 439–450. [Google Scholar]
  64. Frank, D.A.; Groffman, P.M. Ungulate vs. landscape control of soil C and N processes in grasslands of Yellowstone National Park. Ecology 1998, 79, 2229–2241. [Google Scholar] [CrossRef]
  65. Albon, S.D.; Langvatn, R. Plant phenology and the benefits of migration in a temperate ungulate. Oikos 2009, 65, 502–513. [Google Scholar] [CrossRef]
  66. Hebblewhite, M.; Merrill, E.H. Trade-offs between predation risk and forage differ between migrant strategies in a migratory ungulate. Ecology 2009, 90, 3445–3454. [Google Scholar] [CrossRef] [PubMed]
  67. Duparc, A.; Redjadj, C.; Viard-Crétat, F.; Lavorel, S.; Austrheim, G.; Loison, A. Co-variation between plant above-ground biomass and phenology in sub-alpine grasslands. Appl. Veg. Sci. 2013, 16, 305–316. [Google Scholar] [CrossRef]
  68. Inouye, D.W. Effects of climate change on phenology, frost damage, and floral abundance of montane wildflowers. Ecology 2008, 89, 353–362. [Google Scholar] [CrossRef] [PubMed]
  69. Buyantuyev, A.; Wu, J. Urbanization alters spatiotemporal patterns of ecosystem primary production: A case study of the Phoenix metropolitan region, USA. J. Arid Environ. 2009, 73, 512–520. [Google Scholar] [CrossRef]
  70. Wilmers, C.C.; Levi, T. Do irrigation and predator control reduce the productivity of migratory ungulate herds? Ecology 2013, 94, 1264–1270. [Google Scholar] [CrossRef] [PubMed]
  71. White, R.G. Foraging Patterns and Their Multiplier Effects on Productivity of Northern Ungulates. Oikos 1983, 40, 377–384. [Google Scholar] [CrossRef]
  72. Mysterud, A.; Langvatn, R.; Yoccoz, N.G.; Stenseth, N.C. Plant phenology, migration and geographical variation in body weight of a large herbivore: The effect of a variable topography. J. Anim. Ecol. 2001, 70, 915–923. [Google Scholar] [CrossRef]
  73. Bischof, R.; Loe, L.E.; Meisingset, E.L.; Zimmermann, B.; van Moorter, B.; Mysterud, A. A migratory northern ungulate in the pursuit of spring: Jumping or surfing the green wave? Am. Nat. 2012, 180, 407–424. [Google Scholar] [CrossRef] [PubMed]
  74. Hebblewhite, M.; Merrill, E.H.; Morgantini, L.E.; White, C.A.; Allen, J.R.; Bruns, E.; Thurston, L.; Hurd, T.E. Is the migratory behavior of montane elk herds in Peril? The case of Alberta’s Ya Ha Tinda elk herd. Wildl. Soc. Bull. 2006, 34, 1280–1294. [Google Scholar] [CrossRef]
  75. Creel, S.; Winnie, J.; Maxwell, B.; Hamlin, K.; Creel, M. Elk alter habitat selection as an antipredator response to wolves. Ecology 2005, 86, 3387–3397. [Google Scholar] [CrossRef]
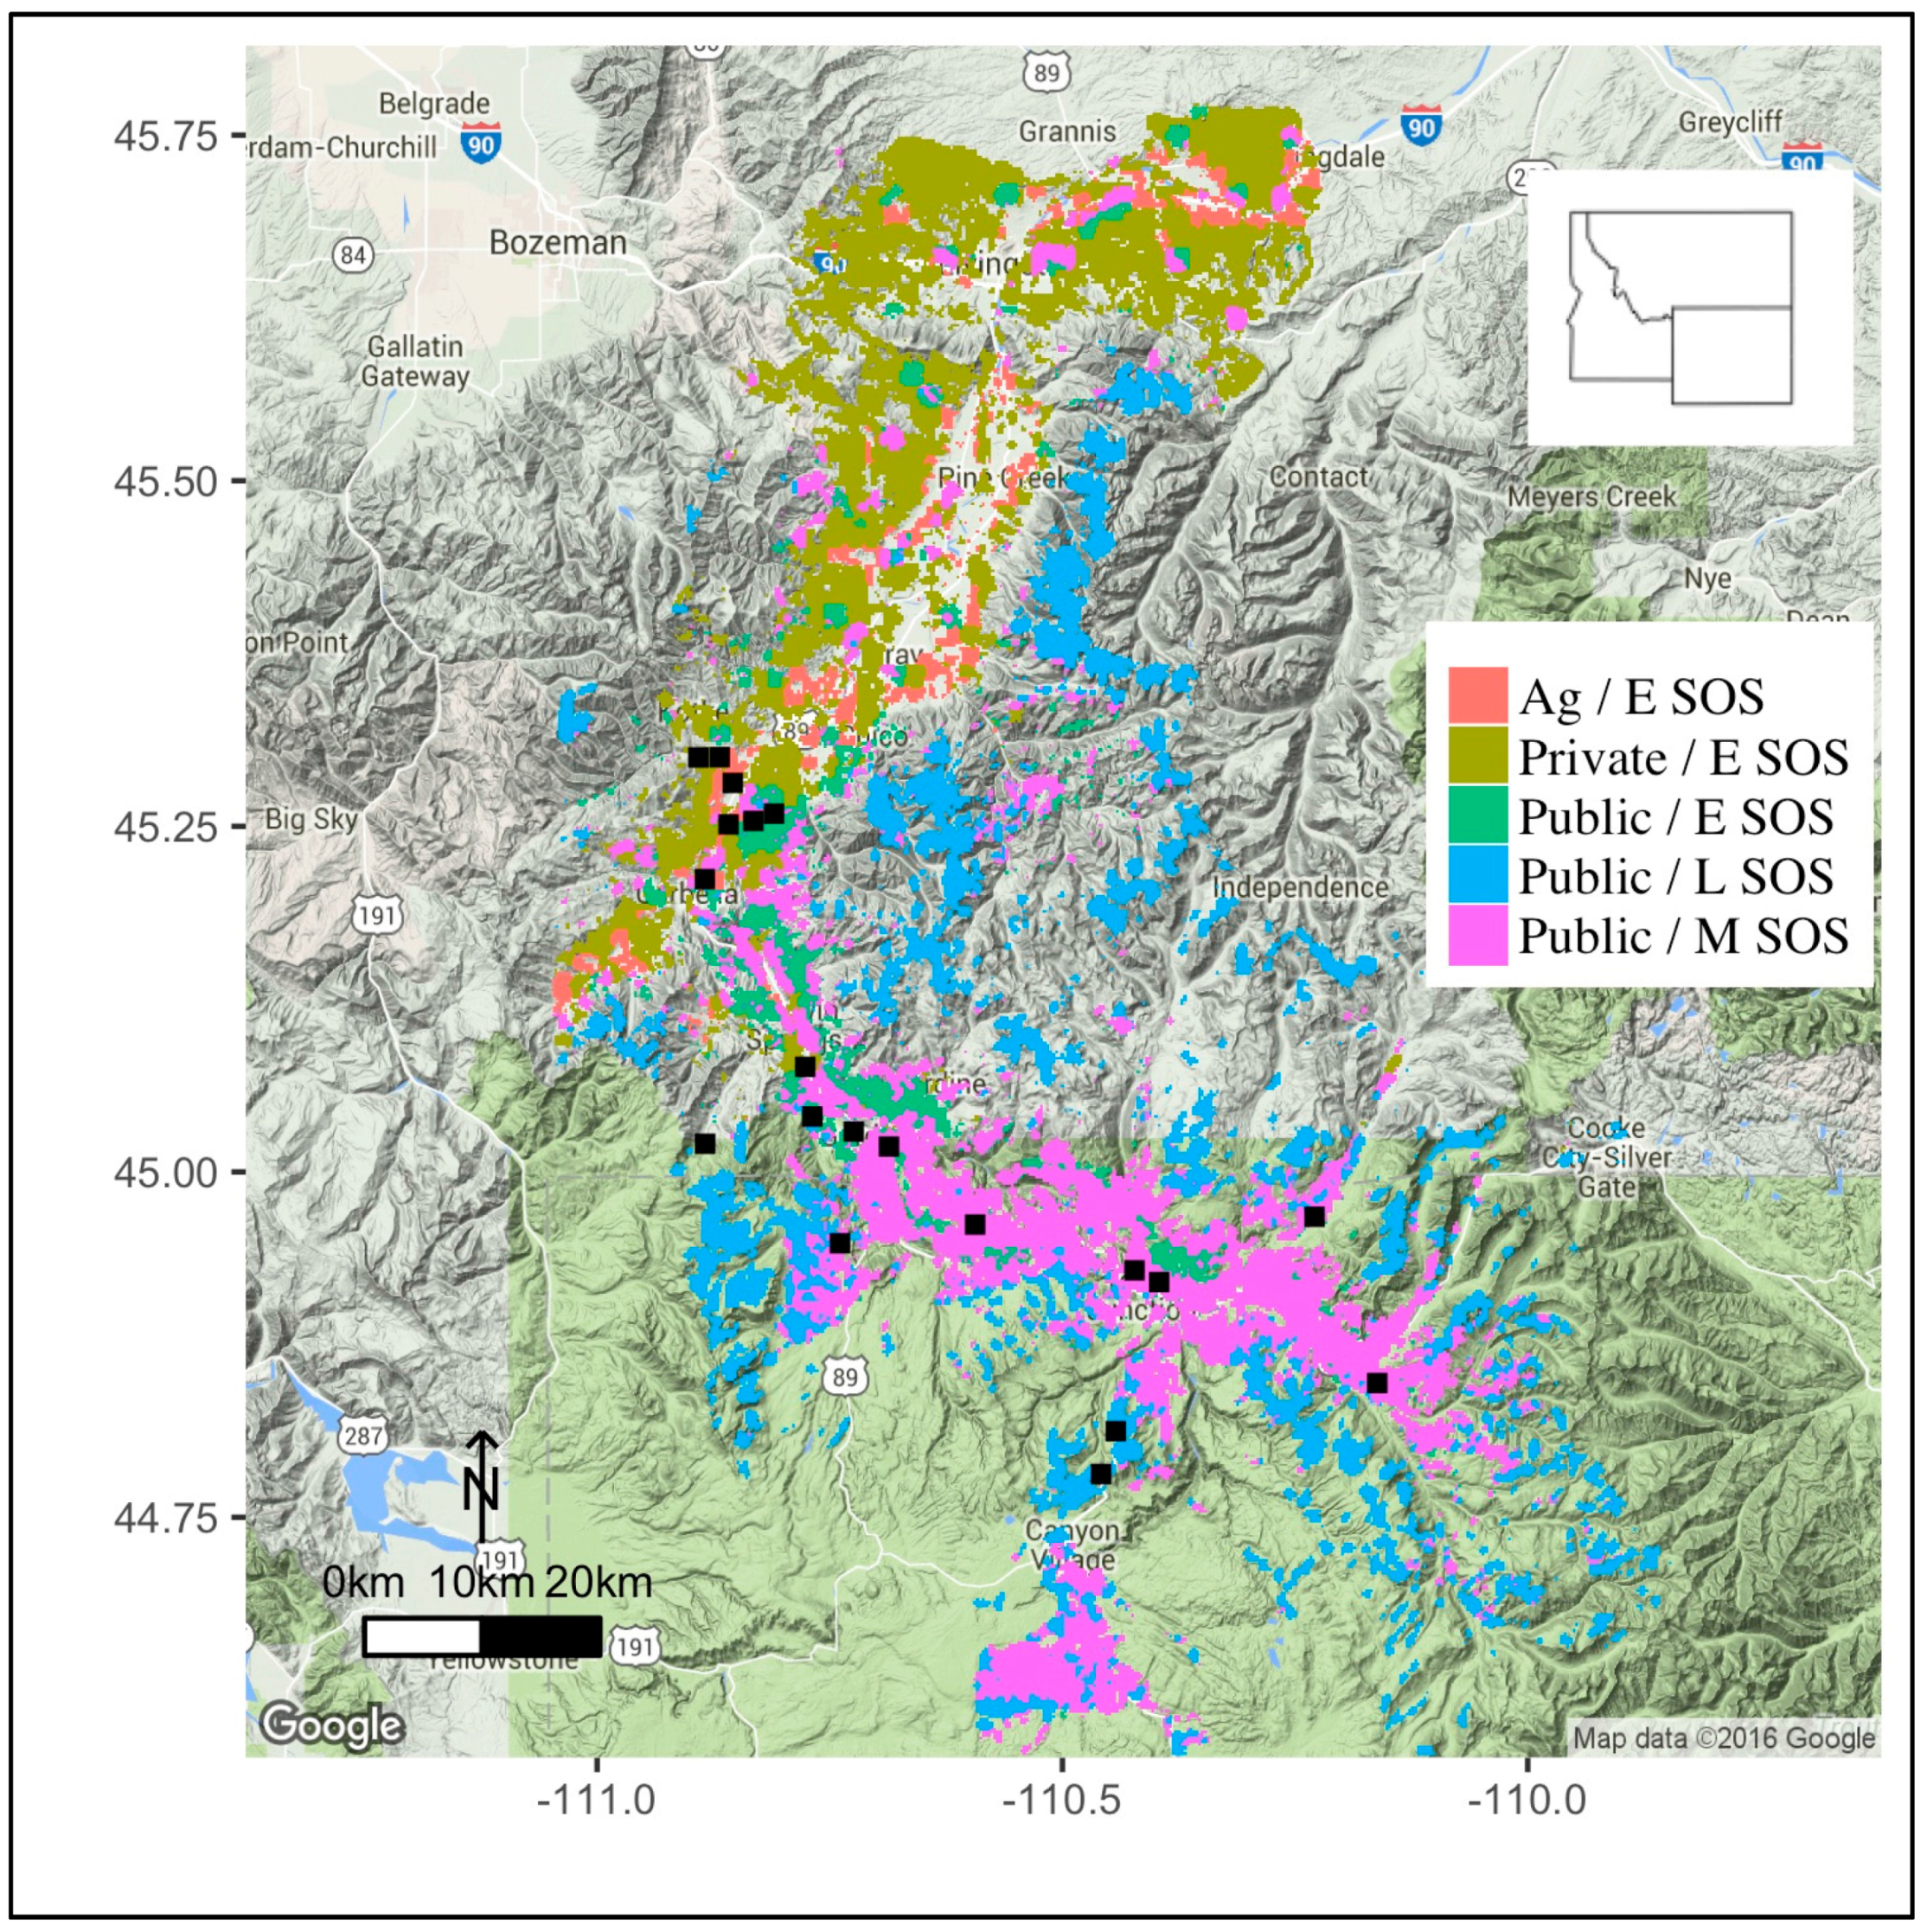
Figure 1. Map of grasslands in the start of season (SOS) classes (early, mid, late SOS classes) and land use classes (irrigated agriculture, private grasslands, and public grasslands) in the Upper Yellowstone River Basin (UYRB). Irrigated agriculture and private grasslands were only present in the low-elevation grasslands with early onset of growth (early SOS). Squares represent the 20 pixels sampled in this study.
Remotesensing 08 00404 g001
Figure 2. Histogram of the average start of season date (Julian days), which is the average date that pixels reached half of their seasonal amplitude in NDVI [47], for all grassland pixels in the Upper Yellowstone River Basin. This histogram was used to classify pixels into early, mid, and late start of season (SOS) classes.
Remotesensing 08 00404 g002
Figure 3. Seasonal variation in NDVI, EVI, biomass, chlorophyll, crude protein, and IVDMD in grasslands in the different start of season and land use classes in the Upper Yellowstone River Basin. Shapes represent estimates from before/after the peak in biomass.
Remotesensing 08 00404 g003
Figure 4. Linear NDVI, linear EVI, and top models of biomass, chlorophyll, crude protein, and IVDMD in grasslands in the different start of season (SOS) and land use classes. Shading represents 95% confidence intervals and shapes represent estimates from before/after the peak in biomass.
Remotesensing 08 00404 g004
Figure 5. Maps of the aboveground biomass (g/m2) of grasslands across the Upper Yellowstone River Basin on Julian days 128, 187, and 263 estimated from the linear NDVI, linear EVI, and the top models.
Remotesensing 08 00404 g005
Figure 6. Maps of the chlorophyll (OD666) content of grasslands across the Upper Yellowstone River Basin on Julian days 128, 187, and 263 estimated from the linear NDVI, linear EVI, and the top models.
Remotesensing 08 00404 g006
Figure 7. Maps of the crude protein (%) of grasslands across the Upper Yellowstone River Basin on Julian days 128, 187, and 263 estimated from the linear NDVI, linear EVI, and the top models.
Remotesensing 08 00404 g007
Figure 8. Maps of the IVDMD (%) of grasslands across the Upper Yellowstone River Basin on Julian days 128, 187, and 263 estimated from the linear NDVI, linear EVI, and the top models.
Remotesensing 08 00404 g008
Figure 9. Maps of the abundance of forage with adequate crude protein (>8.2%) and IVDMD (>56.3%) for elk [38] across the Upper Yellowstone River Basin on Julian days 128, 187, and 263.
Remotesensing 08 00404 g009
Table 1. Statistics from the linear NDVI, linear EVI, and top models of biomass, chlorophyll, crude protein, IVDMD in the start of season (SOS) and land use classes. Model statistics include the corrected AIC (AICc), the adjusted R2 from the NDVI and EVI models, the marginal R2 [57] from the top models, the partial R2, the F-statistics, and the p-values.
Start of Season ModelsLand Use Models
AICcR2Fixed Effectsrp2dfFpModelAICcR2Fixed Effectsrp2dfFp
Aboveground biomass
NDVI1782.70.42NDVI0.421187134.1<0.001NDVI2113.80.53NDVI0.531198226.7<0.001
EVI1834.90.24EVI0.24118757.2<0.001EVI2228.90.17EVI0.17119840.8<0.001
Top1662.50.76bs(NDVI)0.59516013.1<0.001Top1826.70.72NDVI20.62218153.8<0.001
SOS0.08216012.9<0.001 Land use0.0721130.5<0.001
bs(NDVI)*SOS0.0910,1603.7<0.001 Date0.0111810.60.44
NDVI2*Date0.02218114.4<0.001
Chlorophyll
NDVI−22.90.04NDVI0.0411878.60.004NDVI−7.80.03NDVI0.0311986.40.012
EVI−15.80.01EVI0.0111871.30.255EVI−1.70.01EVI0.0111980.20.653
Top−54.80.21NDVI0.06117510.30.001Top−34.30.17NDVI0.0611847.40.007
Date0.15117539.1<0.001 Date0.11118432.7<0.001
Crude protein
NDVI1098.50.09NDVI0.09118718.9<0.001NDVI1114.90.14NDVI0.14119831.4<0.001
EVI1106.40.05EVI0.05118710.40.001EVI1132.80.05EVI0.05119811.7<0.001
Top896.90.74bs(EVI)0.16516915.3<0.001Top971.70.51bs(EVI) 0.14518018.8<0.001
SOS0.0421693.30.041 Land use0.062115.90.018
Date0.541169328.9<0.001 Date0.311180236.1<0.001
IVDMD
NDVI1369.70.11NDVI0.11118722.2<0.001NDVI1453.90.18NDVI0.18119844.6<0.001
EVI1375.90.08EVI0.08118715.5<0.001EVI1481.60.06EVI0.06119813.3<0.001
Top1307.50.37NDVI0.12117231.7<0.001Top1383.20.56NDVI20.22218334.8<0.001
SOS0.0521724.10.018 Land use0.062117.40.009
Date0.18117260.2<0.001 Date0.28118382.2<0.001
NDVI*Date0.0211727.70.006
* All basis spline functions had df = 5.
Table 2. The average root mean squared errors (AVG ± SE) from the linear NDVI, linear EVI, and top models of biomass, chlorophyll, crude protein, and IVDMD in the different start of season classes, land use classes, and before/after the peak in biomass in the Upper Yellowstone River Basin. Letters represent differences (p < 0.001) in model estimates between classes and * represents differences within classes.
Start of Season ClassesLand Use Classes
ModelsEarlyMidLatePre-MaxPost-MaxIrrigated AgPrivatePublicPre-MaxPost-Max
Aboveground biomass (g/m2)
NDVI3.88 ± 2.61a4.63 ± 3.38a7.89 ± 3.41b3.41 ± 2.76a6.44 ± 3.91b18.61 ± 9.58b7.66 ± 5.33a5.59 ± 4.16a7.05 ± 5.68a9.07 ± 6.24b
EVI4.09 ± 2.61a4.52 ± 2.71a9.17 ± 4.51b4.35 ± 3.28a6.79 ± 2.99b16.85 ± 9.45b8.42 ± 5.35a6.86 ± 3.67a9.14 ± 8.31a12.41 ± 9.14b
Top2.43 ± 2.11a *3.22 ± 2.77a *5.46 ± 3.36b *2.65 ± 2.24a *5.02 ± 6.56b *12.17 ± 9.92b *2.36 ± 1.89a *2.69 ± 2.02a *4.31 ± 4.63a *6.22 ± 5.09b *
Chlorophyll (OD666)
NDVI0.03 ± 0.04a0.04 ± 0.03a0.05 ± 0.03b0.03 ± 0.02a0.04 ± 0.03b0.05 ± 0.03b0.03 ± 0.02a0.03 ± 0.02a0.03 ± 0.02a0.05 ± 0.03b
EVI0.03 ± 0.04a0.04 ± 0.03a0.05 ± 0.03b0.03 ± 0.02a0.04 ± 0.03b0.05 ± 0.03b0.03 ± 0.03a0.03 ± 0.03a0.03 ± 0.02a0.05 ± 0.03b
Top0.02 ± 0.04a *0.03 ± 0.03a *0.03 ± 0.03b *0.02 ± 0.03a *0.03 ± 0.03b *0.05 ± 0.03b *0.02 ± 0.03a0.02 ± 0.03a0.02 ± 0.02a *0.03 ± 0.03b *
Crude protein (%)
NDVI0.68 ± 0.53a0.73 ± 0.47a1.02 ± 0.97b0.73 ± 0.41a0.99 ± 1.01b0.87 ± 0.49b0.76 ± 0.58a0.67 ± 0.54a0.47 ± 0.44a0.67 ± 0.56b
EVI0.68 ± 0.53a0.76 ± 0.51a1.03 ± 0.98b0.79 ± 0.46a0.87 ± 1.05b0.87 ± 0.49b0.73 ± 0.63a0.71 ± 0.45a0.44 ± 0.46a0.55 ± 0.53b
Top0.38 ± 0.32a *0.32 ± 0.38a *0.77 ± 0.79b *0.32 ± 0.29a *0.53 ± 0.84b *0.71 ± 0.58b *0.41 ± 0.45a *0.35 ± 0.29a *0.38 ± 0.42a *0.45 ± 0.33b *
IVDMD (%)
NDVI1.41 ± 1.17a1.51 ± 1.25a1.98 ± 1.44b1.41 ± 0.91a1.53 ± 1.78b2.01 ± 1.45b1.54 ± 1.06a1.71 ± 1.32a1.36 ± 1.39a1.45 ± 1.42b
EVI1.56 ± 1.17a1.59 ± 1.27a2.01 ± 1.44b1.47 ± 0.94a2.06 ± 1.81b2.13 ± 1.46b1.71 ± 1.31a1.85 ± 1.35a1.48 ± 1.24a2.05 ± 1.26b
Top1.08 ± 0.83a *1.31 ± 1.11a *1.77 ± 1.36b *1.24 ± 0.95a *1.74 ± 1.35b *1.85 ± 1.26b *1.11 ± 1.15a *1.52 ± 0.91a *1.07 ± 1.06a *1.46 ± 1.36b *