
Estimating the Fractional Vegetation Cover from GLASS Leaf Area Index Product


Abstract
:
1. Introduction
2. Data
2.1. Satellite Data Sets
2.1.1. GLASS LAI Product
2.1.2. GEOV1 FCover Product
2.2. Field Measured Data
3. Methodology
3.1. Calculation of FCover
3.2. Comparison and Analysis
4. Result Analysis
4.1. Comparison with GEOV1 FCover Product
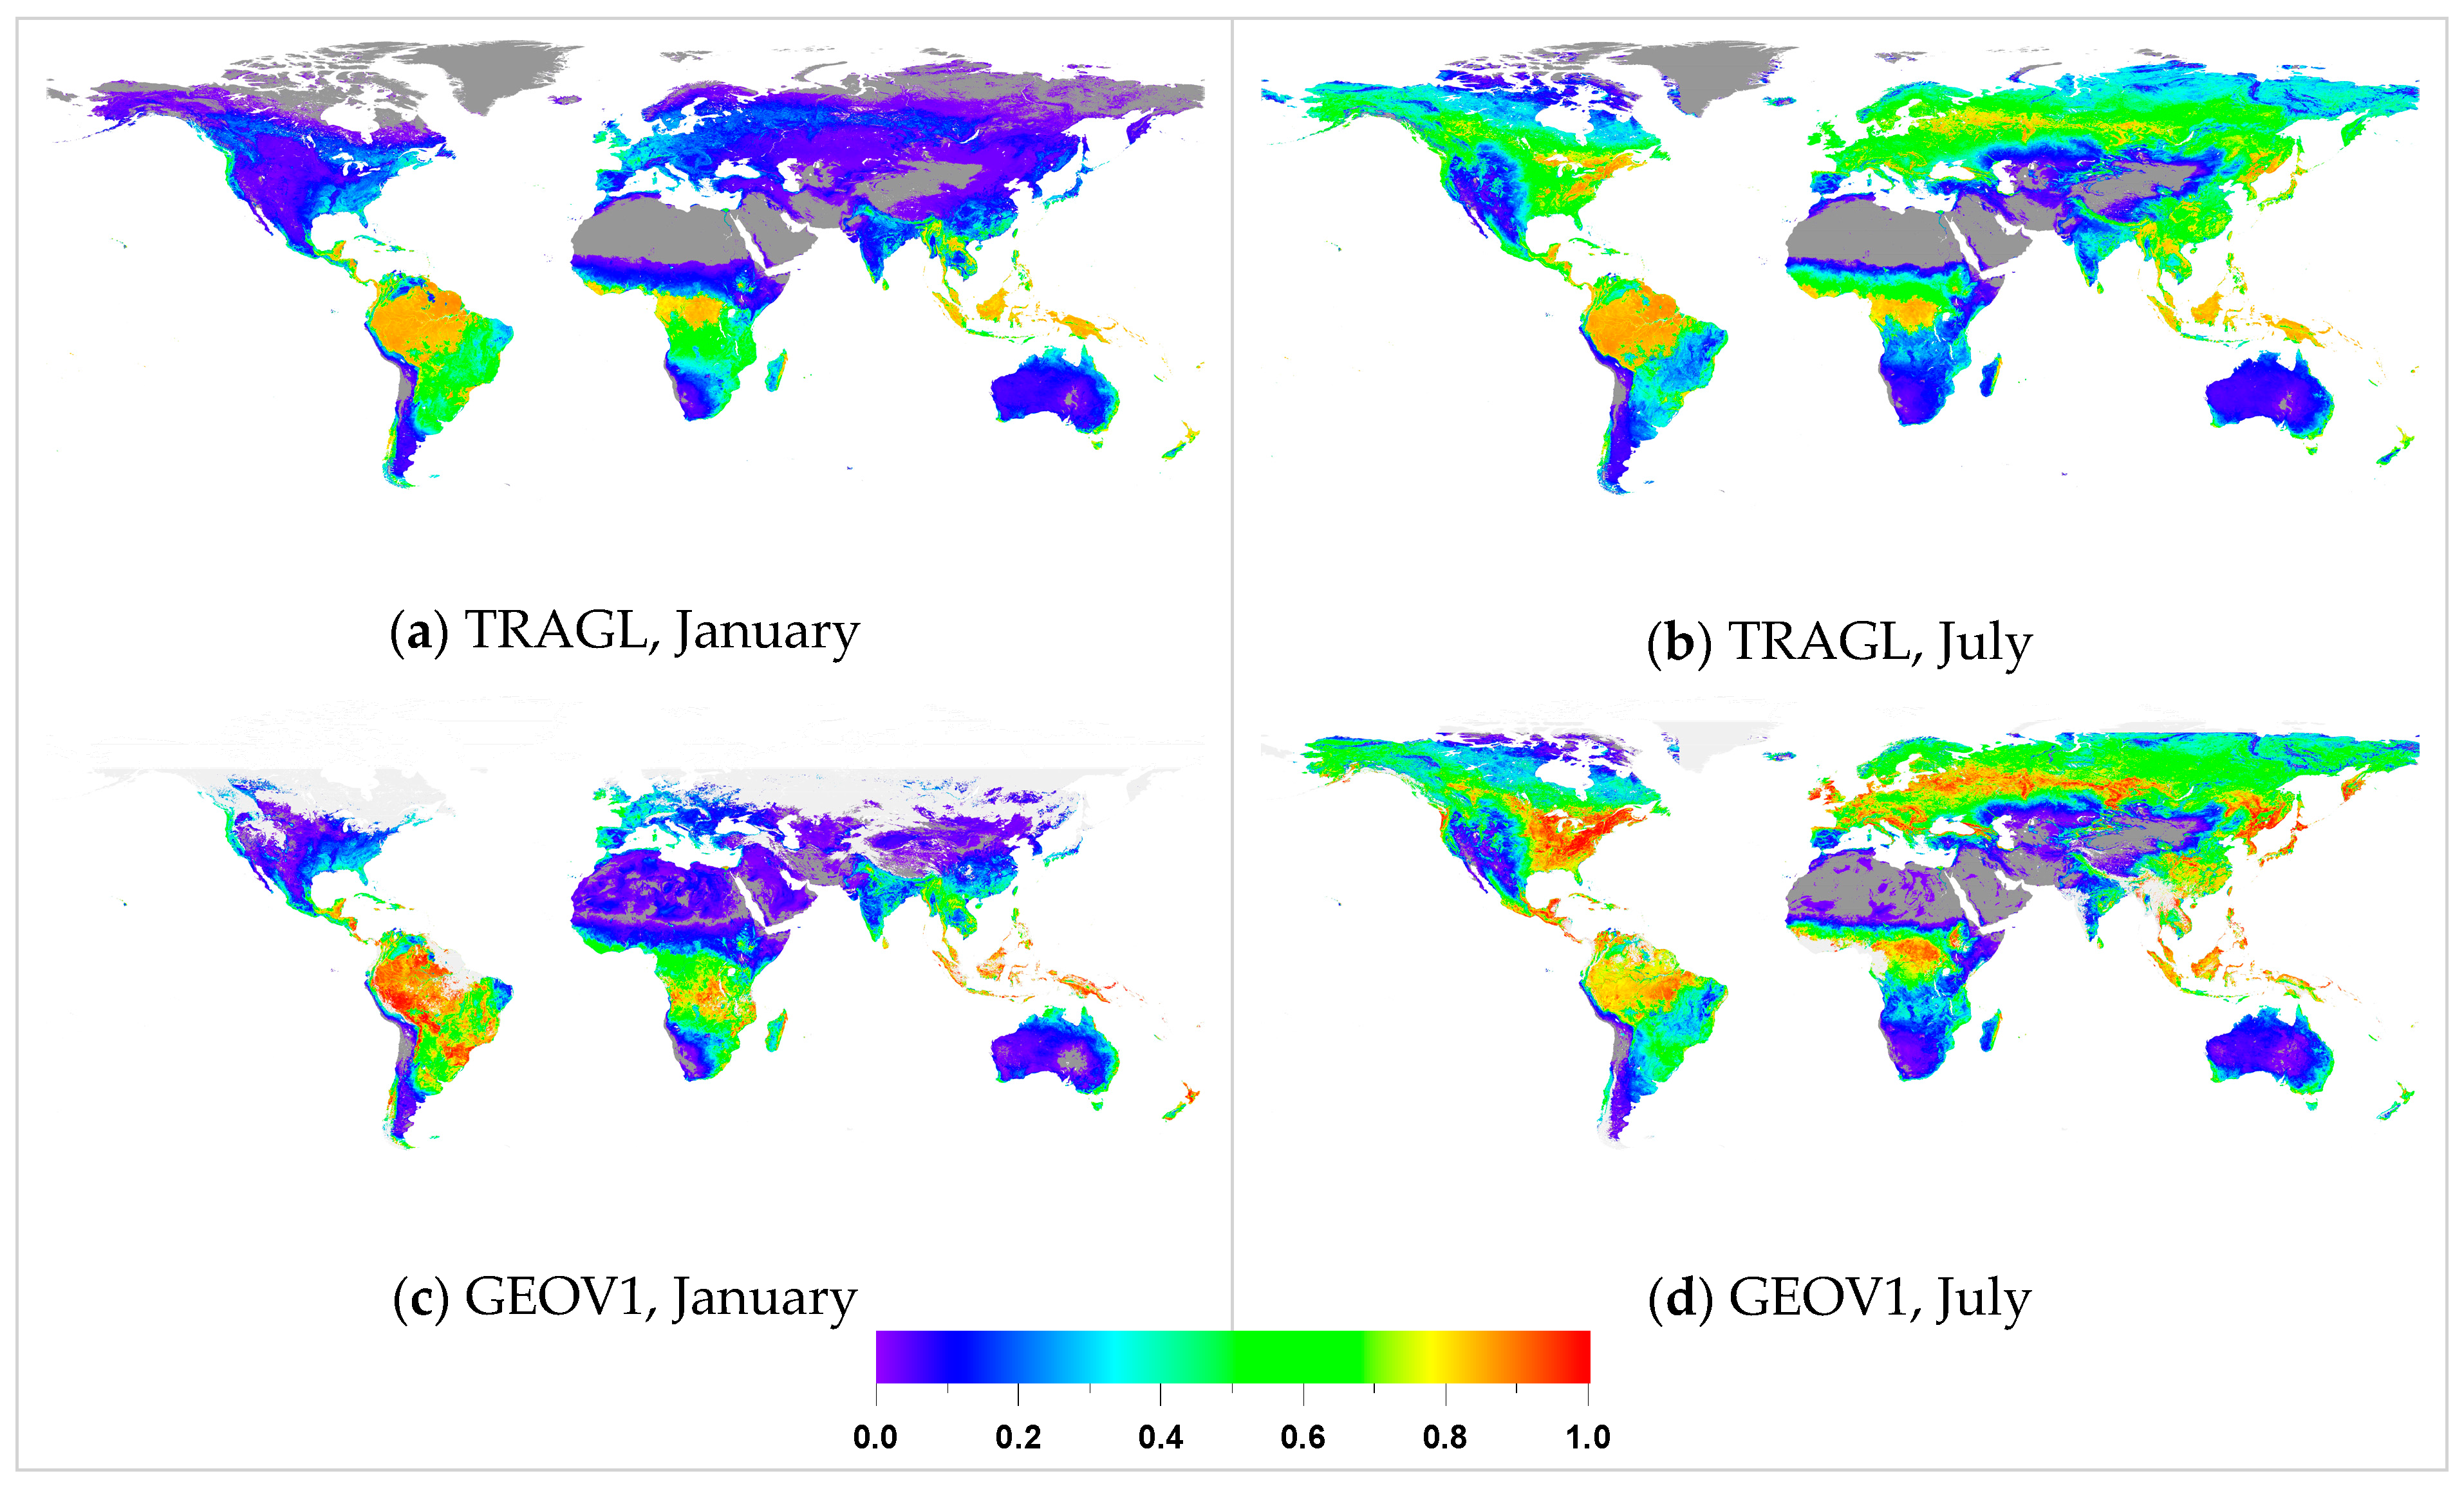
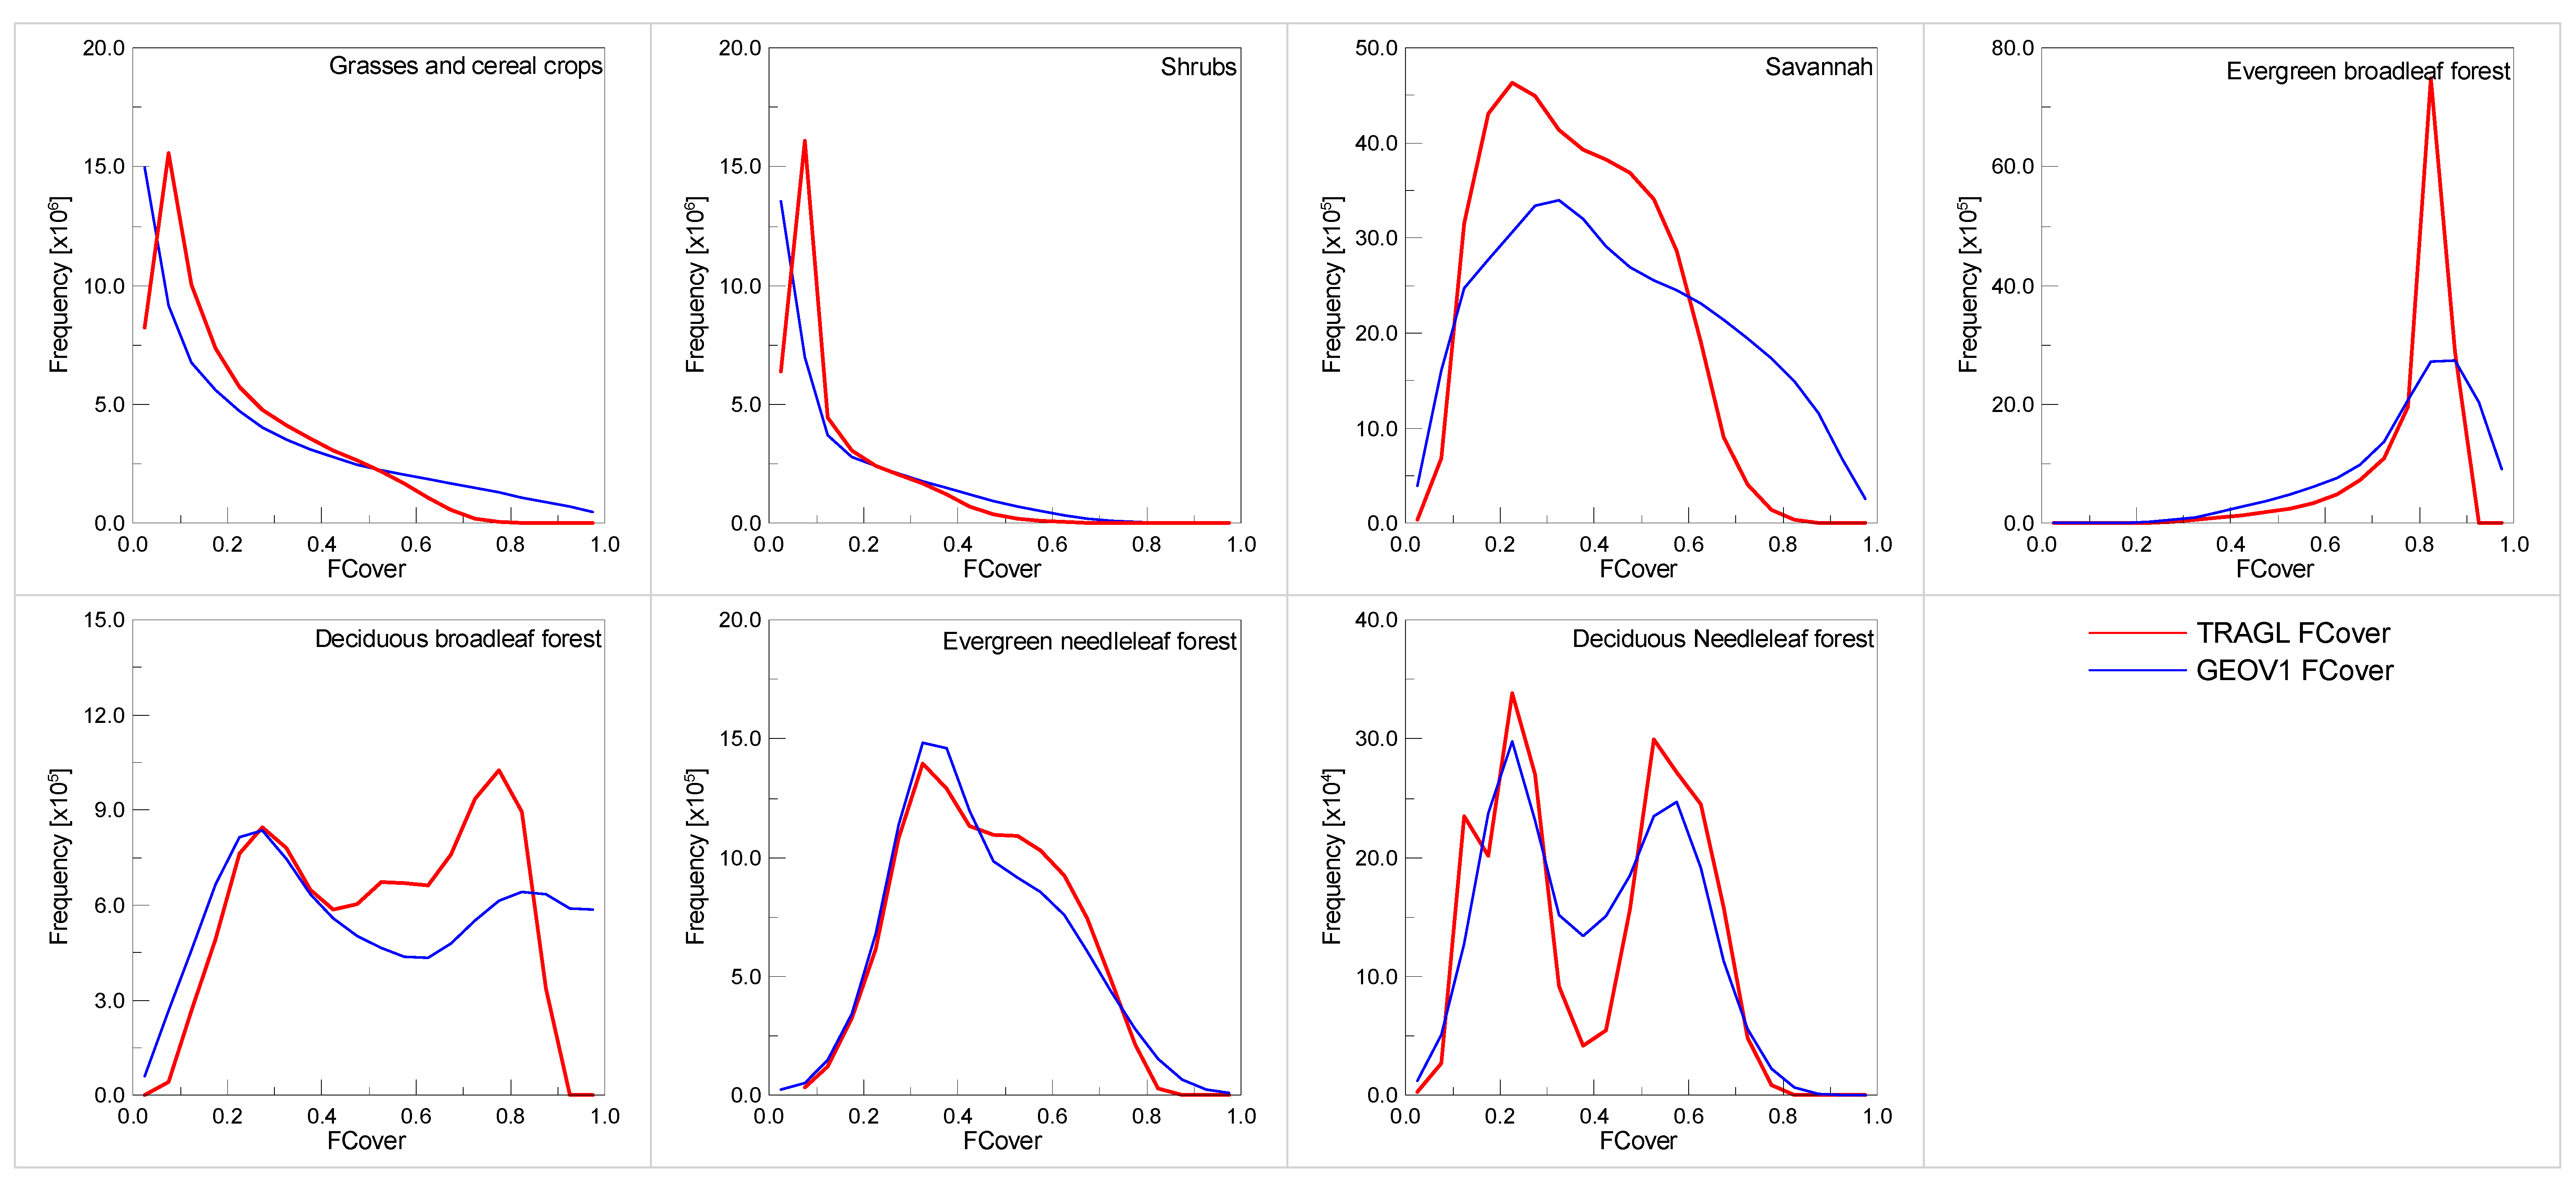
4.1.1. Spatial Consistency
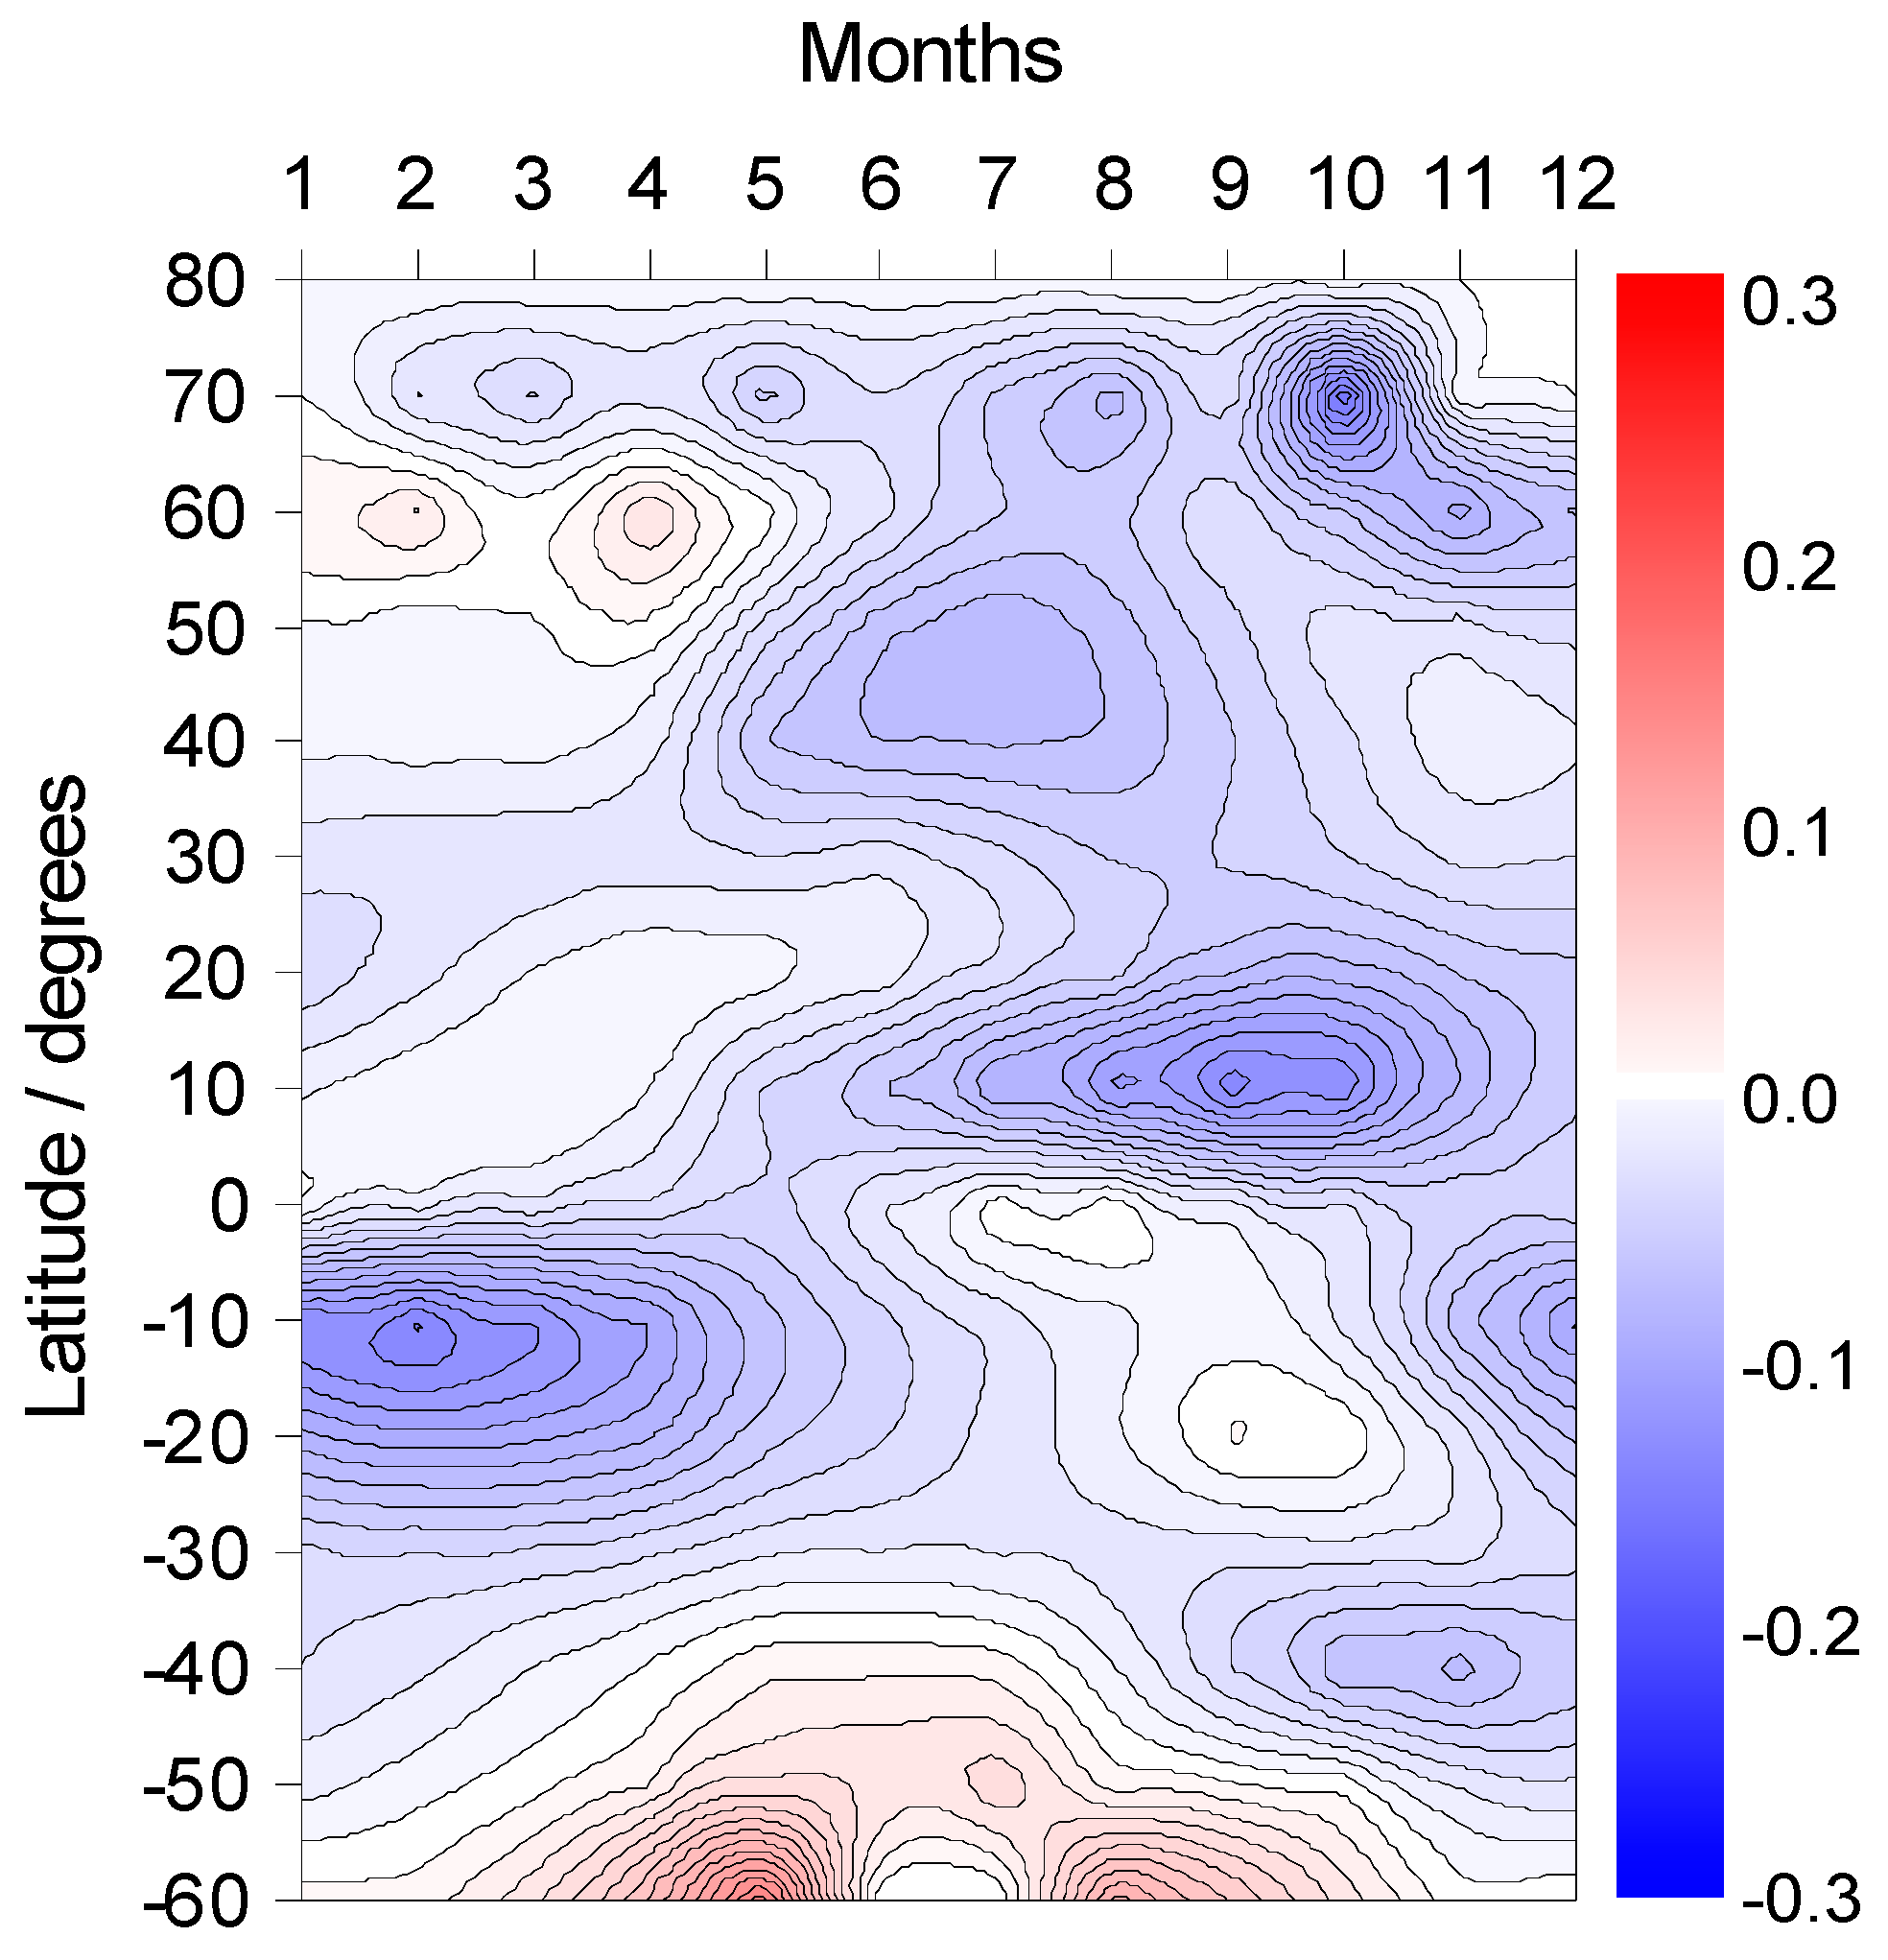
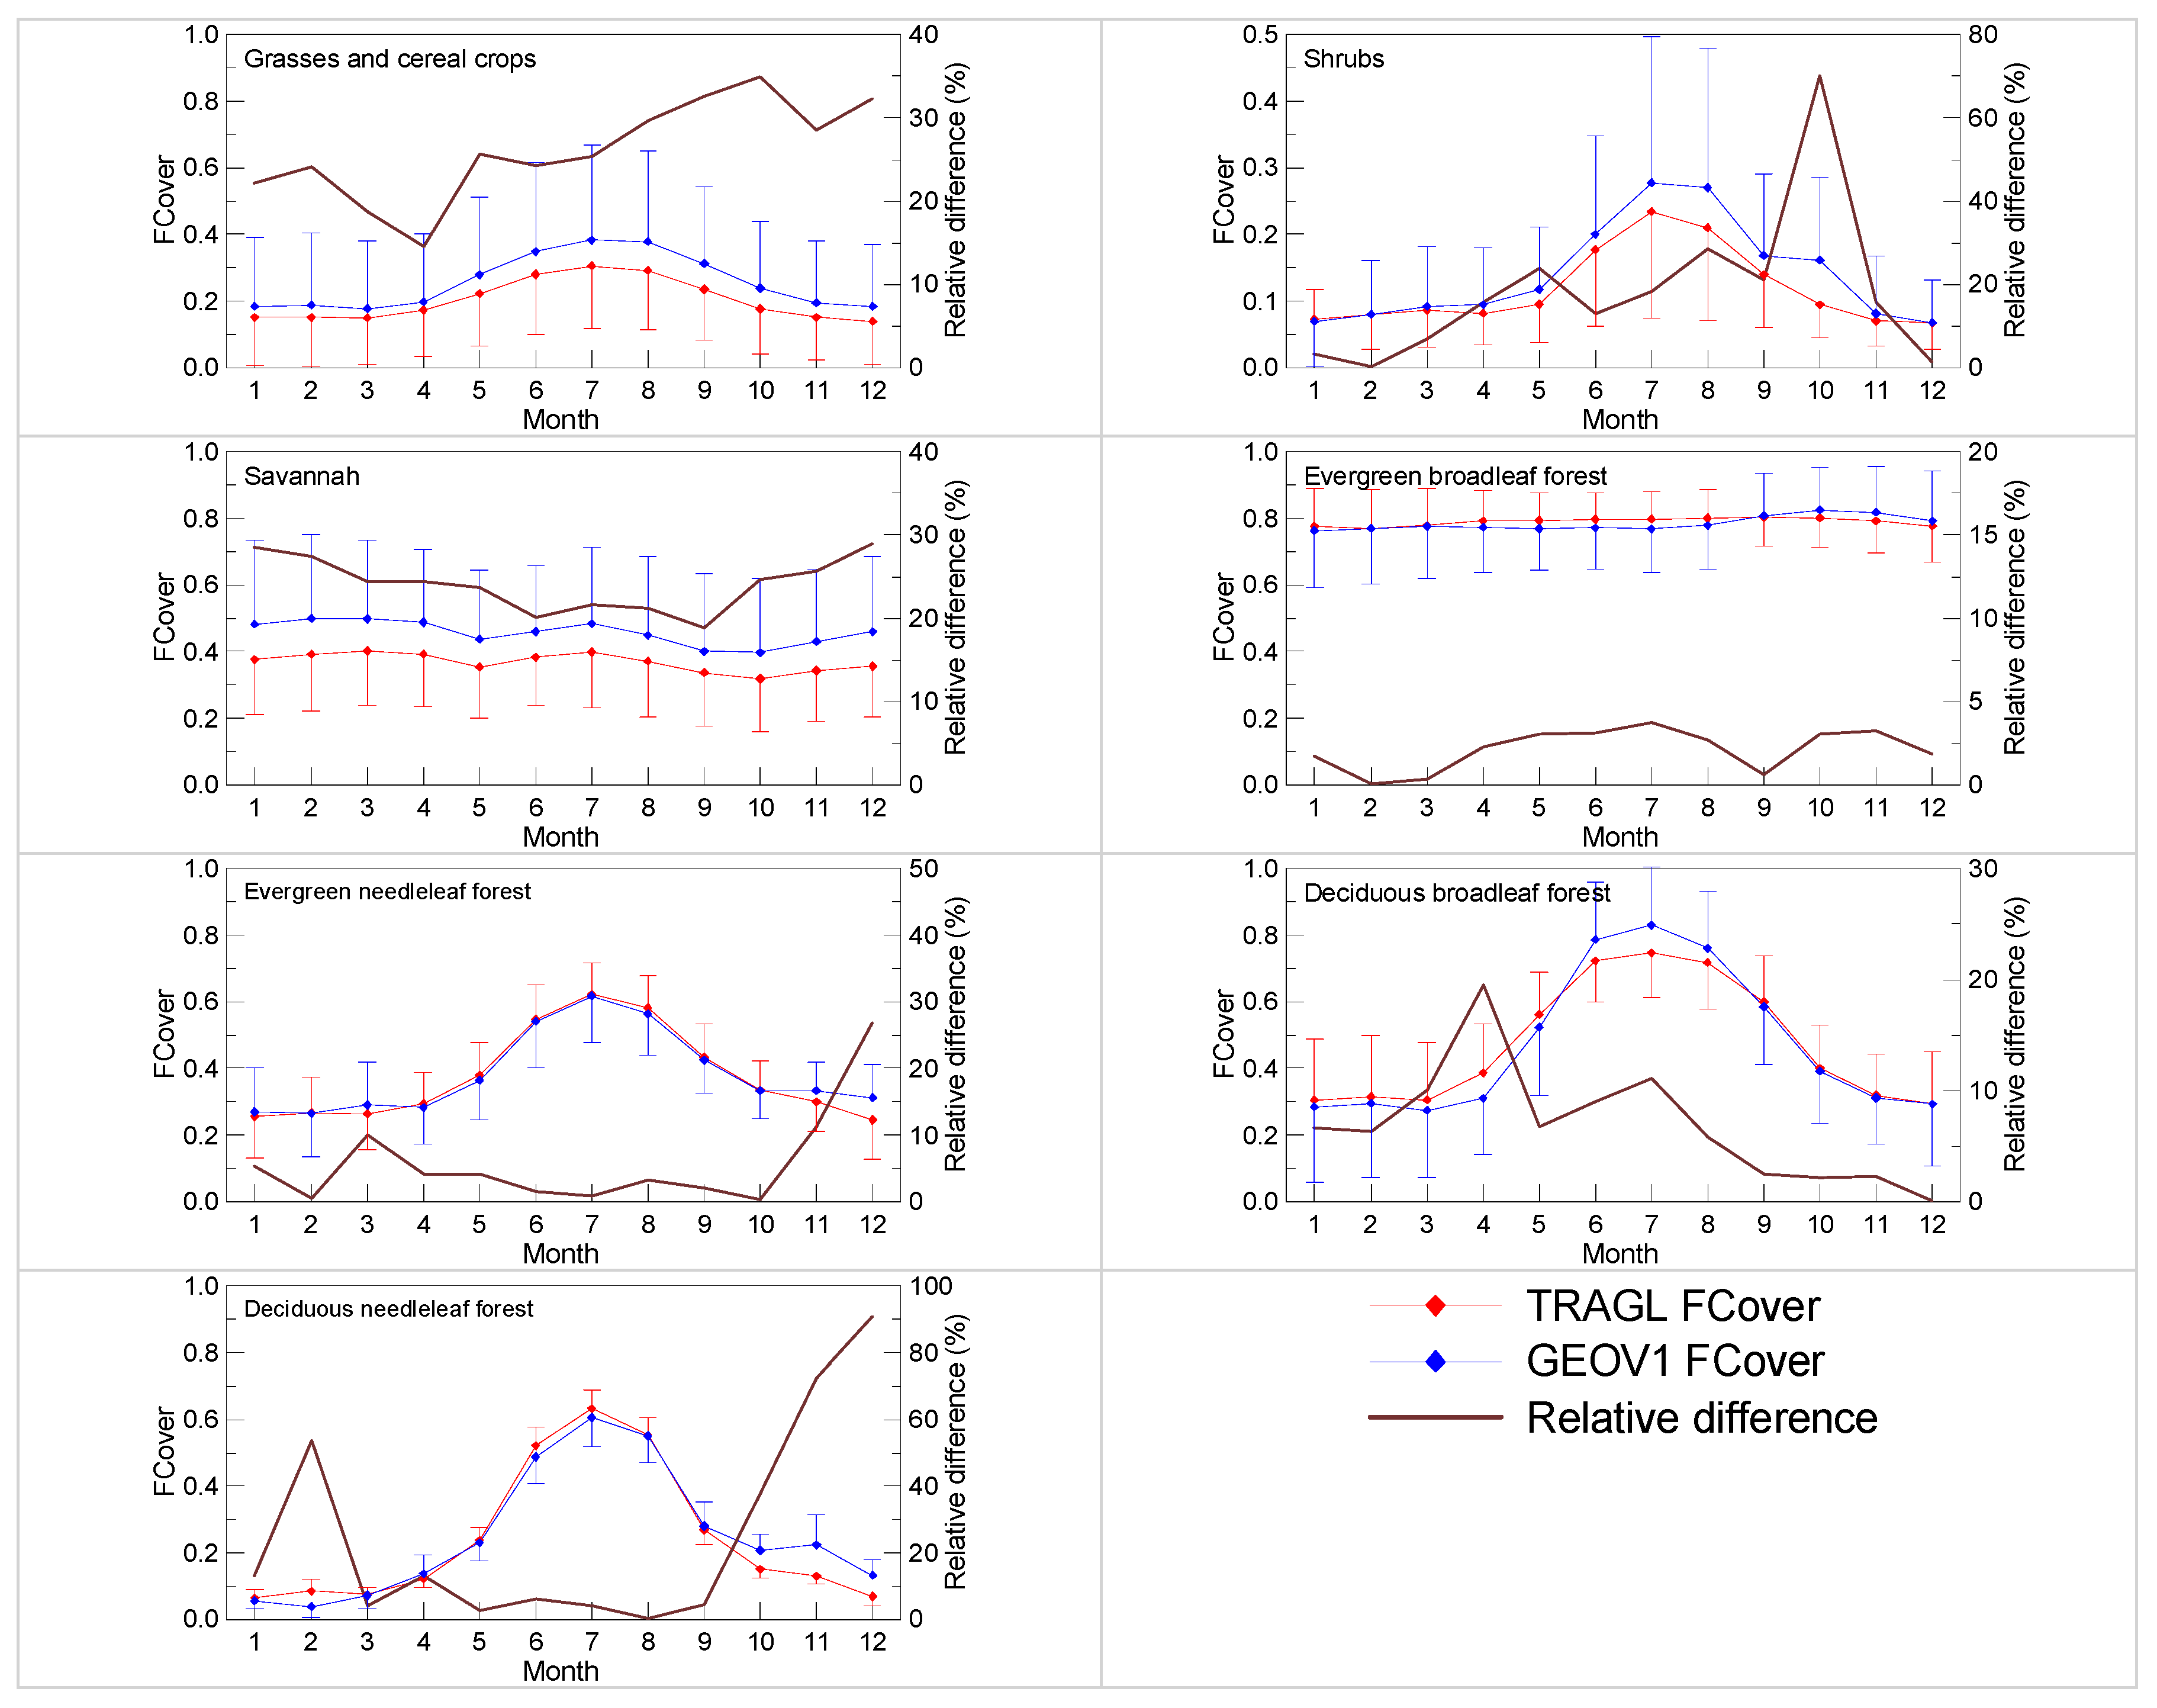
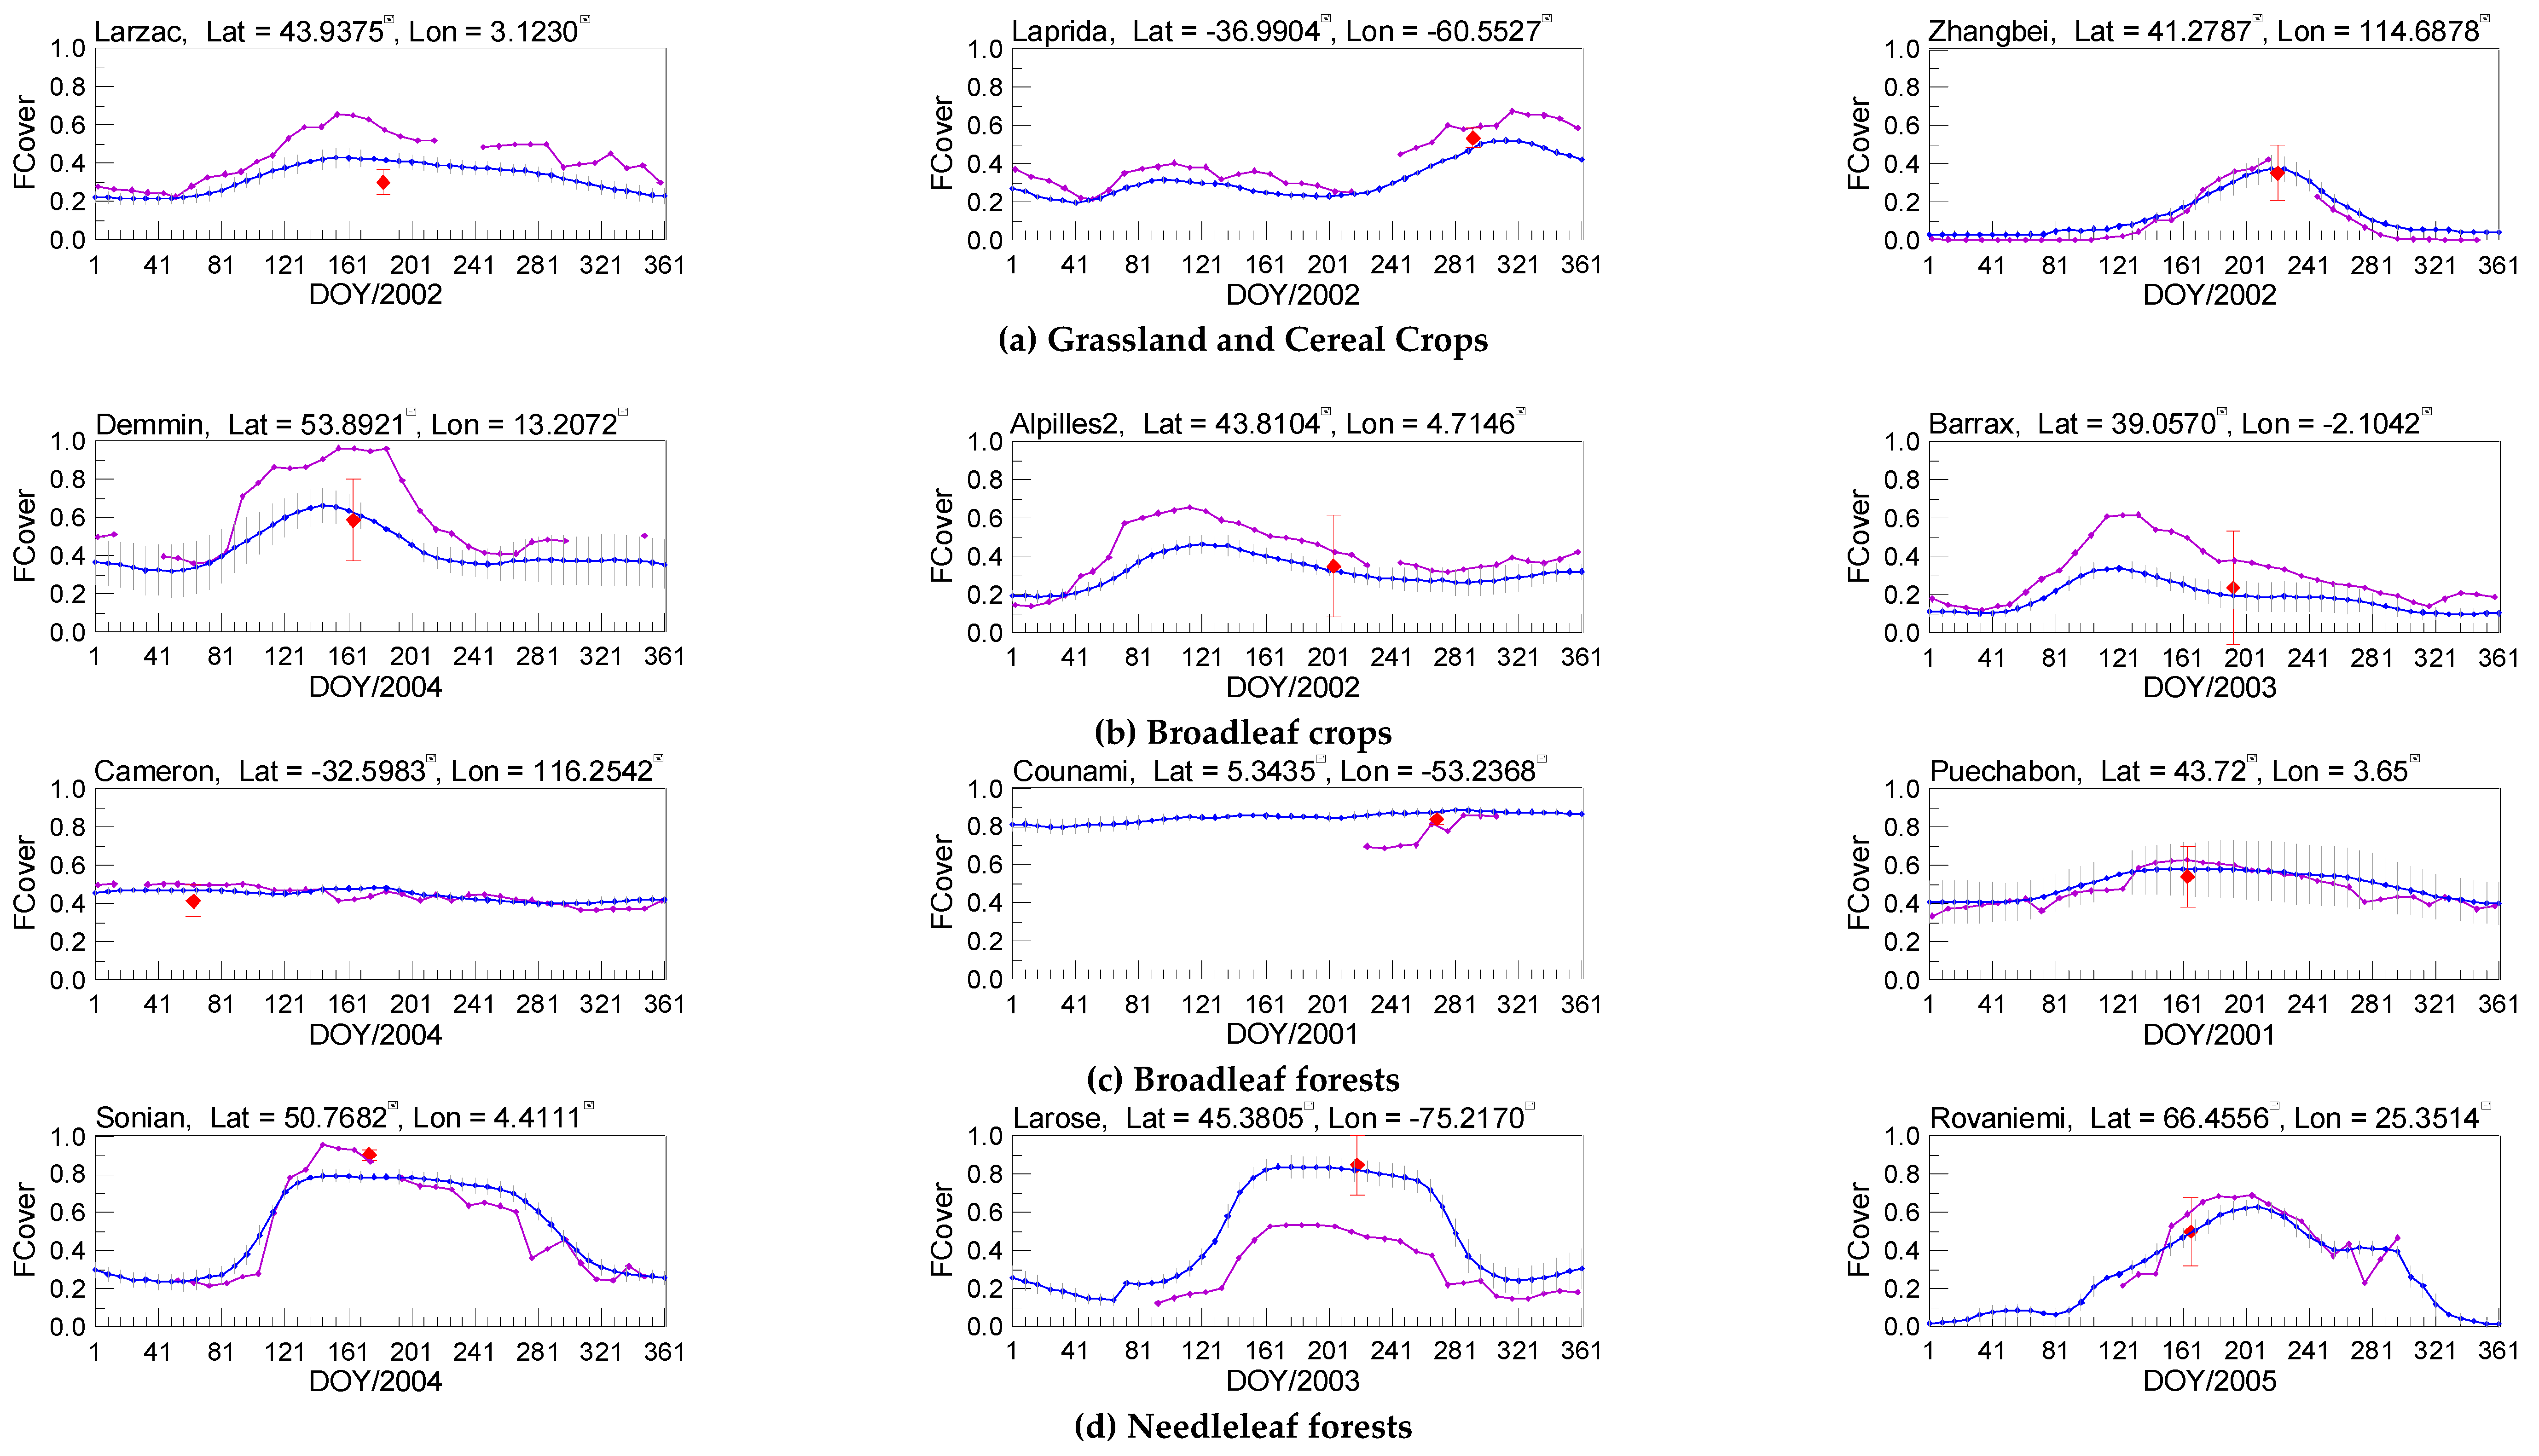
4.1.2. Temporal Consistency
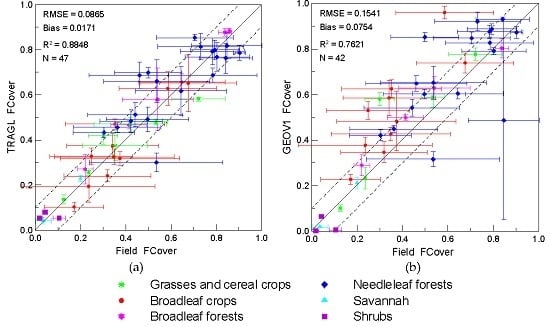
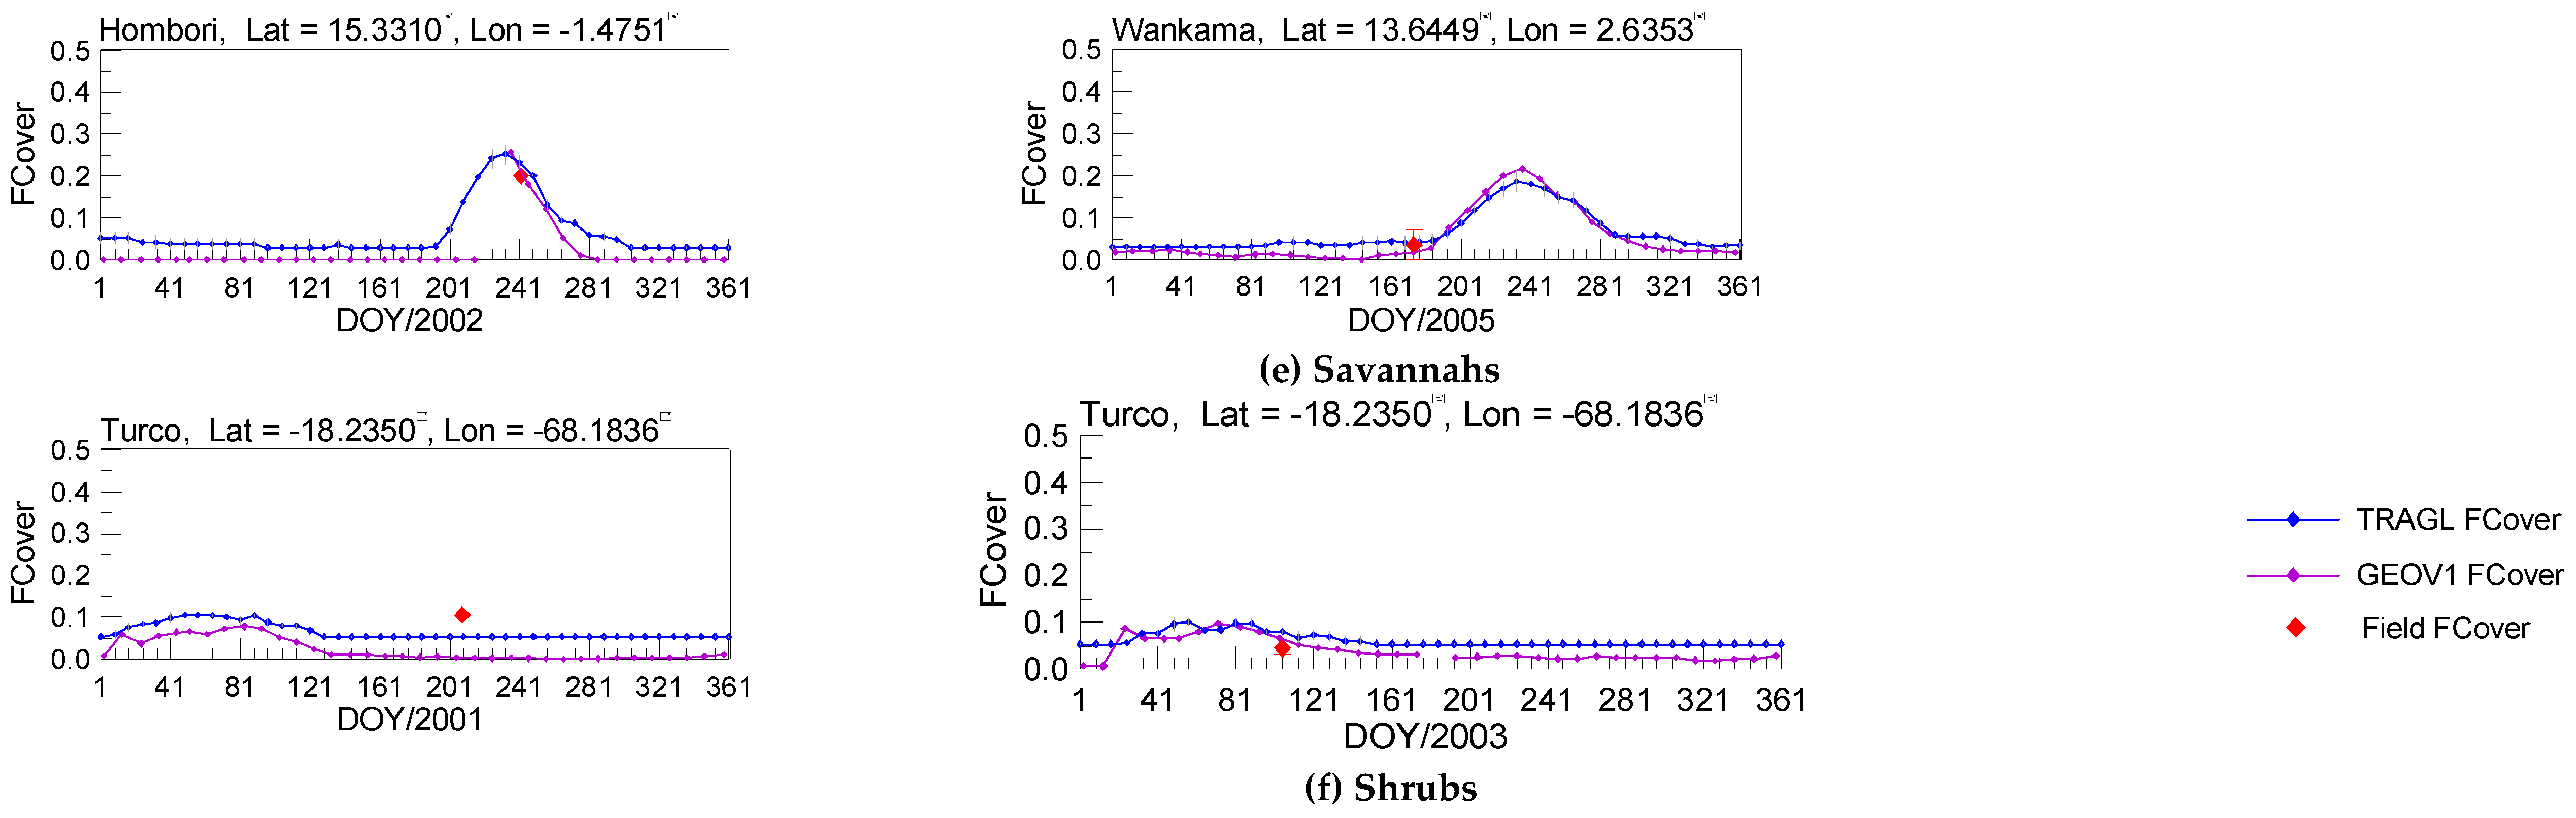
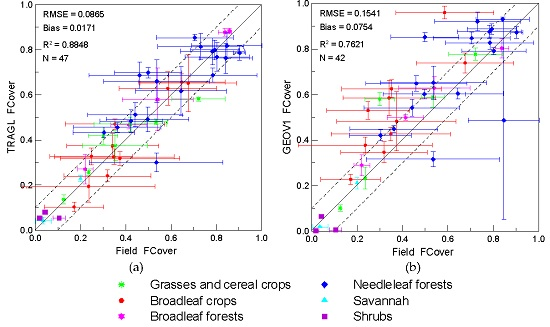
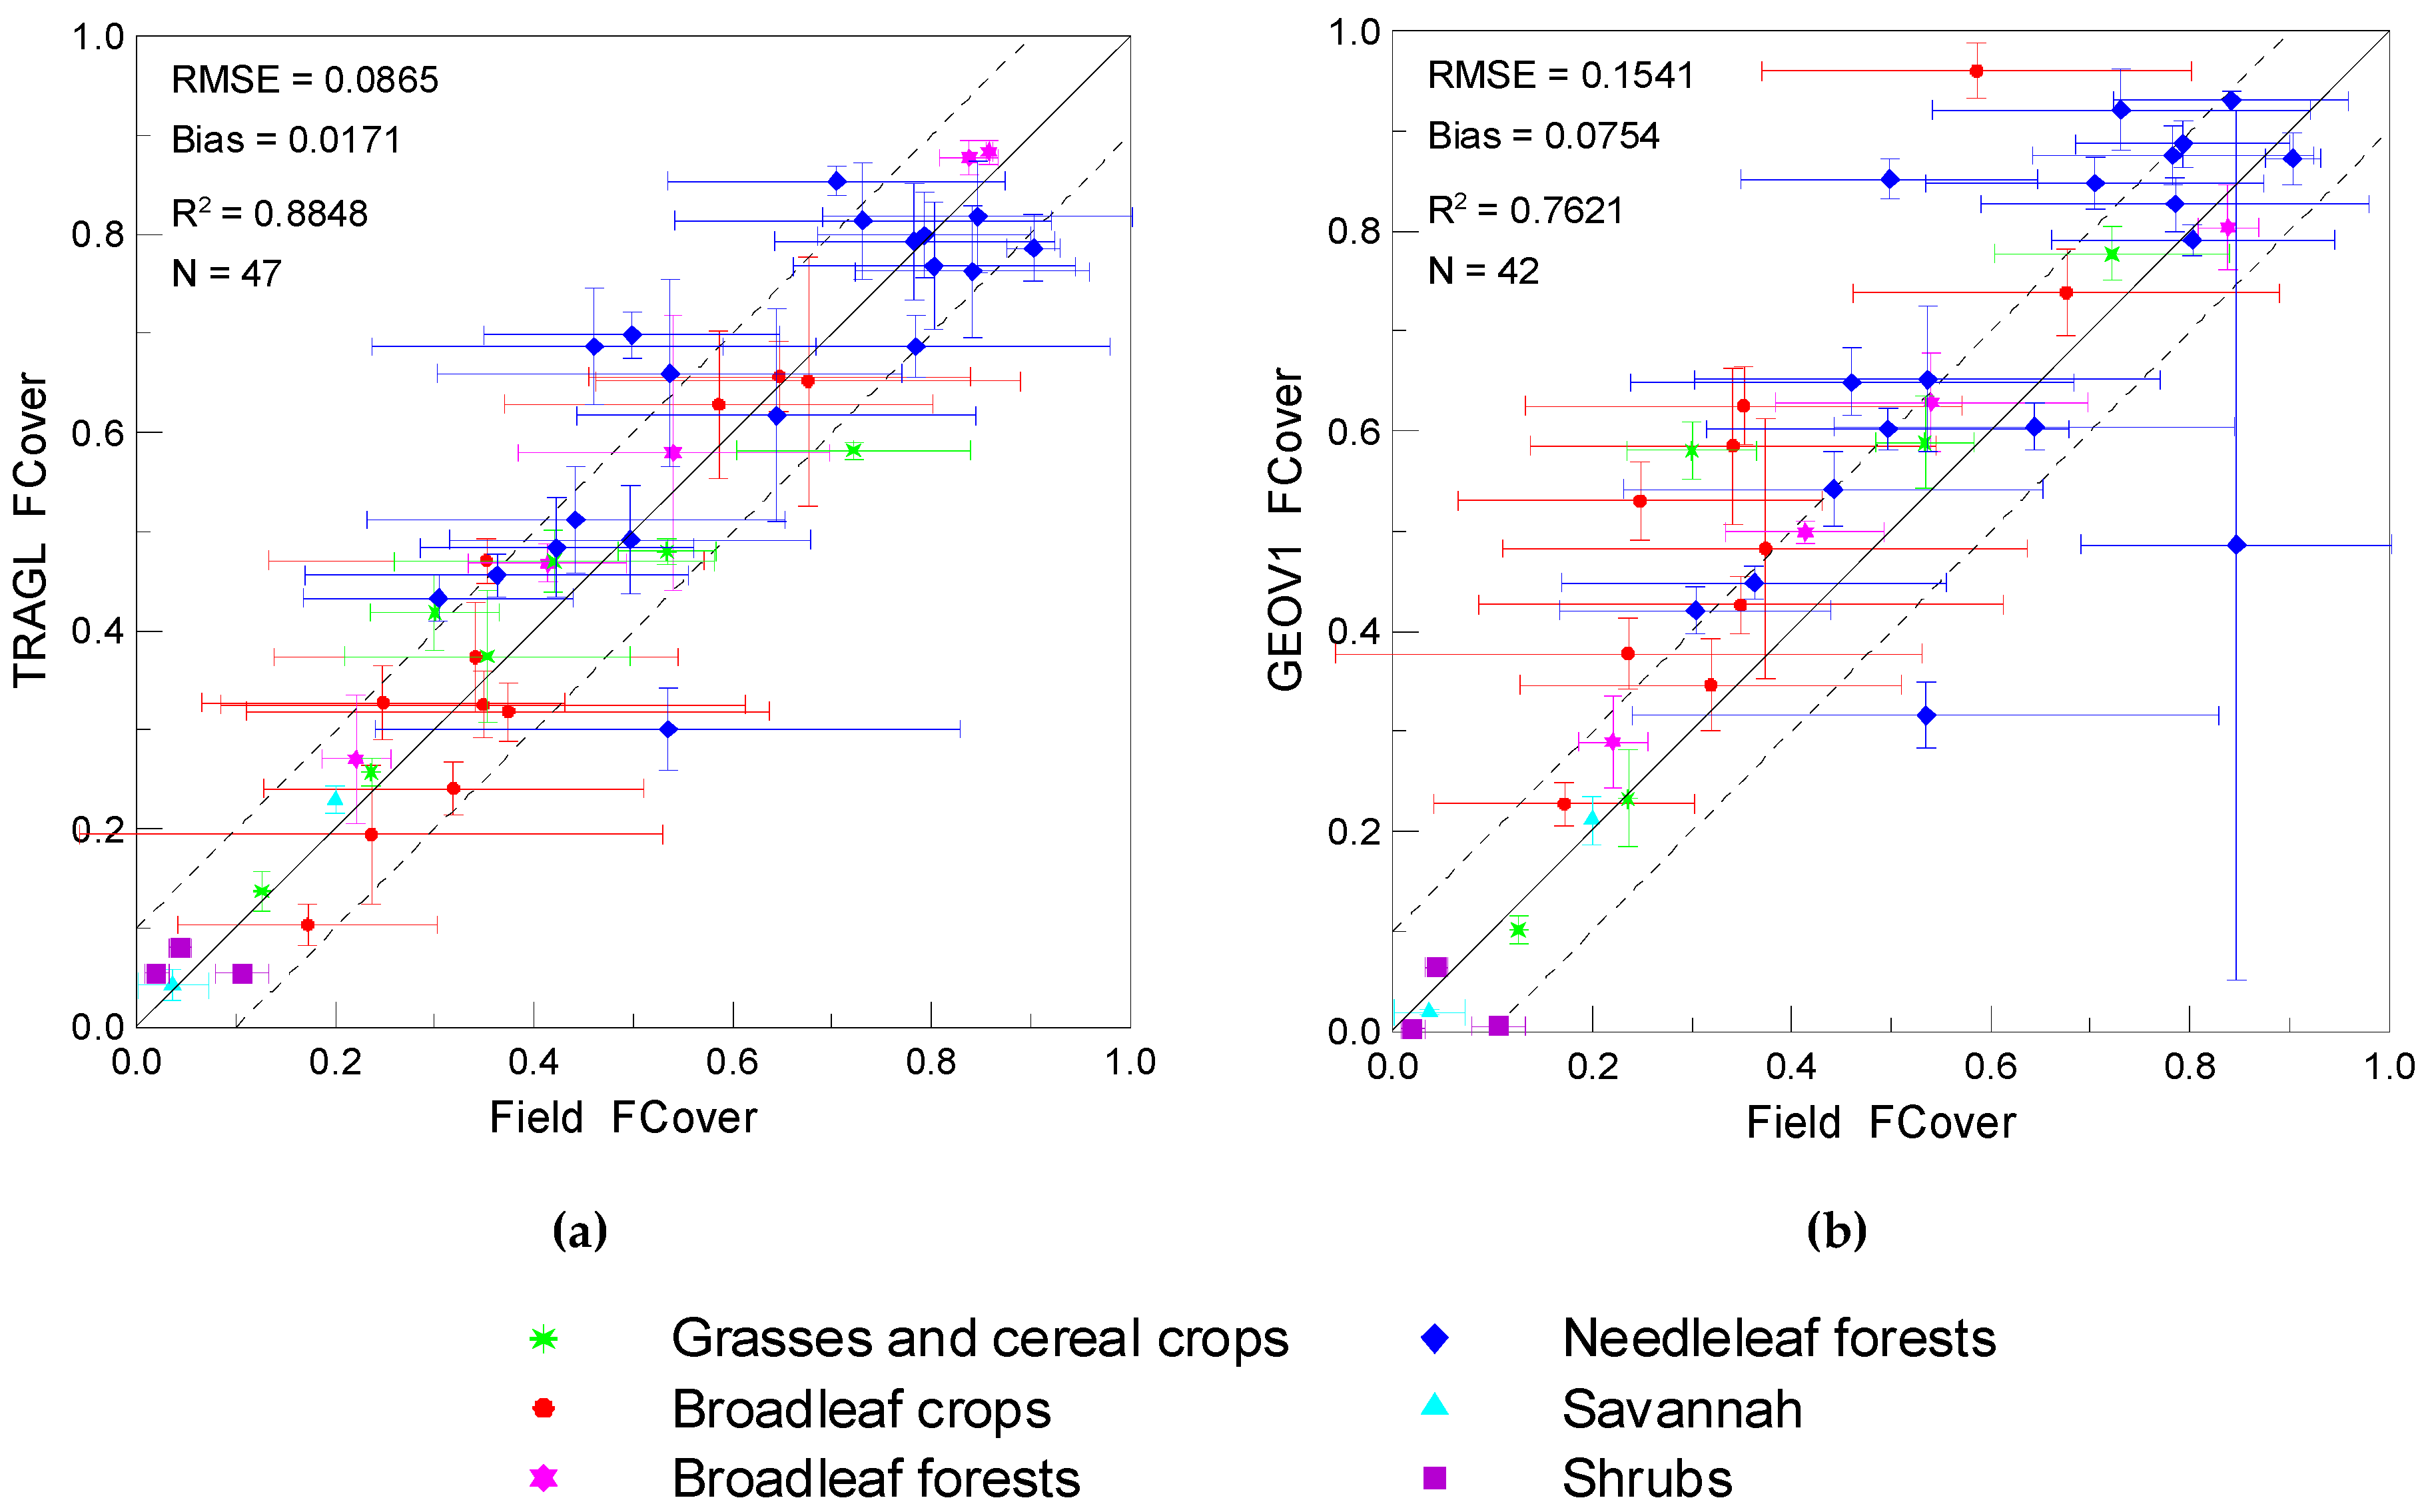
4.2. Direct Validation
5. Discussions
6. Conclusions
Acknowledgments
Author Contributions
Conflicts of Interest
References
- Gutman, G.; Ignatov, A. The derivation of the green vegetation fraction from NOAA/AVHRR data for use in numerical weather prediction models. Int. J. Remote Sens. 1998, 19, 1533–1543. [Google Scholar] [CrossRef]
- Zeng, X.B.; Dickinson, R.E.; Walker, A.; Shaikh, M.; DeFries, R.S.; Qi, J. Derivation and evaluation of global 1-km fractional vegetation cover data for land modeling. J. Appl. Meteorol. 2000, 39, 826–839. [Google Scholar] [CrossRef]
- Baret, F.; Hagolle, O.; Geiger, B.; Bicheron, P.; Miras, B.; Huc, M.; Berthelot, B.; Nio, F.; Weiss, M.; Samain, O.; et al. LAI, fAPAR and fCover CYCLOPES global products derived from VEGETATION: Part 1: Principles of the algorithm. Remote Sens. Environ. 2007, 110, 275–286. [Google Scholar] [CrossRef]
- Jia, K.; Liang, S.; Liu, S.; Li, Y.; Xiao, Z.; Yao, Y.; Jiang, Bo.; Zhao, X.; Wang, X.; Xu, S.; Cui, J. Global land surface fractional vegetation cover estimation using general regression neural networks from MODIS surface reflectance. IEEE Trans. Geosci. Remote Sens. 2015, 53, 4787–4796. [Google Scholar] [CrossRef]
- Zhang, X.; Liao, C.; Li, J.; Sun, Q. Fractional vegetation cover estimation in arid and semi-arid environments using HJ-1 satellite hyperspectral data. Int. J. Appl. Earth Observ. Geoinf. 2013, 21, 506–512. [Google Scholar] [CrossRef]
- Roujean, J.L.; Lacaze, R. Global mapping of vegetation parameters from POLDER multiangular measurements for studies of surfaceatmosphere interactions: A pragmatic method and its validation. J. Geophys. Res. Atmos. 2002, 107. [Google Scholar] [CrossRef]
- Baret, F.; Weiss, M.; Lacaze, R.; Camacho, F.; Makhmara, H.; Pacholcyzk, P.; Smets, B. GEOV1: LAI and FAPAR essential climate variables and FCOVER global time series capitalizing over existing products. Part 1: Principles of development and production. Remote Sens. Environ. 2013, 137, 299–309. [Google Scholar] [CrossRef]
- Elmore, A.J.; Mustard, J.F.; Manning, S.J.; Lobell, D.B. Quantifying vegetation change in semiarid environments: Precision and accuracy of spectral mixture analysis and the normalized difference vegetation index. Remote Sens. Environ. 2000, 73, 87–102. [Google Scholar] [CrossRef]
- Hurcom, S.J.; Harrison, A.R. The NDVI and spectral decomposition for semi-arid vegetation abundance estimation. Int. J. Remote Sens. 1998, 19, 3109–3125. [Google Scholar] [CrossRef]
- Patel, N.K.; Saxena, R.K.; Shiwalkar, A.J.A.Y. Study of fractional vegetation cover using high spectral resolution data. J. Indian Soc. Remote Sens. 2007, 35, 73–79. [Google Scholar] [CrossRef]
- Gitelson, A.A.; Kaufman, Y.J.; Stark, R.; Rundquist, D. Novel algorithms for remote estimation of vegetation fraction. Remote Sens. Environ. 2002, 80, 76–87. [Google Scholar] [CrossRef]
- Peter, R.J. North Estimation of fAPAR, LAI, and vegetation fractional cover from ATSR-2 imagery. Remote Sens. Environ. 2002, 80, 114–121. [Google Scholar]
- Kenneth, M.G.; Timothy, M.; Lynn, F. Hyperspectral mixture modeling for quantifying sparse vegetation cover in arid environments. Remote Sens. Environ. 2000, 72, 360–374. [Google Scholar]
- Theseira, M.A.; Thomas, G.; Sannier, C.A.D. An evaluation of spectral mixture modeling applied to a semi-arid environment. Int. J. Remote Sens. 2002, 23, 687–700. [Google Scholar] [CrossRef]
- Hobbs, S.E.; Thomas, G. A goodness-of-fit measure applied to spectral mixture modelling. In Image Processing: Mathematical Methods and Applications; Blackledge, J., Ed.; Oxford University Press: Oxford, UK, 1996; pp. 317–331. [Google Scholar]
- Qi, J.; Marsett, R.C.; Moran, M.S.; Goodrich, D.C.; Heilman, P.; Kerr, Y.H.; Dedieu, G.; Chehbouni, A.; Zhang, X.X. Spatial and temporal dynamics of vegetation in the San Pedro River basin area. Agric. Forest Meteorol. 2000, 105, 55–68. [Google Scholar] [CrossRef]
- Kimes, D.S.; Knyazikhin, Y.; Privette, J.L.; Abuelgasim, A.A.; Gao, F. Inversion methods for physically-based models. Remote Sens. Rev. 2000, 18, 381–439. [Google Scholar] [CrossRef]
- Bacour, C.; Baret, F.; Béal, D.; Weiss, M.; Pavageau, K. Neural network estimation of LAI, fAPAR, fCover and LAI×Cab, from top of canopy MERIS reflectance data: Principles and validation. Remote Sens. Environ. 2006, 105, 313–325. [Google Scholar] [CrossRef]
- Camacho, F.; Cernicharo, J.; Lacaze, R.; Baret, F.; Weiss, M. GEOV1: LAI, FAPAR essential climate variables and FCOVER global time series capitalizing over existing products. Part 2: Validation and intercomparison with reference products. Remote Sens. Environ. 2013, 137, 310–329. [Google Scholar] [CrossRef]
- Xiao, Z.; Liang, S.; Wang, J.; Xie, D.; Song, J.; Fensholt, R. A Framework for Consistent Estimation of Leaf Area Index, Fraction of Absorbed Photosynthetically Active Radiation, and Surface Albedo from MODIS Time-Series Data. IEEE Trans. Geosci. Remote Sens. 2015, 53, 3178–3197. [Google Scholar] [CrossRef]
- Huemmrich, K.F.; Privette, J.L.; Mukelabai, M.; Myneni, R.B.; Knyazikhin, Y. Time-series validation of MODIS land biophysical products in a Kalahari woodland, Africa. Int. J. Remote Sens. 2005, 26, 4381–4398. [Google Scholar] [CrossRef]
- Liang, S.; Zhang, X.; Xiao, Z.; Cheng, J.; Liu, Q.; Zhao, X. Global LAnd Surface Satellite (GLASS) Products: Algorithms, Validation and Analysis; Springer: New York, NY, USA, 2013. [Google Scholar]
- Liang, S.; Zhao, X.; Yuan, W.; Liu, S.; Cheng, X.; Xiao, Z.; Zhang, X.; Liu, Q.; Cheng, J.; Tang, H.; et al. A Long-term Global LAnd Surface Satellite (GLASS) Dataset for Environmental Studies. Int. J. Digital Earth 2013, 6 (Supp. 1), 5–33. [Google Scholar] [CrossRef]
- Xiao, Z.; Liang, S.; Wang, J.; Chen, P.; Yin, X.; Zhang, L.; Song, J. Use of general regression neural networks for generating the GLASS leaf area index product from time series MODIS surface reflectance. IEEE Trans. Geosci. Remote Sens. 2014, 52, 209–223. [Google Scholar] [CrossRef]
- Xiao, Z.; Liang, S.; Wang, J.; Xiang, Y.; Zhao, X.; Song, J. Long time-series Global Land Surface Satellite (GLASS) leaf area index product derived from MODIS and AVHRR data. IEEE Trans. Geosci. Remote Sens. 2015. under review. [Google Scholar]
- Pedelty, J.; Devadiga, S.; Masuoka, E.; Brown, M.; Pinzon, J.; Tucker, C.; Vermote, E.; Prince, S.; Nagol, J.; Justice, C.; et al. Generating a long-term land data record from the AVHRR and MODIS instruments. IEEE Int. Geosci. Remote Sens. Symp. 2007. [Google Scholar] [CrossRef]
- The GLASS LAI Product at Beijing Normal University. Available online: http://www.bnu-datacenter.com/en (accessed on 25 November 2015).
- The GLASS LAI Product at the Global Land Cover Facility. Available online: http://glcf.umd.edu (accessed on 25 November 2015).
- The Copernicus Land Monitoring Services. Available online: http://land.copernicus.eu/ (accessed on 25 November 2015).
- The VALERI Validation Data. Available online: http://w3.avignon.inra.fr/valeri/ (accessed on 25 November 2015).
- Demarez, V.; Duthoit, S.; Weiss, M.; Baret, F.; Dedieu, G. Estimation of leaf area index (LAI) of wheat, maize and sunflower crops using digital hemispherical photographs. Agric. Forest Meteorol. 2008, 148, 644–655. [Google Scholar] [CrossRef]
- Morisette, J.T.; Baret, F.; Privette, J.L.; Myneni, R.B.; Nickeson, J.; Garrigues, S.; Shabanov, N.; Weiss, M.; Fernandes, R.; Leblanc, S.; et al. Validation of global moderate-resolution LAI products: A framework proposed within the CEOS Land Product Validation Subgroup. IEEE Trans. Geosci. Remote Sens. 2006, 44, 1804–1817. [Google Scholar] [CrossRef]
- Campbell, S.G.; Norman, J.M. An Introduction to Environmental Biophysics, 2nd ed.; Springer-Verlag: New York, NY, USA, 1998. [Google Scholar]
- Cukier, R.I.; Fortuin, C.M.; Schuler, K.E.; Petschek, A.G.; Schaibly, J.H. Study of the sensitivity of coupled reaction systems to uncertainties in rate coefficients: I. Theory. J. Chem. Phys. 1973, 59, 3873–3878. [Google Scholar] [CrossRef]
- Cukier, R.I.; Levine, H.B.; Schuler, K.E. Nonlinear sensitivity analysis of multiparameter model systems. J. Computat. Phys. 1978, 26, 1–42. [Google Scholar] [CrossRef]
- Saltelli, A.; Tarantola, S.; Chan, K.P.S. A quantitative model-independent method for global sensitivity analysis of model output. Technometrics 1999, 41, 39–56. [Google Scholar] [CrossRef]
- Saltelli, A. Sensitivity Analysis in Practice: A Guide to Assessing Scientific Models; Wiley: Hoboken, NJ, USA, 2004. [Google Scholar]
- Ratto, M.; Pagano, A.; Young, P. State dependent parameter metamodelling and sensitivity analysis. Comput. Phys. Commun. 2007, 177, 863–876. [Google Scholar] [CrossRef]
- He, L.; Chen, J.M.; Pisek, J.; Schaaf, C.B.; Strahler, A.H. Global clumping index map derived from the MODIS BRDF product. Remote Sens. Environ. 2012, 119, 118–130. [Google Scholar] [CrossRef]


| Site Name | Lat (°) | Lon (°) | Biome Type | Year | DOY | Mean FCover | Uncertainties of FCover |
|---|---|---|---|---|---|---|---|
| Alpilles2 | 43.8103 | 4.7146 | Broadleaf crops | 2002 | 204 | 0.349 | 0.264 |
| Barrax | 39.0569 | −2.1041 | Broadleaf crops | 2003 | 193 | 0.236 | 0.294 |
| Cameron | −32.5983 | 116.2542 | Broadleaf forests | 2004 | 63 | 0.414 | 0.079 |
| Chilbolton | 51.1640 | −1.4306 | Broadleaf crops | 2006 | 166 | 0.647 | 0.192 |
| Counami | 5.3471 | −53.2377 | Broadleaf forests | 2001 | 269 | 0.838 | 0.030 |
| 2002 | 286 | 0.858 | 0.003 | ||||
| Demmin | 53.8921 | 13.2071 | Broadleaf crops | 2004 | 164 | 0.586 | 0.215 |
| Donga | 9.7701 | 1.7783 | Grasses and cereal crops | 2005 | 172 | 0.423 | 0.161 |
| Fundulea | 44.4061 | 26.5830 | Broadleaf crops | 2001 | 128 | 0.341 | 0.203 |
| 2002 | 144 | 0.374 | 0.263 | ||||
| 2003 | 144 | 0.319 | 0.192 | ||||
| Gilching | 48.0818 | 11.3204 | Broadleaf crops | 2002 | 199 | 0.676 | 0.214 |
| Gnangara | −31.5338 | 115.8823 | Broadleaf forests | 2004 | 61 | 0.221 | 0.035 |
| Gourma | 15.3247 | −1.5546 | Grasses and cereal crops | 2000 | 244 | 0.236 | |
| 2001 | 275 | 0.126 | |||||
| Haouz | 31.6592 | −7.6002 | Broadleaf crops | 2003 | 71 | 0.248 | 0.182 |
| Hirsikangas | 62.6438 | 27.0114 | Needleleaf forests | 2003 | 226 | 0.644 | 0.201 |
| 2004 | 190 | 0.537 | 0.234 | ||||
| 2005 | 159 | 0.442 | 0.210 | ||||
| Hombori | 15.3309 | −1.4750 | Savannah | 2002 | 242 | 0.2 | |
| Hyytiälä | 61.8513 | 24.3076 | Needleleaf forests | 2008 | 188 | 0.461 | 0.223 |
| Jarvselja | 58.2987 | 27.2622 | Needleleaf forests | 2000 | 188 | 0.705 | 0.169 |
| 2001 | 165 | 0.783 | 0.141 | ||||
| 2002 | 178 | 0.793 | 0.108 | ||||
| 2003 | 208 | 0.803 | 0.142 | ||||
| 2005 | 180 | 0.842 | 0.118 | ||||
| 2007 | 112 | 0.535 | 0.295 | ||||
| 2007 | 199 | 0.731 | 0.189 | ||||
| Laprida | −36.9904 | −60.5526 | Grasses and cereal crops | 2001 | 311 | 0.722 | 0.117 |
| 2002 | 292 | 0.534 | 0.049 | ||||
| Larose | 45.3804 | −75.2170 | Needleleaf forests | 2003 | 219 | 0.847 | 0.156 |
| Larzac | 43.9375 | 3.1229 | Grasses and cereal crops | 2002 | 183 | 0.3 | 0.065 |
| Nezer | 44.5679 | −1.0382 | Needleleaf forests | 2000 | 211 | 0.499 | 0.149 |
| 2001 | 99 | 0.363 | 0.193 | ||||
| 2001 | 175 | 0.785 | 0.194 | ||||
| 2002 | 107 | 0.304 | 0.136 | ||||
| Plan-de-Dieu | 44.1986 | 4.9481 | Broadleaf crops | 2004 | 189 | 0.172 | 0.130 |
| Puéchabon | 43.7245 | 3.6519 | Broadleaf forest | 2001 | 164 | 0.54 | 0.157 |
| Rovaniemi | 66.4556 | 25.3514 | Needleleaf forests | 2004 | 161 | 0.423 | 0.137 |
| 2005 | 166 | 0.497 | 0.182 | ||||
| Sonian | 50.7681 | 4.4110 | Needleleaf forests | 2004 | 174 | 0.903 | 0.028 |
| Sud_Ouest | 43.5062 | 1.2375 | Broadleaf crops | 2002 | 189 | 0.352 | 0.219 |
| Turco | −18.2350 | −68.1836 | Shrubs | 2001 | 208 | 0.106 | 0.026 |
| 2002 | 240 | 0.02 | 0.013 | ||||
| 2003 | 105 | 0.044 | 0.011 | ||||
| Wankama | 13.6449 | 2.6353 | Savannah | 2005 | 174 | 0.036 | 0.035 |
| Zhang_Bei | 41.2787 | 114.6877 | Grasses and cereal crops | 2002 | 221 | 0.353 | 0.143 |
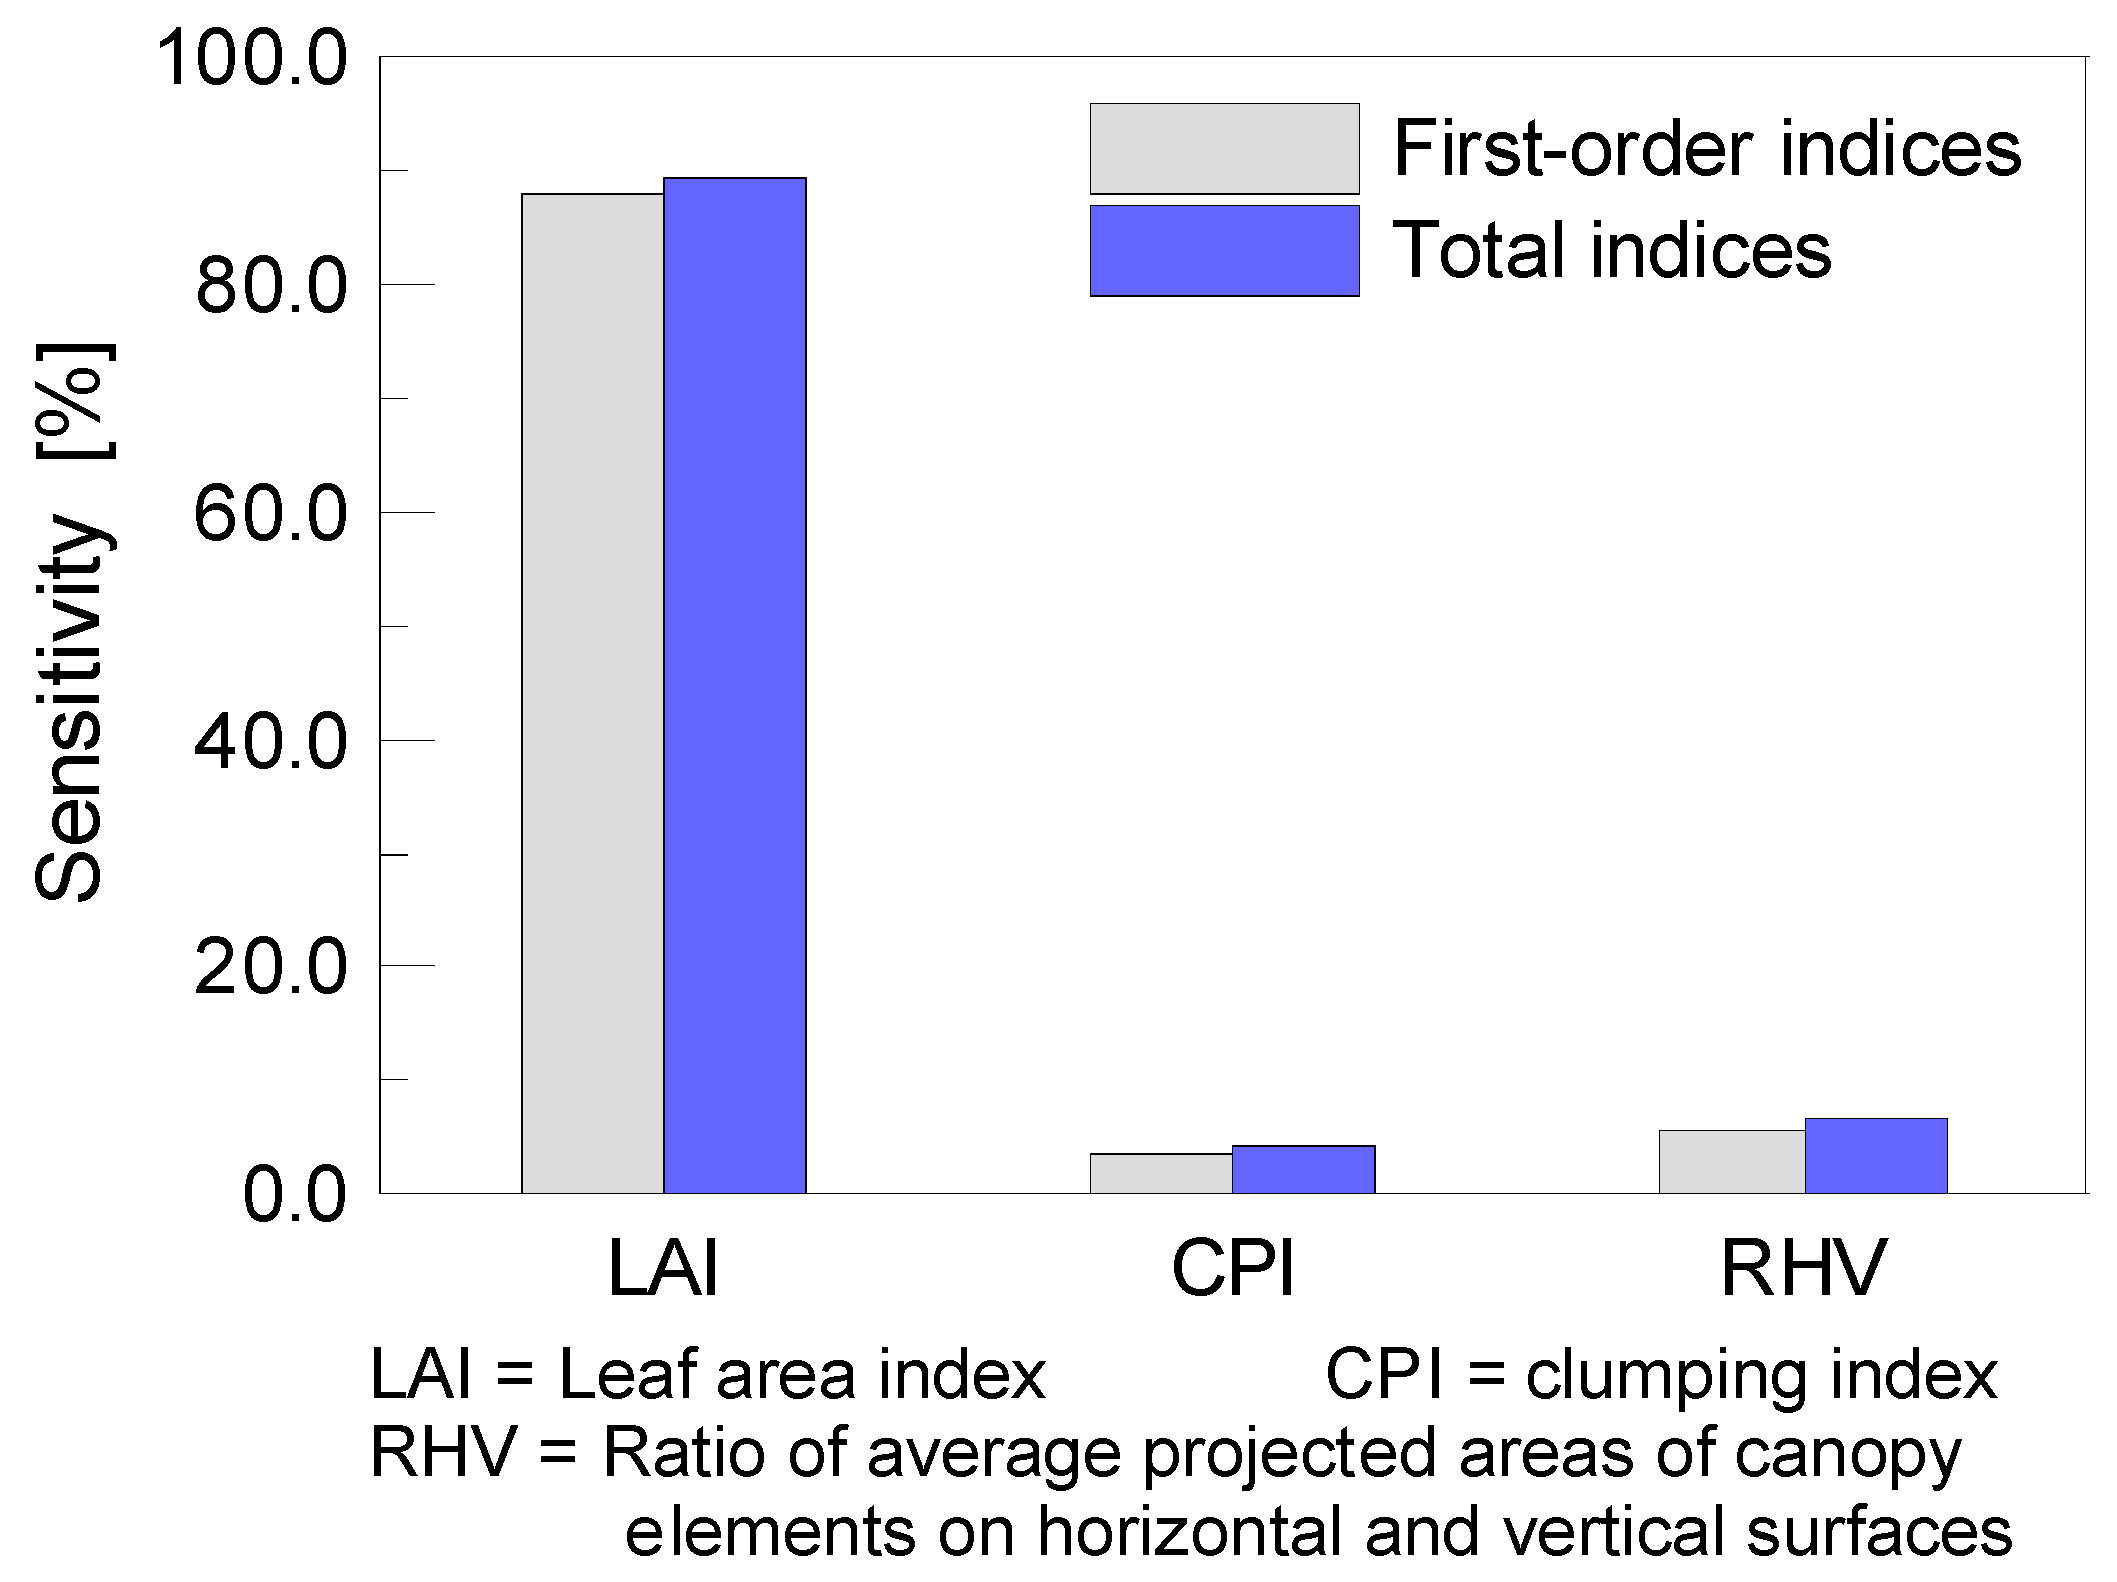
| Factors | Unit | Range of Variation | Distribution |
|---|---|---|---|
| Leaf area index | m2/m2 | [0, 8] | uniform |
| Clumping index | -- | [0.5, 1.0] | uniform |
| Solar zenith angle | Degrees | 0.0 | -- |
| Absorptivity of leaves | -- | 1.0 | -- |
| Ratio of average projected areas of canopy elements on horizontal and vertical surfaces | -- | [0.5, 2.0] | uniform |
| Month | GCC | SHB | SVN | EBF | DBF | ENF | DNF |
|---|---|---|---|---|---|---|---|
| Jan | 985,636 | 451,663 | 641,547 | 372,828 | 128,491 | 55,625 | 4510 |
| Feb | 1,025,756 | 451,616 | 641,364 | 357,647 | 122,924 | 78,354 | 788 |
| Mar | 1,178,315 | 455,838 | 648,645 | 364,684 | 153,906 | 85,715 | 2804 |
| Apr | 1,350,668 | 458,903 | 690,889 | 374,780 | 231,431 | 219,956 | 11,055 |
| May | 1,397,863 | 588,449 | 895,854 | 360,526 | 253,126 | 325,827 | 85,608 |
| Jun | 1,456,798 | 1,058,810 | 946,856 | 357,754 | 251,286 | 336,228 | 88,049 |
| Jul | 1,524,155 | 1,094,476 | 930,176 | 362,374 | 246,499 | 339,242 | 88,050 |
| Aug | 1,501,161 | 1,094,436 | 904,858 | 368,948 | 245,460 | 337,507 | 88,050 |
| Sep | 1,555,865 | 1,094,892 | 942,266 | 391,350 | 250,847 | 340,780 | 88,050 |
| Oct | 1,470,197 | 866,052 | 944,379 | 401,671 | 253,335 | 341,358 | 87,477 |
| Nov | 1,383,669 | 486,386 | 729,848 | 380,965 | 235,894 | 242,110 | 21,725 |
| Dec | 1,161,229 | 454,034 | 654,806 | 360,736 | 173,795 | 87,783 | 6812 |
© 2016 by the authors; licensee MDPI, Basel, Switzerland. This article is an open access article distributed under the terms and conditions of the Creative Commons by Attribution (CC-BY) license (http://creativecommons.org/licenses/by/4.0/).
Share and Cite
Xiao, Z.; Wang, T.; Liang, S.; Sun, R. Estimating the Fractional Vegetation Cover from GLASS Leaf Area Index Product. Remote Sens. 2016, 8, 337. https://doi.org/10.3390/rs8040337
Xiao Z, Wang T, Liang S, Sun R. Estimating the Fractional Vegetation Cover from GLASS Leaf Area Index Product. Remote Sensing. 2016; 8(4):337. https://doi.org/10.3390/rs8040337
Chicago/Turabian StyleXiao, Zhiqiang, Tongtong Wang, Shunlin Liang, and Rui Sun. 2016. "Estimating the Fractional Vegetation Cover from GLASS Leaf Area Index Product" Remote Sensing 8, no. 4: 337. https://doi.org/10.3390/rs8040337
APA StyleXiao, Z., Wang, T., Liang, S., & Sun, R. (2016). Estimating the Fractional Vegetation Cover from GLASS Leaf Area Index Product. Remote Sensing, 8(4), 337. https://doi.org/10.3390/rs8040337