Article

Determining Fire Dates and Locating Ignition Points With Satellite Data

1
Centro de Estudos Florestais, Instituto Superior de Agronomia, Universidade de Lisboa, Tapada da Ajuda, 1349-017 Lisboa, Portugal
2
Instituto Dom Luís, Faculdade de Ciências da Universidade de Lisboa, Campo Grande Edifício C8, Piso 3, 1749-016 Lisboa, Portugal
3
Centre for Environmental Risk Management of Bushfires, University of Wollongong, Wollongong, NSW 2522, Australia
4
Department of Environmental and Natural Resources Management, University of Patras, Seferi 2, Agrinio GR-30100, Greece
*
Author to whom correspondence should be addressed.
Remote Sens. 2016, 8(4), 326; https://doi.org/10.3390/rs8040326
Submission received: 15 February 2016 / Revised: 5 April 2016 / Accepted: 11 April 2016 / Published: 13 April 2016

Abstract

:
Each wildfire has its own “history”, burns under specific conditions and leads to unique environmental impacts. Information on where and when it has started and its duration is important to improve understanding on the dynamics of individual wildfires. This information is typically included in fire databases that are known to have: (i) multiple error sources; (ii) limited spatial coverage and/or time span, and; (iii) often unknown accuracy and uncertainty. Satellite data have a large potential to reduce such limitations. We used active fire data from the MODerate Resolution Imaging Spectroradiometer (MODIS) to estimate fire start/end dates and ignition location(s) for large wildfires that occurred in Alaska, Portugal, Greece, California and southeastern Australia. We assessed the agreement between satellite-derived estimates and data from fire databases, and determined the associated uncertainty. Fire dates and ignition location(s) were estimated for circa 76% of the total burnt area extent for the five study regions. The ability to estimate fire dates and ignitions from satellite data increased with fire size. The agreement between reported and estimated fire dates was very good for start dates (Model efficiency index, MEF = 0.91) and reasonable for end dates (MEF = 0.73). The spatio-temporal agreement between reported and satellite-derived wildfire ignitions showed temporal lags and distances within 12 h and 2 km, respectively. Uncertainties associated with ignition estimates were generally larger than the disagreements with data reported in fire databases. Our results show how satellite data can contribute to improve information regarding dates and ignitions of large wildfires. This contribution can be particularly relevant in regions with scarce fire information, while in well-documented areas it can be used to complement, potentially detect, and correct inconsistencies in existing fire databases. Using data from other existing and/or upcoming satellites should significantly contribute to reduce errors and uncertainties in satellite-derived fire dates and ignitions, as well as improve coverage of small fires.

Graphical Abstract

1. Introduction

Wildfires play a major role in ecosystem dynamics and pose as an important threat to lives, human and natural resources of fire-prone regions. At the global and regional levels, the causes and consequences of wildfires are typically integrated over large areas and long time periods [1]. However, at the landscape level, each wildfire is a distinct event with its own “history”, ignited and burning under specific fuel and weather conditions, ultimately leading to unique social and ecological impacts [2,3].
The identification of individual fire events has been acknowledged as necessary to better understand how fire extent and frequency affect global environmental processes [2,4]. Characterizing individual wildfires is relevant to identify associated causes [5,6], to understand the factors controlling fire occurrence [7,8], to estimate fire risk [9], characterize fire regime [10], to understand the complex interactions between fire spread and its main drivers [11], to estimate carbon emissions [12] and assess fire-related impacts [13]. Improving the quality and quantity of the information regarding individual wildfires has important implications for fire suppression and management, and for improvement of prevention policies [5,7].
To study a specific wildfire event, it is crucial to know where and when it started (i.e., ignition location and timing) and how long it lasted (i.e., duration). The fire start and end dates partially determine the weather and fuel conditions under which a wildfire occurs and consequently its behavior, size [11,14,15], severity of effects [13] and consequent pyrogenic emissions [12]. Ignition location strongly influences fire spread [16], extent and intensity, due to the interaction with weather, fuels and topography [14,17].
Fires can be characterized using different sources of information, such as field data collected by various agencies, fire-occurrence records and remotely sensed data (air- and space-borne) [18]. These data sources vary in spatial and temporal resolutions, time period covered, and accuracy. Fire atlases have been widely used and contain information regarding the location and date of each fire event, among other relevant attributes [19]. However, these databases are incomplete and affected by multiple error sources, such as: incorrect database compilation; incorrect location assignment; data acquisition errors; ambiguous recording of events; data loss or misplacement; inadequate documentation; multiple recording of the same fire event [6,8,10,19,20,21,22]. As a result, accuracy of the information contained in fire databases varies in space and time and is largely unknown [2,10,18,22].
Acquiring individual fire data in the field is expensive, time consuming and difficult, especially in remote areas [2,23]. Information collected and compiled by land management authorities depends on the resources allocated, which vary in time and space [10,22]. Consequently, the accuracy and extent of total burned area mapped, and of fire ignition location, as well as the timing of ignition and extinction included in fire databases can be lower than is desirable. Thus, it is important to improve the quality and availability of fire event data, including the timing of fire occurrence and ignition location.
Satellite data have clear advantages over other fire data sources that may complement existing information and overcome some of the traditional limitations [6,23], that are dependent on the scale of application [2]. In fact, satellite data have been widely used for fire management and research, particularly due to the size, duration and inaccessibility of many wildfires [2]. Despite this, they have seldom been used to study individual fire events, with some exceptions aimed at mapping/monitoring fire occurrence [24,25,26], reconstructing fire progression [27,28,29,30], analyzing fire behavior [31,32], estimating fire-related emissions [33] and identify lightning-ignited fires [6]. In the United States of America (USA), satellite data have been used by land managers to complement existing fire data and aid management efforts [19]. Nevertheless, one should bear in mind that satellite data have many limitations and uncertainties that need to be taken into account (for in-depth discussions see [2,6,23,29]).
Some authors have used satellite data to study the dynamics of individual wildfires [6,28,29]. Nevertheless, a comprehensive evaluation of the potential use of satellite data to detect wildfire ignitions is still missing, as well as a broad scale analysis of the potential of satellite data to estimate the start/end dates of wildfires. Thus, the aim of the present study is to evaluate the potential of satellite data to provide reliable information regarding the start/end dates of large individual wildfires, as well as, the location of their ignition(s). We discuss associated limitations of satellite data to (i) complement existing fire databases or (ii) to provide unprecedented information in regions with deficient fire monitoring and mapping. Finally, we quantify and analyze the uncertainty associated with satellite-derived estimates.

2. Materials and Methods

2.1. Study Areas and Fire Databases

We selected five distinct study areas: Portugal, Greece, California, Alaska and Southeastern (SE) Australia (Figure 1). Portugal, Greece and California have a Mediterranean or Mediterranean-like climatic influence with the bulk of fire activity occurring under dry summer conditions, burning mostly shrublands and temperate forests [10,34,35]. Extreme fire seasons occurred in 2003 and 2005 in Portugal [36,37], 2007 in Greece [38], and 2003 and 2007 in California [39,40]. The two remaining study areas, Alaska and SE Australia, have very different climatic conditions, which are naturally reflected on fuel dynamics and fire activity. In Alaska, fire activity occurs mainly during the summer, it is concentrated in the interior of the state and affects mainly boreal forests [22]. Recently, biomass burning emissions have been reported to be increasing due to climate change [41]. Alaska experienced extreme fire seasons in 2004 and 2005 [42]. In SE Australia fires occur every year, mainly during spring and summer seasons, burning mainly grasslands and dry forests [43]. As a consequence of severe droughts, SE Australia experienced extreme fire seasons in 2003 and 2009 [43,44].
The sources and time span of the databases for all the study regions are described in Table 1. The fire database for Portugal, provided by the Instituto de Conservação da Natureza e Florestas (ICNF), contains information regarding the beginning and end of each fire, as well as the location and date of ignitions for wildfires that occurred in Portugal between 2001 and 2009 using ground collected data [45]. Until the beginning of the current study, the Portuguese fire-atlas contained end-of-season annual fire perimeters from 1975 to 2009, derived from high spatial resolution satellite imagery [46].
The Alaska fire database, managed by the Alaska Interagency Coordination Center (AICC), contains a very long record of fires (since 1940) [47] derived from ground and aerial surveys, as well as through the interpretation of aerial photography and satellite data [22]. The California fire perimeters database is provided by the Department of Forestry and Fire Protection [48] and covers the entire state since 1878. Information regarding fire dates and ignitions for Alaska and California were retrieved from a comprehensive database covering the USA between 1992 and 2011 [21].
For SE Australia, we used a fire database from the New South Wales (NSW) Office of Environment and Heritage (unpublished data), containing fire perimeters, dates and ignitions since 1977. The fire perimeters for Greece were derived from high resolution satellite imagery, covering the period of 2000–2011 [49,50], while the fire dates and ignitions database covers the period of 2001–2007 (unpublished data).
The fire perimeters for all study regions were originally in vector format (polygons) and were converted to raster format. The information on fire dates and ignitions were contained within vector (points) and database formats. We performed an exploratory analysis and found suspicious records in almost all study regions, such as: (i) multiple records per burnt area (in some cases with dates separated by several months); and (ii) records located outside any fire perimeter (in some cases off by several kilometers out).We removed data records that had: (i) negative duration; (ii) incorrect or inconsistent date format; (iii) locations outside the study region; (iv) missing information about the ignition hour; or (v) very large duration (over 6 months). Data records that only contained either start or end fire date were kept while ignition records that contained only the location or the date/hour were excluded.

2.2. Satellite Data

The MODerate Resolution Imaging Spectroradiometer (MODIS) is aboard the Terra and Aqua spacecrafts, since early 2000 and mid-2002, respectively. The MODIS active fire product (MCD14ML) provides information about the location of fires burning at the time of satellite overpass based on thermal anomalies [51] and is supplied in text format. Due to the orbit of both satellites, Terra data are acquired during day and nighttime at around 10:30–12:00 a.m./p.m. local time, respectively, and Aqua data at around 1:00–3:00 a.m./p.m, respectively. The pixel size is approximately 1 km2, but its footprint size increases away from nadir reaching up to about 10 km2 [52]. An active fire can be detected even if only a small part of the pixel is burning, due to its strong radiance signal and contrast with surrounding areas [40], although only its centroid is recorded in the MCD14ML product. The footprint of each active fire was computed using the formulations of Ichoku and Kaufman [53] that relate the scan angle and Earth’s geometry with the pixel dimensions.
Additionally, we used the quality flags of the MODIS Land Surface Temperature (LST) product (MOD11A1 and MYD11A1 [54]; provided in HDF raster format) to determine if the observations were done under clear-sky conditions. The quality flags were used to estimate a proxy of cloud cover (in %) over each fire perimeter. The advantage of using the LST product is that it provides information regarding day and nighttime MODIS acquisitions for both Terra and Aqua sensors.

2.3. Wildfire Dates

To determine the start (ignition) and end (extinction) dates, we assumed that a fire event is constrained in space and time. To handle the spatial dimension of the problem, we overlapped the fire perimeters and the MODIS active fires, in spite of their very different spatial resolutions. All fire perimeters smaller than 200 ha were excluded from analysis, considering MODIS active fire detection capabilities [23]. An active fire was considered to overlap the fire perimeter if at least 5% of its footprint was within the fire perimeter.
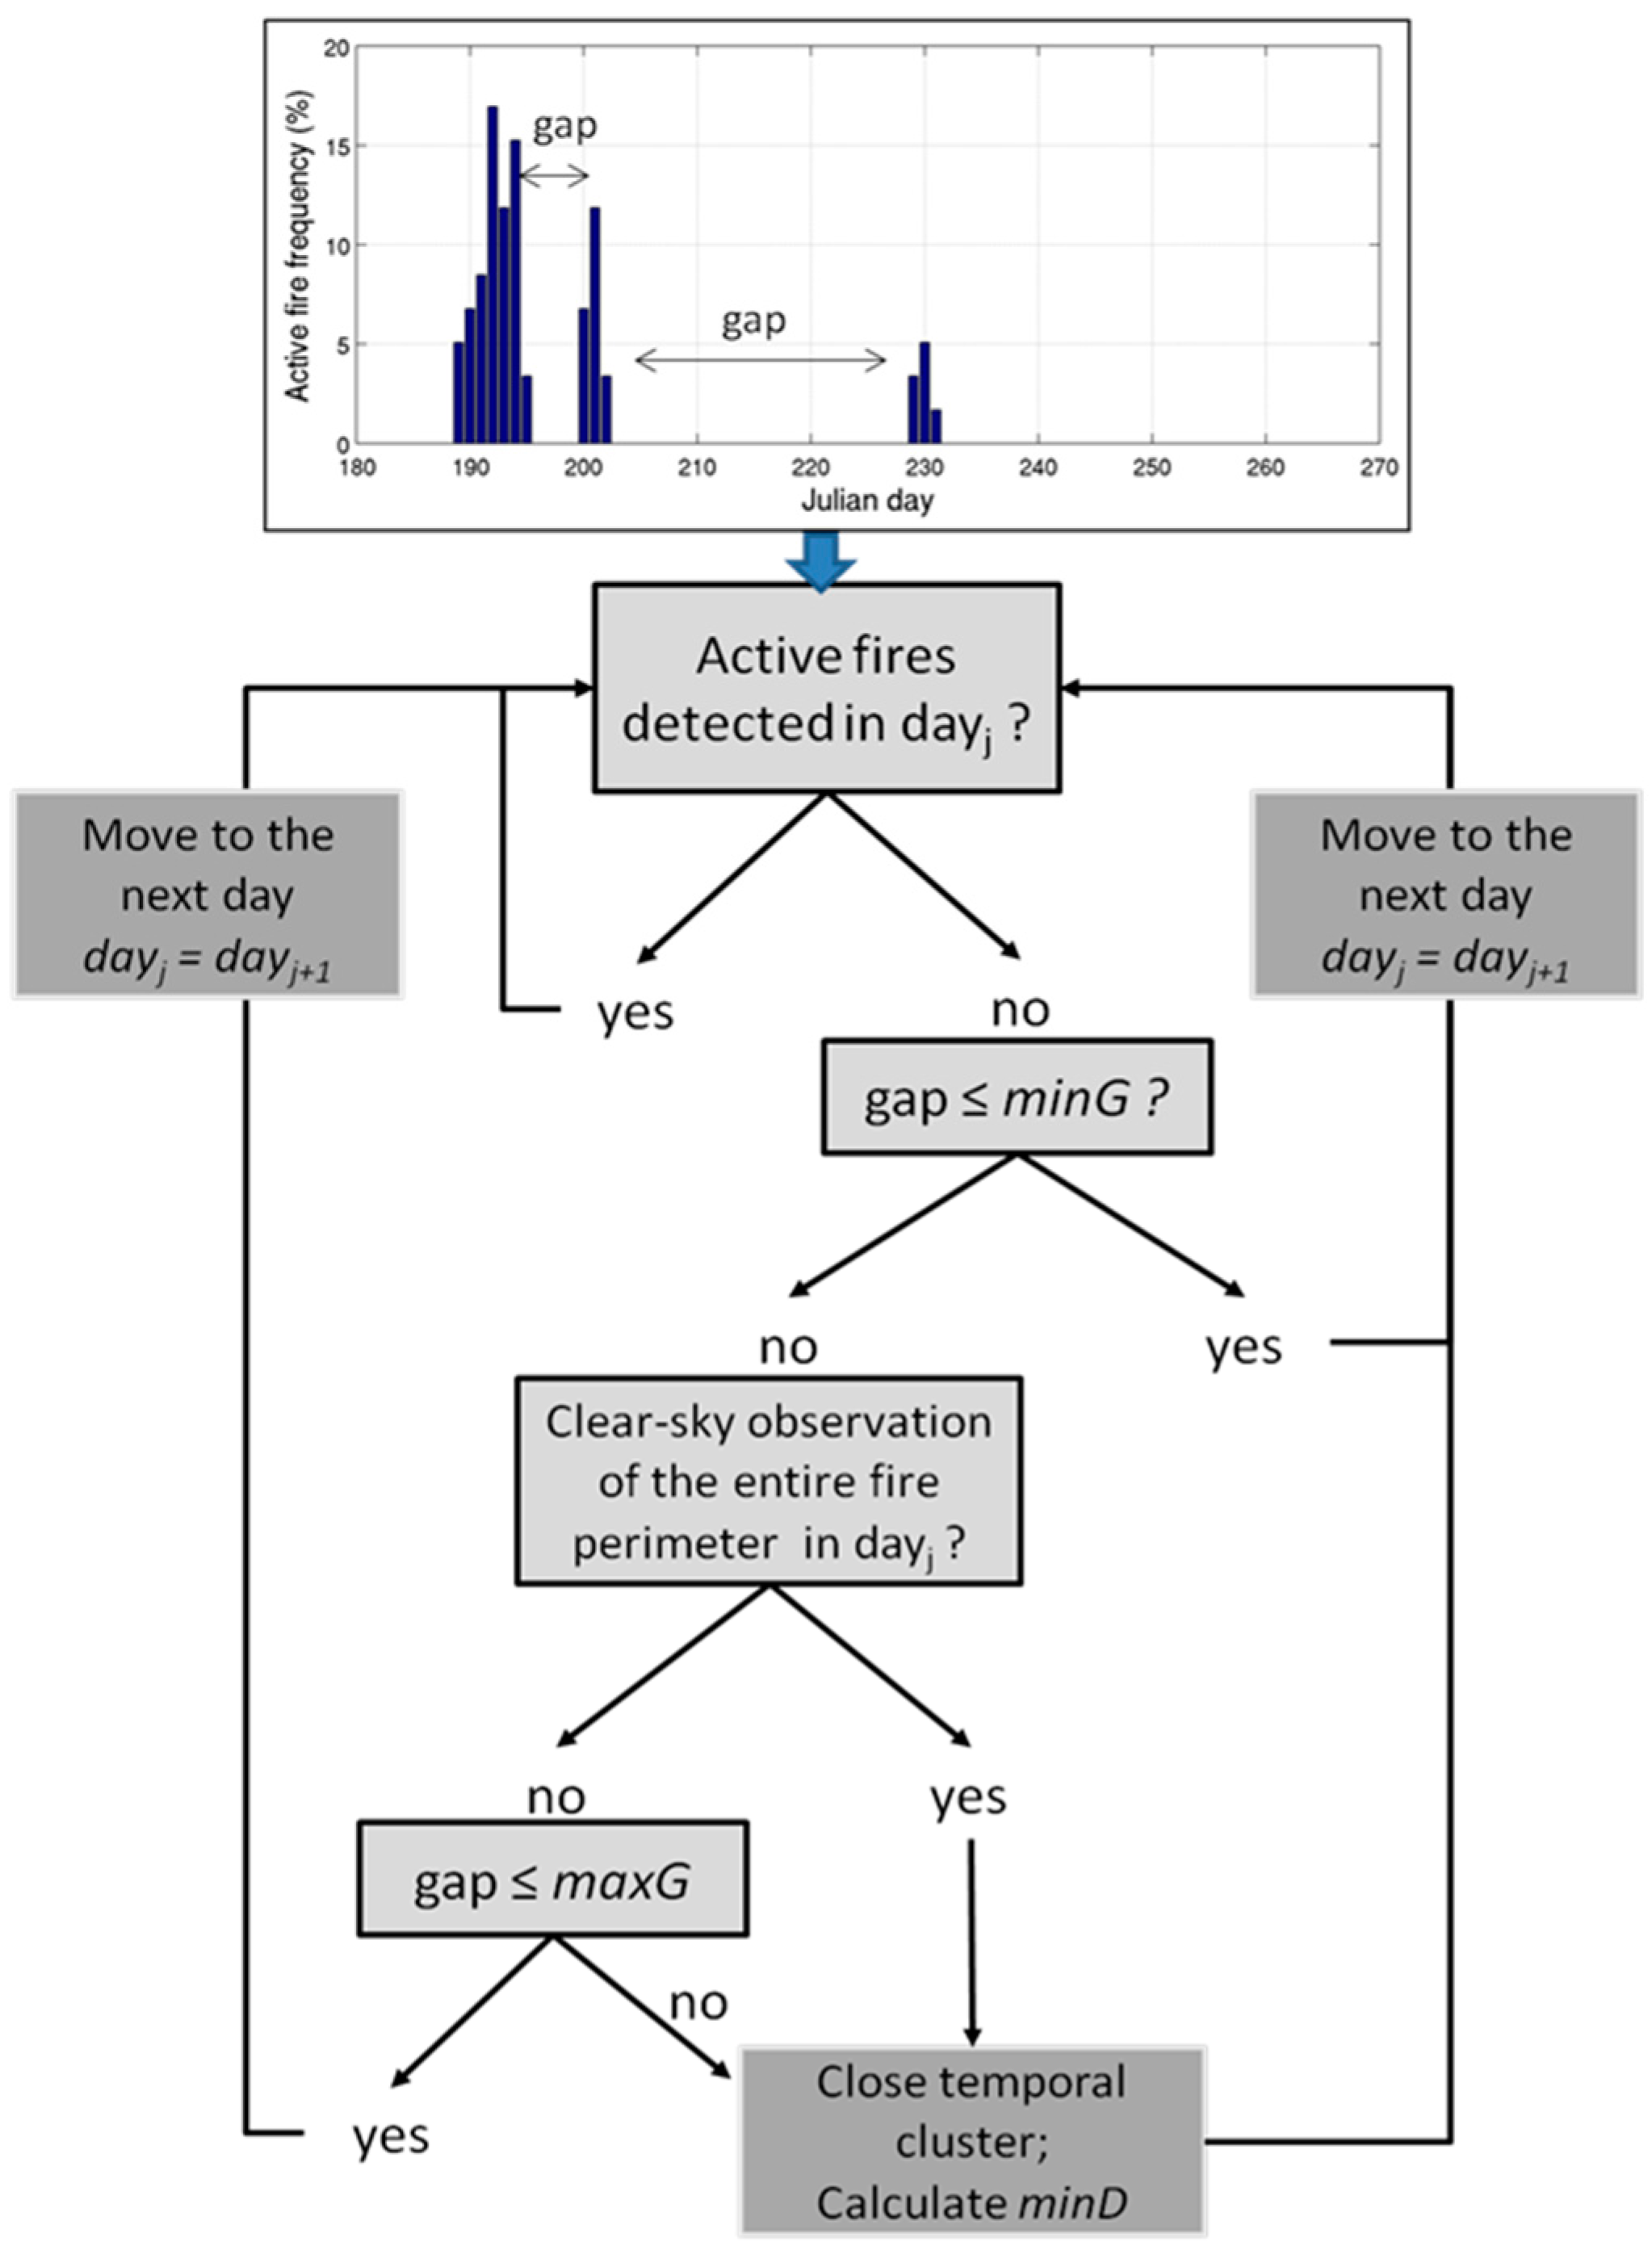
To handle the temporal dimension of the problem, we developed a temporally constrained clustering algorithm (Figure 2). For each wildfire, all active fires that overlapped its perimeter were grouped in temporal clusters based on three empirical parameters (i.e., constraints): minimum and maximum gap (minG and maxG) and minimum density of active fires (minD). The term “gap” refers to the time period without active fire detections. The term “density” refers to the fraction of active fires detected within the fire perimeter in a specific year. The main issue when clustering active fire observations was to determine whether they belonged to the same cluster, i.e., if they corresponded to the same fire event. When a time gap occurred, i.e., no active fires were detected after a group of detections, the minG parameter controlled the number of days the algorithm searched for subsequent detections and included them in the initial cluster. If no detections were found prior to minG, we used the satellite quality flags to determine if later observations were affected by smoke or clouds. The algorithm determined, each day at a time within the minG and maxG window, whether the entire fire perimeter was clearly observed by the satellite. If active fires were detected within that time window, they were merged with the initial group to form a single cluster. When all clusters were determined, we retained the cluster with the highest density (%) of active fires detected over the fire perimeter. If the density was greater than minD, the start and end dates were assigned as the dates of the first and last active fire(s) detected over the fire perimeter, respectively. Lower minD values increase the probability of assigning start and end dates to fire perimeters comprising more than one fire event.
After constraining the data in space and time, we found some ambiguous active fire detections that could belong to more than one fire perimeter. We calculated the time lag between ambiguous and non-ambiguous neighboring active fire detections. An ambiguous active fire detection was assigned to a fire perimeter based on the smallest temporal lag. If the assignment was not possible, we assigned the active fire to the perimeter with highest percentage of footprint overlap. After assigning ambiguous active fires detections, the clustering algorithm was run again.
The minG parameter was set to 2 days. The maxG and minD parameters were estimated using a simple multi-objective optimization procedure. Details are provided in Supplementary Material Section 1. The maxG and minD parameters were estimated as 9 days and 85% respectively, and were used hereafter.

2.4. Wildfire Ignitions

The first active fire(s) detected in a wildfire event were defined as its ignitions, i.e., the active fire(s) corresponding to the estimated start date (see Section 2.3). Ignitions were represented as areas, rather than points, by retaining only the part of the pixel footprint within the fire perimeter. We discarded the fire perimeters for which estimated fire start and end dates were equal.
Temporal uncertainty associated with satellite-derived ignitions was defined as the time lag between estimated ignition (i.e., start date) and the closest precedent clear-sky observation (in hours), up to a maximum of 72 h. For example, if the ignition time was estimated based on a nighttime Terra acquisition (~22 p.m.) the uncertainty was approximately 7 h if the entire fire perimeter was clearly observed during Aqua daytime acquisition (~3 p.m.). The spatial uncertainty was defined as the fraction of the total burnt area covered by the ignition area (%), i.e., how much the potential ignition area was narrowed down within the entire burnt area perimeter.

2.5. Assessment of Satellite-Derived Wildfire Dates and Ignitions

We calculated the agreement between the satellite-derived fire dates and ignitions and correspondent data reported in the fire databases. The quantitative assessment was performed based on the availability of both fire perimeters and reported data for fire dates and ignitions, independently (see Table 1). Thus, to coincide with the period of MODIS activity, only data post-2000 data were used.
Fire locations records have uncertainties and are generally imprecise [55]. As mentioned, we found several reported records located outside any fire perimeter. The assignment of the location of the closest place name (e.g., 10) is probably one of the most frequent causes of uncertainties. To minimize the impacts of incorrect geolocation that would exclude a large proportion of the data records, an empirical analysis was performed to define the optimal buffer size around a fire perimeter. Details are provided in Supplementary Material Section 2. The optimal buffer was set to 2 km.
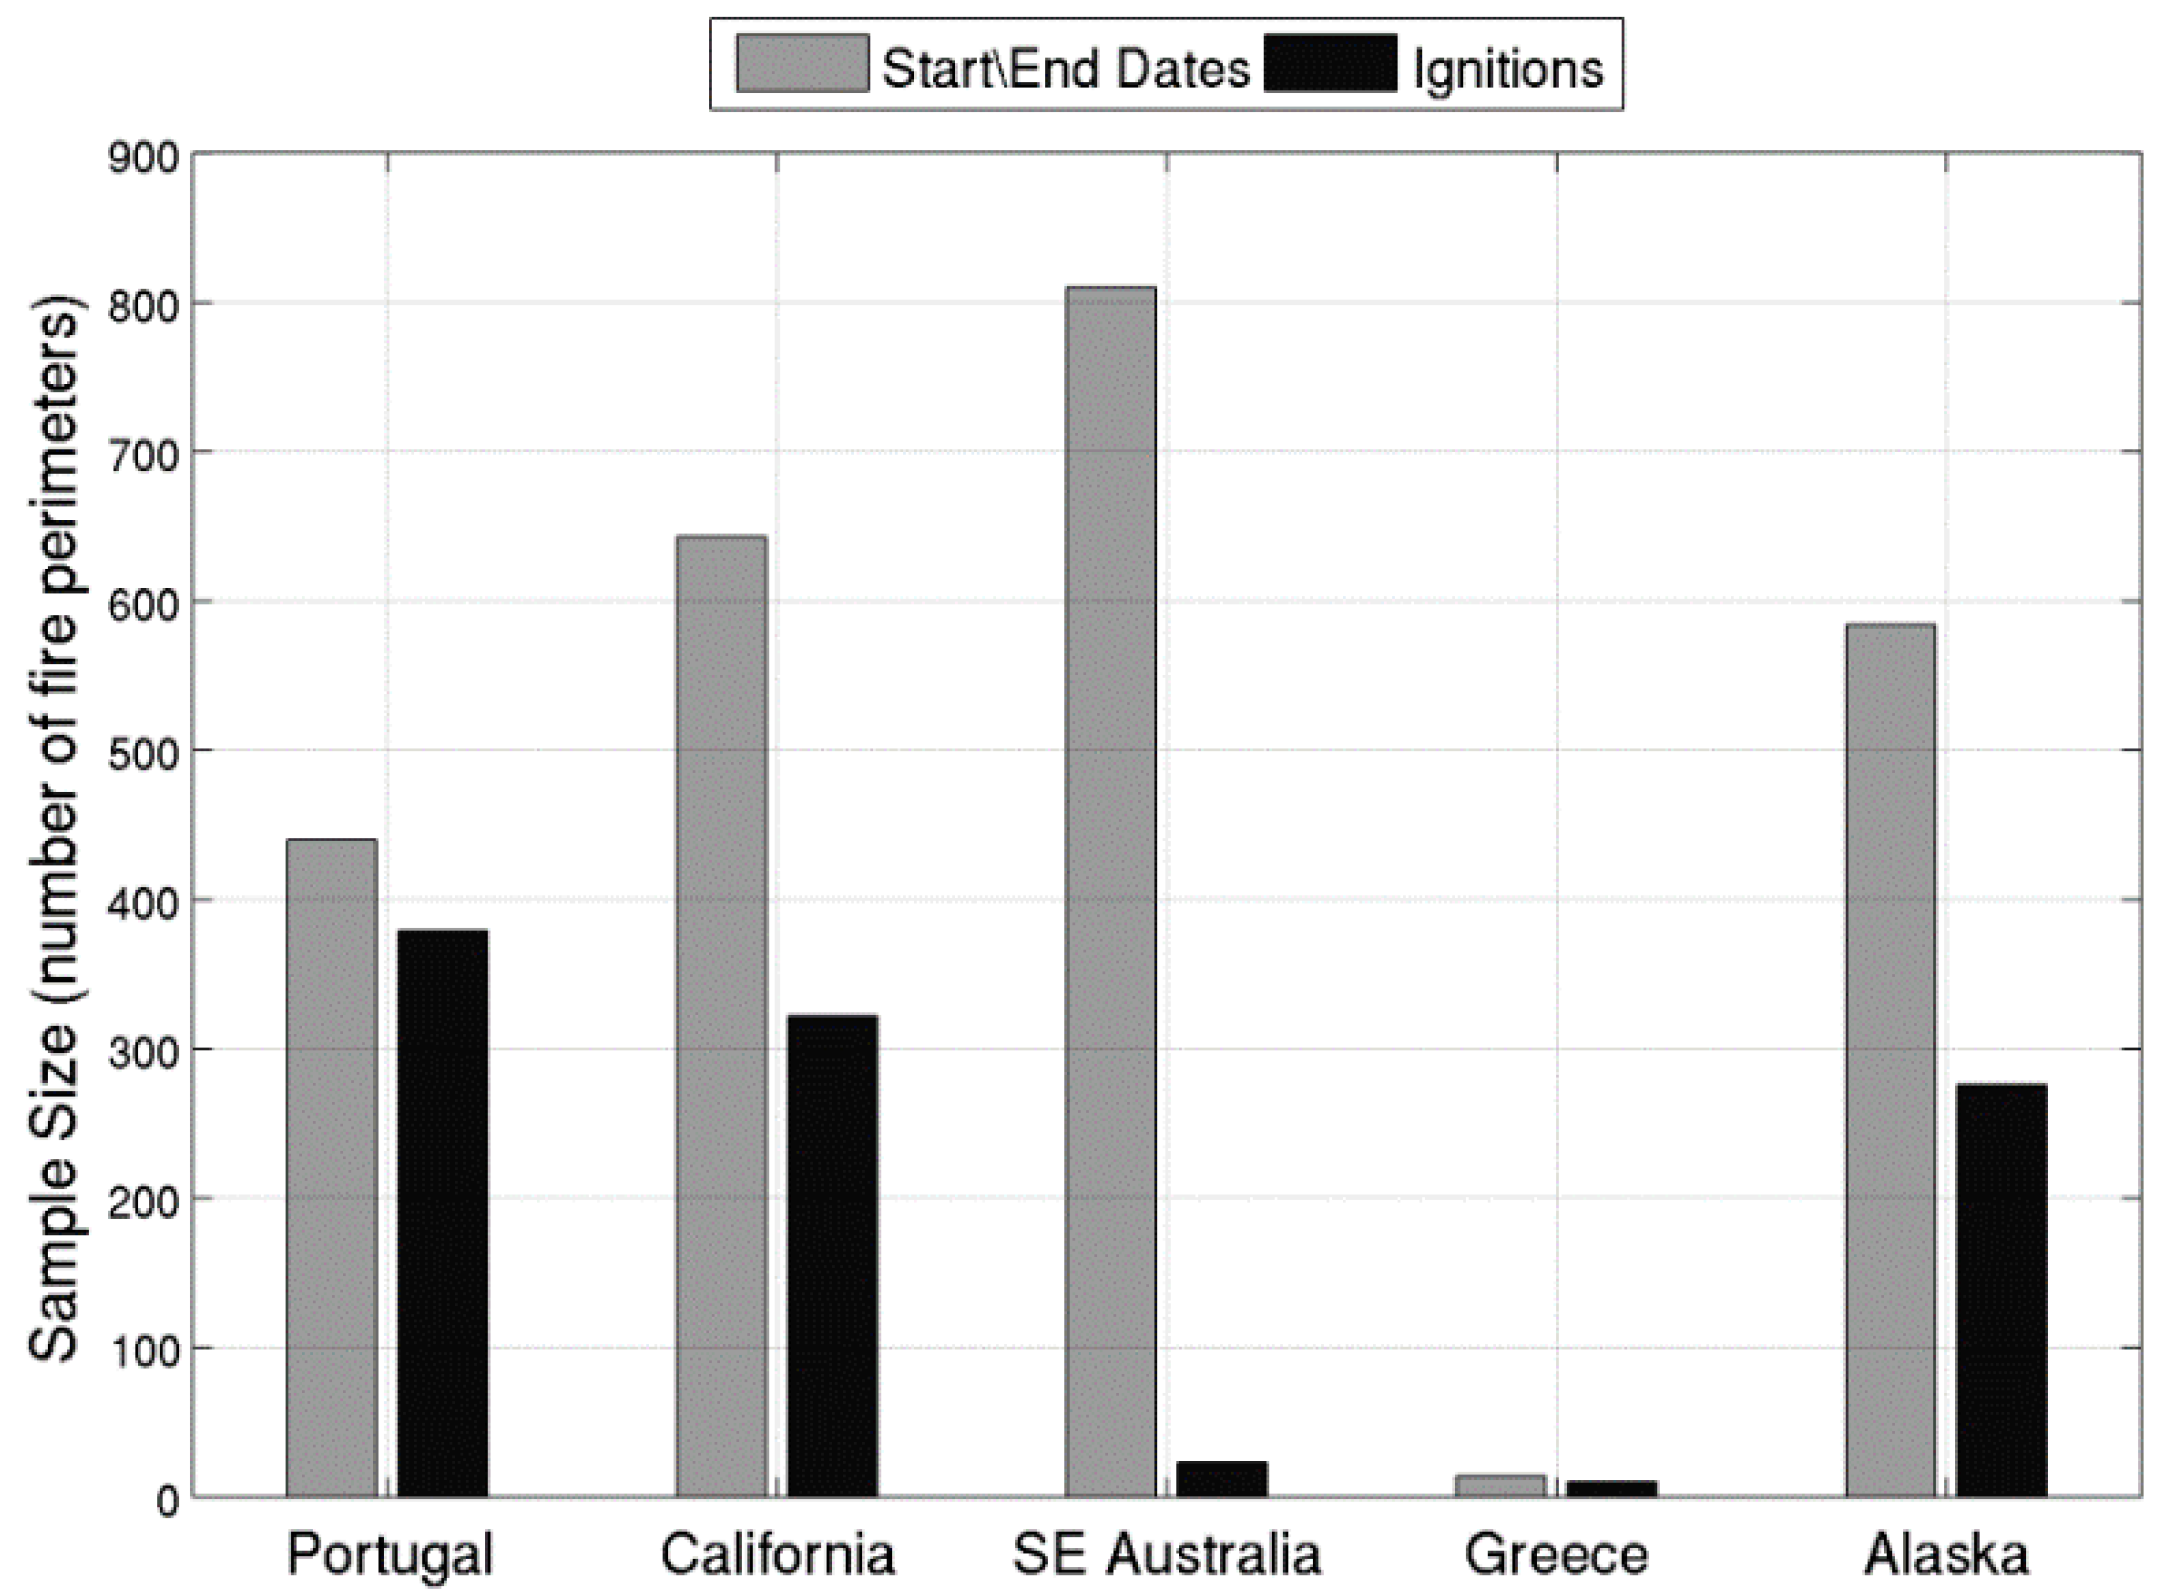
We performed an additional screening of the fire databases and removed the records that were not within the burnt area perimeter and its optimal buffer, and the records that overlaid multiple fire perimeters. Since some fires had multiple records within its perimeter e.g., [10], for each fire perimeter we performed the assessment considering only the data record with the date closest to the satellite-derived start date. For the satellite-derived ignitions assessment we narrowed down the initial evaluation sample by excluding records that had a time lag between reported and estimated start dates larger than three days. The size of the assessment dataset varied significantly among regions and for each fire parameter, due to data availability and screening procedures (Figure 3).
To assess the agreement between satellite-derived and reported fire dates we calculated the Nash–Sutcliffe Model Efficiency index (MEF) as a measure of predictive power [56]:
MEF = 1 i = 1 N ( P i O i ) 2 i = 1 N ( O i O ¯ ) 2
where, Pi and Oi denote the predicted and observed values (i.e., fire start or end dates), and O ¯ is the observed mean. The database records corresponded to the observations in Equation 1.
To assess the agreement between satellite-derived ignitions and data reported in the fire databases we calculated: (i) the temporal lag between reported and estimated ignition dates; and (ii) the minimum Euclidean distance between satellite-derived and reported ignition locations.

2.6. Limitations of Satellite Data to Derive Wildfire Dates and Ignition

The main reasons behind the inability of satellite data to provide fire date information, and consequently on their ignitions, were investigated. A decision tree was built to classify the possible cause behind the absence of satellite-derived fire dates in a step-wise fashion (Supplementary Material Section 3). For each fire perimeter without satellite-derived dates, we determined whether active fires had been detected over the fire perimeter. If not, we used the reported fire dates and identified the following potential causes:
  • Persistent cloud cover, if the average cloud cover affecting the fire perimeter between the reported start and end dates was higher than 80%.
  • Small fire, if the burnt area was smaller than 500 ha (larger than 200 ha, see Section 2.3).
  • Short duration, if the reported fire duration was shorter than 12 h.
  • Unknown, if none of the above conditions were verified.
Since the causes were determined in a step-wise fashion, a small and short duration fire was only classified as a small fire. We excluded all fire perimeters that did not have reported fire dates or that had multiple records indicating multiple fire dates.
When there were active fires detected over the fire perimeter, the following reasons may explain the inability of satellite data to provide fire date information:
5.
Insufficient information, if active fires were detected only for one satellite overpass.
6.
Multiple fire events, if the minimum frequency of the largest temporal cluster was below minD (see Section 2.3).

3. Results

3.1. The Potential of Satellite Data

Using MODIS active fire data, combined with higher spatial resolution fire perimeters, a total of 3475 (23%) fires were dated, which correspond to about 77% of the total burnt area for the five study regions. The fire ignitions were determined for 2627 (17%) fires, corresponding to about 76% of the total burnt area.
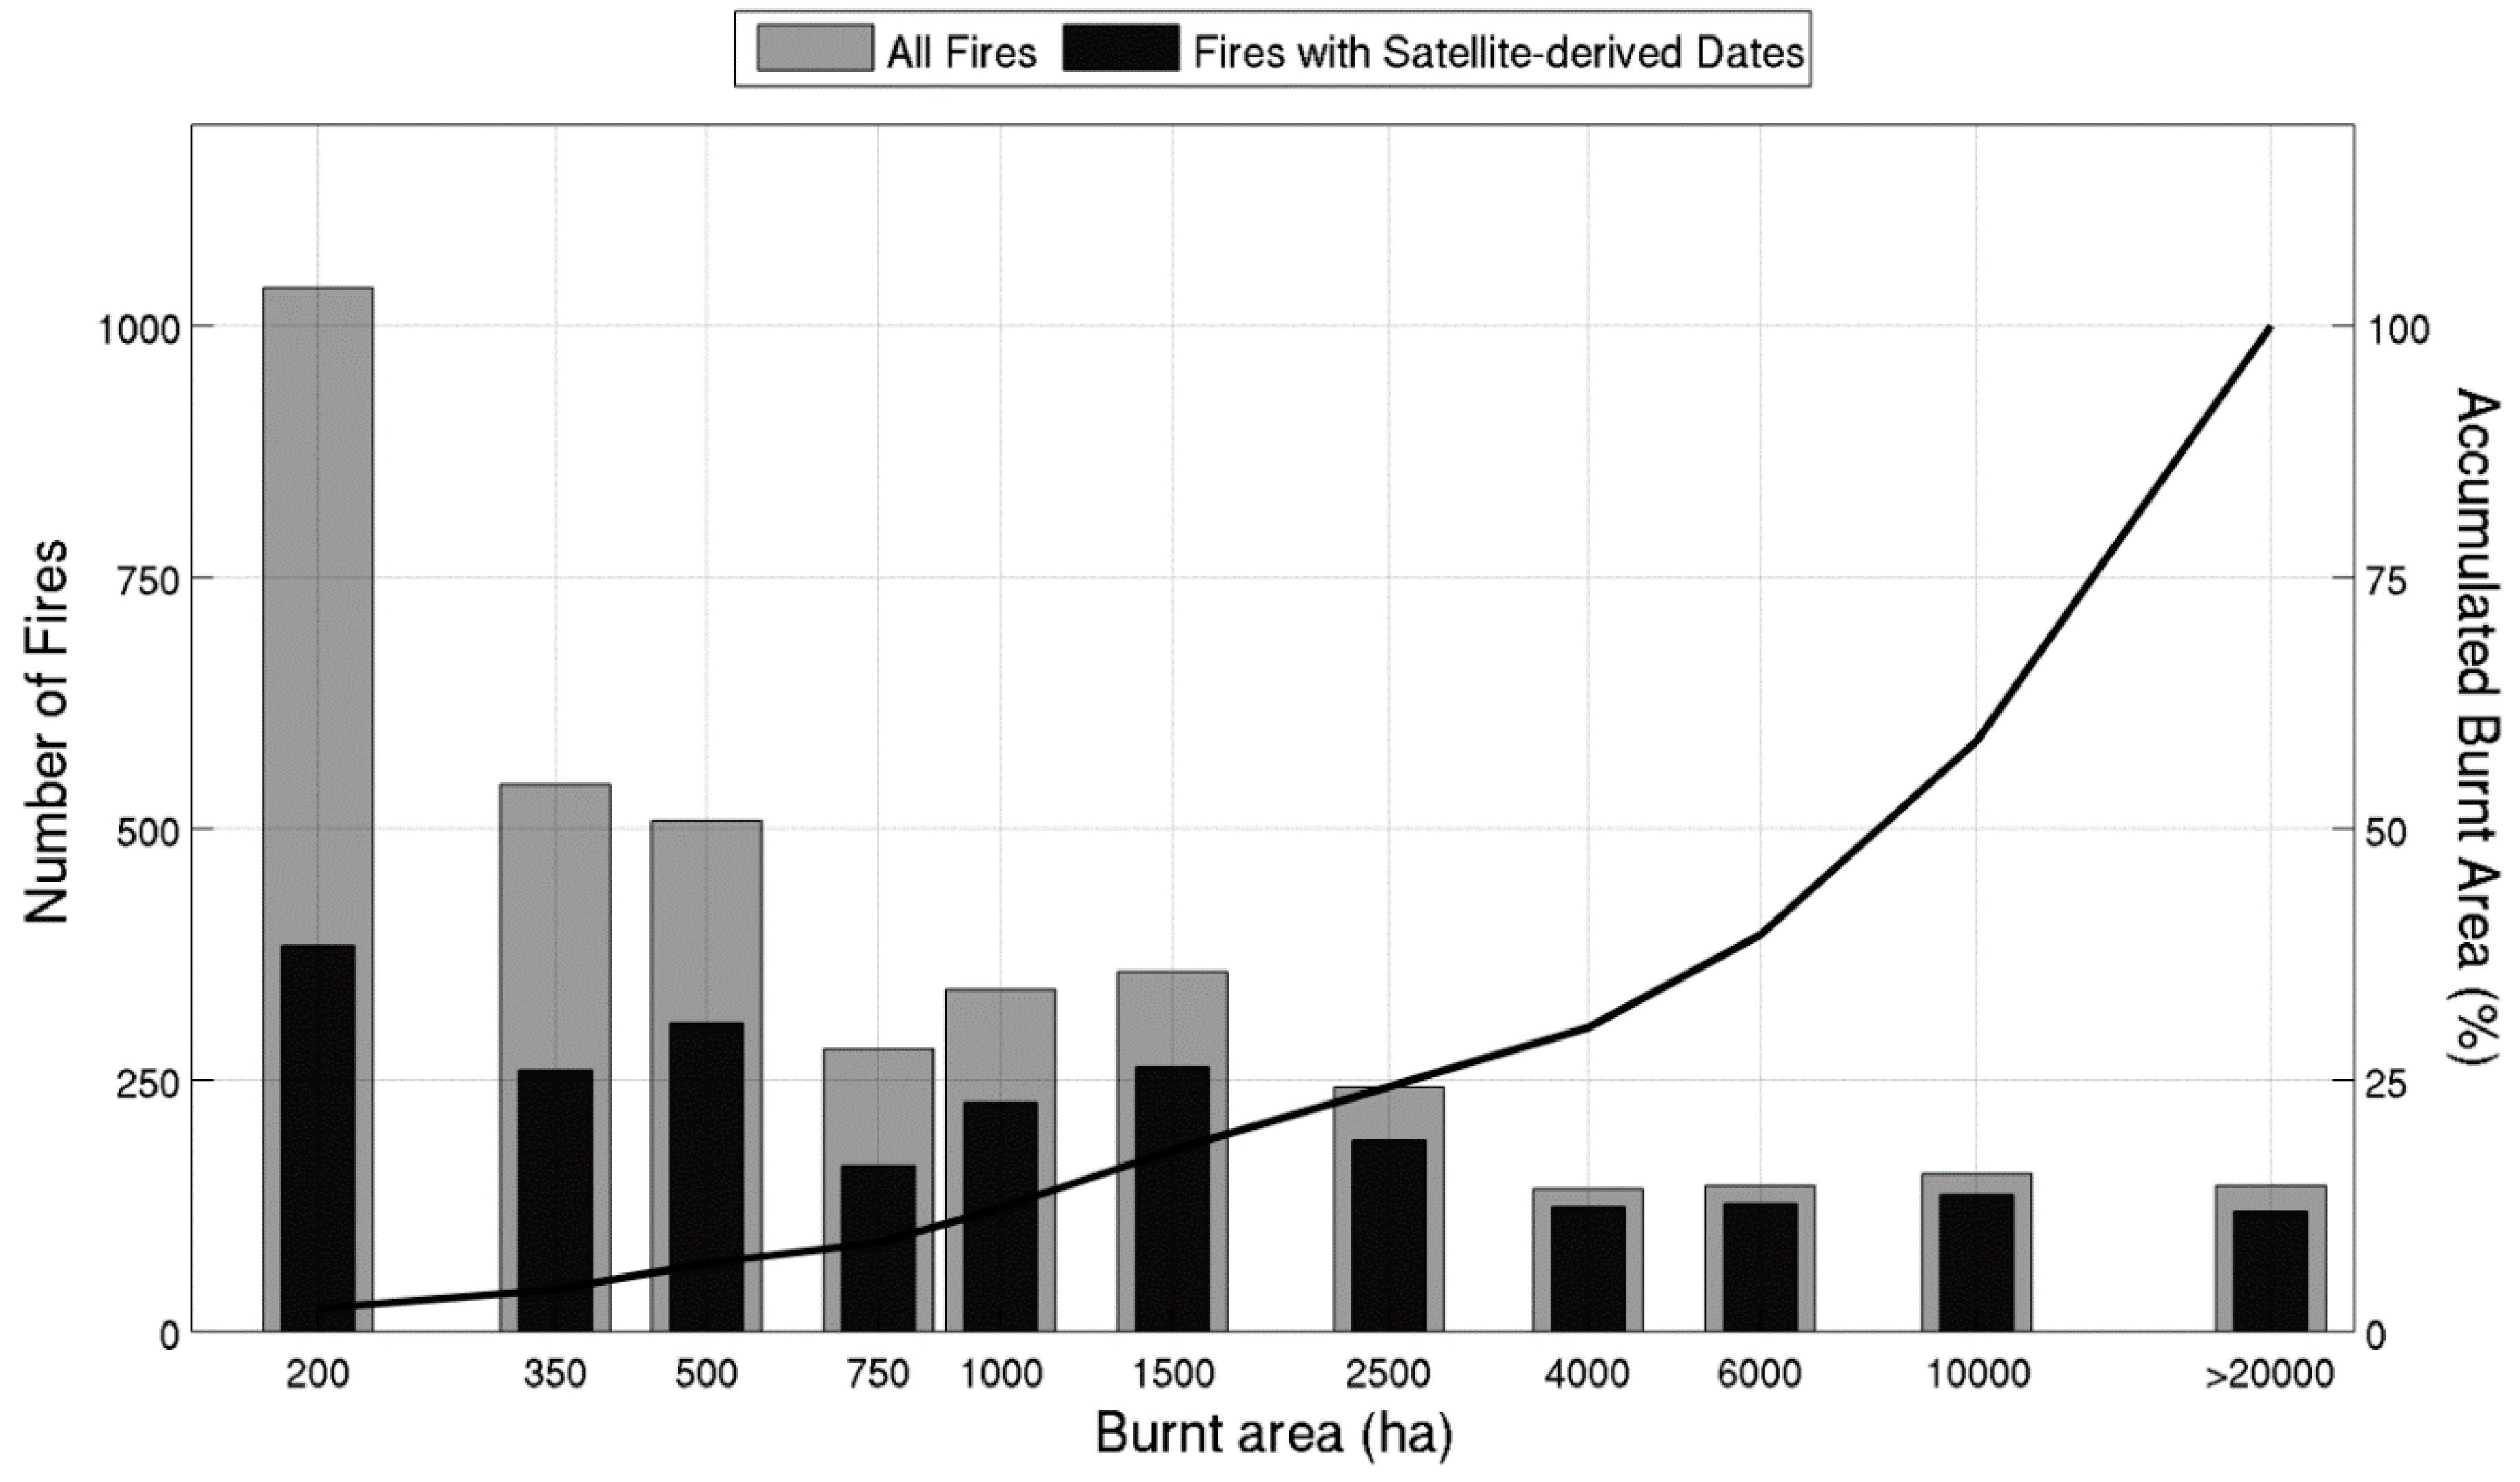
The ability to estimate fire dates from satellite imagery increased with fire size (Figure 4). For most fires smaller than 500 ha it was not possible to estimate the start/end dates. This fraction increased with burnt area. Above 2500 ha, most fire perimeters had satellite-derived dates, corresponding to 75% of the total burnt area analyzed (Table 2). The patterns for satellite-derived fire ignitions were identical, with a lower number of estimations for burnt areas below 500 ha (not shown).
Satellite-derived fire dates complemented existing fire databases in about 9% of total burnt area. For ignitions, satellite-derived data can be used to evaluate and complement existing databases on about 87% and 5% of total burnt area, respectively. For regions with limited fire date information, satellite-derived dating can be very useful (Supplementary Material Section 4). Within Greece, satellite-derived data were the only source of information on fire dates and ignitions for 16% and 14% of total burnt area, respectively. For SE Australia, it provided new information on fire dates and ignitions for 34% and 76% of the total burnt area. This contrasted with well-documented regions where satellite-derived information only filled fire dating gaps for less than 6% of the total burnt area (Supplementary Material Section 4).

3.2. Assessment and Uncertainty Analysis

3.2.1. Fire Dates

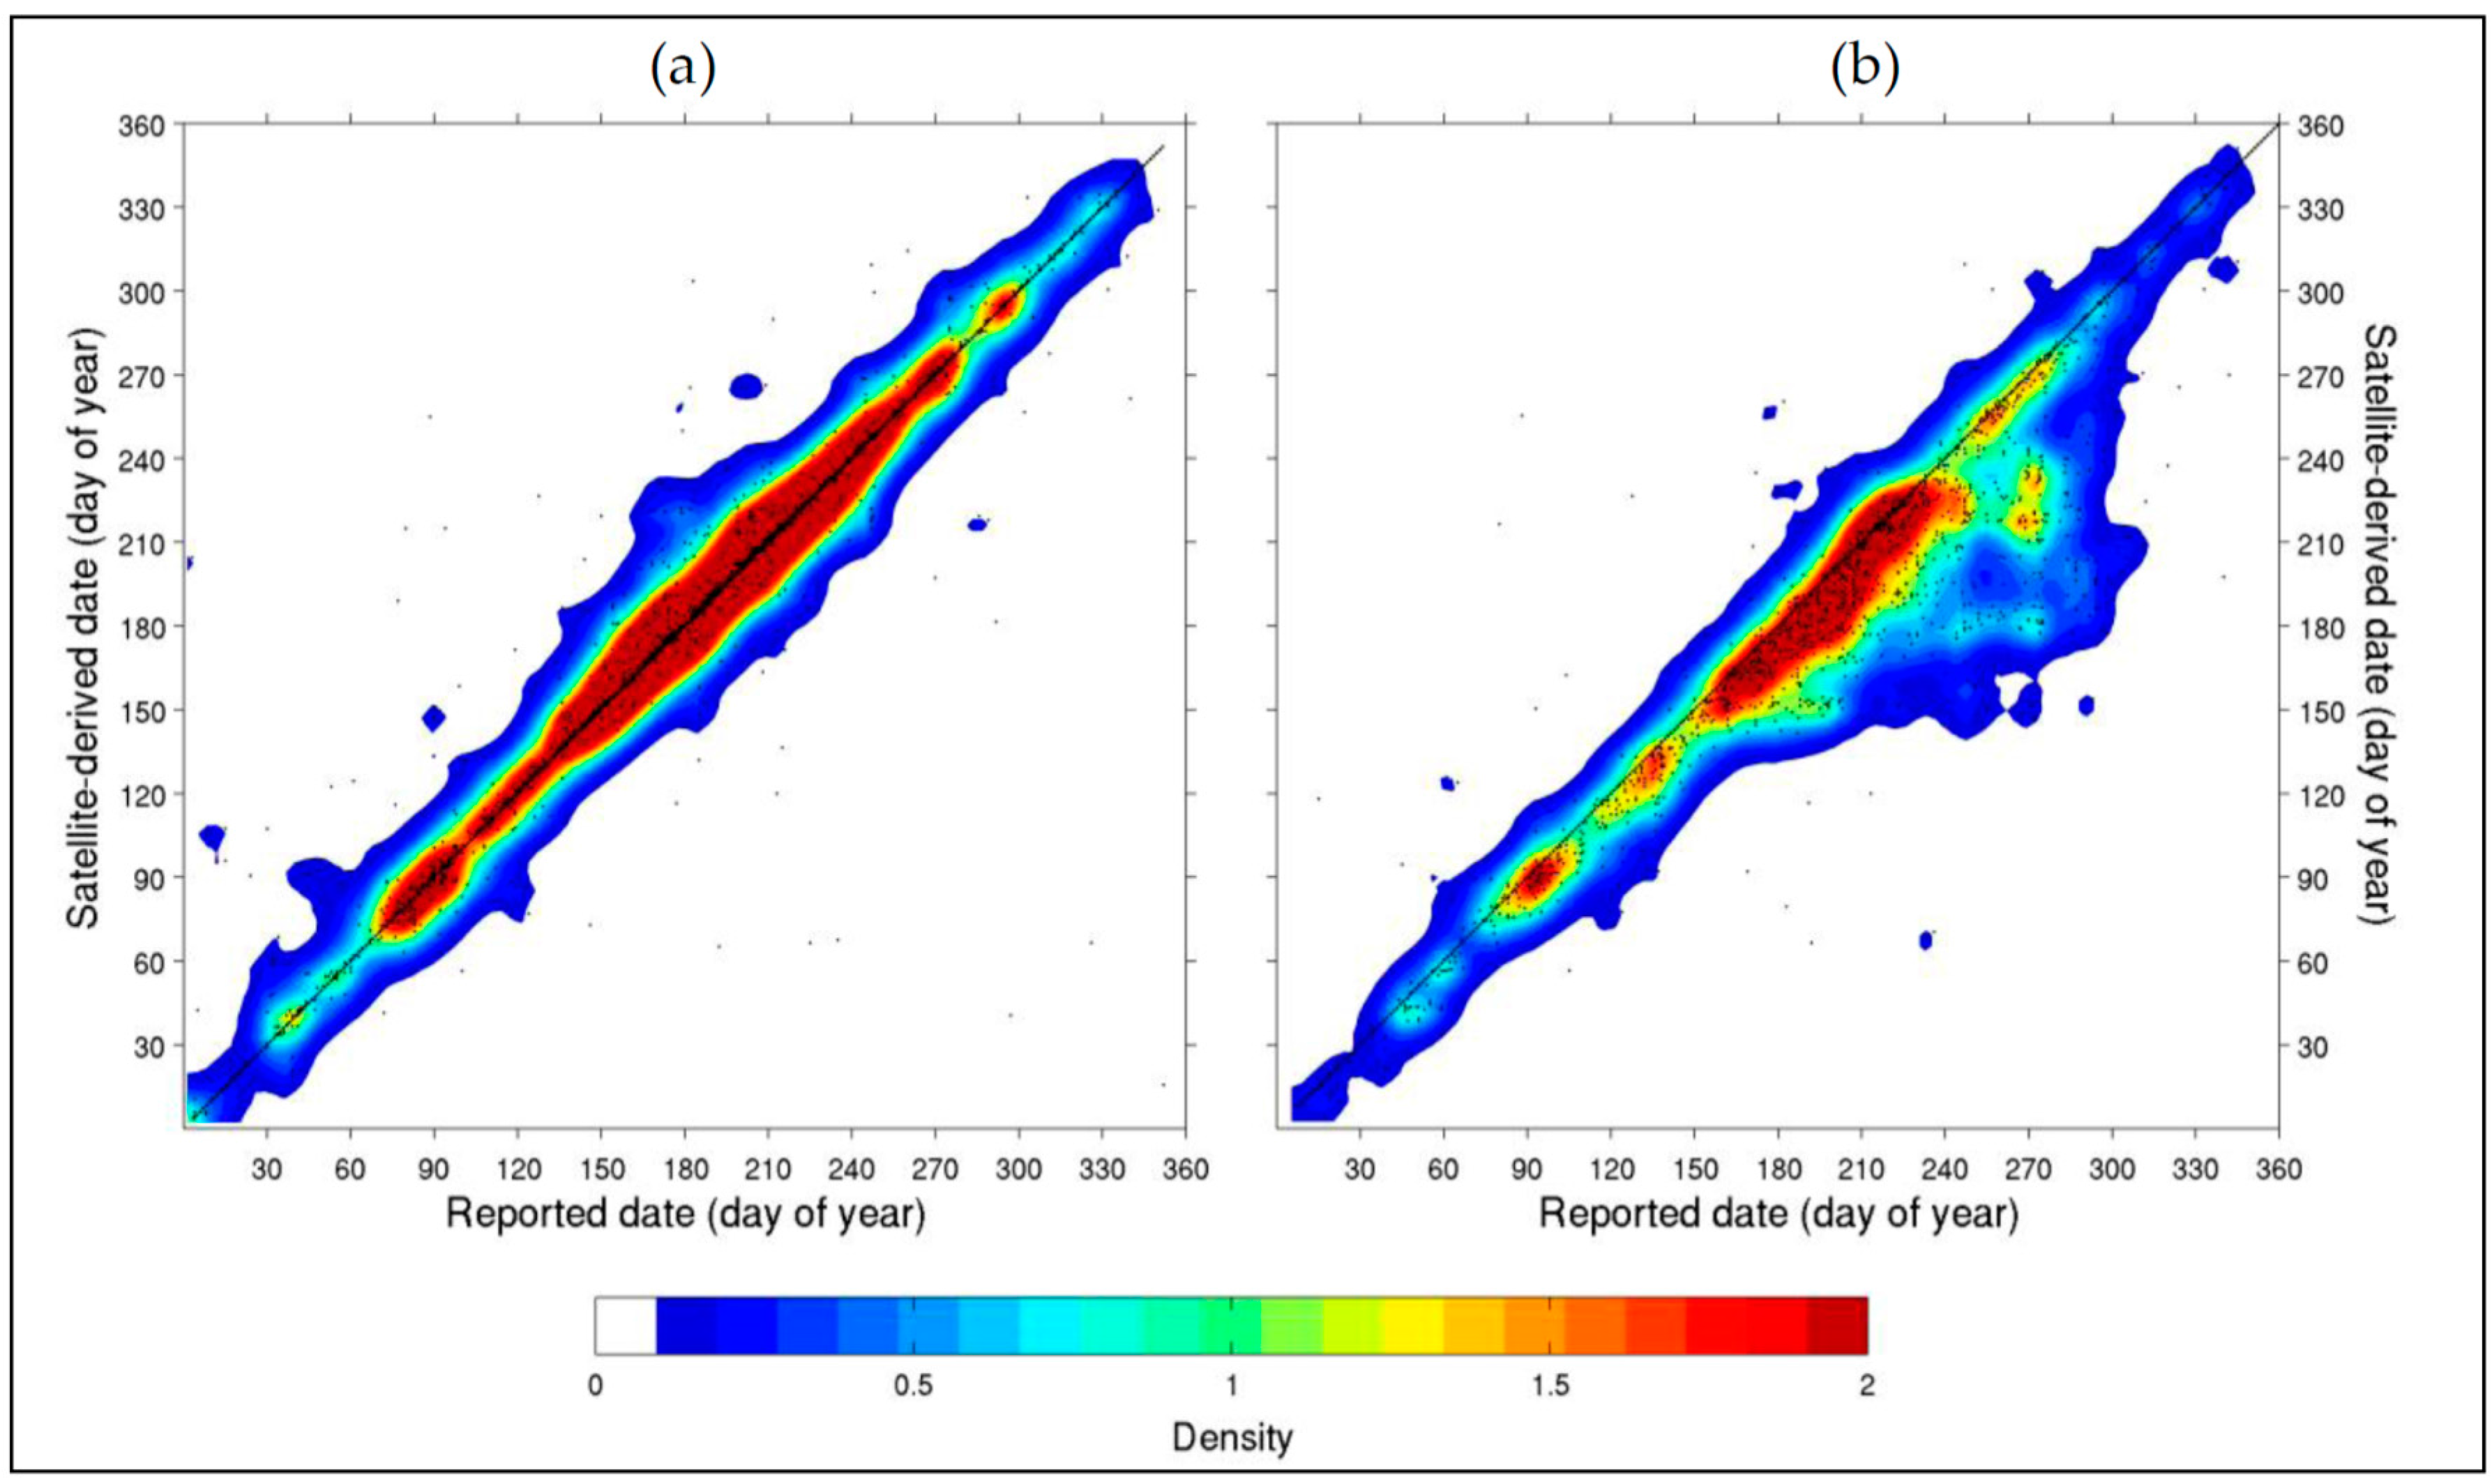
The comparison between reported and estimated fire start dates for the five study regions showed a very good agreement, with most of the points close or on the 1:1 line (MEF = 0.91; Figure 5a). For fire end dates, the agreement was considerably lower showing a tendency toward underestimation (MEF = 0.71, Figure 5b).
The region-by-region assessment showed that the estimated start date had good agreement when compared with reported data for all regions (Table 3). Optimization of the temporally constrained clustering algorithm shows that the optimal set of parameters were different for each study region (Figure S2). Alaska and Portugal had very low agreement for fire end dates, when compared with reported dates. This led to a lower overall MEF for the satellite-derived end date estimation (Figure 5b). We investigated the fire perimeters causing a significant departure from the 1:1 line in both regions. For Portugal, the cases with large discrepancies between estimated and reported end dates (N = 8) corresponded to suspicious records, all of them with reported dates outside of the fire season and some corresponding to large fires (>2500 ha) with very short durations. For Alaska, we identified a large number of suspicious cases, almost half of the assessment sample size (N = 258). For these cases, the average fire duration was around 60 days while for the remaining was around 30 days. We identified (i) 50 cases that were reported as extinguished after October, some of them in late December; (ii) 17 cases with durations exceeding 4 months; and (iii) 17 cases that burned less than 500 ha each, but lasted for more than one month.

3.2.2. Fire Ignitions

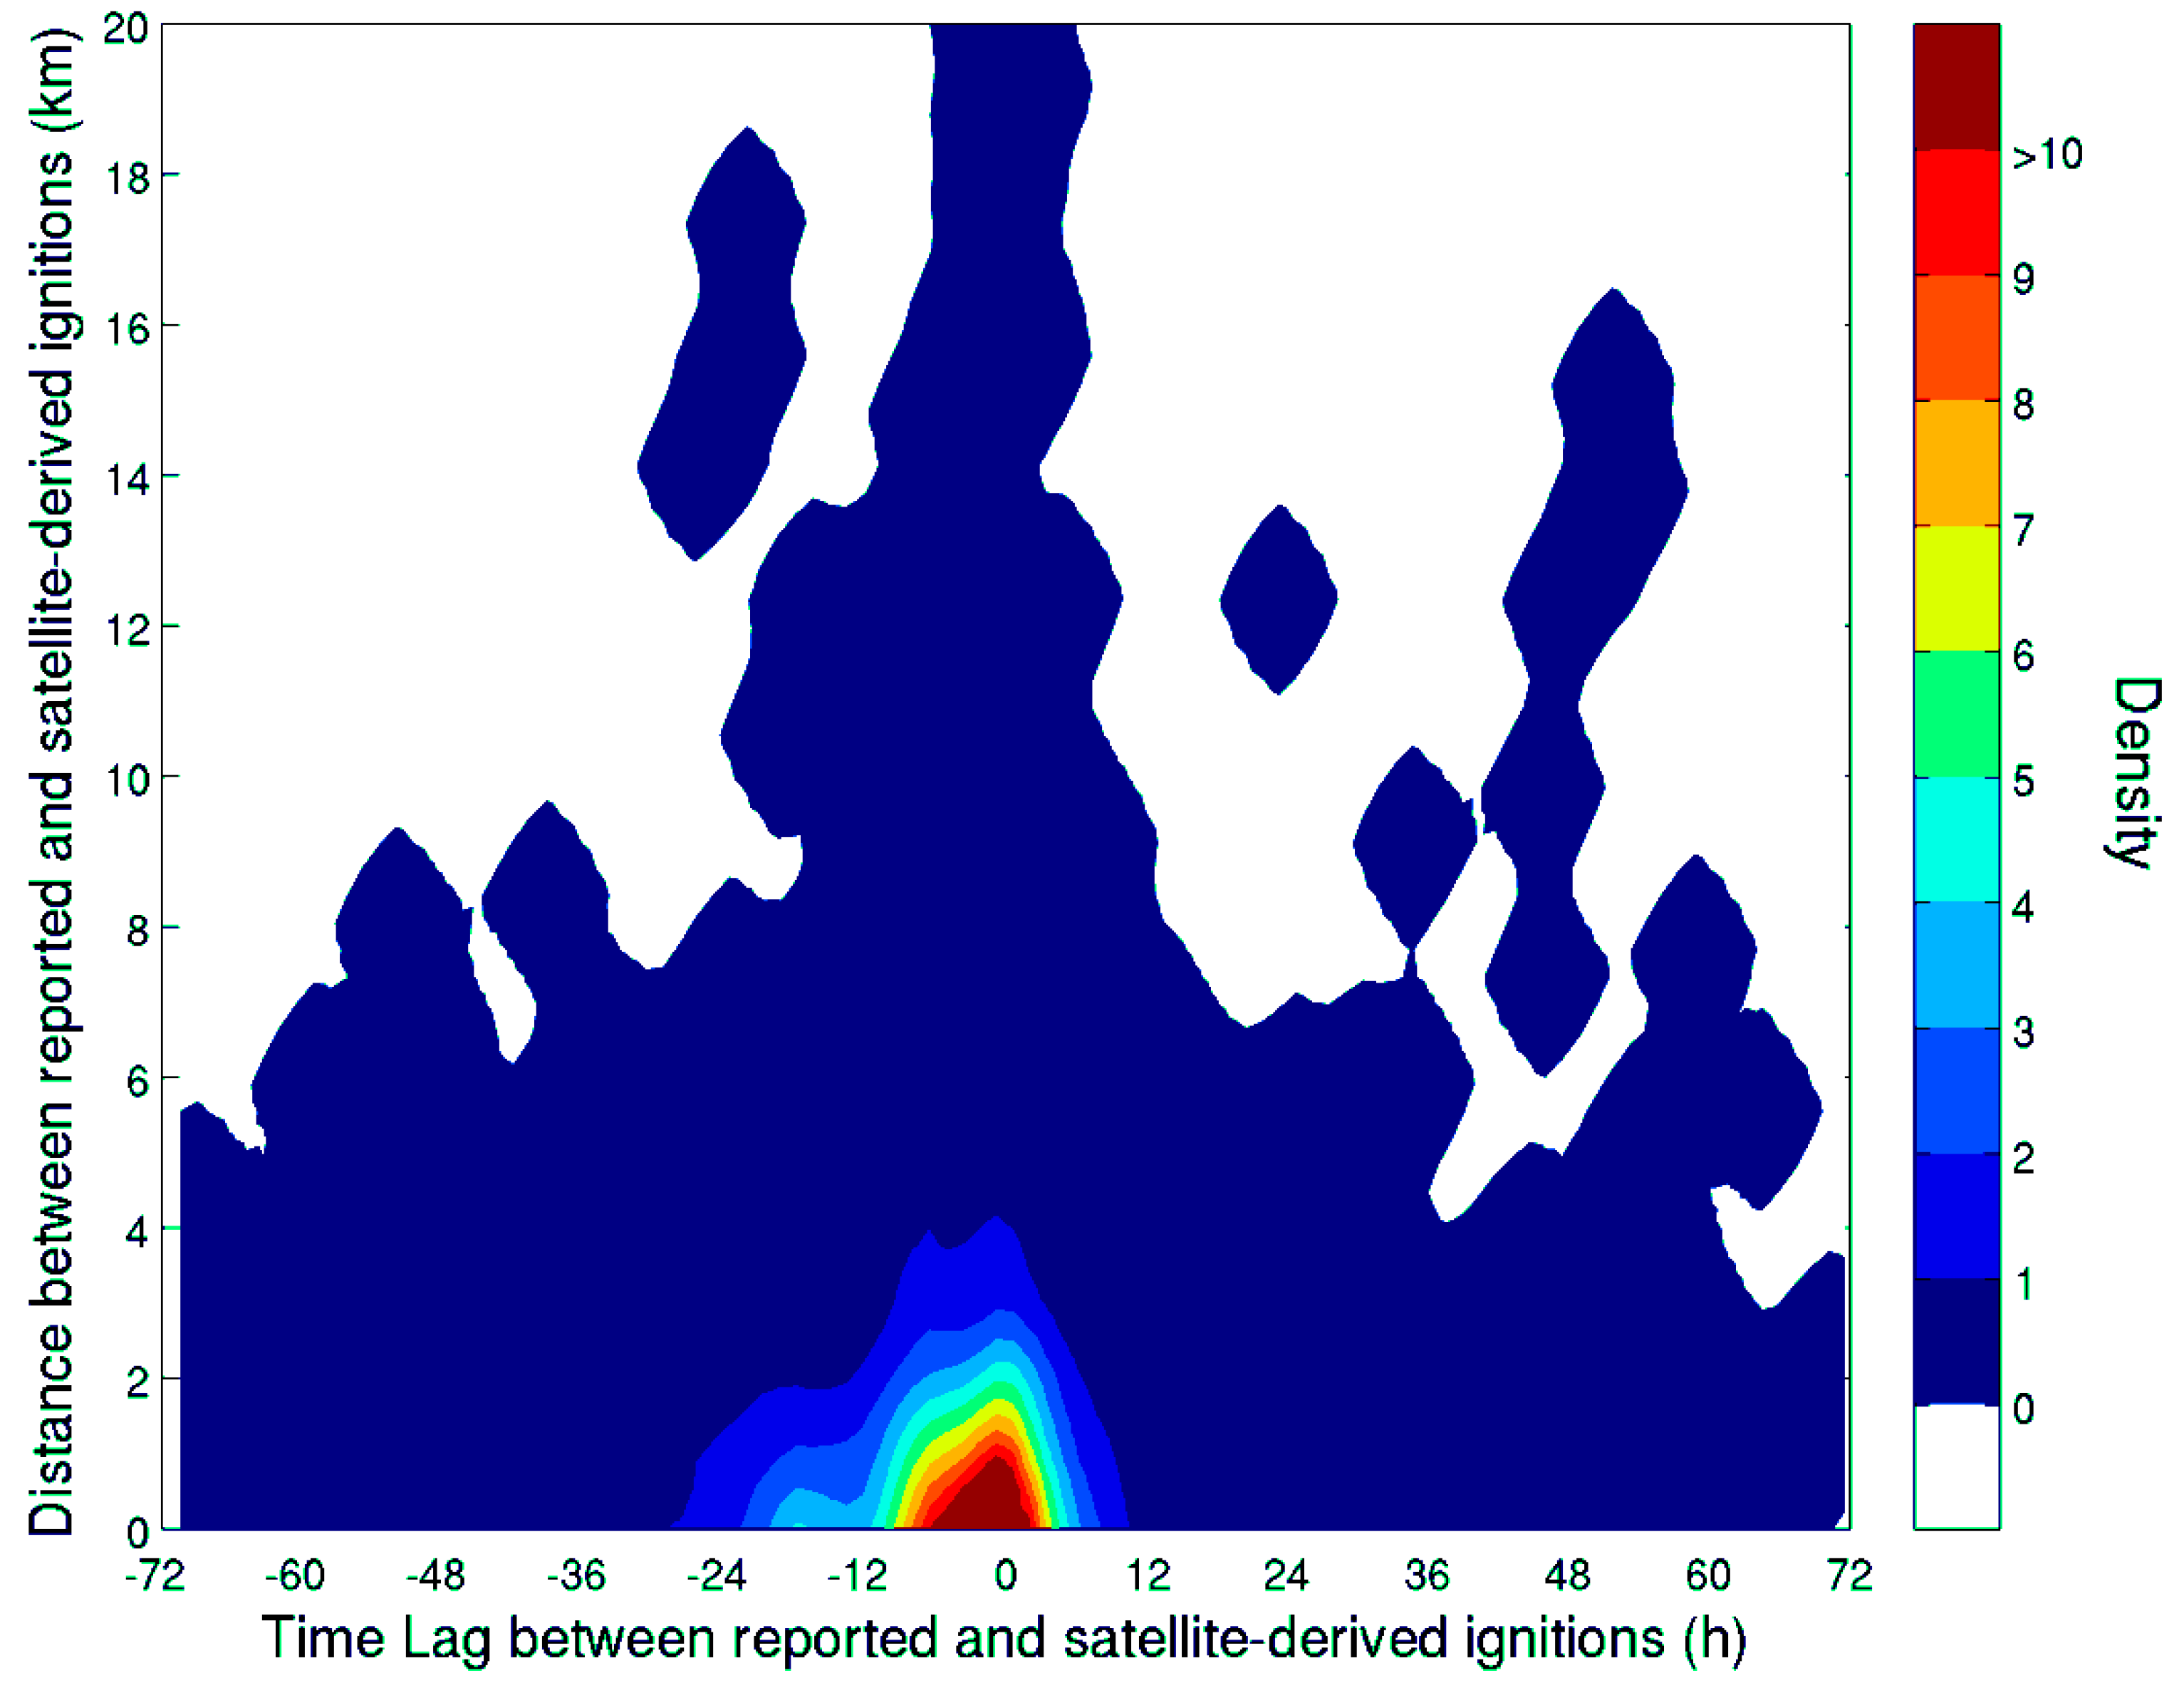
Overall, the spatio-temporal agreement between reported and satellite-derived ignitions was good (Figure 6). Most records had absolute temporal lags under 12 h and Euclidean distances below 2 km (Figure 6 and Supplementary Material Section 5). As expected, the satellite-derived ignition dates were typically delayed when compared with reported data, thus exhibiting a negative time lag. About 50%, 65% and 81% of the assessment sample had absolute temporal lags below 6 h, 12 h and 24 h, respectively (Figure 6 and Supplementary Material Section 5). Regarding the spatial agreement, the bulk of the distribution was concentrated on low distances (i.e., higher agreement). Around 75% of the estimates had spatial discrepancies below 2 km, thus lower than the buffer size used for data records located outside the fire perimeters and in the same order of magnitude as the satellite footprint size for moderate viewing angles [41]. About 10% of the fires analyzed had reported ignition locations outside the fire perimeter and satellite-derived ignitions within the perimeter (not shown). For these cases the average distance between satellite-derived and reported ignitions was on average 800 m, but varied greatly, with the 95% of the data contained in the 90–2200 m interval.
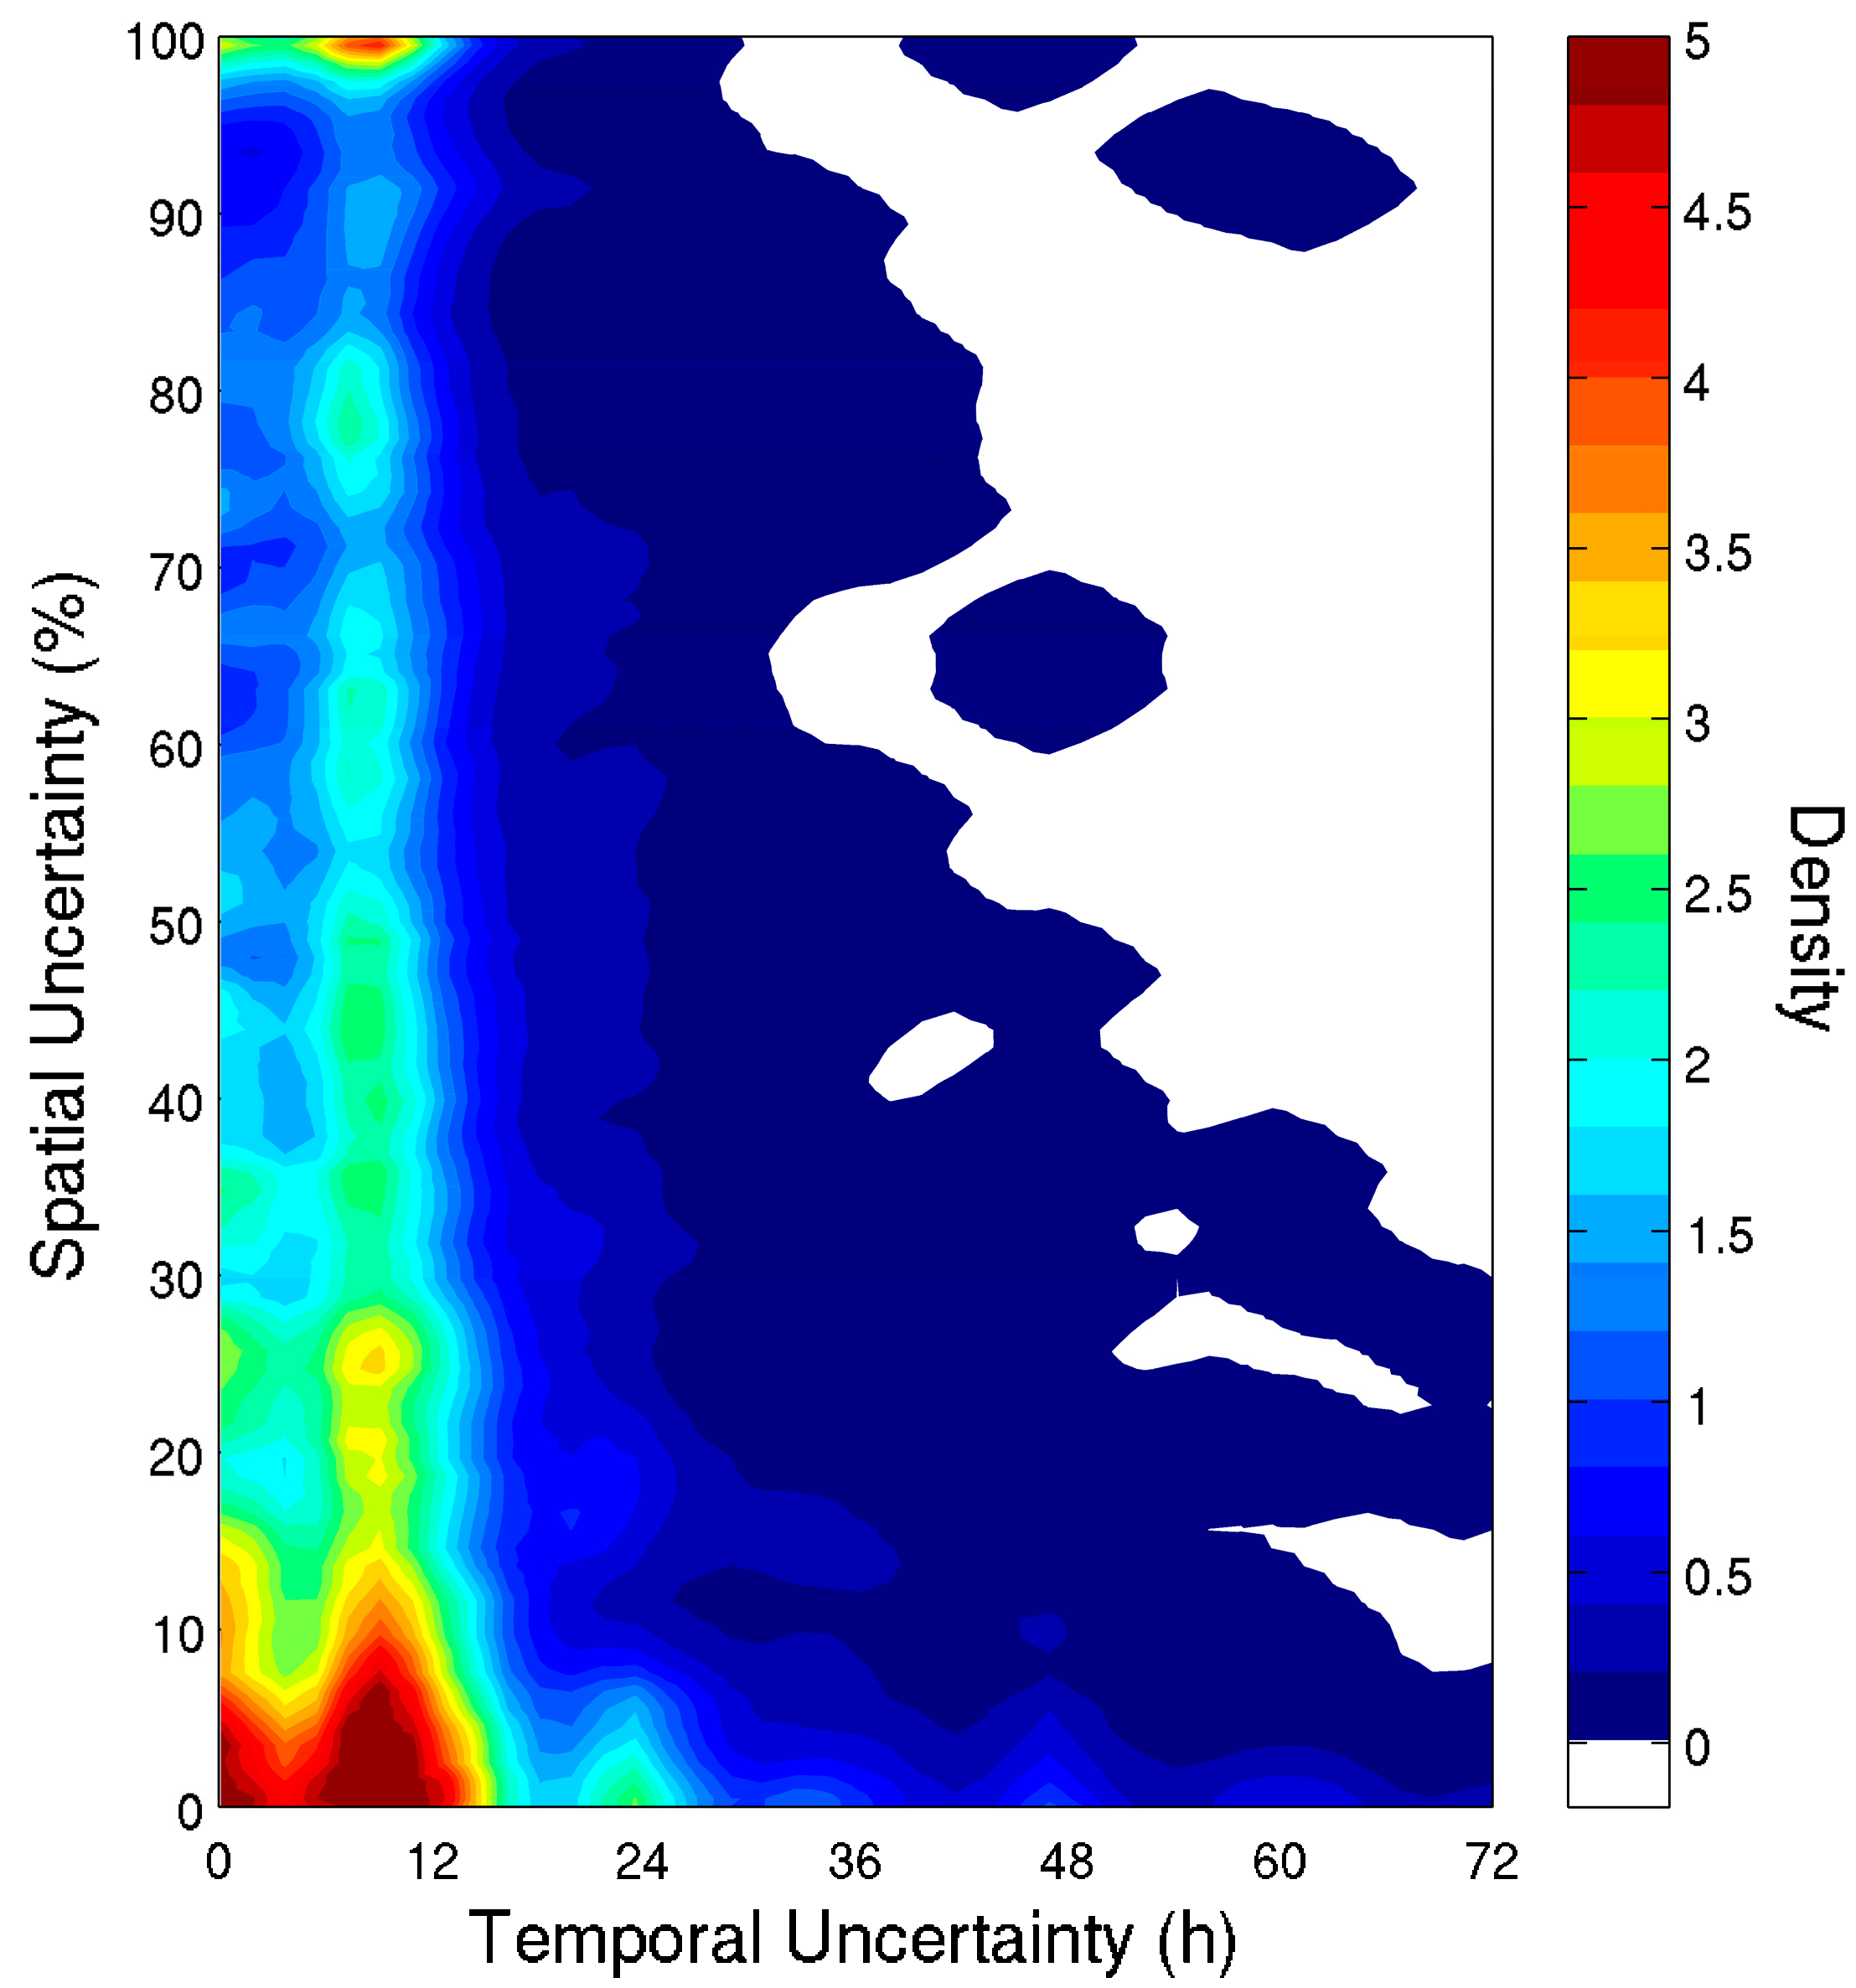
The relation between the spatial and temporal uncertainty associated with satellite-derived fire ignitions is shown in Figure 7. Most points were concentrated in an area with spatial and temporal uncertainties lower than 30% and 12 h, respectively. About 60% of the fire perimeters had a spatial uncertainty below 33%, i.e., using satellite data we were able to narrow the ignition area to less than one third of the entire fire perimeter (Supplementary Material Section 5). About 70% of ignitions were estimated with less than 12 h of temporal uncertainty (Supplementary Material Section 5). The distribution of the latter followed the differences between Terra and Aqua overpasses. For example, the time lag between Terra and antecedent Aqua overpasses is generally around 8 to 11 h, while the time lag between Aqua and antecedent Terra overpasses, the temporal lag is around 1 h to 4 h.
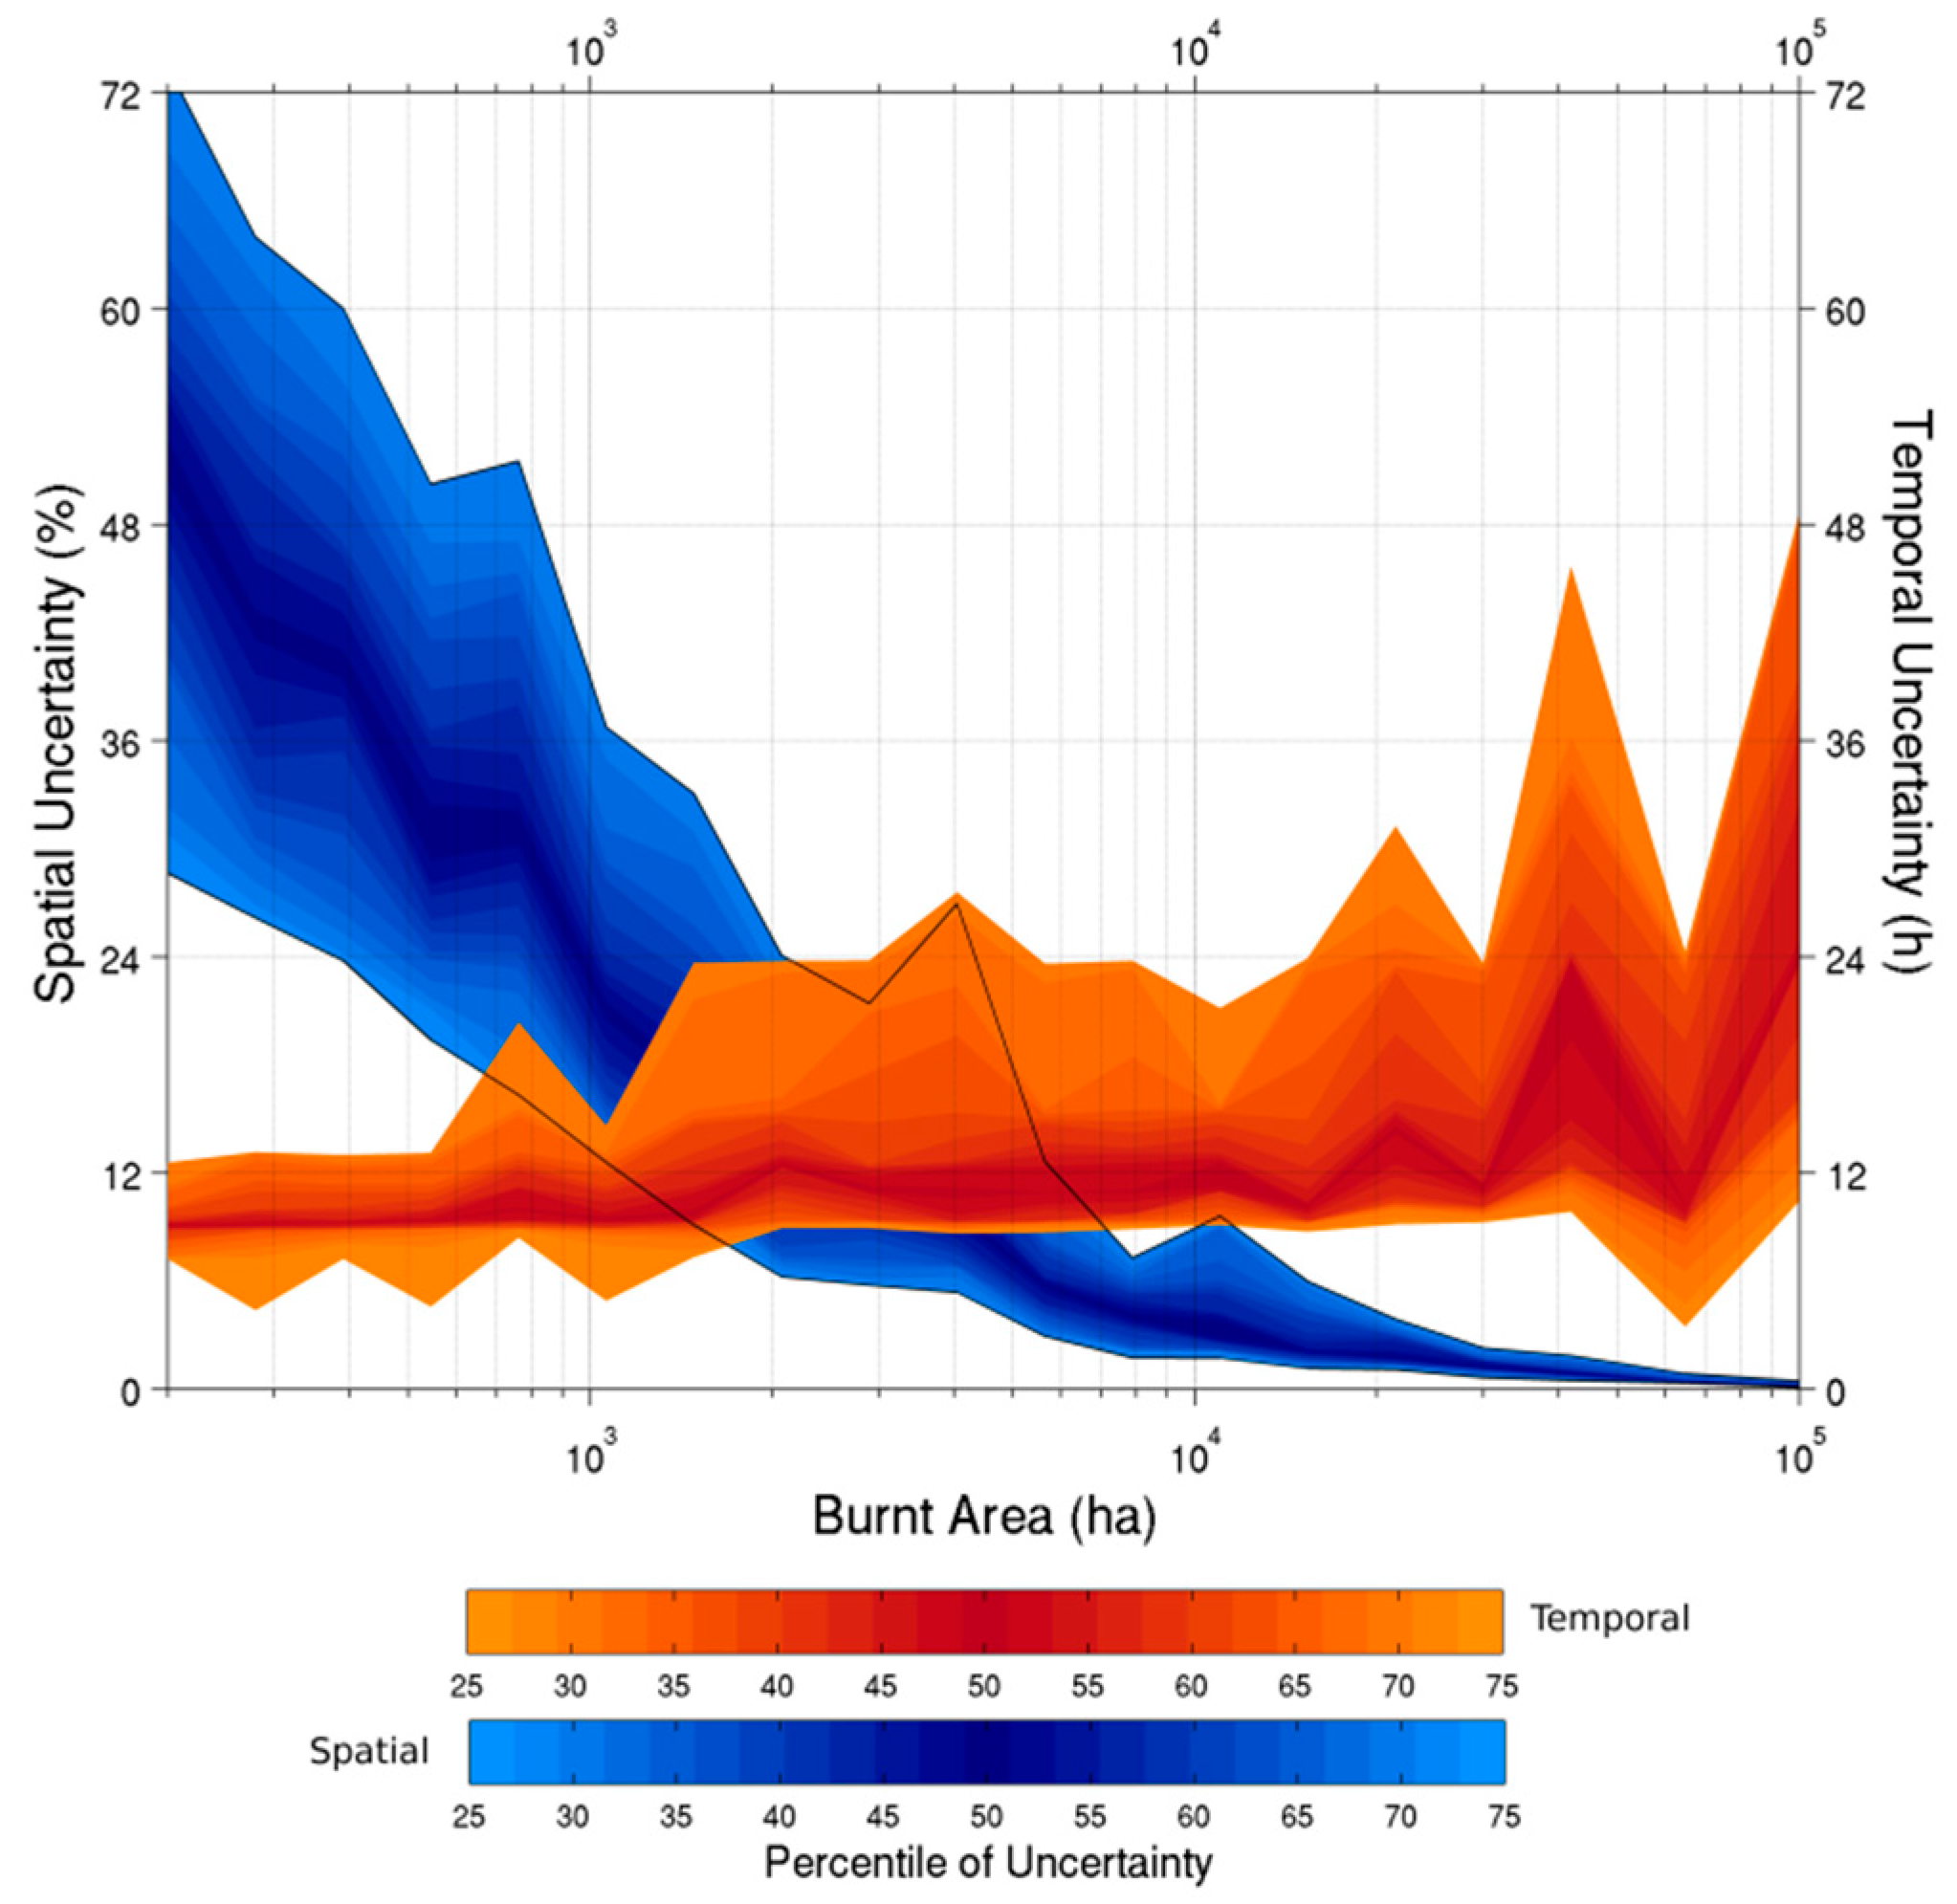
Spatial uncertainty and its variability decreased markedly with increasing fire size (Figure 8). Smaller fires were responsible for the largest spatial uncertainties. Temporal uncertainty increased less markedly with burnt area up to 2 × 10⁵ ha, and increased sharply above this value. The number of fires larger than 2 × 10⁵ ha was very small in our sample. We assumed that the likelihood of having clear sky observations covering the entire fire perimeter is smaller for larger fires.
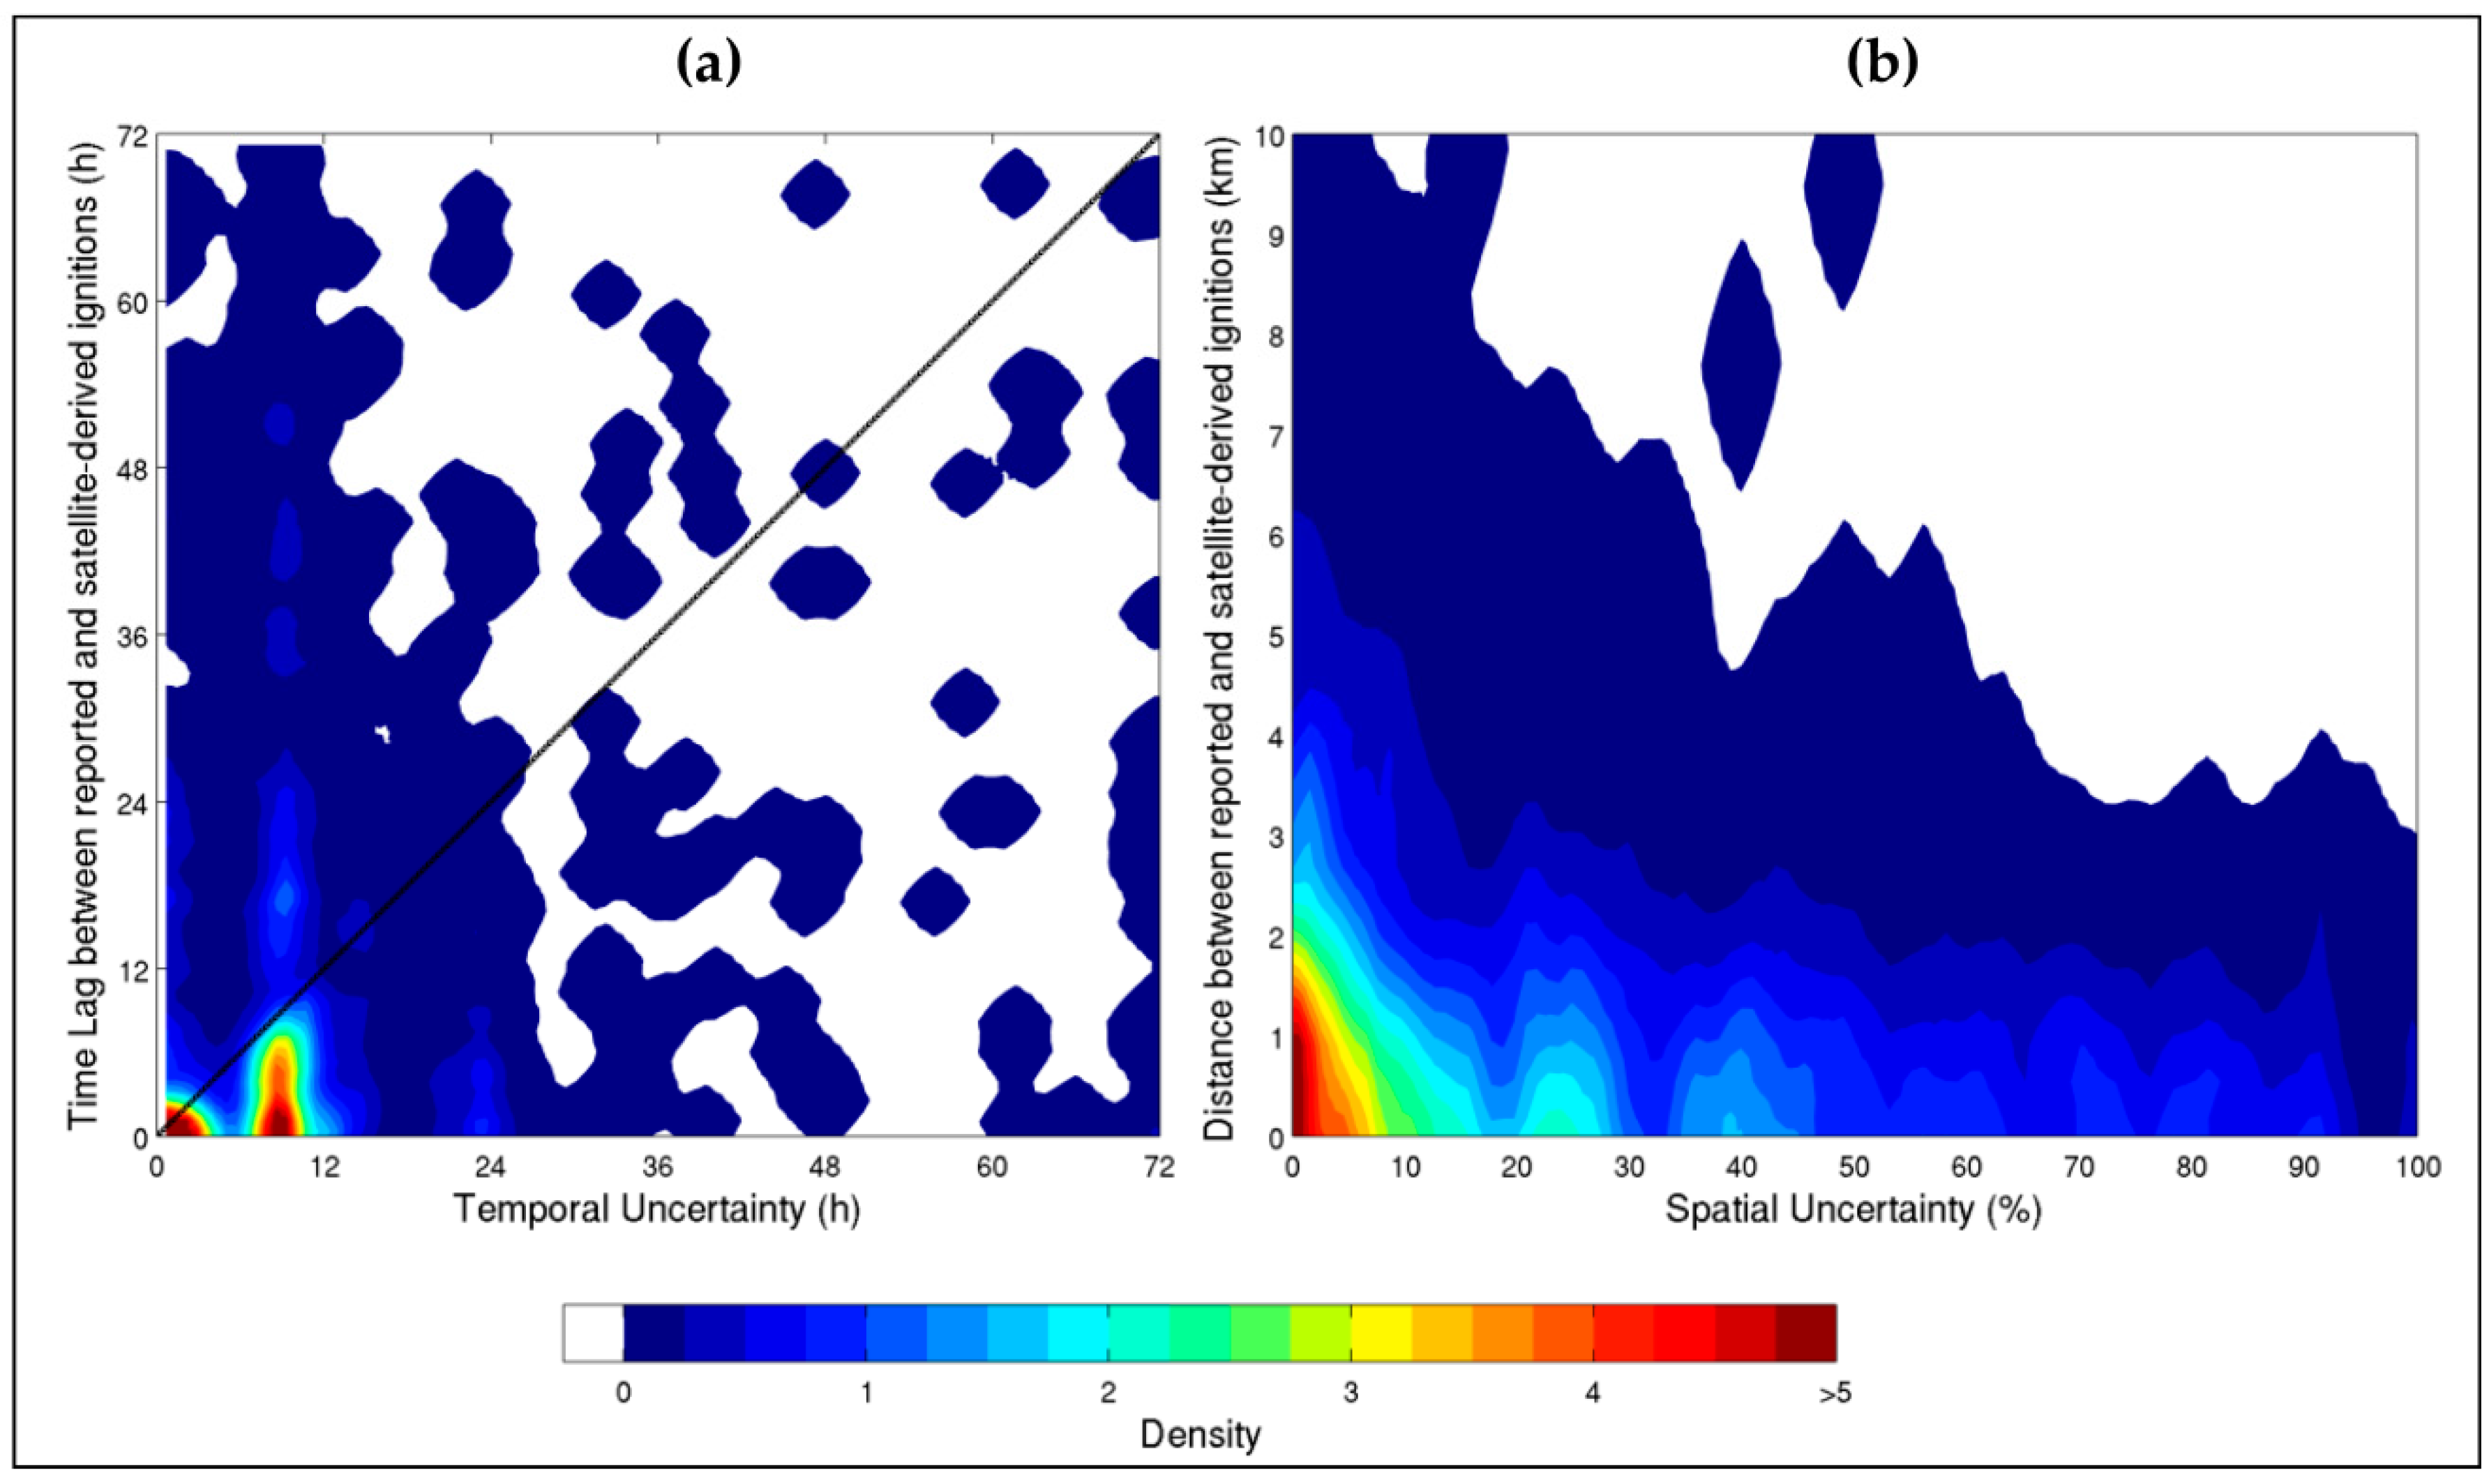
We compared spatial and temporal uncertainty with the disagreements between reported and satellite-derived ignitions (Figure 9). Most satellite-derived ignitions had larger temporal uncertainties than disagreements with reported data (Figure 9a). Areas of low temporal uncertainty and disagreement coincided. The same pattern was observed for the spatial dimension (Figure 9b). The range of spatial uncertainty was larger than the range of spatial discrepancies.

3.3. Limitations of Satellite Data

The main causes behind the inability of satellite data to provide information on fire dates and ignitions for some fire events was investigated. Active fires were detected in about 65% of the fire perimeters, but information was either insufficient because data were acquired during a single overpass (~25%), or there were multiple fire events within a mapped perimeter (~40%) (Figure 10a). In the latter case, the burnt area extent of the fire perimeters showed large variability and included several very large fires (Figure 10b).
The main cause behind the failure to detect active fires over fire perimeters was their small size (<500 ha) (Figure 10a). In fact, in a broader sense, the failure to detect active fires was mostly associated with fire perimeters smaller than 3000 ha (Figure 10b). The contribution of persistent cloud cover and short-duration fires was marginal (<5%). However, small fires were often associated with short durations. We were unable to identify the causes for the failure to detect active fires in about 10% of the fire perimeters. These had a size distribution slightly larger than the remaining fires. The contribution of fire perimeters without reported fire dates, or with multiple reported fire dates was relevant and led to the exclusion of about 40% of the data from the analysis. When taking these data into account, the fraction of fire perimeters without active fire detections was around 78%.

4. Discussion

4.1. Potential and Limitations of Satellite Data

Overall, results showed that satellite active fire data can provide accurate information on fire start and end dates, as well as the timing and location of fire ignitions. Satellite data have more potential to provide information on larger than smaller fires mainly due to detection thresholds, temporal sampling and pixel size [23]. Thus, although only a relatively small fraction of the total number of fires was covered, the corresponding total burnt area percent was high (~77%).
Fire databases are incomplete and have multiple sources of errors [6,8,10,20,21,22,28]. We have highlighted some clear examples of such inaccuracies (see Section 2.1 and Section 2.5). Moreover, the fire databases have been derived using different methods and criteria. Bearing this in mind, we stress that, although the comparison between satellite-derived and reported data was necessary, it should be understood as an assessment and not as a validation. The analysis was performed to evaluate the potential of satellite data to provide useful information on fire dates and ignitions. Thus, when both sources provided similar values, confidence on the accuracy of satellite-derived data was strengthened, but interpretation of divergent values was not as straightforward.
Results showed different agreements between satellite-derived and reported fire dates for each study region, particularly for the estimation of the fire end date. This regional variability was also marked in the optimization of the clustering algorithm (Supplementary Material Section 2). Some fire records in Alaska and Portugal were likely incorrect, as often occurs in fire databases. For example, the reported end dates in Alaska can be the dates when the fire reports and records were closed, and not the actual extinction dates (K. Short, personal communication). However, It is also possible that low intensity smoldering fires burned for several months without being detected, and may have burned outside the summer season [41,57]. A regionally-based calibration will surely improve the accuracy of satellite-derived fire information by accounting for specific fire regime characteristics, e.g., increasing maxG in regions with smoldering fires or with long cloudy periods during the fire season.
Although the causes for errors and uncertainties in the fire databases are relatively easy to identify, quantifying the errors and their impacts on subsequent studies is very difficult and, to the best of our knowledge, has not been done. Satellite-derived start/end fire dates and ignition locations can be used as additional information to identify and correct suspicious data records present in fire databases. For instance, the existence of multiple or repeated records in the same fire perimeter, some with large spatial and temporal discrepancies can be corrected by using satellite-data to identify the most plausible records. We found a large proportion of data records containing pertinent information that were located outside any fire perimeter. In fact, by using a buffer around the fire perimeters, we duplicated the sample size without introducing significant noise in the analysis. Clearly, satellite-derived data have a large potential to help correct these inaccurate records for large wildfires.
Our results have also shown that satellite data can be useful to complement existing fire databases (see also [58]). The MODIS archive goes back to the year 2000, providing continuous information since then, while the fire databases have gaps. Thus, satellite data may be the only source of information on fire dates and ignitions for some years. Additionally, for regions with mapped fire perimeters but without information on fire dates and ignitions, satellite data can be quite useful. For example, satellite data can be used to complement existing databases in well-documented areas such as USA, Europe and Australia. Moreover, in regions with an increasing trend on fire frequency satellite-derived data can be an important tool for complementary information. For regions of the world without or with scarce fire information, satellite data can be the only data source available. Satellite fire detections can be particularly useful in remote areas such as the boreal region or the tropical savannas of Africa and South America.
The utility of satellite-derived information is greatly enhanced when accompanied with uncertainty estimates. We assessed the temporal and spatial uncertainties associated with fire ignitions estimates using simple methods. Both timing and location estimates reflected the characteristics of the MODIS active fire product, i.e., medium resolution and a relatively high revisiting time (two operating sensors). Acceptable levels of uncertainty will depend on the application and ultimately on user needs. The impact of ignition location uncertainty has been shown to significantly affect simulated fire patterns [16]. Benali, et al. [59] used satellite-derived ignitions to model fire growth and found that the uncertainty associated with ignition location had a large impact on the accuracy of simulations, while the impact of the uncertainty associated with ignition date/hour was relatively low.
Some of the methodological options in the current work were empirically-based. The parameters of the temporally constrained algorithm were defined using a simple multi-objective optimization approach. Results show that expanding satellite-derived estimates to cover a larger number of fires and total burnt area could be achieved, by alleviating or removing the criterion based on the agreement with reported databases of unknown accuracy. Assessing our satellite-derived estimates by comparing them with the most contemporaneous records, and no more than three days apart, biased the analysis. Considering all the data records would decrease the satellite versus reported agreement, however, this step was necessary to minimize the impact of multiple problems found in the fire databases.
Our results highlighted the major limitations of using MODIS data to estimate fire dates and ignitions. Two prominent features stood out: (i) lack or insufficient number of active fire detections and (ii) the potential occurrence of multiple fire events within a single fire perimeter.
Firstly, insufficient data can arise from asynchronous fire activity and satellite detections, low satellite detection thresholds due to sensor characteristics, limited number of overpasses, landscape heterogeneity, cloud cover and smoke [51,60,61,62]. Small or short duration or fast moving or low intensity fires are likely to be more affected by satellite omissions [60]. Although simulations indicate that MODIS has a 50% probability of detecting a 0.01 ha flaming fire [51], validation studies using Advanced Spaceborne Thermal Emission and Reflection Radiometer (ASTER) data suggest that this detection threshold could be considerably larger [63,64,65]. At the global scale, Hantson, et al. [66] showed that 36% to 86% of fire perimeters were omitted by MODIS active fire detections, however, omission errors dropped significantly to a maximum of 20% when only fires larger than 500 ha were considered. Hawbaker et al. [23] showed that MODIS detected about 82% of the fires and that cloud cover significantly affected detection rates. Our results showed that 65% of the fires above 200 ha were detected, and we did not find a significant role of cloud cover in satellite omissions. However, the data and methods were substantially different and results will likely be highly dependent on the region and corresponding weather conditions during the fire season. Furthermore, since detection rates decrease with fire size and we only analyzed fires larger than 200 ha, large fraction of the total number of fires will be omitted by satellite detections.
Secondly, fire perimeters mapped using late fire season data (e.g., Landsat data) are insensitive to the number of events that can coalesce into a single burnt scar. Under these conditions, distinguishing multiple fire events that lead to a single fire perimeter is very difficult. However, it must be noted that even reported data on fire databases will likely fail to distinguish such events and the associated burnt area extent. We discuss some potential improvements that can tackle these limitations in Section 4.2.

4.2. Future Research Directions

Estimating fire dates and ignitions based on satellite data will surely benefit from multi-sensor approaches that integrate active fire products available from recent and upcoming sensors. The first Visible Infrared Imaging Radiometer Suite (VIIRS) was launched in late 2011 and provides active fire products with global coverage at both 375 m and 750 m twice per day [67]. Although the revisit time is longer than for MODIS, the enhanced spatial resolution and smaller footprint deformation with increasing viewing angles, have the potential to provide higher quality information regarding the location of fire ignitions. Additionally, VIIRS products have higher detection capabilities than MODIS, thus increasing the probability of detecting active fires, especially smaller ones [68]. Integrating VIIRS products will surely improve the capability of satellite data to provide information on small fires, improve the accuracy of ignition location estimates for large fires and reduce spatial uncertainty. Geostationary data from Meteosat (First and Second Generation; MFG and MSG, respectively) and Geostationary Operational Environmental Satellite (GOES) have been used to monitor active fire activity for large areas [69,70]. These sensors have low spatial resolution but a very high frequency (every 15 min). In principle, active products from geostationary satellites can be used for earlier detection of fires, thus helping to improve the estimation of fire dates and reduce temporal uncertainties. Finally, the upcoming Sentinel-3 satellites will provide global coverage of active fires with higher detection capabilities than MODIS [71]. Fusing these several sources of active fire data, minimizing their limitations and maximizing their potential, will contribute to a richer and more complete data archive on fires [72], thus surely improving the satellite-derived estimation of fire start/end dates and ignition locations.
The methodology described in the current work depends on the availability of fine resolution fire perimeters. This methodology has the potential to be applied to any region of the globe to estimate fire dates and ignitions as long as other sources of fire perimeters are available. The MODIS burnt area products can provide such information on a global scale with approximately 500 m of spatial resolution [73,74,75]. Combining coarse burnt area products with active fire detections can be used to estimate fire dates and ignitions. This would imply not capturing information for small fires and dealing with a larger number of fire perimeters containing multiple fire events. To tackle the latter issue, a method has been proposed to identify individual fires combining MODIS active fire and coarse burnt area products [76], but can also be applied using finer resolution fire perimeters.
One specific issue that was not accounted for in the current work was the existence of multiple independent and separate ignitions that led to a single final fire perimeter. These ignitions could be detected simultaneously or not by the satellite active fire product. This issue can be important in some regions of the world, for instance in the Australian savannas [77]. From visual analysis of satellite active fire data we found evidence of multiple-ignition fires in Portugal and Greece. This issue requires future work.

5. Conclusions

Satellite data can significantly contribute with accurate information on start/end dates and ignition locations for large wildfires in regions with scarce fire information. It can also be used to complement existing fire databases in well-documented areas (e.g., fill missing data) and/or to detect and correct inconsistencies. In the future, the fusion of multi-sensor active fire data will surely contribute to create a richer and more accurate archive of satellite-derived information to be used in the study of individual fires.

Supplementary Materials

The following are available online at www.mdpi.com/2072-4292/8/4/326/s1. Figure S1: The (a) total burnt area; (b) total number of fires with start and end dates assigned; and (c) MEF, for several combinations of the minimum density (minD) and maximum gap (maxG) parameters. Figure S2: Multi-objective function values (f(x)) for a range of minimum density (minD) and maximum gap (maxG) parameter combinations for (a) Portugal; (b) Greece; (c) Alaska; (d) California; (e) SE Australia, and (f) all study regions together. Figure S3: Assessment of the optimal buffer size to assign reported data to a given fire perimeter. Figure S4: Flow chart for identifying potential causes behind the inability of satellite data to provide information on fire dates and ignitions. Figure S5: Temporal (a) and spatial (b) agreement between reported and satellite-derived ignitions (N = 1376). Figure S6: Temporal (a) and spatial (b) uncertainty associated with satellite-derived ignitions (N = 2976). Table S1: Fraction of burnt area (%) covered with data of wildfires’ start/end dates and ignitions (between brackets) for Portugal. Table S2: Fraction of burnt area (%) covered with data of wildfires’ start/end dates and ignitions (between brackets) for Greece. Table S3: Fraction of burnt area (%) covered with data of wildfires’ start/end dates and ignitions (between brackets) for Alaska Table S4: Fraction of burnt area (%) covered with data of wildfires’ start/end dates and ignitions (between brackets) for California. Table S5: Fraction of burnt area (%) covered with data of wildfires’ start/end dates and ignitions (between brackets) for SE Australia.

Acknowledgments

The research leading to these results has received funding from the European Union’s Seventh Framework Programme (FP7/2007–2013) under grant agreement 243888 (FUME Project). We thank Hugh Safford, Jay Miller, Brad Quayle, Dave Calkin and Karen Short for their help with fire data for the USA. We thank colleagues Gerardo López-Saldaña for his help with the extraction of MODIS cloud data, and Duarte Oom for discussions related with data analysis. The satellite-derived fire dates and ignitions are freely available here: https://www.researchgate.net/publication/299656187_Satellite-derived_Fire_Dates_and_Ignitions_Portugal_Greece_Alaska_California_SE_Australia

Author Contributions

A.B. designed the study and wrote the paper. A.B., A.C.L.S. and R.M.S.P. did the analysis. A.B., A.R., A.C.L.S., R.M.S.P., O.P., N.K. and J.M.C.P. discussed and reviewed the manuscript.

Conflicts of Interest

The authors declare no conflict of interest.

Abbreviations

The following abbreviations are used in this manuscript:
USA
United States of America
SE
Southeastern
ICNF
Instituto de Conservação da Natureza e Florestas
AICC
Alaska Interagency Coordination Center
NSW
New South Wales
MODIS
MODerate Resolution Imaging Spectroradiometer
ASTER
Advanced Spaceborne Thermal Emission and Reflection Radiometer
MEF
Nash–Sutcliffe Model Efficiency index
VIIRS
Visible Infrared Imaging Radiometer Suite
MFG
Meteosat First Generation
MSG
Meteosat Second Generation
GOES
Geostationary Operational Environmental Satellite

References

  1. Van der Werf, G.R.; Randerson, J.T.; Giglio, L.; Collatz, G.J.; Mu, M.; Kasibhatla, P.S.; Morton, D.C.; Defries, R.S.; Jin, Y.; van Leeuwen, T.T. Global fire emissions and the contribution of deforestation, savanna, forest, agricultural, and peat fires (1997–2009). Atmos. Chem. Phys. 2010, 10, 11707–11735. [Google Scholar] [CrossRef] [Green Version]
  2. Lentile, L.B.; Holden, Z.A.; Smith, A.M.S.; Falkowski, M.J.; Hudak, A.T.; Morgan, P.; Lewis, S.A.; Gessler, P.E.; Benson, N.C. Remote sensing techniques to assess active fire characteristics and post-fire effects. Int. J. Wildland Fire 2006, 15, 319–345. [Google Scholar] [CrossRef]
  3. French, N.H.; de Groot, W.J.; Jenkins, L.K.; Rogers, B.M.; Alvarado, E.; Amiro, B.; De Jong, B.; Goetz, S.; Hoy, E.; Hyer, E.; et al. Model comparisons for estimating carbon emissions from North American wildland fire. J. Geophys. Res. 2011, 116, G00K05. [Google Scholar] [CrossRef]
  4. Giglio, L.; Kendall, J.; Justice, C. Evaluation of global fire detection algorithms using simulated AVHRR infrared data. Int. J. Remote Sens. 1999, 20, 1947–1985. [Google Scholar] [CrossRef]
  5. Ganteaume, A.; Camia, A.; Jappiot, M.; San-Miguel-Ayanz, J.; Long-Fournel, M.; Lampin, C. A review of the main driving factors of forest fire ignition over Europe. Environ. Manag. 2013, 51, 651–662. [Google Scholar] [CrossRef] [PubMed]
  6. Bar-Massada, A.; Hawbaker, T.J.; Stewart, S.I.; Radeloff, V.C. Combining satellite-based fire observations and ground-based lightning detections to identify lightning fires across the conterminous USA. IEEE J. Sel. Top. Appl. Earth Obs. Remote Sens. 2012, 5, 1438–1447. [Google Scholar] [CrossRef]
  7. Moreira, F.; Catry, F.X.; Rego, F.; Bacao, F. Size-dependent pattern of wildfire ignitions in Portugal: When do ignitions turn into big fires? Landsc. Ecol. 2010, 25, 1405–1417. [Google Scholar] [CrossRef]
  8. Catry, F.X.; Rego, F.C.; Bação, F.L.; Moreira, F. Modeling and mapping wildfire ignition risk in portugal. Int. J. Wildl. Fire 2009, 18, 921–931. [Google Scholar] [CrossRef]
  9. Salis, M.; Ager, A.A.; Arca, B.; Finney, M.A.; Bacciu, V.; Duce, P.; Spano, D. Assessing exposure of human and ecological values to wildfire in Sardinia, Italy. Int. J. Wildl. Fire 2013, 22, 549–565. [Google Scholar] [CrossRef]
  10. Pereira, M.G.; Malamud, B.D.; Trigo, R.M.; Alves, P.I. The history and characteristics of the 1980–2005 Portuguese rural fire database. Nat. Hazards Earth Syst. Sci. 2011, 11, 3343–3358. [Google Scholar] [CrossRef]
  11. Parisien, M.-A.; Parks, S.A.; Miller, C.; Krawchuk, M.A.; Heathcott, M.; Moritz, M.A. Contributions of ignitions, fuels, and weather to the spatial patterns of burn probability of a boreal landscape. Ecosystems 2011, 14, 1141–1155. [Google Scholar] [CrossRef]
  12. Lavoué, D.; Gong, S.; Stocks, B.J. Modelling emissions from Canadian wildfires: A case study of the 2002 quebec fires. Int. J. Wildl. Fire 2008, 16, 649–663. [Google Scholar] [CrossRef]
  13. Thompson, J.R.; Spies, T.A. Factors associated with crown damage following recurring mixed-severity wildfires and post-fire management in southwestern Oregon. Landsc. Ecol. 2010, 25, 775–789. [Google Scholar] [CrossRef]
  14. Cary, G.J.; Flannigan, M.D.; Keane, R.E.; Bradstock, R.A.; Davies, I.D.; Lenihan, J.M.; Li, C.; Logan, K.A.; Parsons, R.A. Relative importance of fuel management, ignition management and weather for area burned: Evidence from five landscape–fire–succession models. Int. J. Wildl. Fire 2009, 18, 147–156. [Google Scholar] [CrossRef]
  15. Slocum, M.G.; Beckage, B.; Platt, W.J.; Orzell, S.L.; Taylor, W. Effect of climate on wildfire size. Ecosystems 2010, 13, 828–840. [Google Scholar] [CrossRef]
  16. Bar-Massada, A.; Syphard, A.D.; Hawbaker, T.J.; Stewart, S.I.; Radeloff, V.C. Effects of ignition location models on the burn patterns of simulated wildfires. Environ. Model. Softw. 2011, 26, 583–592. [Google Scholar] [CrossRef]
  17. LaCroix, J.J.; Ryu, S.-R.; Zheng, D.; Chen, J. Simulating fire spread with landscape management scenarios. For. Sci. 2006, 52, 522–529. [Google Scholar]
  18. Shapiro-Miller, L.B.; Heyerdahl, E.K.; Morgan, P. Comparison of fire scars, fire atlases, and satellite data in the northwestern United States. Can. J. For. Res. 2007, 37, 1933–1943. [Google Scholar] [CrossRef]
  19. Morgan, P.; Hardy, C.C.; Swetnam, T.W.; Rollins, M.G.; Long, D.G. Mapping fire regimes across time and space: Understanding coarse and fine-scale fire patterns. Int. J. Wildl. Fire 2001, 10, 329–342. [Google Scholar] [CrossRef]
  20. Amatulli, G.; Peréz-Cabello, F.; de la Riva, J. Mapping lightning/human-caused wildfires occurrence under ignition point location uncertainty. Ecol. Model. 2007, 200, 321–333. [Google Scholar] [CrossRef]
  21. Short, K.C. A spatial database of wildfires in the United States, 1992–2011. Earth Syst. Sci. Data 2014, 6, 1–27. [Google Scholar] [CrossRef]
  22. Kasischke, E.S.; Williams, D.; Barry, D. Analysis of the patterns of large fires in the boreal region of Alaska. Int. J. Wildl. Fire 2002, 11, 131–144. [Google Scholar] [CrossRef]
  23. Hawbaker, T.J.; Radeloff, V.C.; Syphard, A.D.; Zhu, Z.; Stewart, S.I. Detection rates of the MODIS active fire product in the United States. Remote Sens. Environ. 2008, 112, 2656–2664. [Google Scholar] [CrossRef]
  24. Holden, Z.; Smith, A.; Morgan, P.; Rollins, M.; Gessler, P. Evaluation of novel thermally enhanced spectral indices for mapping fire perimeters and comparisons with fire atlas data. Int. J. Remote Sens. 2005, 26, 4801–4808. [Google Scholar] [CrossRef]
  25. Thorsteinsson, T.; Magnusson, B.; Gudjonsson, G. Large wildfire in Iceland in 2006: Size and intensity estimates from satellite data. Int. J. Remote Sens. 2011, 32, 17–29. [Google Scholar] [CrossRef]
  26. Lee, B.S.; Alexander, M.E.; Hawkes, B.C.; Lynham, T.J.; Stocks, B.J.; Englefield, P. Information systems in support of wildland fire management decision making in Canada. Comput. Electron. Agric. 2002, 37, 185–198. [Google Scholar] [CrossRef]
  27. Loboda, T.V.; Csiszar, I.A. Reconstruction of fire spread within wildland fire events in Northern Eurasia from the MODIS active fire product. Glob. Planet. Chang. 2007, 56, 258–273. [Google Scholar] [CrossRef]
  28. Parks, S.A. Mapping day-of-burning with coarse-resolution satellite fire-detection data. Int. J. Wildl. Fire 2014, 23, 215–223. [Google Scholar] [CrossRef]
  29. Veraverbeke, S.; Sedano, F.; Hook, S.J.; Randerson, J.T.; Jin, Y.; Rogers, B.M. Mapping the daily progression of large wildland fires using MODIS active fire data. Int. J. Wildl. Fire 2014, 23, 655–667. [Google Scholar] [CrossRef]
  30. Chuvieco, E.; Martin, M. A simple method for area growth mapping using AVHRR channel 3 data. Int. J. Remote Sens. 1994, 15, 3141–3146. [Google Scholar] [CrossRef]
  31. Smith, A.M.S.; Wooster, M.J. Remote classification of head and backfire types from MODIS fire radiative power and smoke plume observations. Int. J. Wildl. Fire 2005, 14, 249–254. [Google Scholar] [CrossRef]
  32. Dennison, P.E.; Charoensiri, K.; Roberts, D.A.; Peterson, S.H.; Green, R.O. Wildfire temperature and land cover modeling using hyperspectral data. Remote Sens. Environ. 2006, 100, 212–222. [Google Scholar] [CrossRef]
  33. Wooster, M.; Zhukov, B.; Oertel, D. Fire radiative energy for quantitative study of biomass burning: Derivation from the bird experimental satellite and comparison to MODIS fire products. Remote Sens. Environ. 2003, 86, 83–107. [Google Scholar] [CrossRef]
  34. Keeley, J.E.; Fotheringham, C.J. Historic fire regime in southern california shrublands. Conserv. Biol. 2001, 15, 1536–1548. [Google Scholar] [CrossRef]
  35. Dimitrakopoulos, A.P.; Vlahou, M.; Anagnostopoulou, C.G.; Mitsopoulos, I. Impact of drought on wildland fires in greece: Implications of climatic change? Clim. Change 2011, 109, 331–347. [Google Scholar] [CrossRef]
  36. Trigo, R.M.; Pereira, J.M.C.; Pereira, M.G.; Mota, B.; Calado, T.J.; da Camara, C.C.; Santo, F.E. Atmospheric conditions associated with the exceptional fire season of 2003 in portugal. Int. J. Climatol. 2006, 26, 1741–1757. [Google Scholar] [CrossRef]
  37. Trigo, R.M.; Sousa, P.M.; Pereira, M.G.; Rasilla, D.; Gouveia, C.M. Modelling wildfire activity in iberia with different atmospheric circulation weather types. Int. J. Climatol. 2013. [Google Scholar] [CrossRef]
  38. Boschetti, L.; Roy, D.; Barbosa, P.; Boca, R.; Justice, C. A modis assessment of the summer 2007 extent burned in greece. Int. J. Remote Sens. 2008, 29, 2433–2436. [Google Scholar] [CrossRef]
  39. Keeley, J.E.; Safford, H.; Fotheringham, C.; Franklin, J.; Moritz, M. The 2007 southern california wildfires: Lessons in complexity. J. Forest. 2009, 107, 287–296. [Google Scholar]
  40. Keeley, J.E.; Fotheringham, C.; Moritz, M.A. Lessons from the october 2003. Wildfires in Southern California. J. Forest. 2004, 102, 26–31. [Google Scholar]
  41. Turetsky, M.R.; Kane, E.S.; Harden, J.W.; Ottmar, R.D.; Manies, K.L.; Hoy, E.; Kasischke, E.S. Recent acceleration of biomass burning and carbon losses in alaskan forests and peatlands. Nat. Geosci. 2011, 4, 27–31. [Google Scholar] [CrossRef]
  42. Loboda, T.V.; Hoy, E.E.; Giglio, L.; Kasischke, E.S. Mapping burned area in alaska using modis data: A data limitations-driven modification to the regional burned area algorithm. Int. J. Wildl. Fire 2011, 20, 487–496. [Google Scholar] [CrossRef]
  43. Sullivan, A.L.; McCaw, W.L.; Cruz, M.G.; Matthews, S.; Ellis, P.F. Fuel, fire weather and fire behaviour in australian ecosystems. In Flammable Australia: Fire Regimes, Biodiversity and Ecosystems in a Changing World; CSIRO Publishing: Melbourne, Australia, 2012; pp. 51–79. [Google Scholar]
  44. Cruz, M.G.; Sullivan, A.L.; Gould, J.S.; Sims, N.C.; Bannister, A.J.; Hollis, J.J.; Hurley, R.J. Anatomy of a catastrophic wildfire: The black saturday kilmore east fire in victoria, australia. For. Ecol. Manag. 2012, 284, 269–285. [Google Scholar] [CrossRef]
  45. INCF. Available online: http://www.icnf.pt/portal/florestas/dfci/inc/estat-sgif (accessed on 10 February 2016).
  46. Oliveira, S.L.J.; Pereira, J.M.C.; Carreiras, J.M.B. Fire frequency analysis in Portugal (1975–2005), using Landsat-based burnt area maps. Int. J. Wildl. Fire 2012, 21, 48–60. [Google Scholar] [CrossRef]
  47. AICC. Available online: http://fire.ak.blm.gov/ (accessed on 10 February 2016).
  48. CALFIRE. Available online: http://frap.cdf.ca.gov/data/ (accessed on 10 February 2016).
  49. Koutsias, N.; Pleniou, M.; Mallinis, G.; Nioti, F.; Sifakis, N.I. A rule-based semi-automatic method to map burned areas: Exploring the usgs historical Landsat archives to reconstruct recent fire history. Int. J. Remote Sens. 2013, 34, 7049–7068. [Google Scholar] [CrossRef]
  50. Pleniou, M.; Xystrakis, F.; Dimopoulos, P.; Koutsias, N. Maps of fire occurrence—Spatially explicit reconstruction of recent fire history using satellite remote sensing. J. Maps 2013, 8, 499–506. [Google Scholar] [CrossRef]
  51. Giglio, L.; Descloitres, J.; Justice, C.O.; Kaufman, Y.J. An enhanced contextual fire detection algorithm for MODIS. Remote Sens. Environ. 2003, 87, 273–282. [Google Scholar] [CrossRef]
  52. Wolfe, R.E.; Roy, D.P.; Vermote, E. MODIS land data storage, gridding, and compositing methodology: Level 2 grid. IEEE Trans. Geosci. Remote Sens. 1998, 36, 1324–1338. [Google Scholar] [CrossRef]
  53. Ichoku, C.; Kaufman, Y.J. A method to derive smoke emission rates from MODIS fire radiative energy measurements. IEEE Trans. Geosci. Remote Sens. 2005, 43, 2636–2649. [Google Scholar] [CrossRef]
  54. Wan, Z. MODIS Land-Surface Temperature. Algorithm Theoretical Basis Document. Available online: http://modis.gsfc.nasa.gov/data/atbd/atbd_mod11.pdf (accessed on 1 August 2015).
  55. Schmidt, K.M.; Menakis, J.P.; Hardy, C.C.; Hann, W.J.; Bunnell, D.L. Development of Coarse-Scale Spatial Data for Wildland Fire and Fuel Management; General Technical Report; USDA Forest Service, Rocky Mountain Research Station: Fort Collins, CO, USA, 2002; p. 41. [Google Scholar]
  56. Nash, J.E.; Sutcliffe, J.V. River flow forecasting through conceptual models part I—A discussion of principles. J. Hydrol. 1970, 10, 282–290. [Google Scholar] [CrossRef]
  57. Turquety, S.; Logan, J.A.; Jacob, D.J.; Hudman, R.C.; Leung, F.Y.; Heald, C.L.; Yantosca, R.M.; Wu, S.; Emmons, L.K.; Edwards, D.P.; et al. Inventory of boreal fire emissions for north america in 2004: Importance of peat burning and pyroconvective injection. J. Geophys. Res. Atmos. 2007, 112, D12S03. [Google Scholar] [CrossRef]
  58. De Klerk, H. A pragmatic assessment of the usefulness of the MODIS (Terra and Aqua) 1-km active fire (MOD14A2 and MYD14A2) products for mapping fires in the fynbos biome. Int. J. Wildl. Fire 2008, 17, 166–178. [Google Scholar] [CrossRef]
  59. Benali, A.; Ervilha, A.R.; Sá, A.C.L.; Fernandes, P.M.; Pinto, R.M.S.; Trigo, R.M.; Pereira, J.M.C. Deciphering the impact of uncertainty on the accuracy of large wildfire spread simulations. Unpublished data. 2016. [Google Scholar]
  60. Giglio, L. MODIS Collection 5 Active Fire Product User’s Guide Version 2.4. 2010. Available online: http://www.fao.org/fileadmin/templates/gfims/docs/MODIS_Fire_Users_Guide_2.4.pdf (accessed on 12 April 2016).
  61. Giglio, L. Characterization of the tropical diurnal fire cycle using VIRS and MODIS observations. Remote Sens. Environ. 2007, 108, 407–421. [Google Scholar] [CrossRef]
  62. Schroeder, W.; Morisette, J.T.; Csiszar, I.; Giglio, L.; Morton, D.; Justice, C.O. Characterizing vegetation fire dynamics in brazil through multisatellite data: Common trends and practical issues. Earth Interact. 2005, 9, 1–26. [Google Scholar] [CrossRef]
  63. Morisette, J.; Giglio, L.; Csiszar, I.; Justice, C. Validation of the MODIS active fire product over southern Africa with ASTER data. Int. J. Remote Sens. 2005, 26, 4239–4264. [Google Scholar] [CrossRef]
  64. Morisette, J.T.; Giglio, L.; Csiszar, I.; Setzer, A.; Shroeder, W.; Morton, D.; Justice, C.O. Validation of MODIS active fire detection products derived from two algorithms. Earth Interact. 2005, 9, 1–25. [Google Scholar] [CrossRef]
  65. Csiszar, I.A.; Morisette, J.T.; Giglio, L. Validation of active fire detection from moderate-resolution satellite sensors: The MODIS example in northern Eurasia. IEEE Trans. Geosci. Remote Sens. 2006, 44, 1757–1764. [Google Scholar] [CrossRef]
  66. Hantson, S.; Padilla, M.; Corti, D.; Chuvieco, E. Strengths and weaknesses of MODIS hotspots to characterize global fire occurrence. Remote Sens. Environ. 2013, 131, 152–159. [Google Scholar] [CrossRef]
  67. Schroeder, W.; Oliva, P.; Giglio, L.; Csiszar, I.A. The new VIIRS 375m active fire detection data product: Algorithm description and initial assessment. Remote Sens. Environ. 2014, 143, 85–96. [Google Scholar] [CrossRef]
  68. Oliva, P.; Schroeder, W. Assessment of VIIRS 375m active fire detection product for direct burned area mapping. Remote Sens. Environ. 2015, 160, 144–155. [Google Scholar] [CrossRef]
  69. Amraoui, M.; Liberato, M.L.R.; Calado, T.J.; da Camara, C.C.; Coelho, L.P.; Trigo, R.M.; Gouveia, C.M. Fire activity over Mediterranean Europe based on information from Meteosat-8. For. Ecol. Manag. 2013, 294, 62–75. [Google Scholar] [CrossRef]
  70. Schroeder, W.; Csiszar, I.; Giglio, L.; Schmidt, C.C. On the use of fire radiative power, area, and temperature estimates to characterize biomass burning via moderate to coarse spatial resolution remote sensing data in Brazilian Amazon. J. Geophys. Res. 2010, 115, D21121. [Google Scholar] [CrossRef]
  71. Wooster, M.J.; Xu, W.; Nightingale, T. Sentinel-3 SLSTR active fire detection and FRP product: Pre-launch algorithm development and performance evaluation using MODIS and ASTER datasets. Remote Sens. Environ. 2012, 120, 236–254. [Google Scholar] [CrossRef]
  72. Freeborn, P.H.; Wooster, M.J.; Roberts, G.; Malamud, B.D.; Xu, W. Development of a virtual active fire product for Africa through a synthesis of geostationary and polar orbiting satellite data. Remote Sens. Environ. 2009, 113, 1700–1711. [Google Scholar] [CrossRef]
  73. Giglio, L.; Loboda, T.; Roy, D.P.; Quayle, B.; Justice, C.O. An active-fire based burned area mapping algorithm for the MODIS sensor. Remote Sens. Environ. 2009, 113, 408–420. [Google Scholar] [CrossRef]
  74. Roy, D.P.; Boschetti, L.; Justice, C.O.; Ju, J. The collection 5 MODIS burned area product—Global evaluation by comparison with the MODIS active fire product. Remote Sens. Environ. 2008, 112, 3690–3707. [Google Scholar] [CrossRef]
  75. Justice, C.O.; Giglio, L.; Korontzi, S.; Owens, J.; Morisette, J.T.; Roy, D.; Descloitres, J.; Alleaume, S.; Petitcolin, F.; Kaufman, Y. The MODIS fire products. Remote Sens. Environ. 2002, 83, 244–262. [Google Scholar] [CrossRef]
  76. Archibald, S.; Roy, D.P. Identifying individual fires from satellite-derived burned area data. In Proceedings of the 2009 IEEE International Geoscience and Remote Sensing Symposium (IGARSS 2009), Cape Town, South Africa, 12–17 July 2009.
  77. Price, O.F. Potential role of ignition management in reducing unplanned burning in Arnhem land, Australia. Austral Ecol. 2015, 40, 857–868. [Google Scholar] [CrossRef]
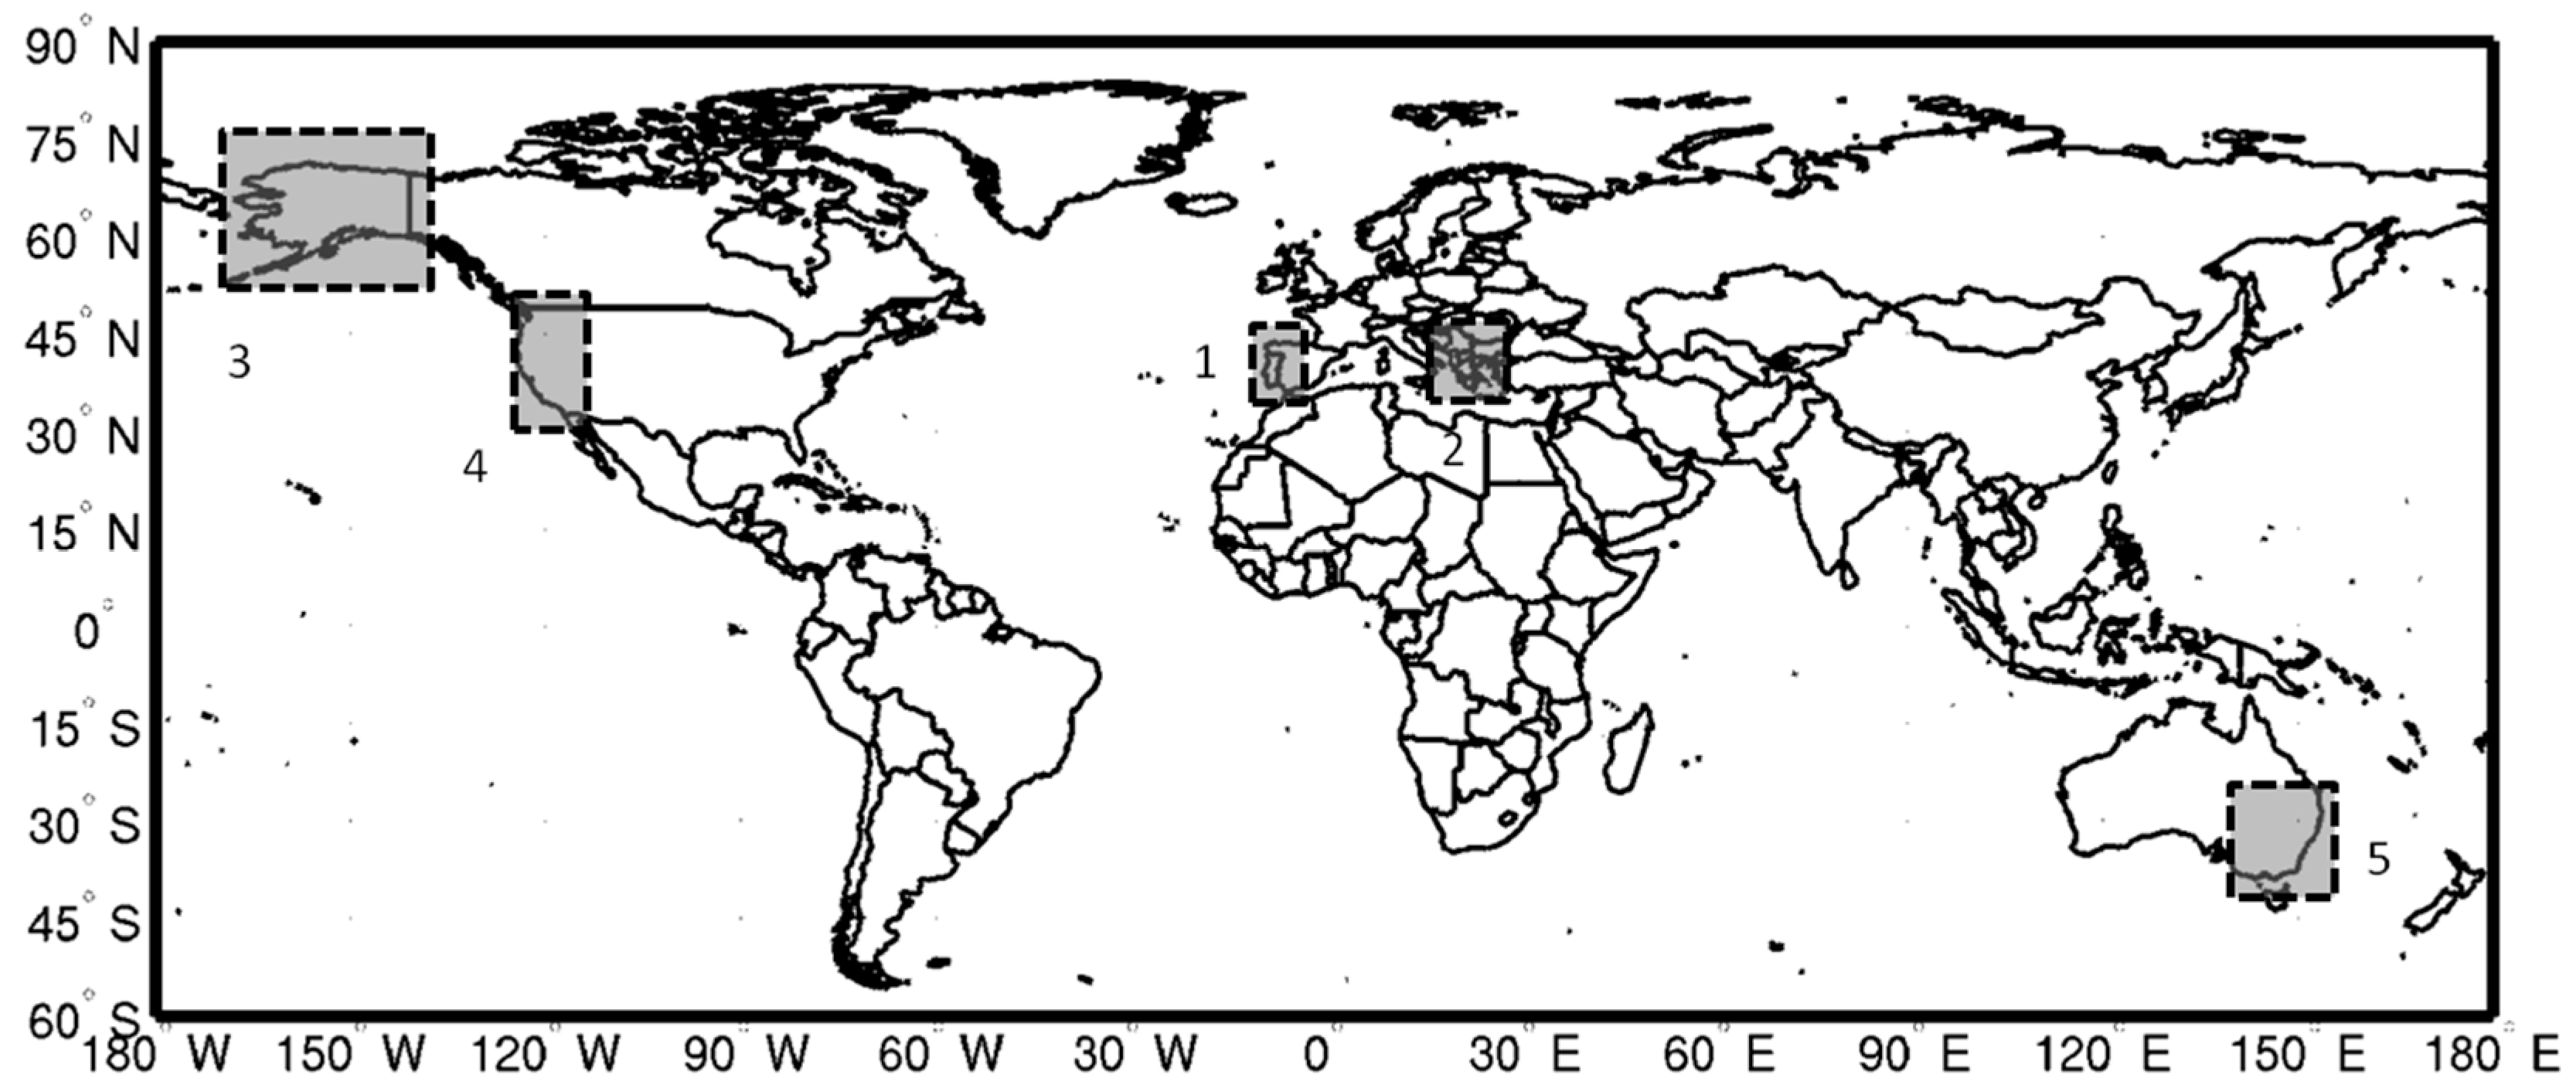
Figure 1. Study areas: (1) Portugal; (2) Greece; (3) Alaska; (4) California and (5) SE Australia.
Remotesensing 08 00326 g001
Figure 2. Methodological flow chart of the temporally constrained clustering algorithm used in the estimation of fire start/end dates.
Remotesensing 08 00326 g002
Figure 3. Evaluation sample size for the five study regions, regarding the total number of wildfire perimeters with reported start/end dates (N = 2491) and reported ignitions (N = 1010).
Remotesensing 08 00326 g003
Figure 4. Distribution of the number of fire events larger than 200 ha dated using satellite data according to their burnt area extent. The bars represent burnt area intervals with irregular spacing due to the skewed fire size distribution and the value in the x-axis represents the lower bound of the interval. The black line represents cumulative burnt area (%).
Remotesensing 08 00326 g004
Figure 5. Pairwise comparison between reported and satellite-derived fire (a) start dates (N = 2395, MEF = 0.91) and; (b) end dates (N = 1397, MEF = 0.73). The colorbar indicates the number of pairs within each satellite-derived/reported date bin. White color indicates null or very low density.
Remotesensing 08 00326 g005
Figure 6. Temporal and spatial discrepancies between reported and satellite-derived ignition data (N = 1376). The colorbar indicates the number of pairs within each reported-estimated time lag/distance bin.
Remotesensing 08 00326 g006
Figure 7. Relation between temporal and spatial uncertainty of satellite-derived ignitions (N = 2379). The colorbar indicates the number of pairs within each temporal/spatial uncertainty bin.
Remotesensing 08 00326 g007
Figure 8. Interquartile distribution of spatial and temporal uncertainty against burnt area extent. The colorbars correspond to the percentiles of temporal uncertainty (orange color bar) and spatial uncertainty (blue color bar).
Remotesensing 08 00326 g008
Figure 9. Comparison between (a) temporal discrepancy and temporal uncertainty of satellite-derived ignitions (hours); and (b) temporal discrepancy and spatial uncertainty of satellite-derived ignitions (hours) (N = 1376). The colorbar indicates the number of pairs within each temporal uncertainty/reported-estimated time lag bin (a) and spatial uncertainty/reported-estimated distance bin.
Remotesensing 08 00326 g009
Figure 10. Main causes for the absence of satellite-derived fire dates and ignitions: (a) frequency and (b) associated fire size distribution (N = 1135). For the fire size distribution, the boxes represent the interquartile range and the horizontal grey lines, the 5th and 95th percentiles. The median is represented in black.
Remotesensing 08 00326 g010
Table 1. Temporal coverage and sources of the fire perimeters and databases containing information on fire dates and ignitions.
RegionFire PerimetersFire DatesIgnitionsSources
Portugal2000–20092001–20092001–2009[45,46]
Alaska2000–20132001–20132001–2010[21,47]
California2000–20112001–20112001–2010[21,48]
Greece2000–20112000–20072000–2007[49,50]
SE Australia2000–20112000–20112000–2008NSW Office of Environment and Heritage (unpublished data)
Table 2. Fraction of total burnt area (%) covered with data of wildfires’ start/end dates and ignitions (between brackets) for all study regions.
Satellite-Derived Data AvailableSatellite-Derived Data Unavailable
Reported Data Available74.5 (86.6)15.4 (6.2)
Reported Data not Available8.0 (5.0)2.1 (2.3)
Table 3. Region-by-region Model Efficiency Index (MEF) and sample size (between brackets) for fire start and end dates.
RegionStart DateEnd Date
Portugal0.77 (394)0.41 (139)
Greece0.69 (12)0.85 (11)
Alaska0.79 (564)−0.28 (503)
California0.94 (589)0.77 (212)
SE Australia0.88 (766)0.89 (532)
All Regions0.91 (2325)0.73 (1397)