
Optical Models for Remote Sensing of Colored Dissolved Organic Matter Absorption and Salinity in New England, Middle Atlantic and Gulf Coast Estuaries USA

Abstract
:
1. Introduction
- (1)
- Derive a single set of coefficients which can be used in an optical model to estimate the range of CDOM absorptions found in estuarine, inland, and coastal environments along the US East and Gulf Coasts.
- (2)
- Create a general salinity model, which uses the derived CDOM absorption coefficients to estimate salinities from oligohaline (salinity < 5) to polyhaline (salinity > 20) waters from New England to the Gulf of Mexico.
- (1)
- Use regression analysis to derive a spectrally-based CDOM absorption algorithm based on the relationship between remote sensing reflectances (Rrs) retrieved from in situ optical data and laboratory measured CDOM absorption coefficients.
- (2)
- Compare spectrally-derived CDOM absorption coefficients to laboratory measured CDOM absorption coefficients.
- (3)
- Use regression analysis to derive a salinity algorithm based on the relationship between laboratory measured CDOM absorption coefficients and in situ salinity values.
- (4)
- Compare predicted salinity values to in situ values of salinity.
- (5)
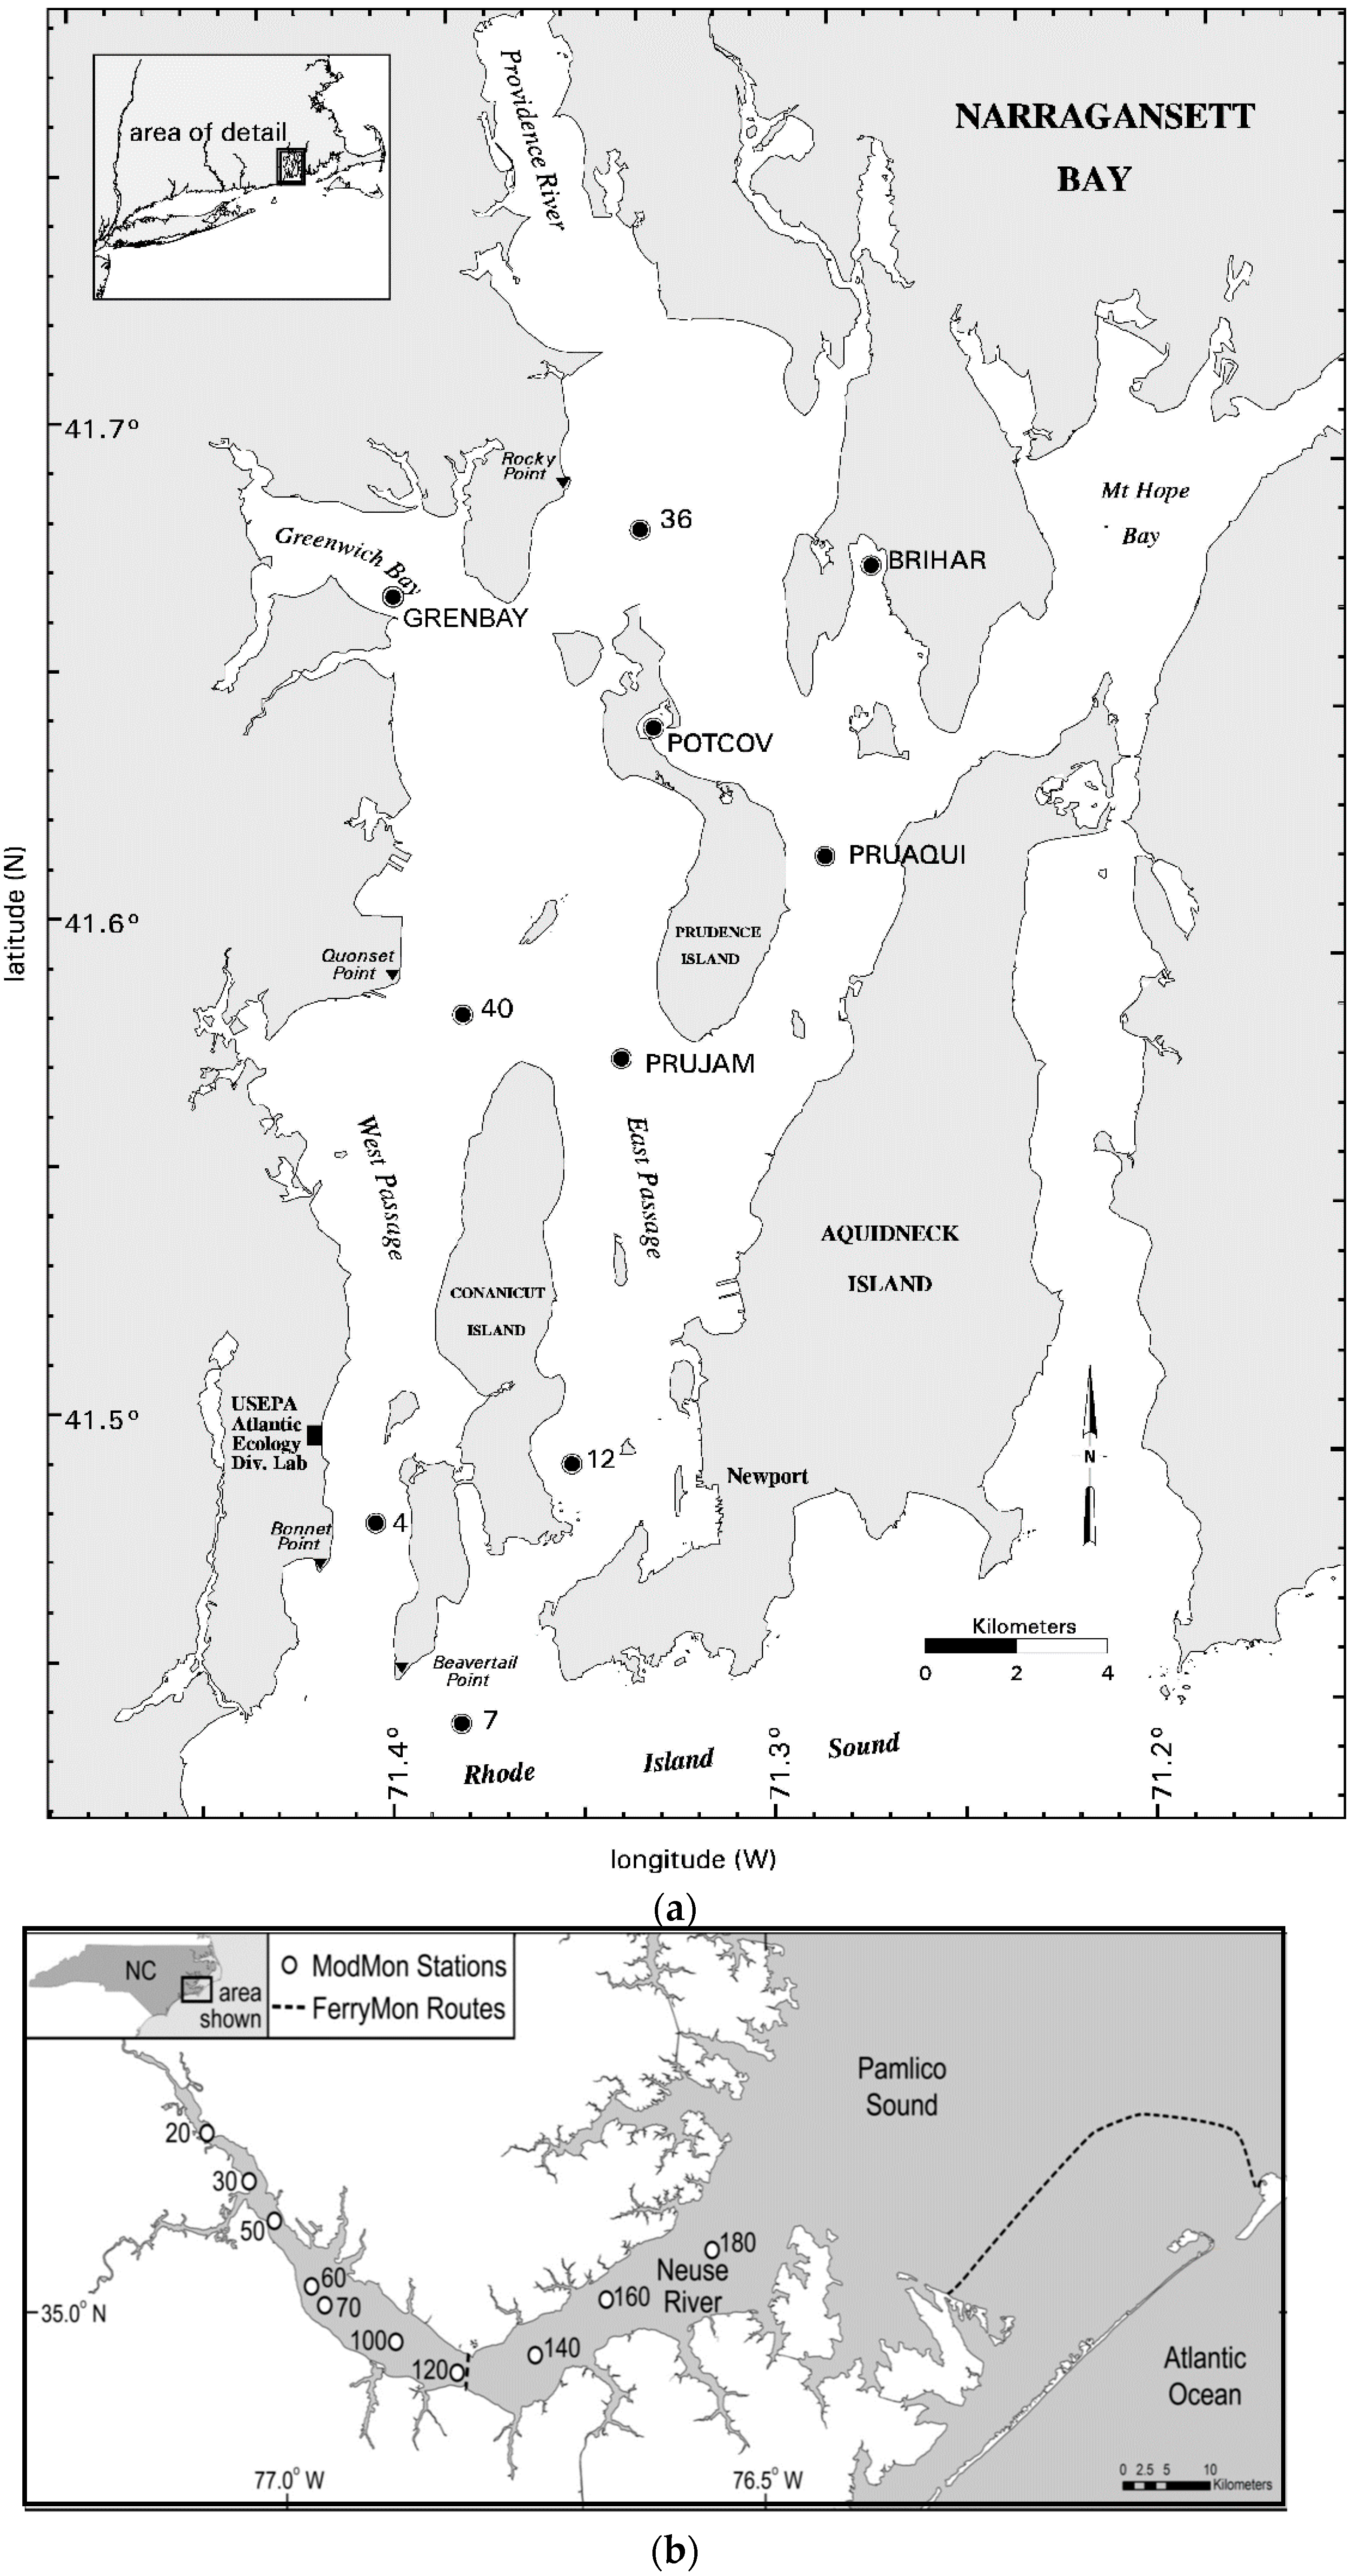
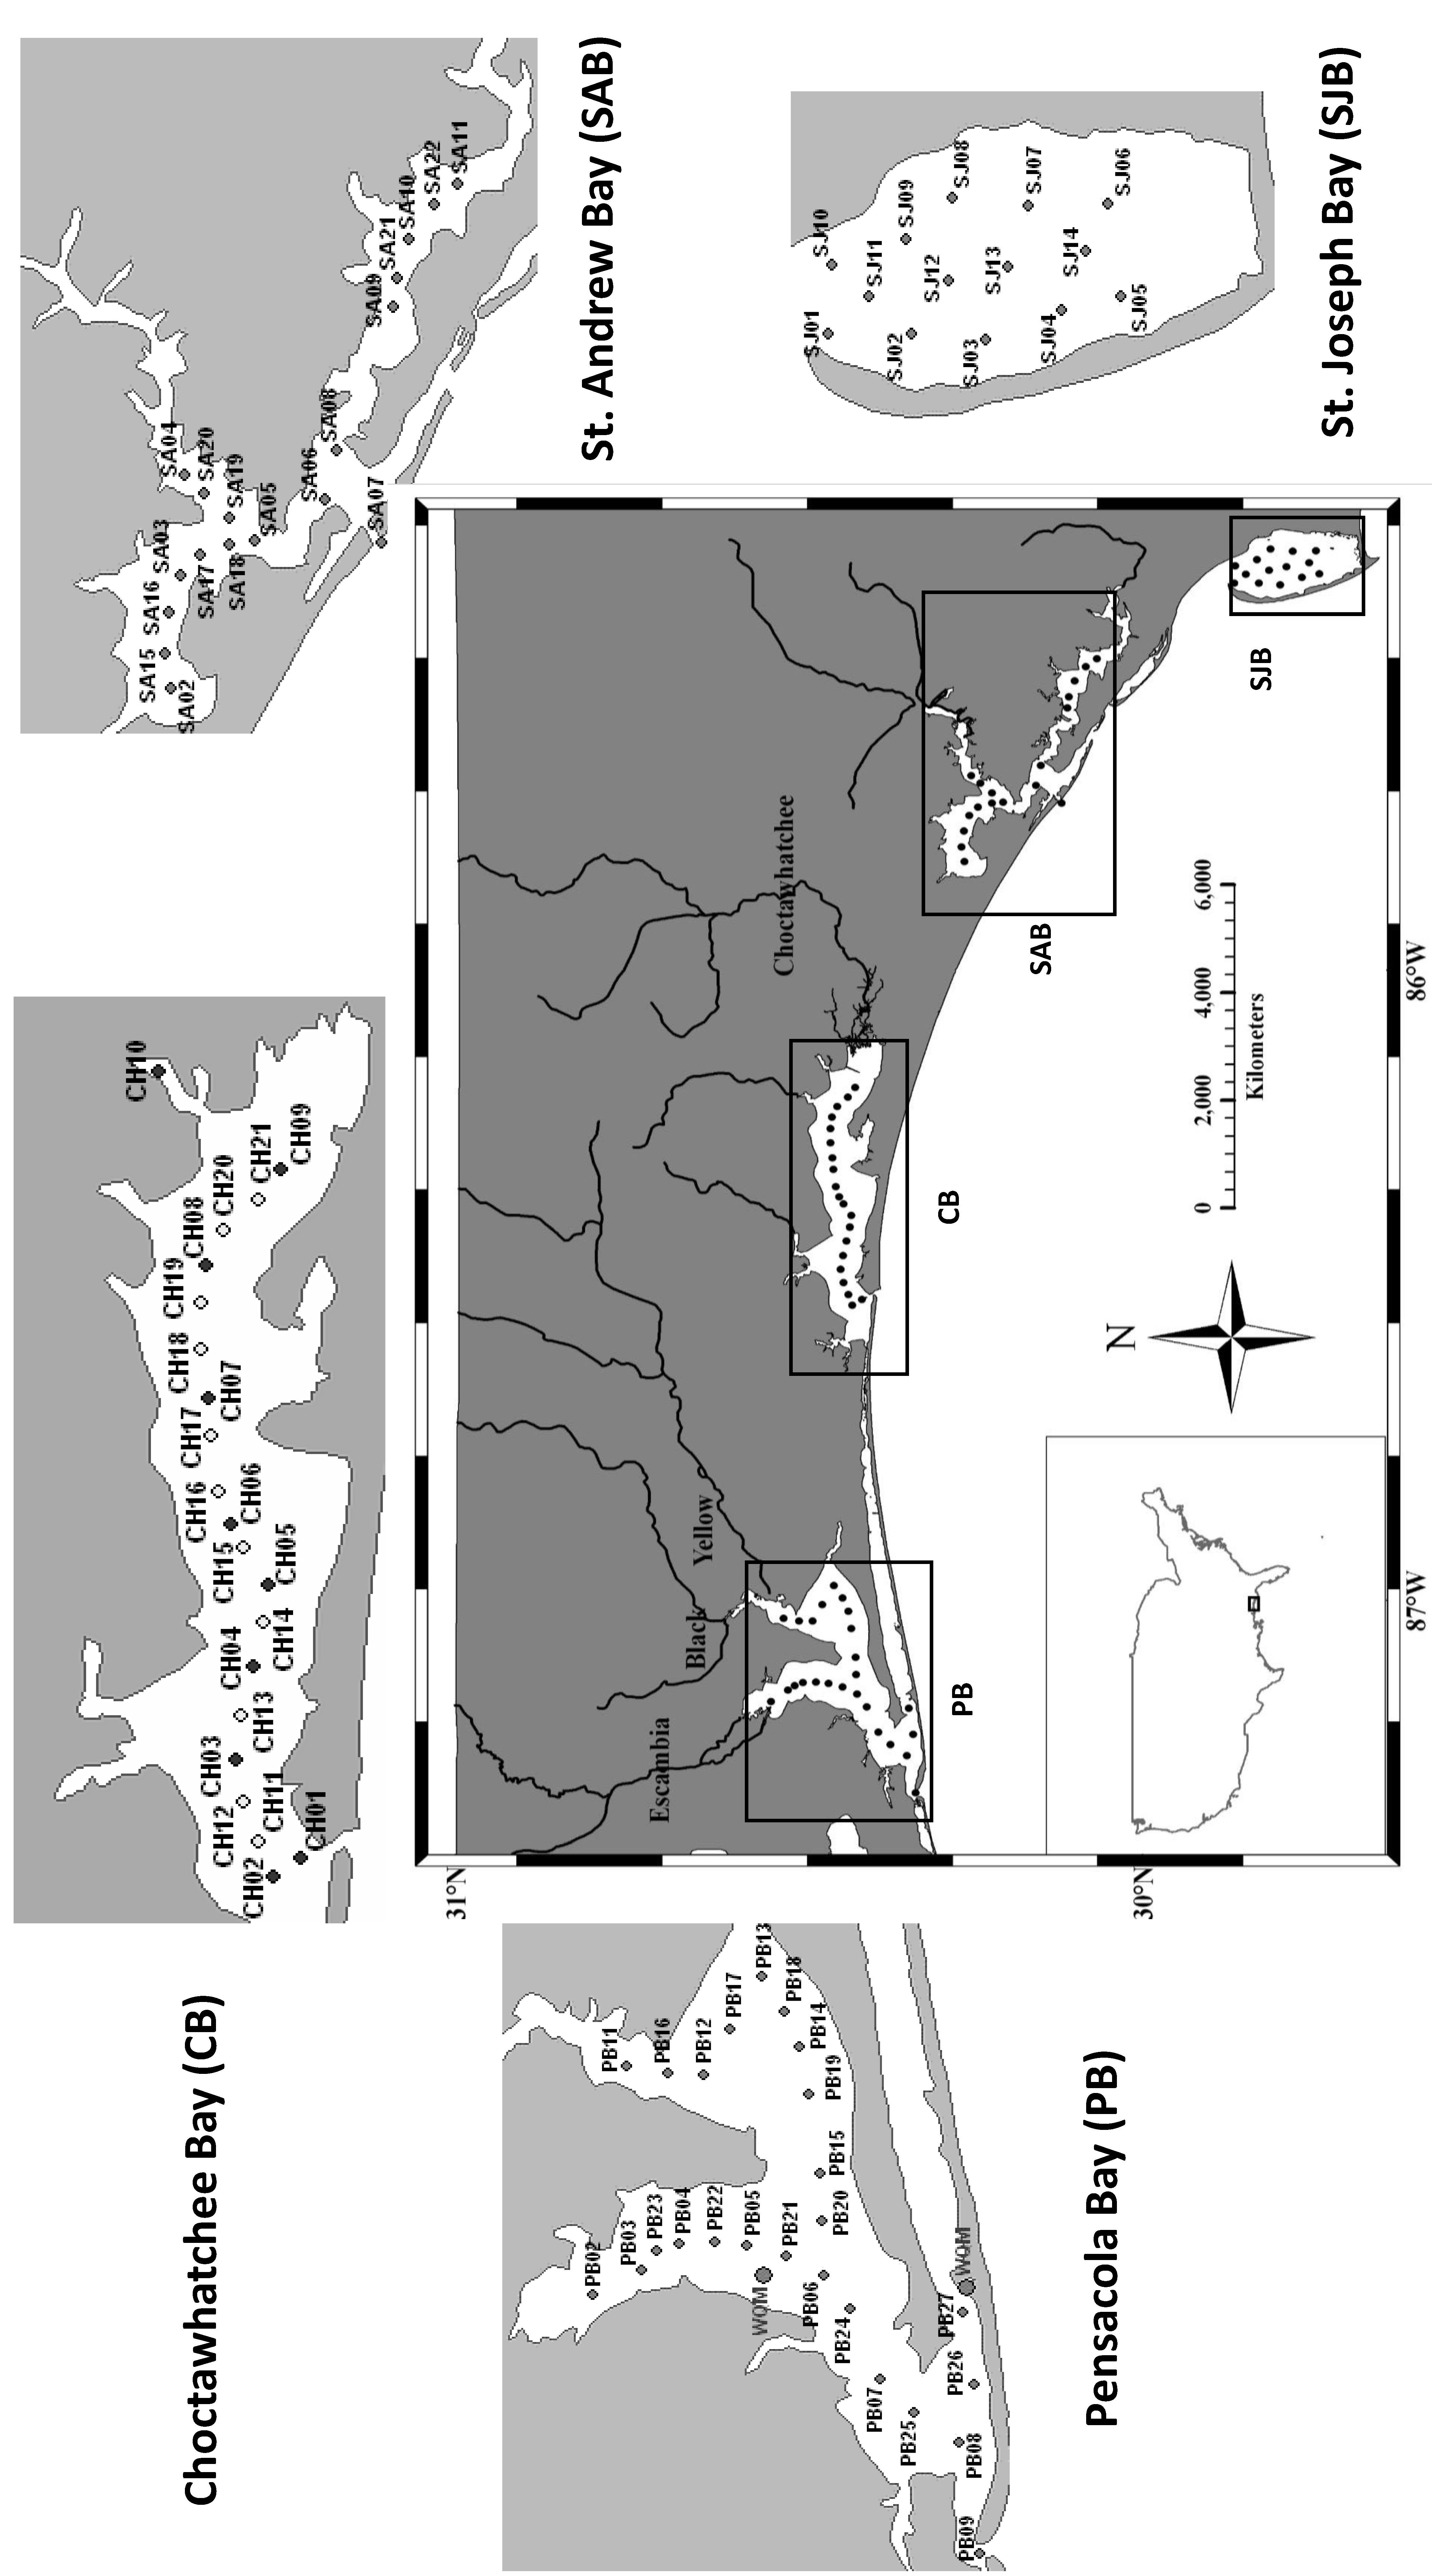
- Evaluate these algorithms using in situ radiometric data, laboratory measured CDOM absorption coefficients, and in situ salinity measurements from Narragansett Bay (Rhode Island), New Bedford Harbor (Massachusetts), Neuse River (North Carolina), Pensacola Bay (Florida), Choctawhatchee Bay (Florida), St. Andrews Bay (Florida), St. Joseph Bay (Florida) and Gulf of Mexico inner continental shelf.
- (6)
- Using regression analysis, validate the performance of the CDOM and salinity algorithms in Pensacola and Choctawhatchee Bays during summer 2011 using match-ups between Hyperspectral Imager for Coastal Ocean (HICO) spectral data, in situ salinity data, and laboratory measured CDOM absorption coefficients from these estuaries.
- (7)
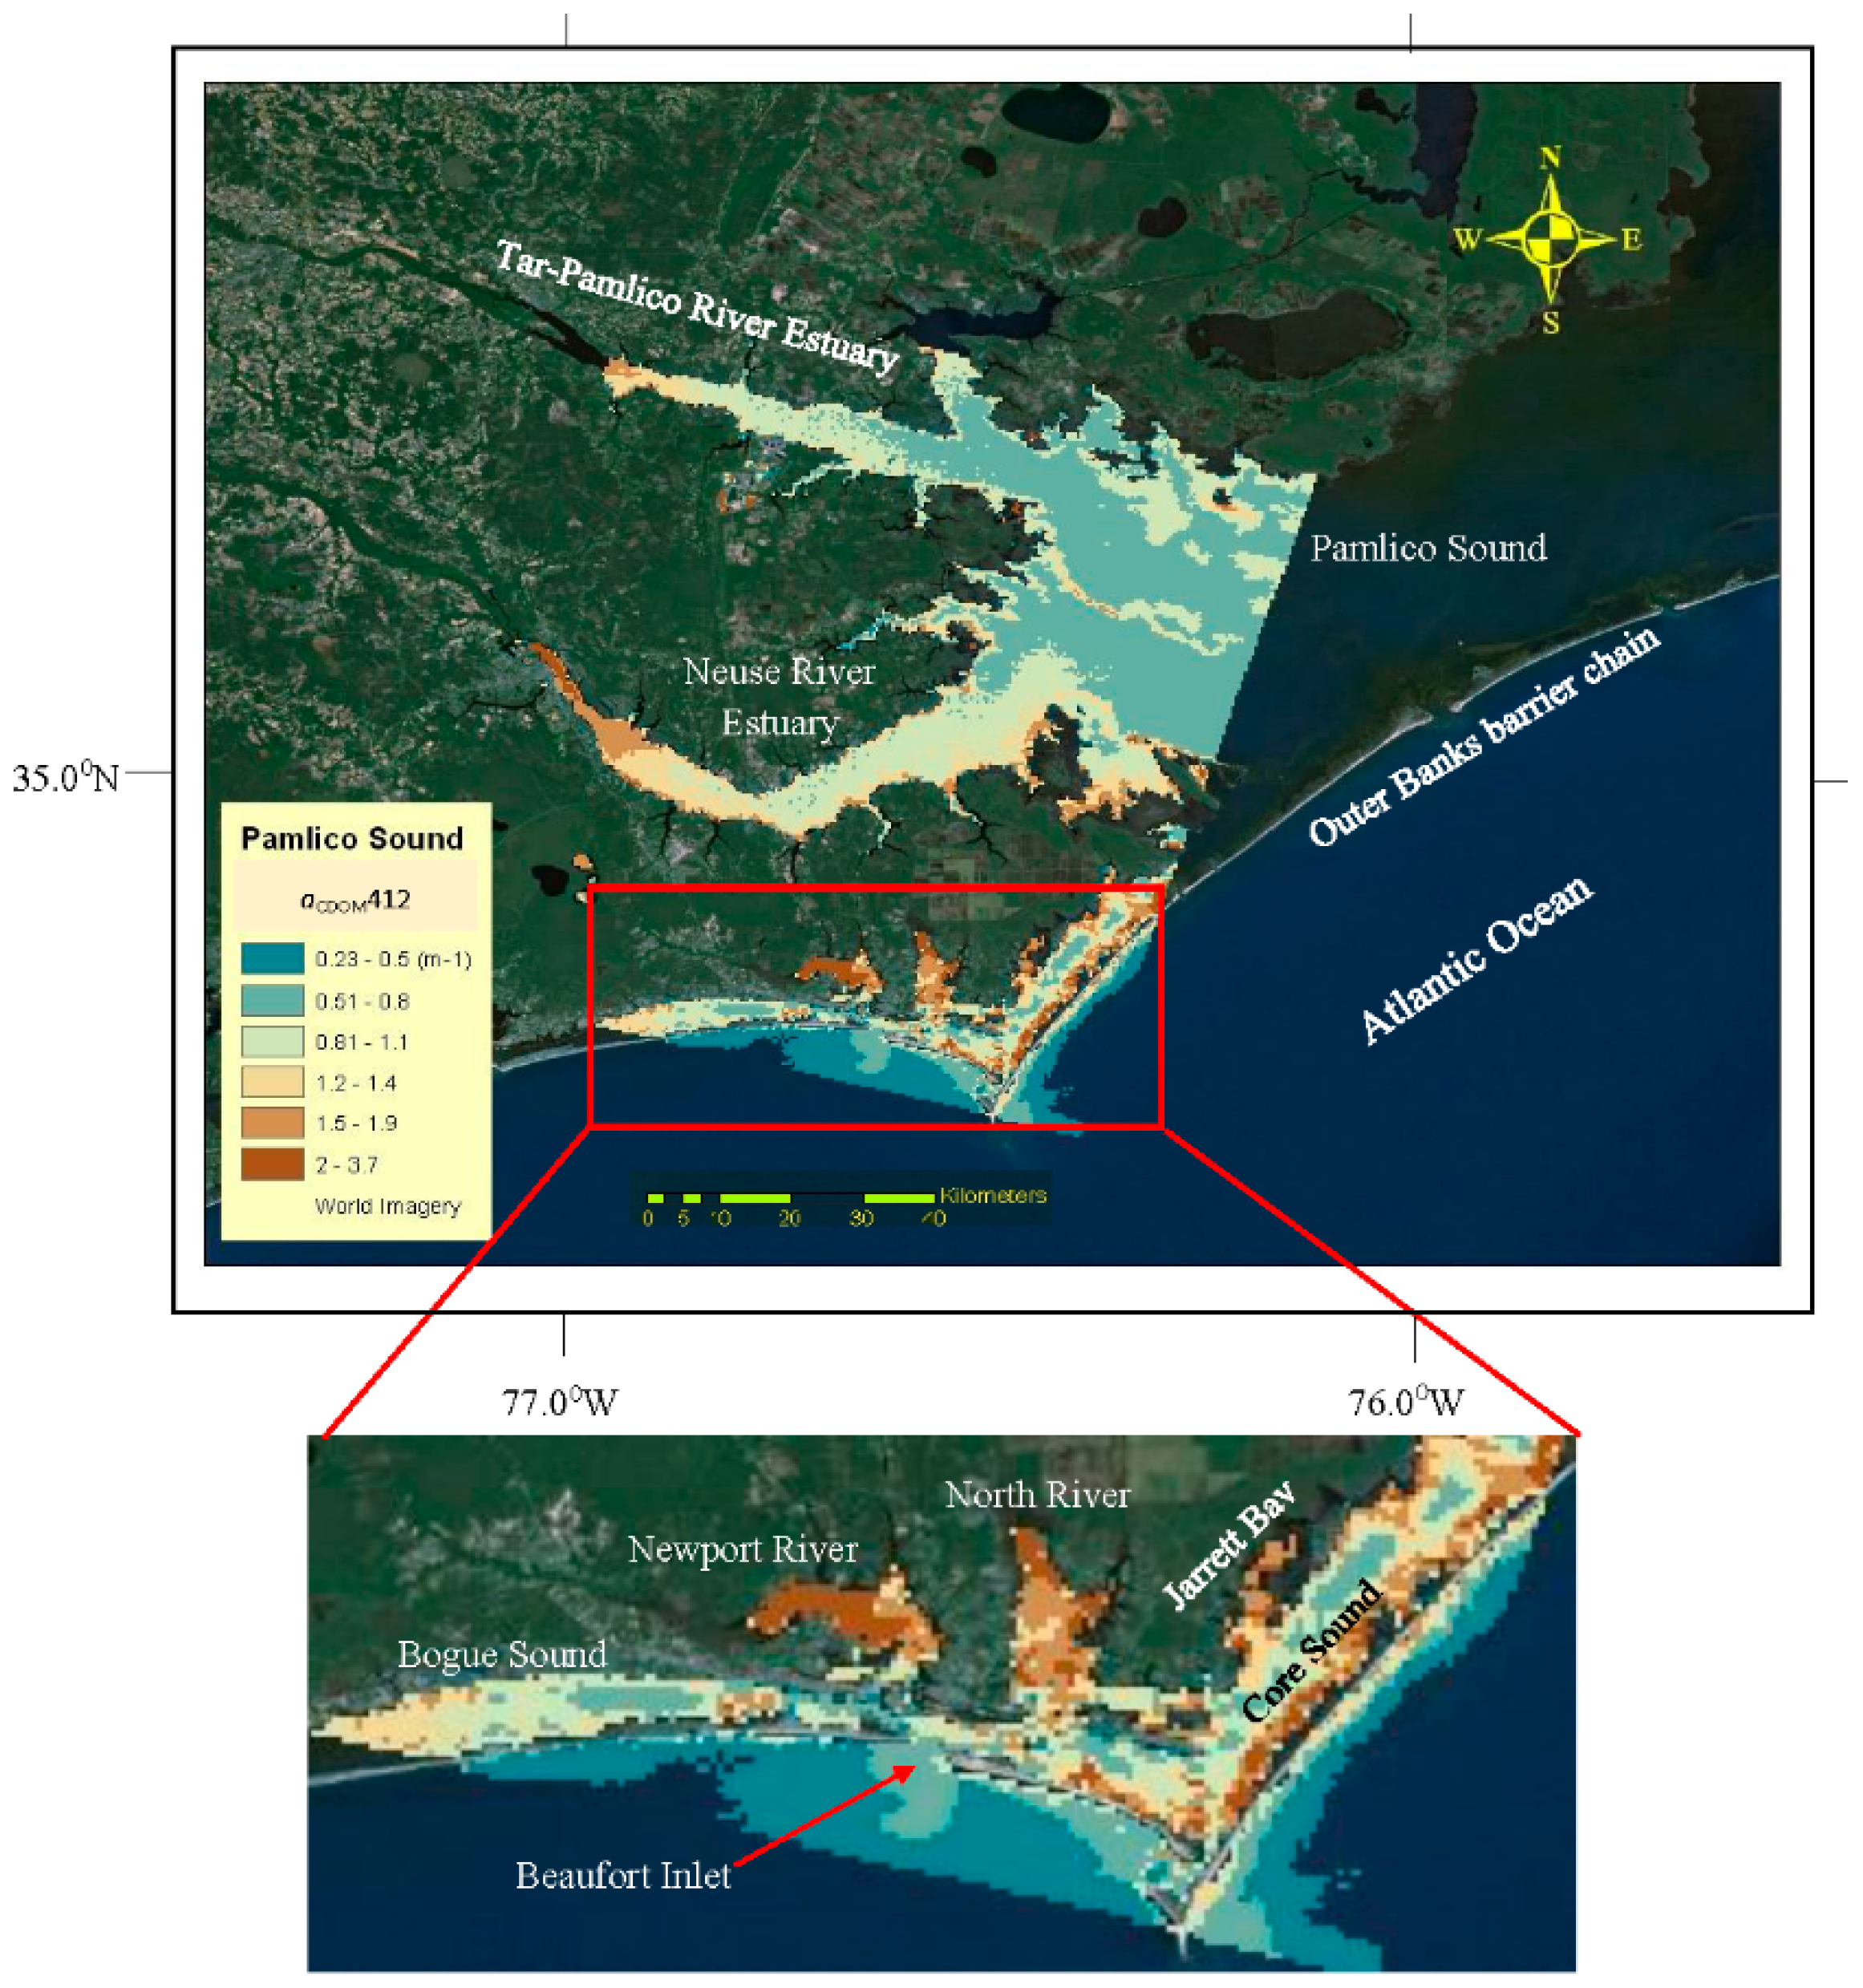
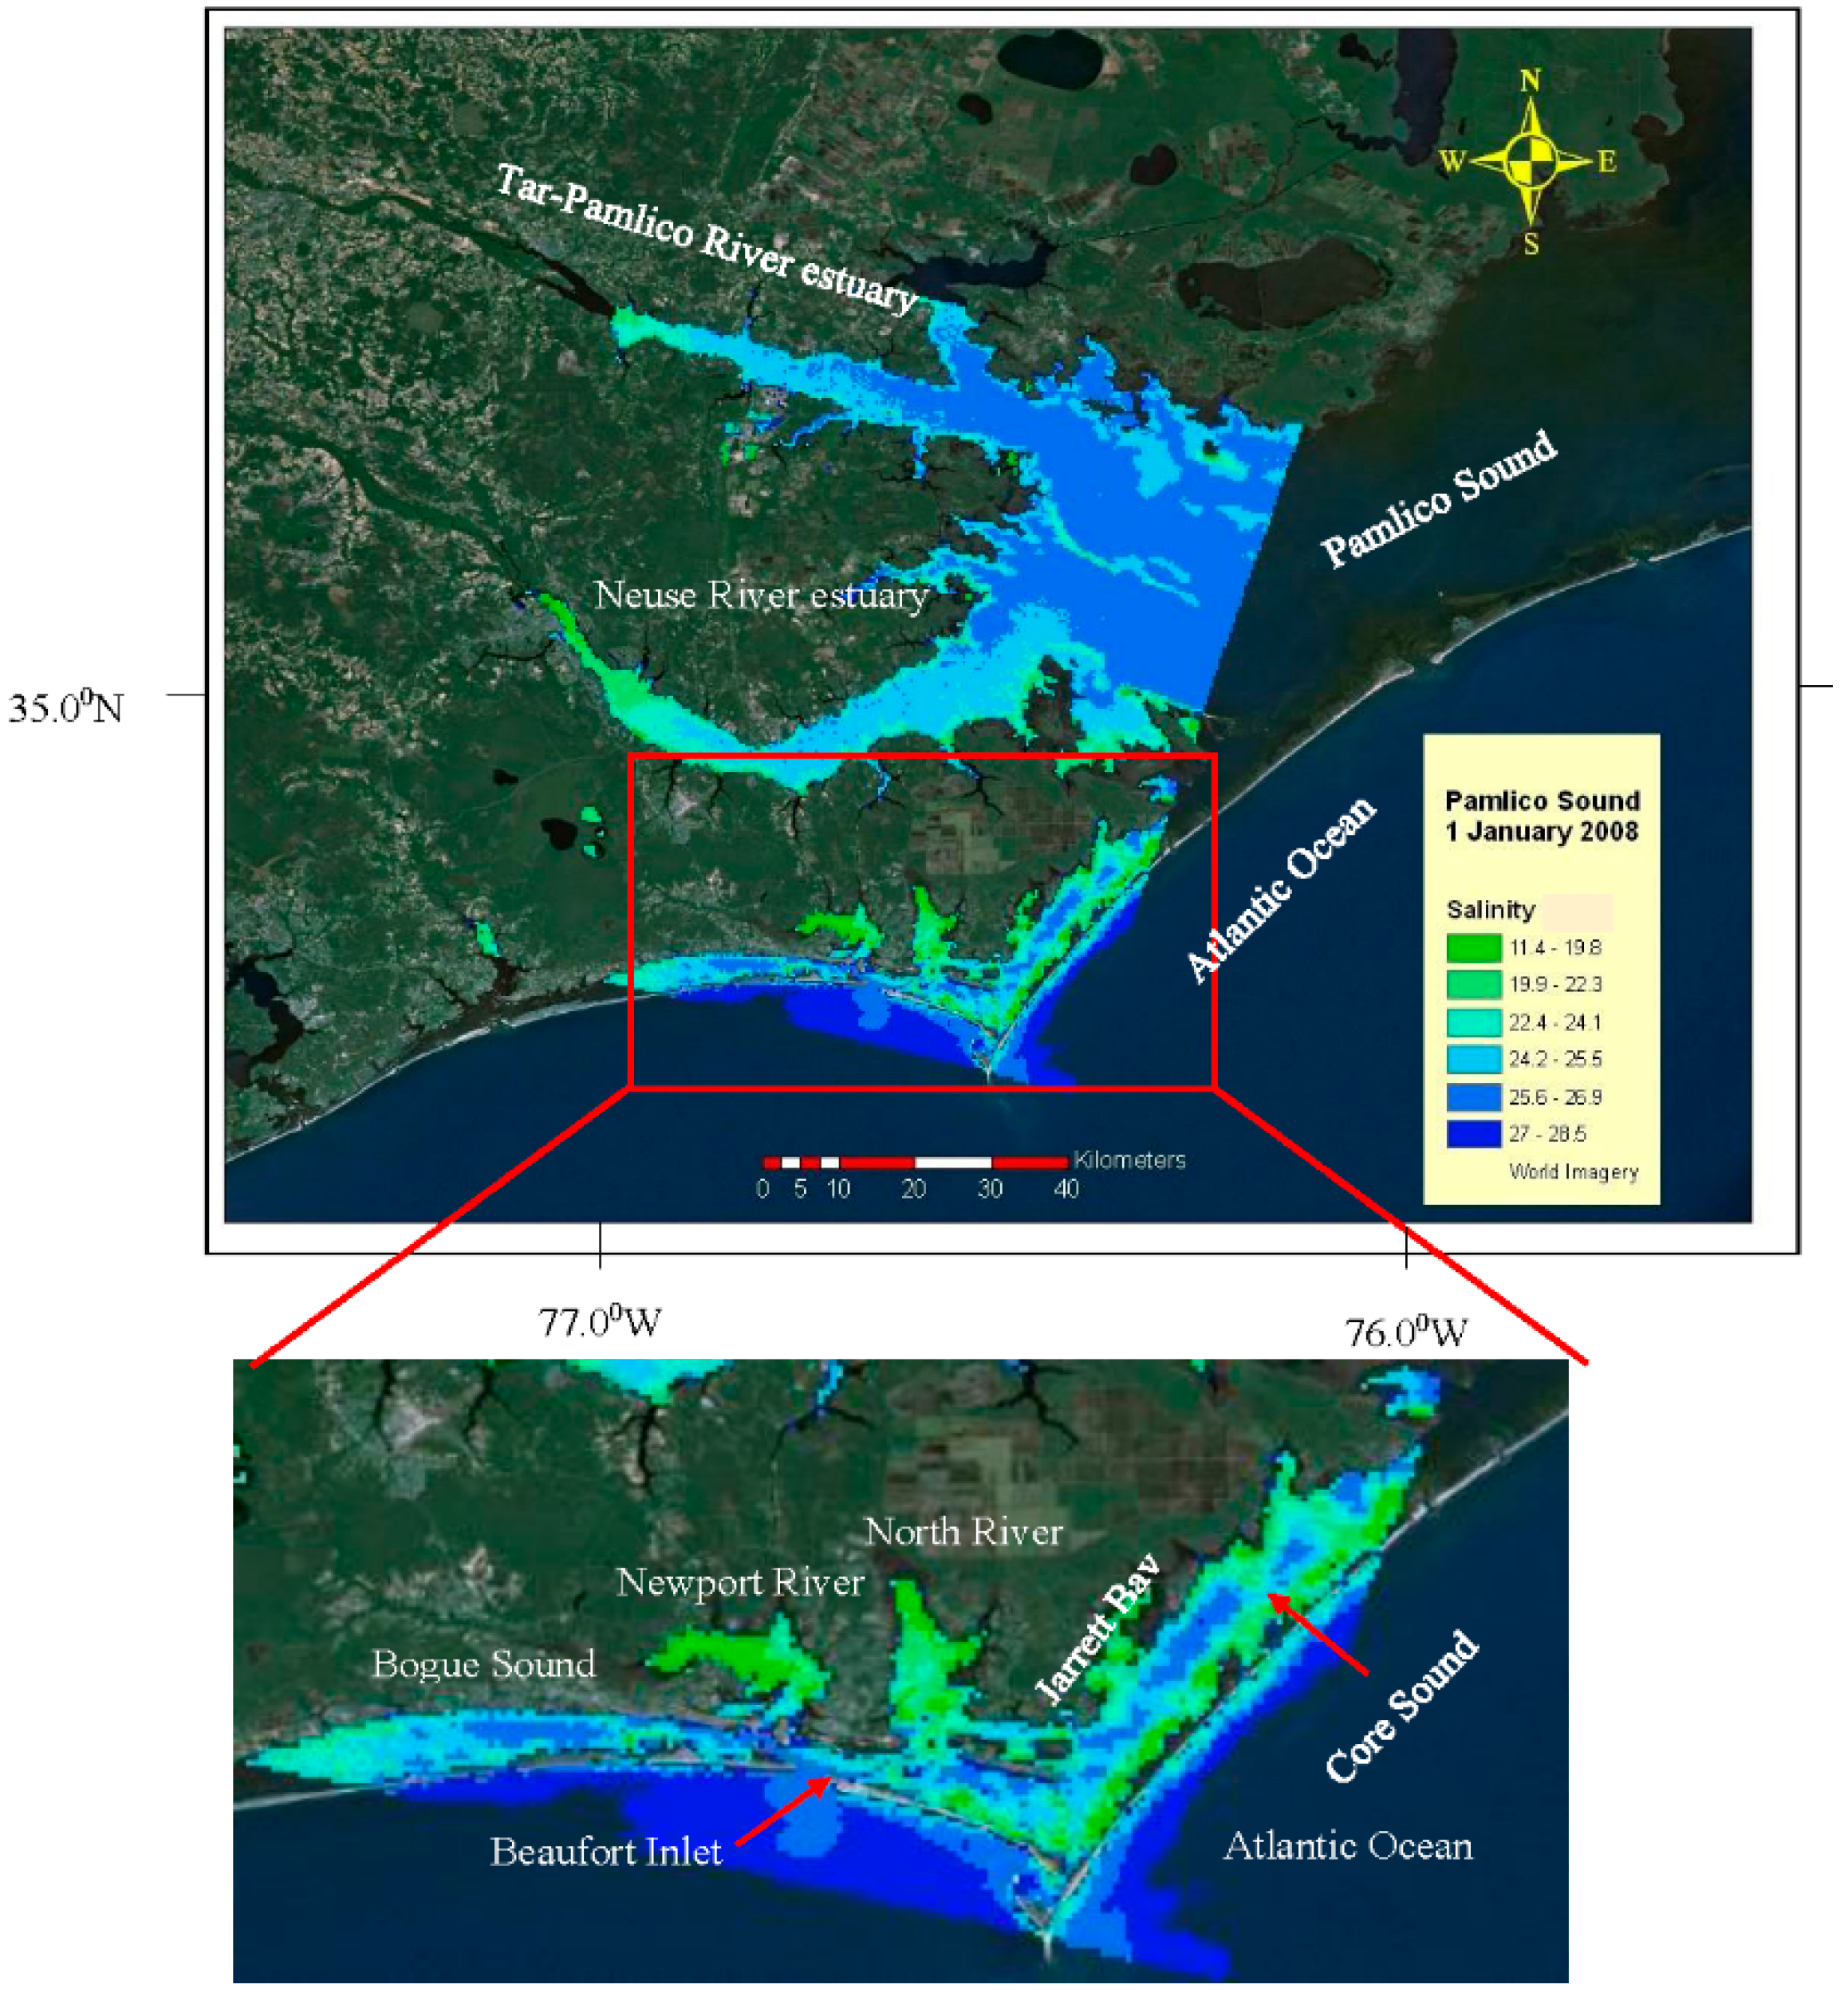
- As an example of the applicability of these algorithms to other satellite sensor data, apply the CDOM absorption and salinity algorithms to a full resolution (300 m) Moderate Resolution Imaging Spectrometer (MERIS) image of the Neuse River estuary to illustrate the spatial distribution of CDOM absorptions and surface salinities within one of the most important commercial seafood nurseries along the US East Coast.
2. Materials and Methods
2.1. Spectral Measurements
2.2. Determination of CDOM Absorption Coefficients
2.3. CDOM Algorithm Development
2.4. Salinity Model Development
2.5. Validation of CDOM and Salinity Algorithm Performance
2.6. Application Example
3. Results
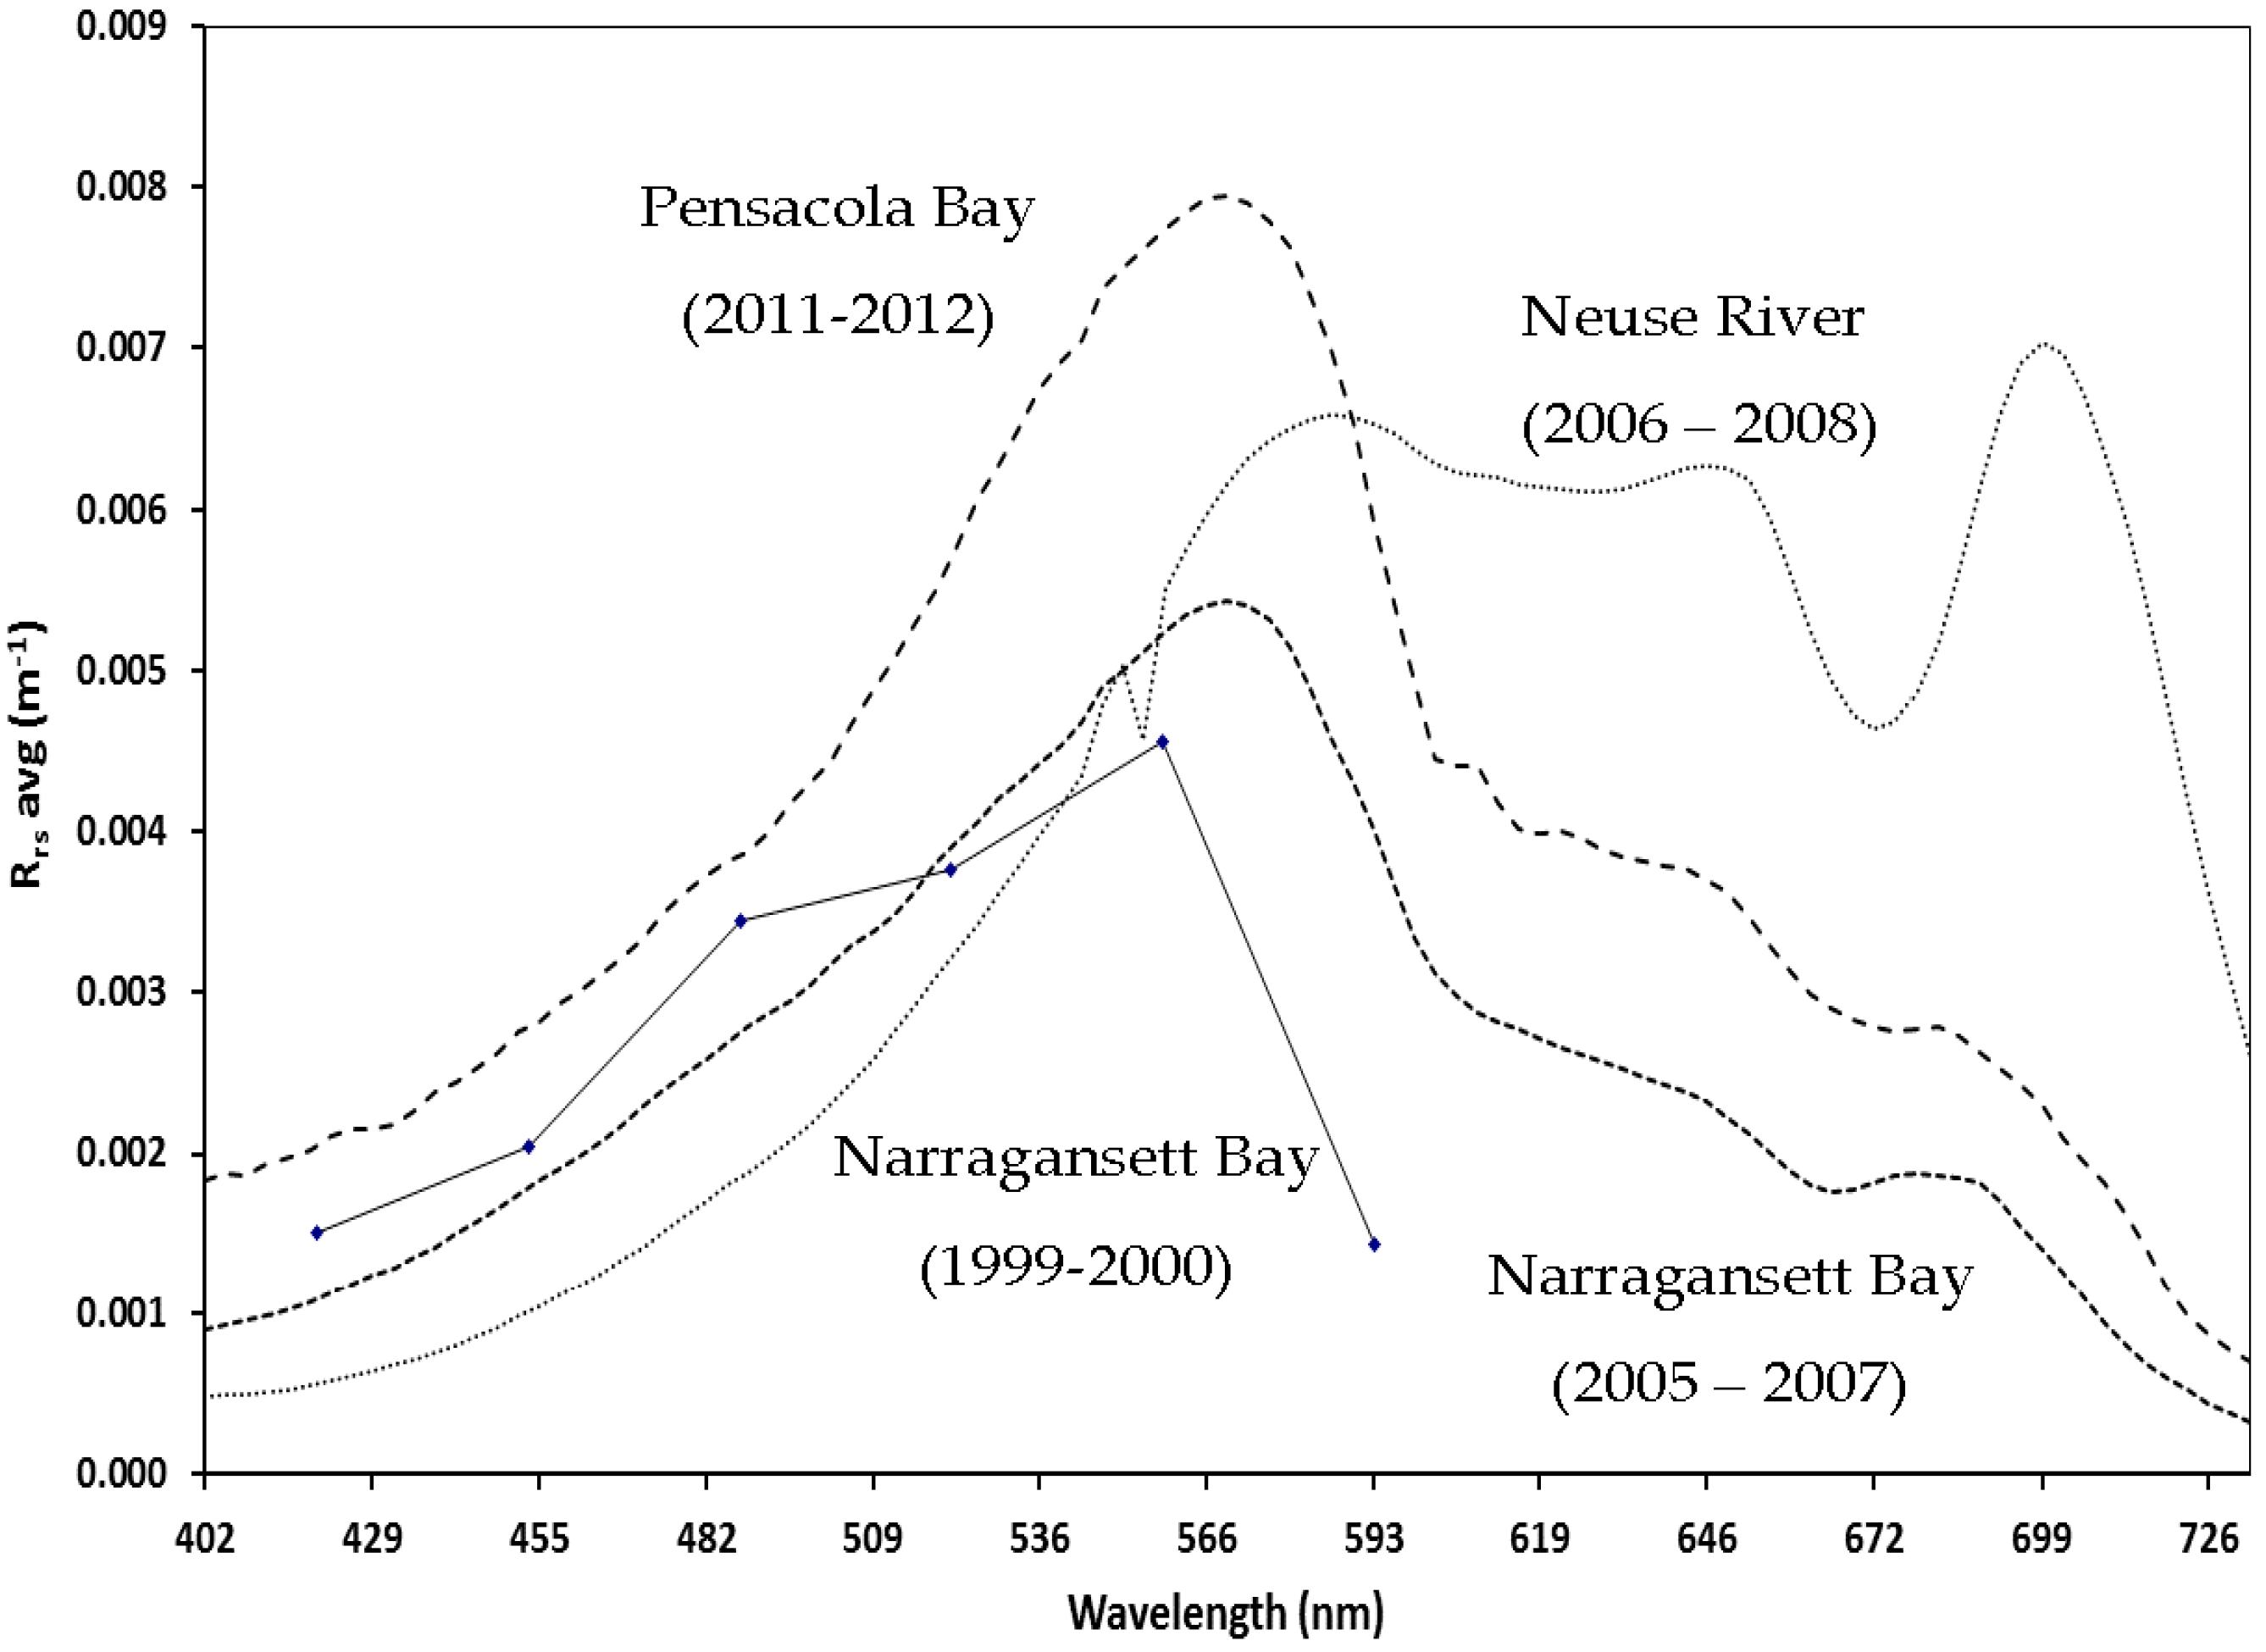
3.1. Spectral Measurements
3.2. Determination of CDOM Absorption Coefficients
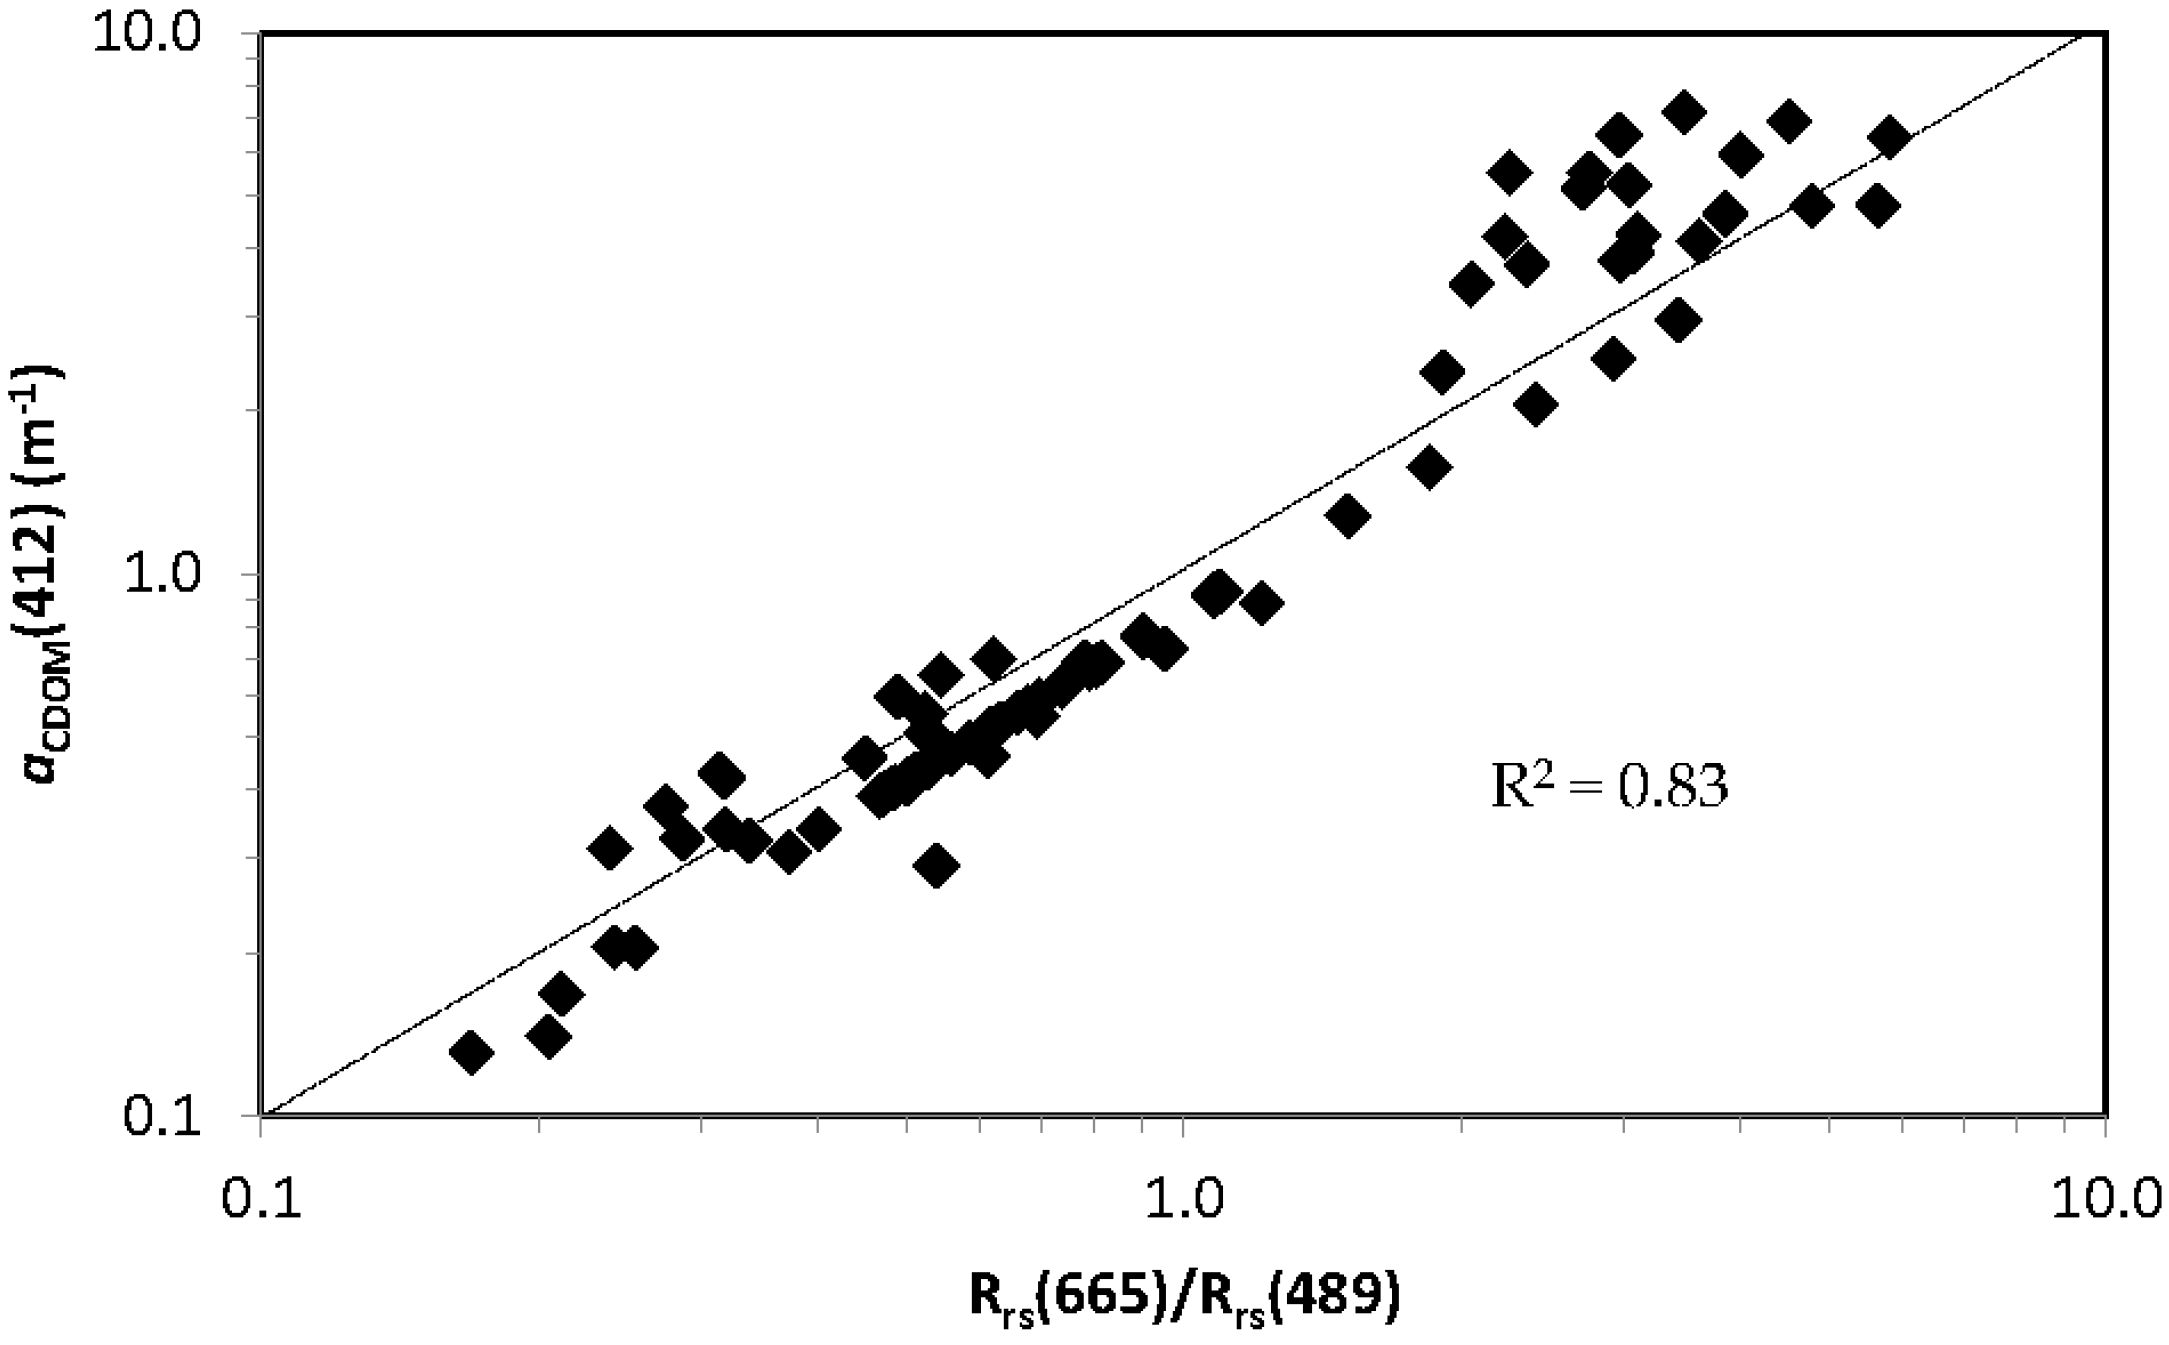
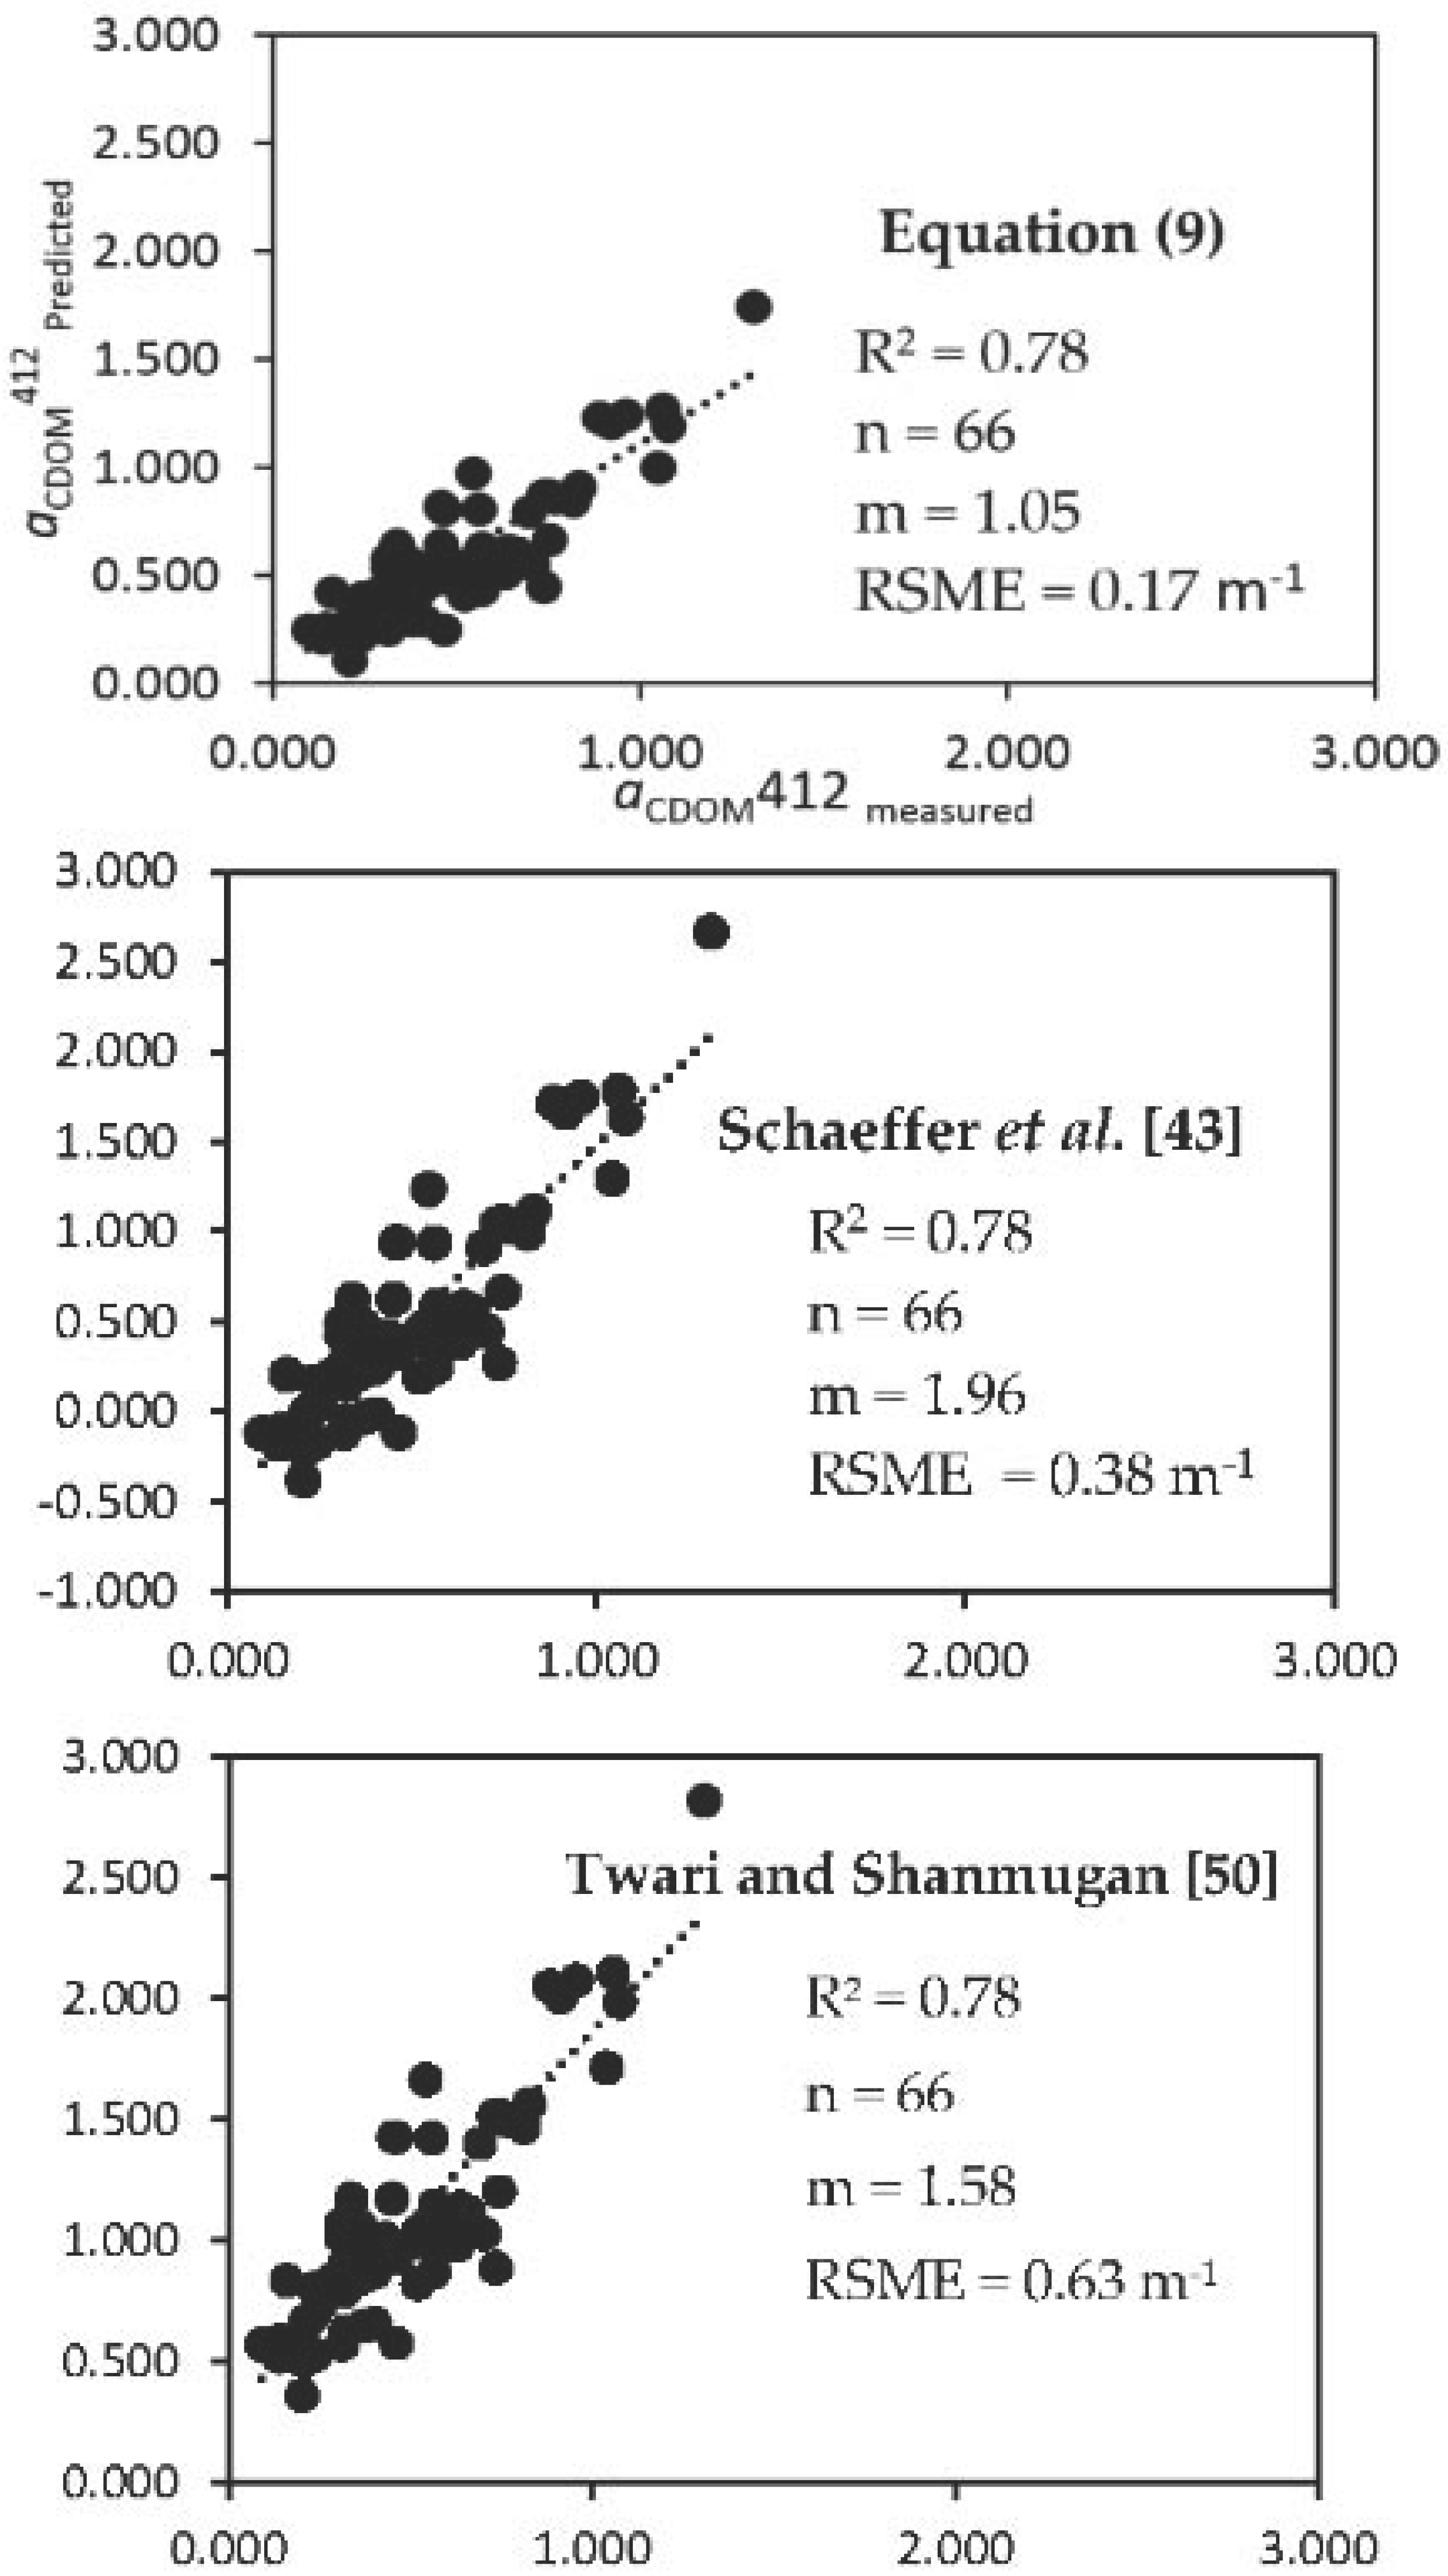
3.3. CDOM Absorption Algorithm
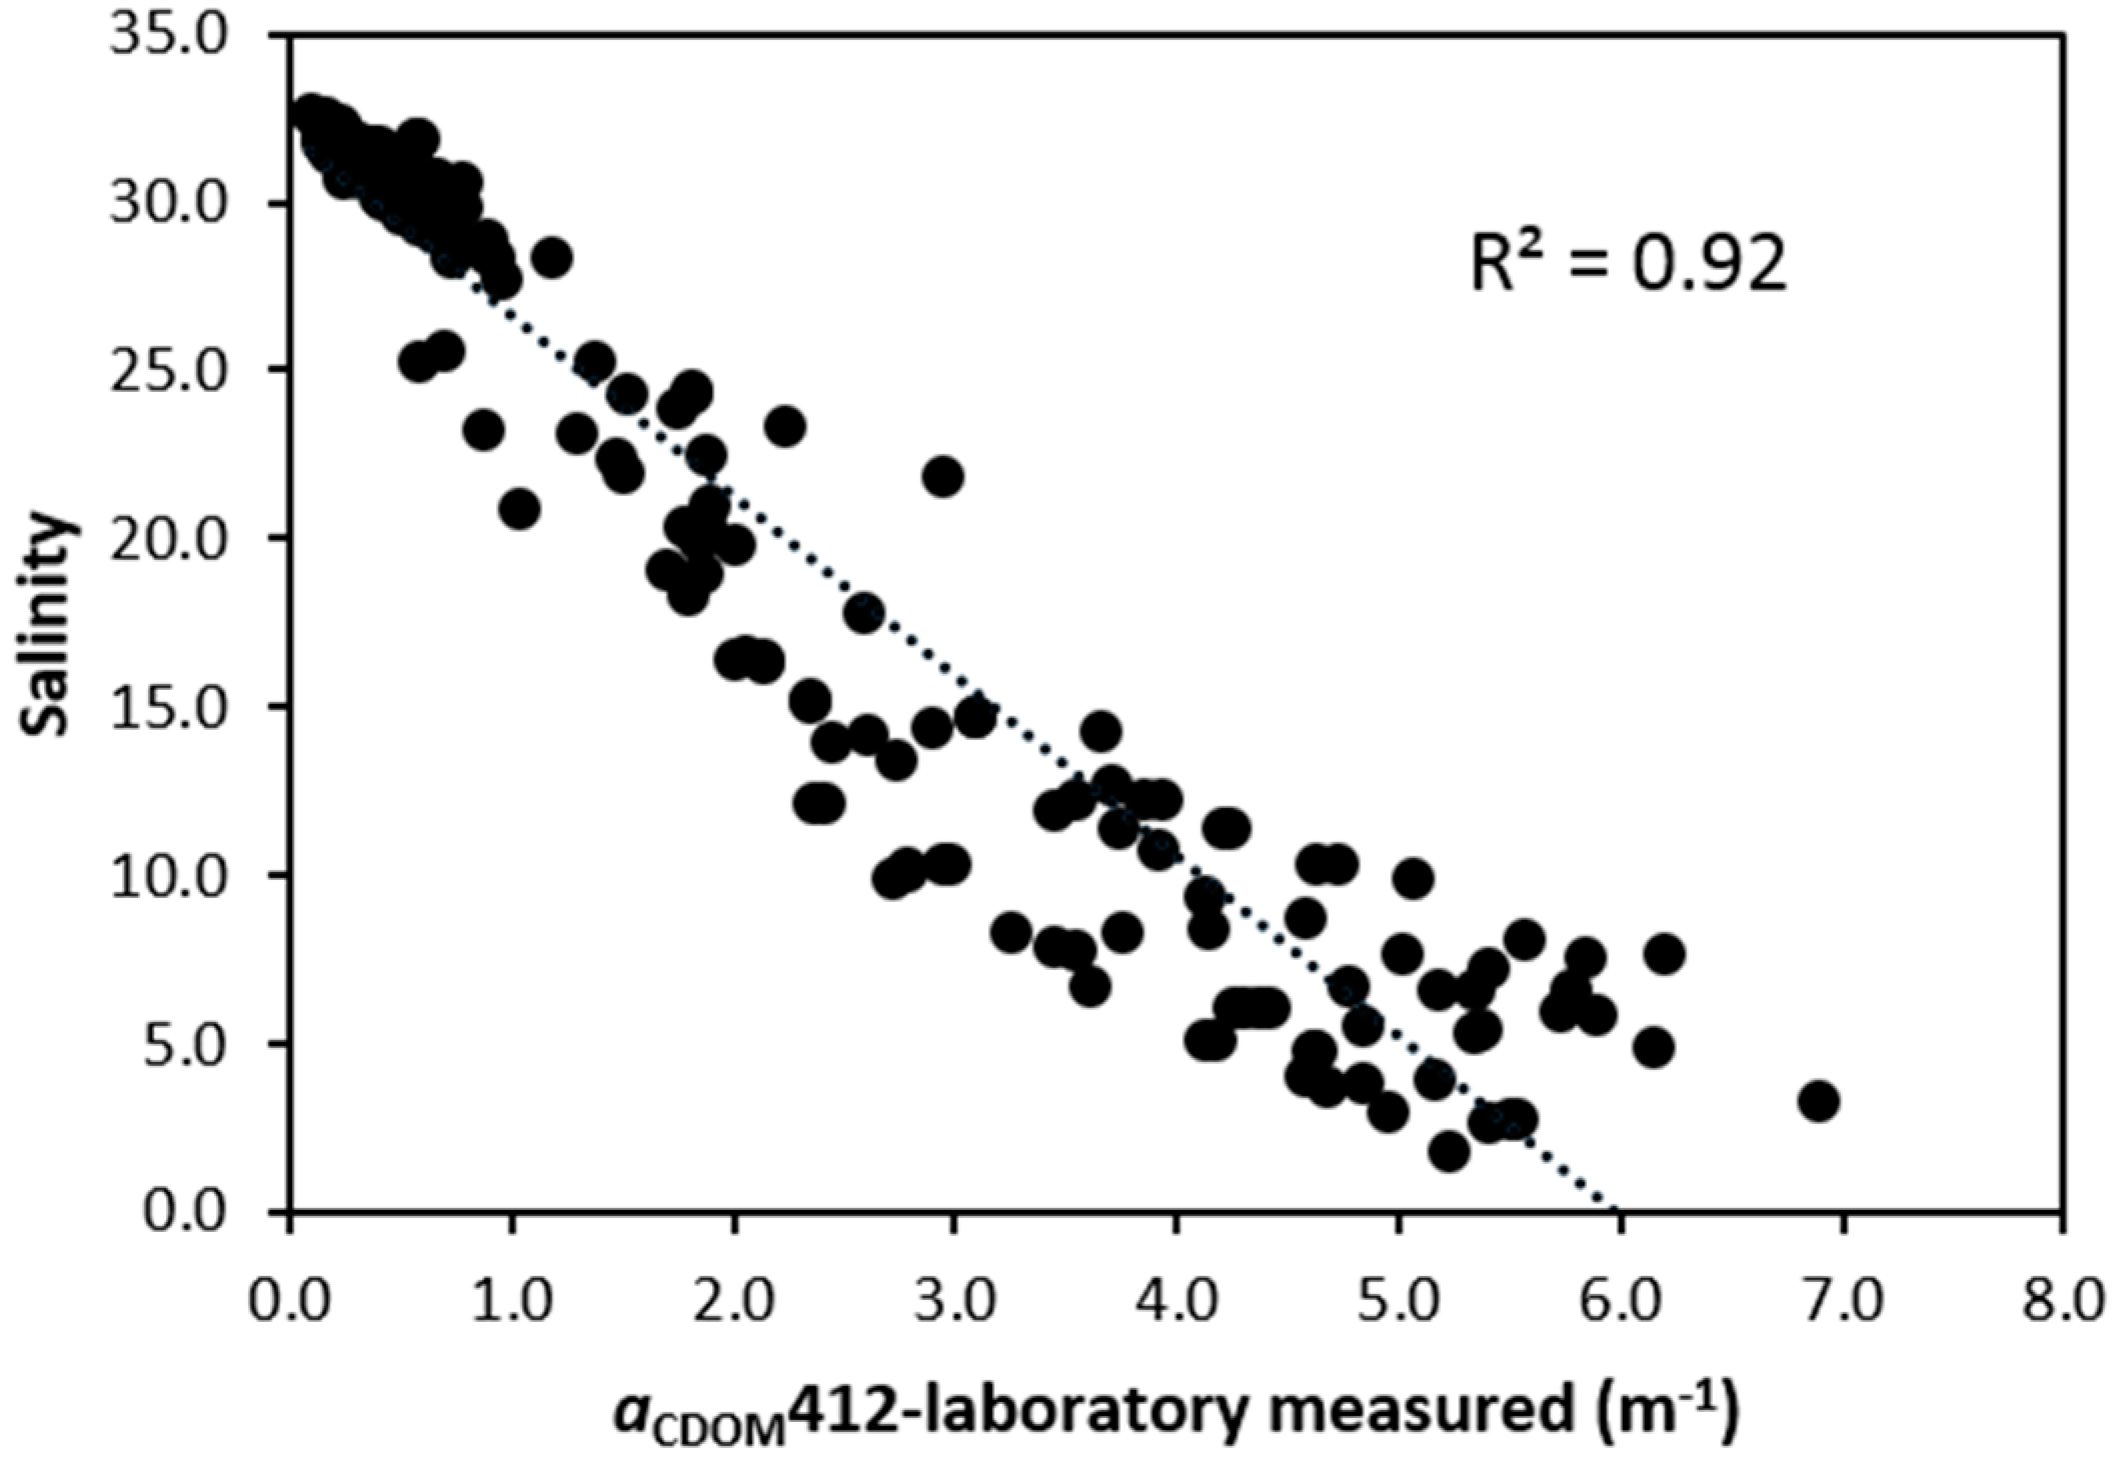
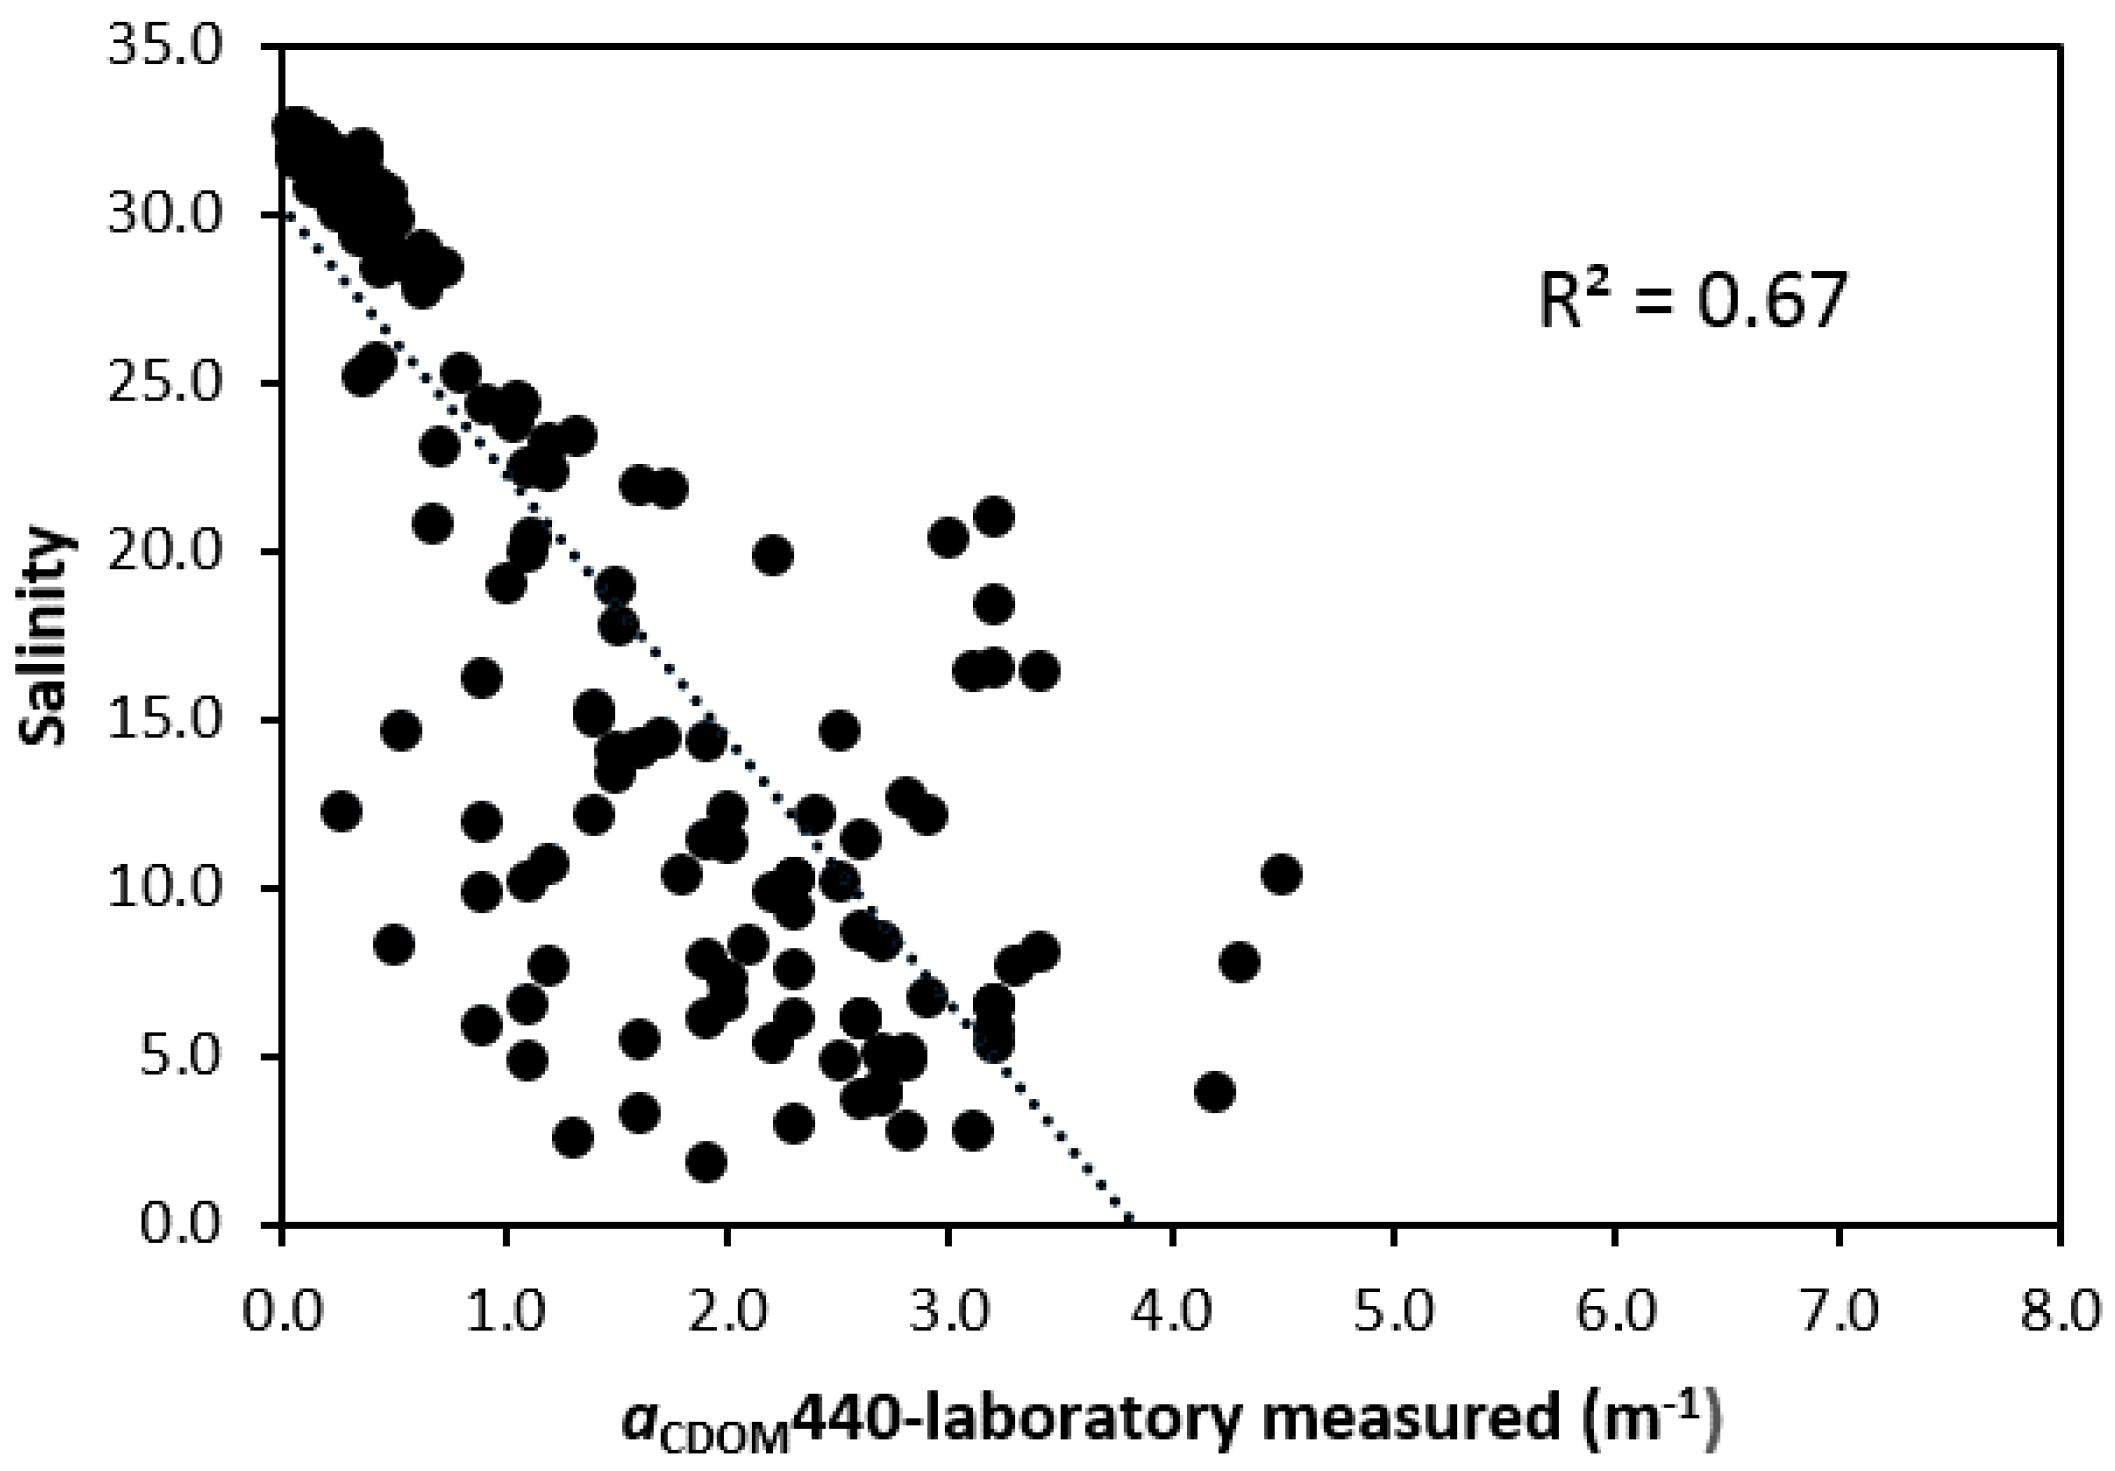
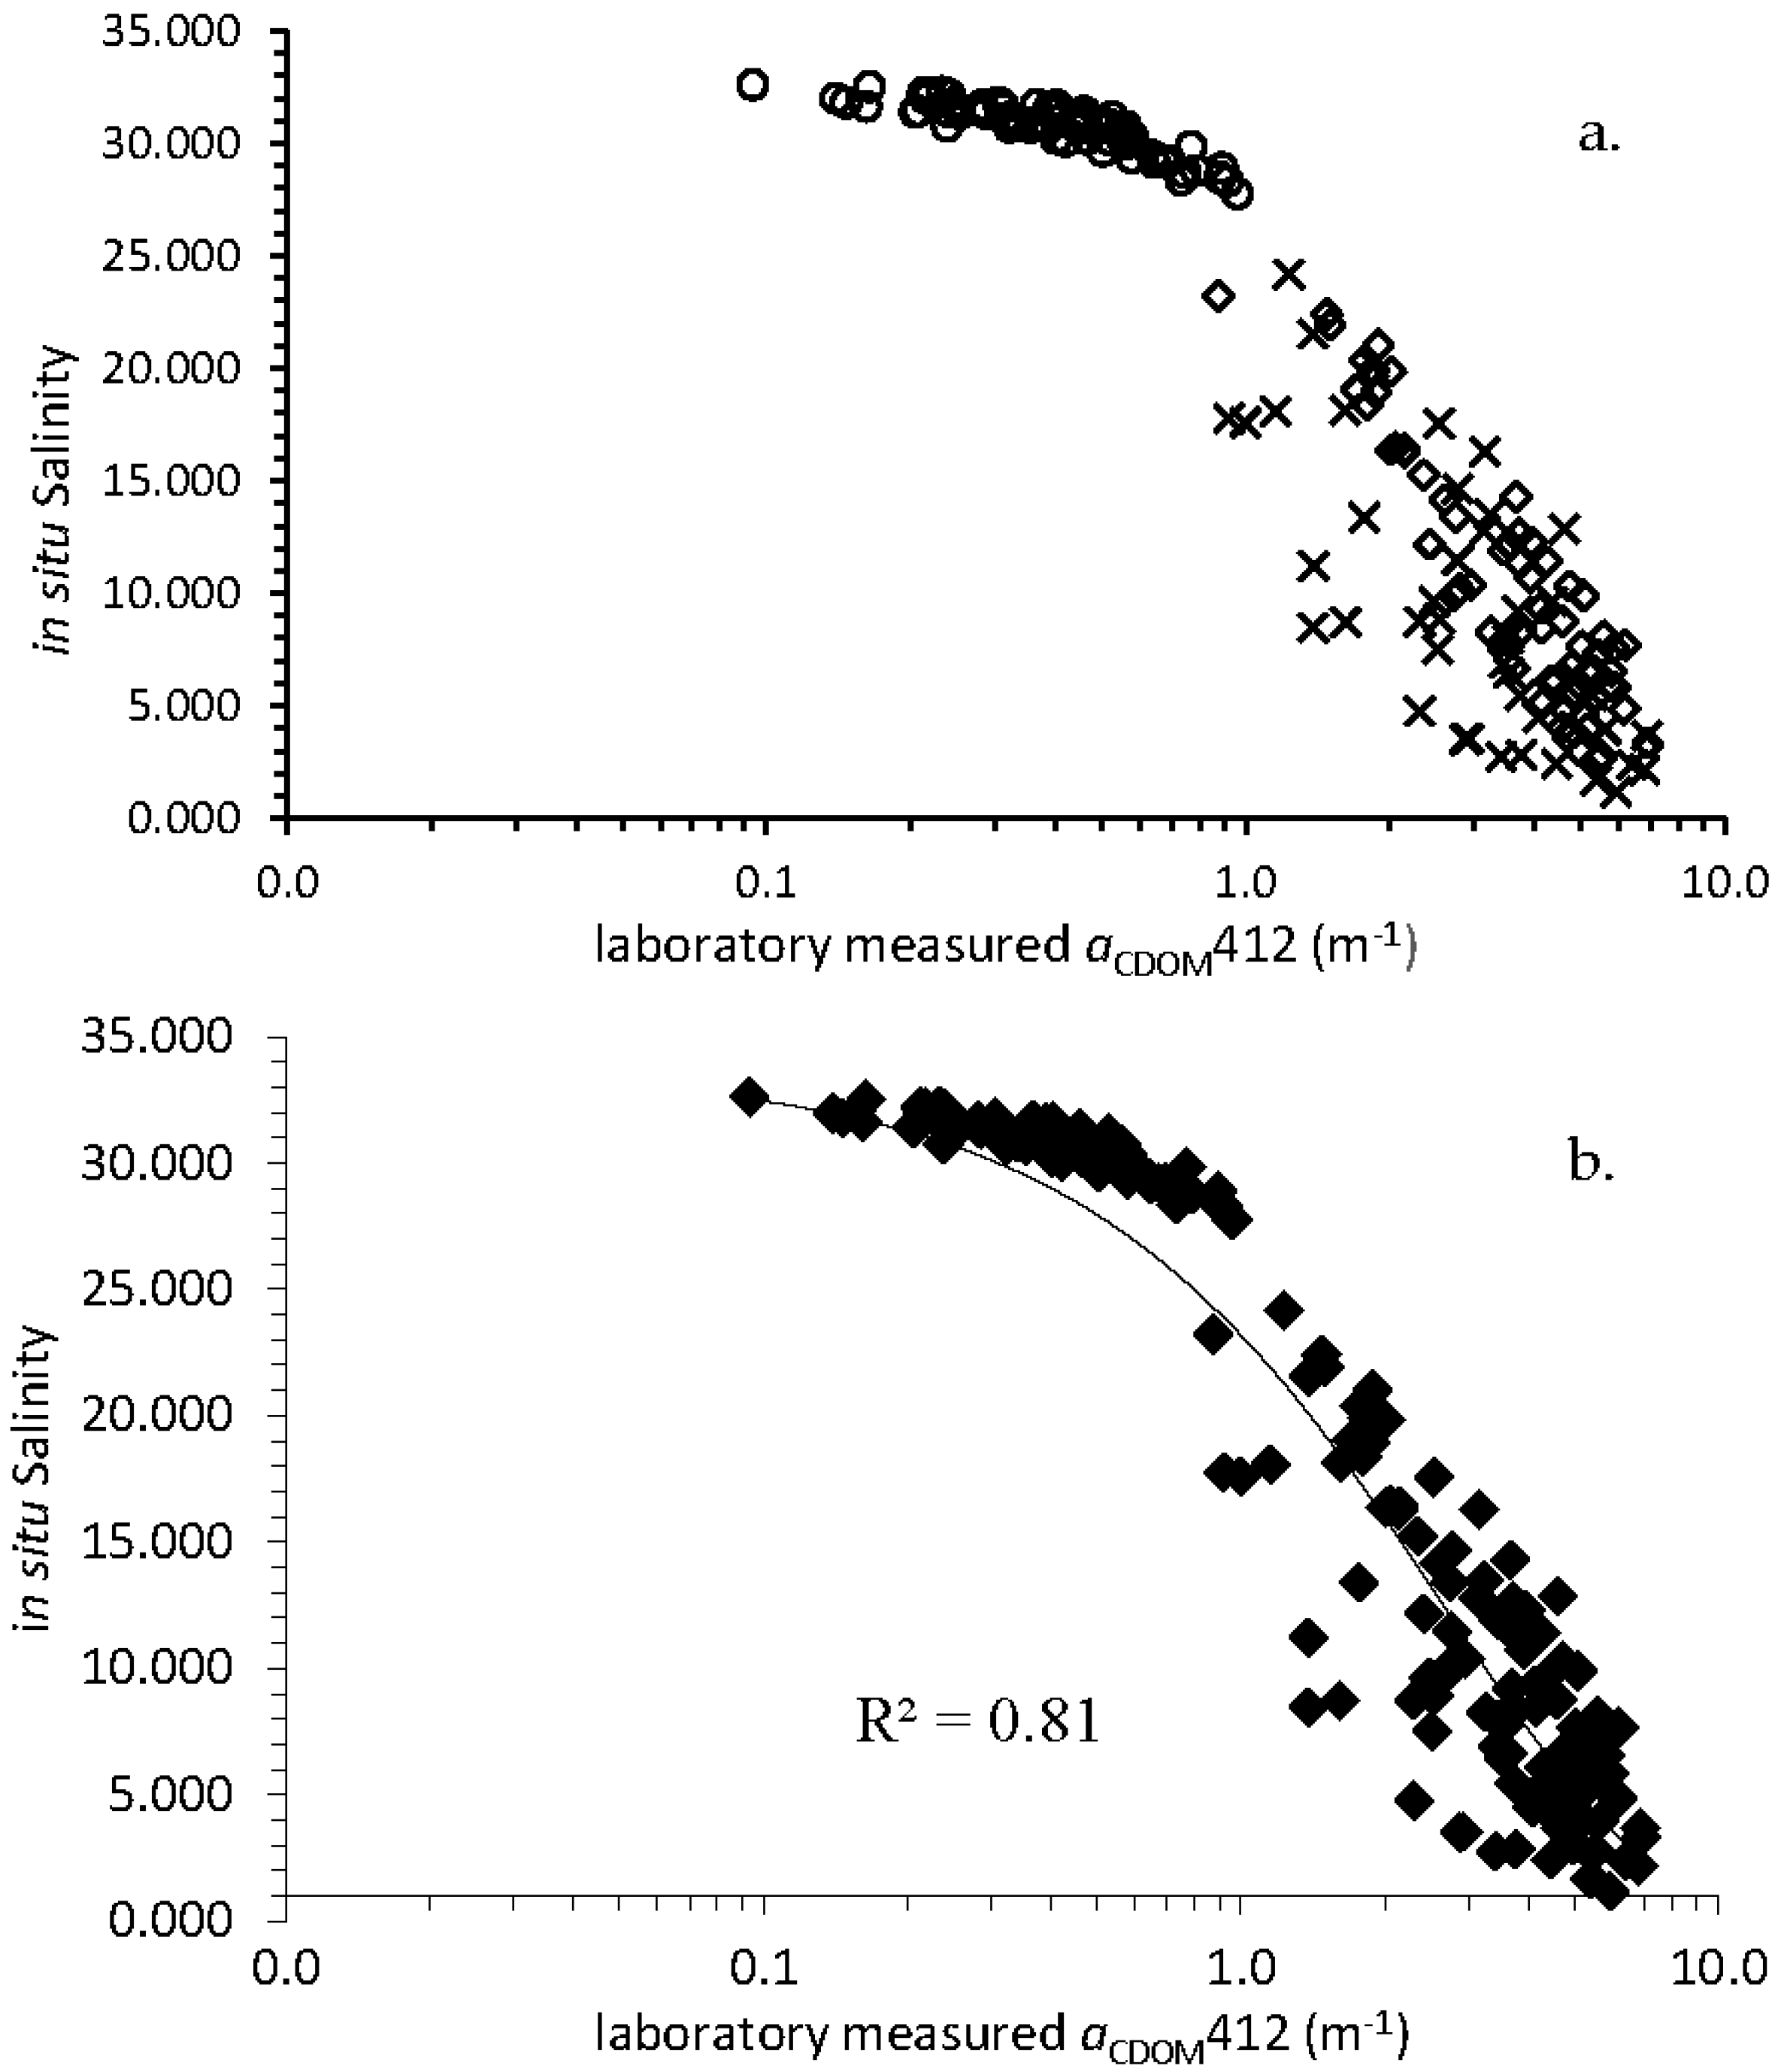
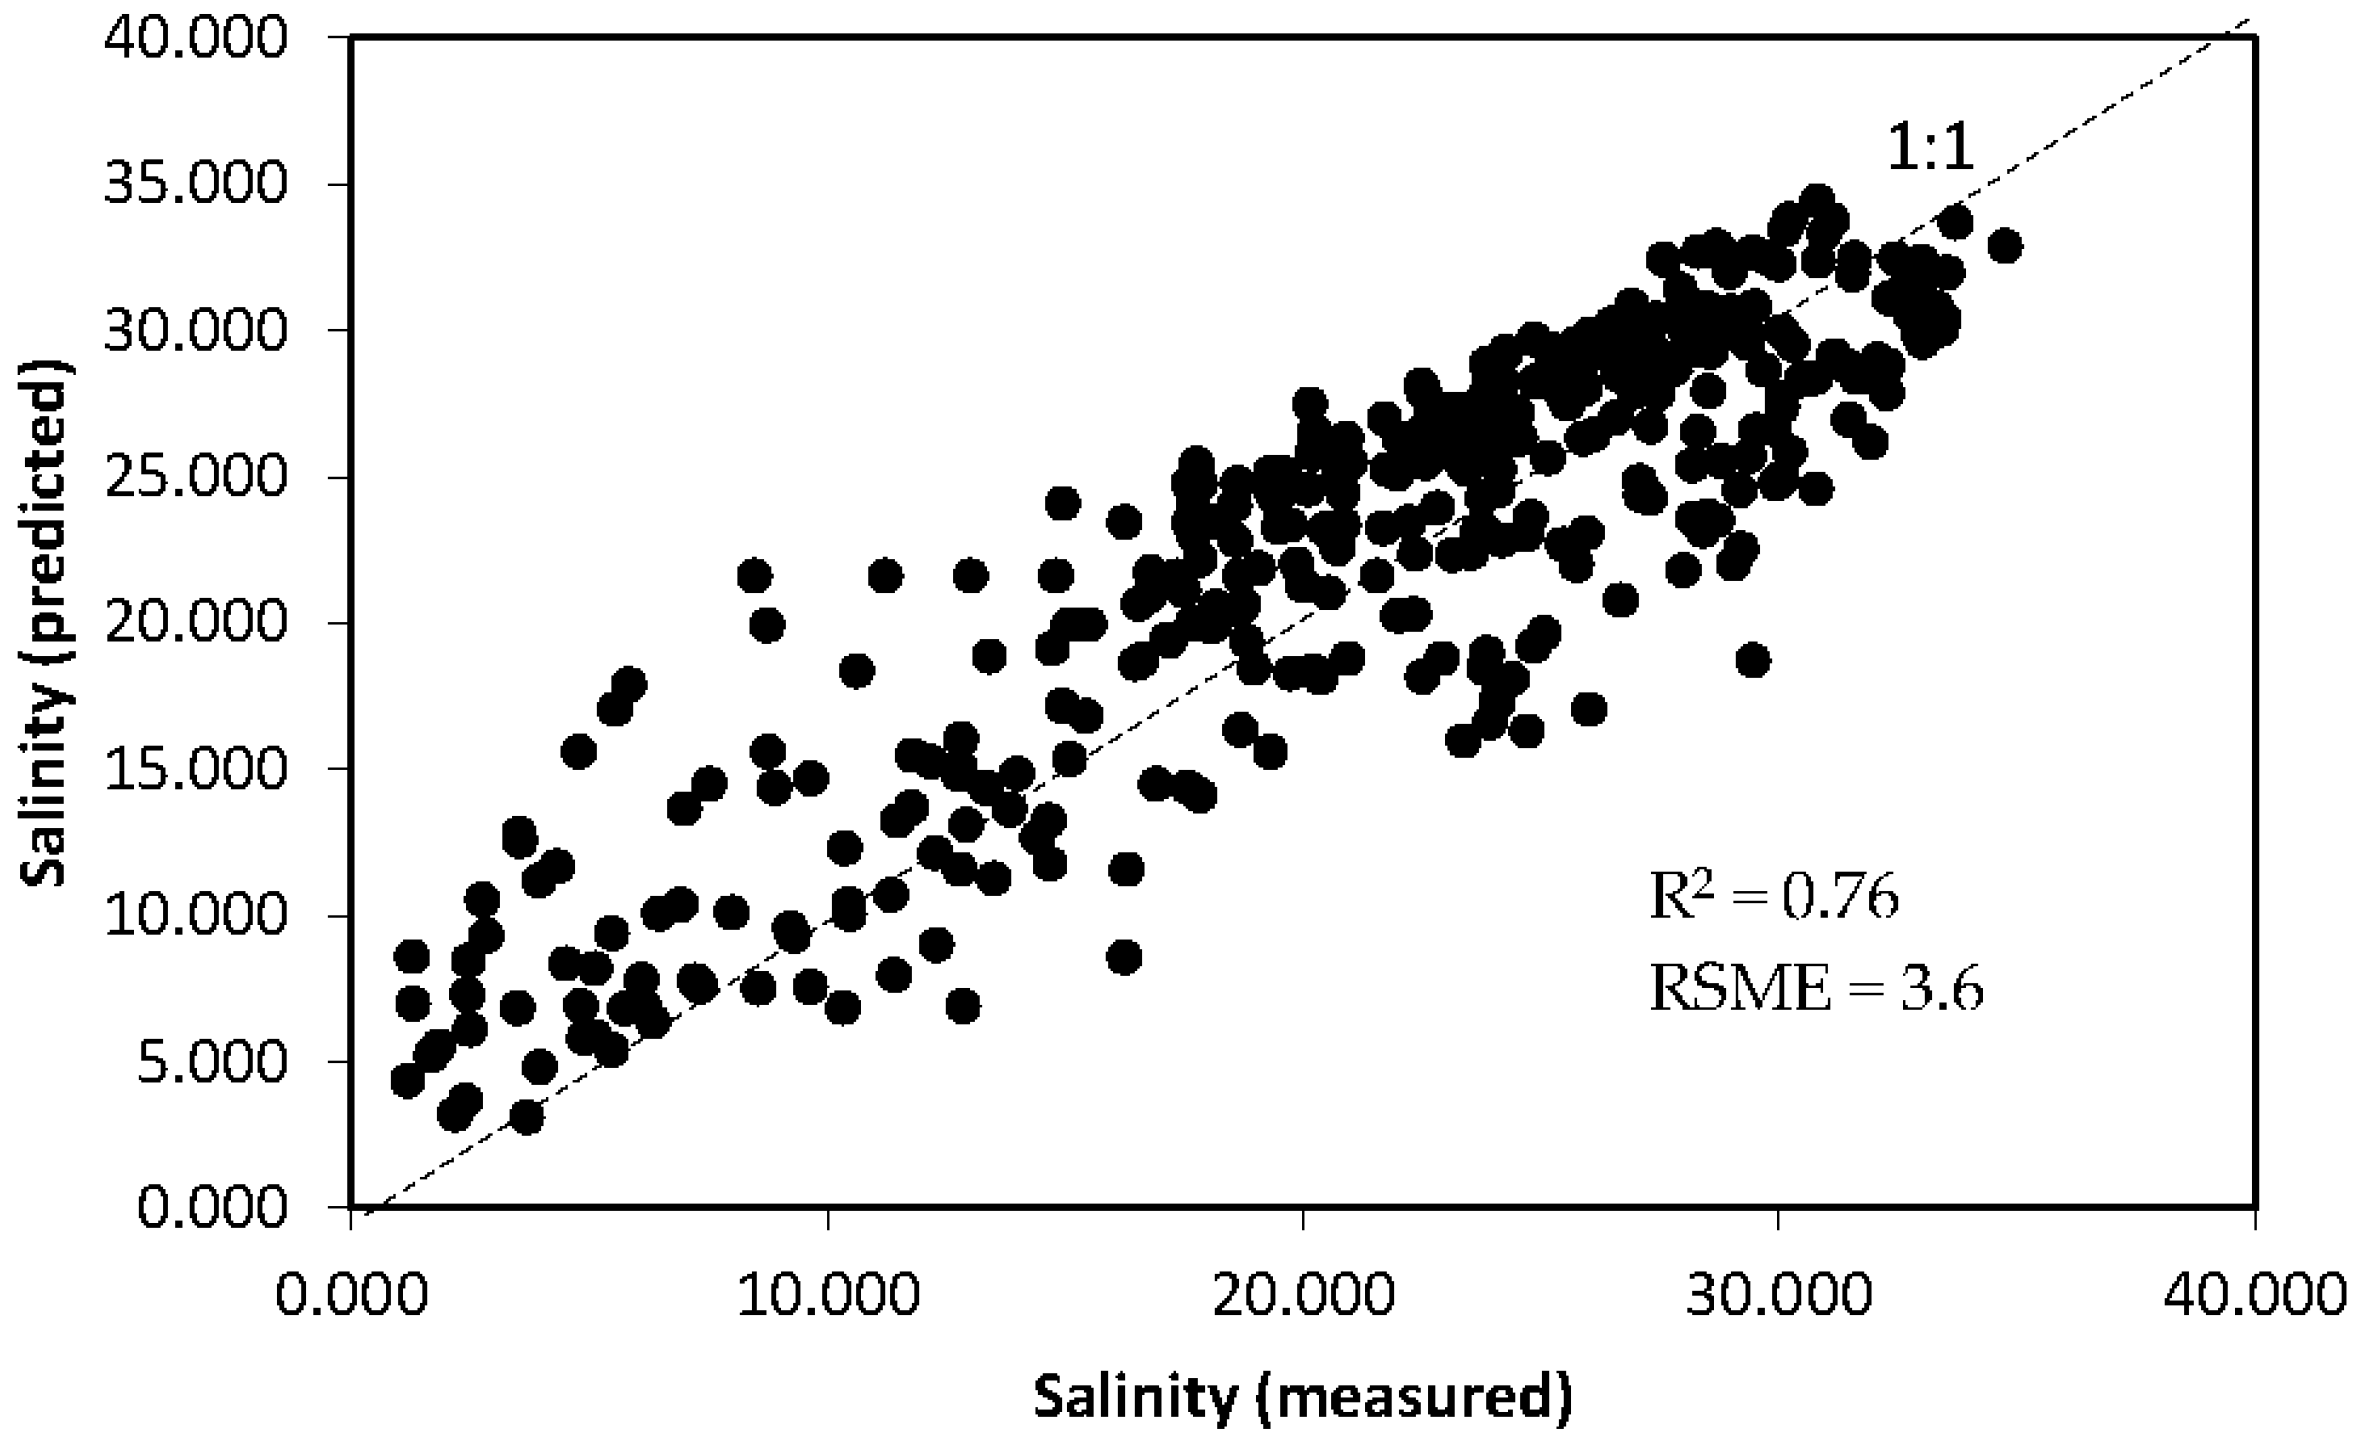
3.4. Salinity Algorithm
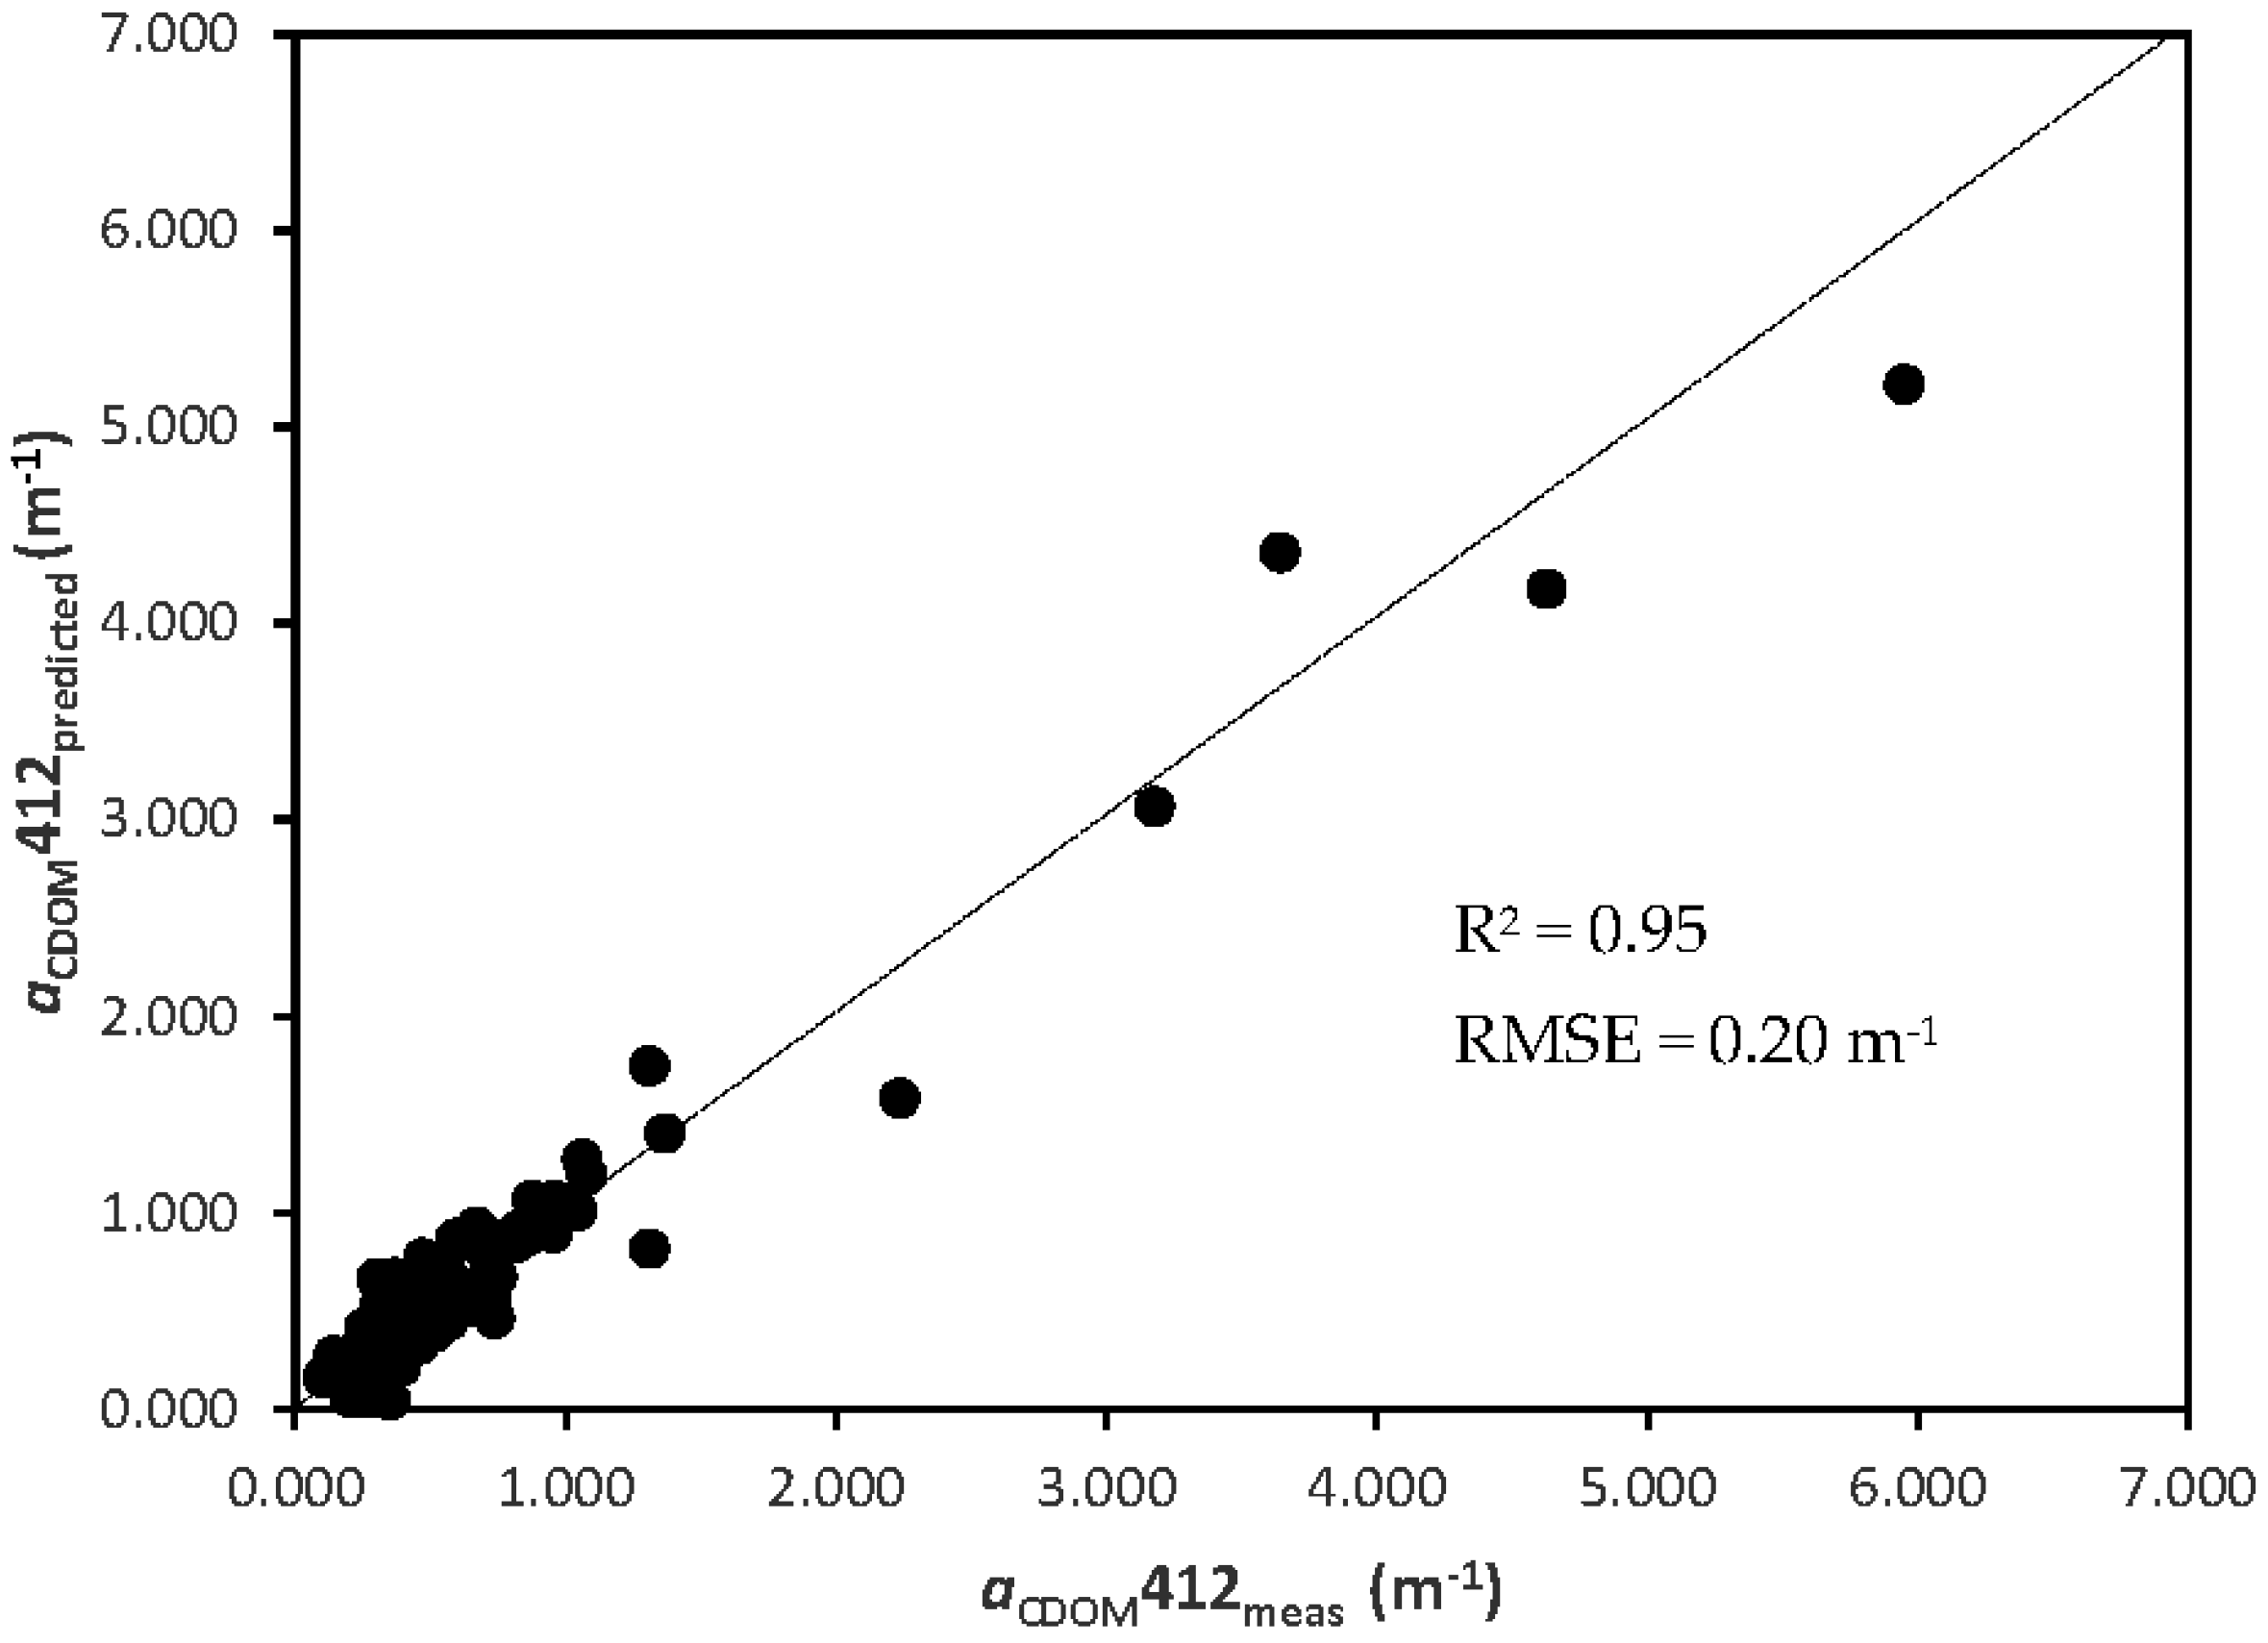
3.5. Validation of CDOM and Salinity Algorithm Performance
3.6. Application Example
4. Discussion
5. Conclusions
Acknowledgments
Author Contributions
Conflicts of Interest
References
- Zhang, Y.; Yin, Y.; Feng, L.; Zhu, G.; Shi, Z.; Liu, X.; Zhang, Y. Characterizing chromophoric dissolved organic matter in Lake Tianmuhu and its catchment basin using excitation-emission matrix fluorescence and parallel factor analysis. Water Res. 2011, 45, 5110–5122. [Google Scholar] [CrossRef] [PubMed]
- Heyes, A.; Miller, C.; Mason, R. Mercury and methylmercury in Hudson River sediment: Impact of tidal resuspension and methylation. Mar. Chem. 2004, 90, 75–89. [Google Scholar] [CrossRef]
- Opsahl, S.; Benner, R. Distribution and cycling of terrigenous dissolved organic matter in the ocean. Nature 1997, 386, 480–482. [Google Scholar] [CrossRef]
- Coble, P.; Hu, C.; Gould, R.W., Jr.; Chang, G.; Wood, A.M. Colored dissolved matter in the coastal ocean—An optical tool for coastal environmental assessment and management. Oceanography 2004, 17, 50–59. [Google Scholar] [CrossRef]
- Del Vecchio, R.; Blough, N. Spatial and seasonal distribution of chromophoric dissolved organic matter ABD dissolved organic carbon in the Middle Atlantic Bight. Mar. Chem. 2004, 66, 35–51. [Google Scholar]
- Vodacek, A.; Blough, N.V.; DeGrandpre, M.D.; Peltzer, E.T.; Nelson, R.K. Seasonal variation of CDOMN and DOC in the Middle Atlantic Bight: Terrestrial inputs and photooxidation. Limnol. Oceanogr. 1997, 42, 674–686. [Google Scholar] [CrossRef]
- Miller, J.L.; Goodberlet, M.A.; Zaitzeff, J.B. Airborne salinity mapper makes debut in coastal zone. EOS Trans. 1998, 79, 173–184. [Google Scholar] [CrossRef]
- Mannino, A.; Russ, M.E.; Hooker, S.B. Algorithm development and validation for satellite-derived distributions of DOC and CDOM in the US Middle Atlantic Bight. J. Geophys. Res. 2008, 113, C07051. [Google Scholar] [CrossRef]
- Del Castillo, C.E.; Miller, R.L. On the use of ocean color remote sensing to measure the transport of dissolved organic carbon by the Mississippi River Plume. Remote Sens. Environ. 2008, 112, 836–844. [Google Scholar] [CrossRef]
- United Nations Educational, Scientific and Cultural Organization (UNESCO). Background Papers and Supporting Data on the Practical Salinity Scale, 1978; UNESCO Technical Papers in Marine Science; UNESCO: Paris, France, 1981. [Google Scholar]
- Lagerloef, G.S.E.; Swift, C.T.; le Vine, D.M. SeaSurface salinity: The next remote sensing challenge. Oceanography 1995, 8, 42–50. [Google Scholar] [CrossRef]
- Lerner, R.; Hollinger, J. Analysis of 1.4 GHz radiometric measurments from Skylab. Remote Sens. Environ. 1977, 6, 251–269. [Google Scholar] [CrossRef]
- Blume, H.; Fedors, J. Measurement of ocean temperature and salinity via microwave radiometry. Bound. Layer Meteorol. 1978, 13, 295–308. [Google Scholar] [CrossRef]
- McKeon, J.; Rogers, R. Water Quality Maps of Saginaw Bay from Computer Processing of Landsat-2 Data; Special Report to Goddard Space Flight Center: Greenbelt, MD, USA, 1976. [Google Scholar]
- Khorram, S. Remote sensing of salinity in the San Francisco bay delta. Remote Sens. Environ. 1982, 12, 15–22. [Google Scholar] [CrossRef]
- Siegel, D.A.; Maritorena, S.; Nelson, N.B. Global distribution and dynamics of colored dissolved and detrital organic materials. J. Geophys. Res. 2002, 107, 3228. [Google Scholar] [CrossRef]
- Kahru, M.; Mitchell, B.G. Seasonal and nonseasonal variability of satellite-derived chlorophyll and colored dissolved organic matter concentrations in the California Current. J. Geophys. Res. 2001, 106, 2517–2529. [Google Scholar] [CrossRef]
- Kutser, T.; Pierson, D.C.; Kallio, K.Y.; Reinart, A.; Sobek, S. Mapping lake CDOM by satellite remote sensing. Remote Sens. Environ. 2005, 94, 535–540. [Google Scholar] [CrossRef]
- Keith, D.; Yoder, J.A.; Freeman, S.A. Spatial and temporal distribution of Colored Dissolved Organic Matter (CDOM) in Narragansett Bay, Rhode Island: Implications for phytoplankton in coastal waters. Estuar. Coast. Shelf Sci. 2002, 55, 705–717. [Google Scholar] [CrossRef]
- Keith, D. Determination of Chlorophyll A Concentrations and Phytoplankton Primary Production in New England Estuarine Waters Using Ocean Color Remote Sensing from Low-Flying Aircraft. Ph.D. Thesis, University of Rhode Island, Kingston, RI, USA, 2004. [Google Scholar]
- Bailey, S.W.; Werdell, P.J. A multi-sensor approach for the on-orbit validation of ocean color satellite data products. Remote Sens. Environ 2006, 102, 12–23. [Google Scholar] [CrossRef]
- D’Sa, E.J. Colored Dissolved organic matter in coastal waters influenced by the Atchafalaya River, USA: Effects of an algal bloom. J. Appl. Remote Sens. 2008, 2, 023502. [Google Scholar] [CrossRef]
- Shanmugam, P. A new bio-optical algorithm for the remote sensing of algal blooms in complex waters. J. Geophys. Res. 2011, 116, C04016. [Google Scholar] [CrossRef]
- Wang, F.; Xu, Y.J. Development and application of a remote sensing-basing salinity prediction model for a large estuarine lake in the US Gulf of Mexico coast. J. Hydrol. 2008, 360, 184–194. [Google Scholar] [CrossRef]
- Son, Y.B.; Gardner, W.D.; Richardson, M.J.; Ishizaka, J.; Ryu, J.H.; Kim, S.H.; Lee, S.H. Tracing offshore low-salinity plumes in the Northeastern Gulf of Mexico during the summer season by use of multispectral remote sensing data. J. Oceanogr. 2012, 68, 743–760. [Google Scholar] [CrossRef]
- Tehrani, N. Investigation of Colored Dissolved Organic Matter and Dissolved Organic Carbon Using Ocean Color Data and Numerical Model in the Northern Gulf of Mexico. Ph.D. Thesis, Louisiana State University, Baton Rouge, LA, USA, 2012. [Google Scholar]
- Tehrani, N.C.; D’Sa, E.J.; Osburn, C.L.; Bianchi, T.S.; Schaeffer, B.A. Chromophoric dissolved organic matter and dissolved organic carbon from Sea-Viewing Wide Field-of-View Sensor (SeaWiFS), Moderate Resolution Imaging Spectroradiometer (MODIS) and MERIS sensors: Case study for the Northern Gulf of Mexico. Remote Sens. 2013, 5, 1439–1464. [Google Scholar] [CrossRef]
- Vandermeulen, R.A.; Arnone, R.; Ladner, S.; Martinolich, P. Estimating sea surface salinity in coastal waters of the Gulf of Mexico using visible channels on SNPP-VIIRS. Proc. SPIE 2014. [Google Scholar] [CrossRef]
- Urquhart, E.A.; Zaitchik, B.F.; Hoffman, M.J.; Guikema, S.D.; Geiger, E.F. Remotely sensed estimates of surface salinity in the Chesapeake Bay: A statistical approach. Remote Sens. Environ. 2012, 123, 522–531. [Google Scholar] [CrossRef]
- Geiger, E.F.; Grossi, M.D.; Trembanis, A.C.; Kohut, J.T.; Oliver, M.J. Satellite-derived coastal ocean and estuarine salinity in the Mid-Atlantic. Cont. Shelf Res. 2013, 63, S235–S242. [Google Scholar] [CrossRef]
- Zhu, W.; Yu, Q.; Tian, Y.Q.; Becker, B.L.; Zheng, T.; Carrick, H.J. An assessment of remote sensing algorithms for colored dissolved organic matter in complex freshwater environments. Remote Sens. Environ. 2014, 140, 766–778. [Google Scholar] [CrossRef]
- International Ocean Colour Coordinating Group (IOCCG). Remote Sensing of Ocean Color in Coastal, and Other Optically-Complex, Waters; Sathyendranath, S., Ed.; Reports of the International Ocean-Colour Coordinating Group, No. 3; IOCCG: Dartmouth, NS, Canada, 2000. [Google Scholar]
- Bowers, D.G.; Harker, G.E.L.; Smith, P.S.D.; Tett, P. Optical properties of a region of freshwater influence (the Clyde Sea). Estuar. Coast. Shelf Sci. 2000, 50, 717–726. [Google Scholar] [CrossRef]
- Binding, C.E.; Bowers, D.G. Measuring the salinity of the Clyde sea from remotely sensed ocean colour. Estuar. Coast. Shelf Sci. 2003, 57, 605–611. [Google Scholar] [CrossRef]
- Bowers, D.G.; Evans, D.; Thomas, D.N.; Ellis, K.; Williams, P.J. Interpreting the colour of an estuary. Estuar. Coast. Shelf Sci. 2004, 59, 13–20. [Google Scholar] [CrossRef]
- Bowers, D.G.; Brett, H.L. The relationship between CDOM and salinity in estuaries: An analytical and graphical solution. J. Mar. Syst. 2008, 73, 1–7. [Google Scholar] [CrossRef]
- Freeman, S.A. Spectral Vertical Attenuation Coefficients in Narragansett Bay, Rhode Island. Master’s Thesis, University of Rhode Island, Kingston, RI, USA, 2011. [Google Scholar]
- Sokoletsky, L.G.; Lunetta, R.S.; Wetz, M.S.; Paerl, H.W. MERIS retrieval of water quality components in the turbid Albemarle-Pamlico Sound Estuary, USA. Remote Sens. 2011, 3, 684–707. [Google Scholar] [CrossRef]
- Keith, D.; Schaeffer, B.A.; Lunetta, R.S.; Gould, R.W., Jr.; Rocha, K.; Cobb, D.J. Remote Sensing of selected water-quality indicators with the hyperspectral imager for the coastal ocean (HICO) sensor. Int. J. Remote Sens. 2014, 35, 2927–2962. [Google Scholar] [CrossRef]
- Gould, R., Jr.; Arnone, R.A.; Sydor, M. Absorption, scattering, and remote sensing reflectance relationships in coastal waters: Testing a new inversion algorithm. J. Coast. Res. 2001, 17, 328–341. [Google Scholar]
- Bricaud, A.; Morel, A.; Prieur, L. Absorption by dissolved organic matter in the sea (yellow substance) in the UV and visible domains. Limnol. Oceanogr. 1981, 26, 43–53. [Google Scholar] [CrossRef]
- Mitchell, B.G.; Bricaud, A.; Carder, K.; Cleveland, J.; Ferrari, G.; Gould, R.; Kahru, M.; Kishino, M.; Maske, H.; Moisan, T.; et al. Chapter 12—Determination of spectral absorption coefficients of particles, dissolved material and phytoplankton for discrete water samples. In Ocean Optics Protocols for Satellite Ocean Color Sensor Validation Revision 2—G.S; Fargion, L., Mueller, J.L., Eds.; NASA Goddard Space Flight Center: Greenbelt, MD, USA, 2000. [Google Scholar]
- Schaeffer, B.; Conmy, R.N.; Duffy, A.E.; Aukamp, J.; Yates, D.F.; Craven, G. Northern Gulf of Mexico estuarine coloured organic matter derived from MODIS data. Int. J. Remote Sens. 2015, 36, 2219–2237. [Google Scholar] [CrossRef]
- Pegau, W.S.; Gray, D.; Zaneveld, J.R.V. Absorption and attenuation of visible and near-infrared light in the water: Dependence on temperature and salinity. Appl. Opt. 1997, 36, 6035–6046. [Google Scholar] [CrossRef] [PubMed]
- Kirk, J.T.O. Light & Photosynthesis in Aquatic Ecosystems, 2nd ed.; Cambridge University Press: Cambridge, UK, 1996. [Google Scholar]
- Laws, E. Chapter 4—Model II Linear Regression. Mathematical Methods for Oceanographers; John Wiley and Sons: New York, NY, USA, 1997. [Google Scholar]
- D’Sa, E.J.; Dimarco, S.F. Seasonal variability and controls on chromophoric dissolved organic matter in a large river-dominated coastal margin. Limnol. Oceanogr. 2009, 54, 2233–2242. [Google Scholar] [CrossRef]
- Tufillaro, N.; Davis, C.O.; Jones, K.B. Indicators of Plume Constituents from HICO. In Proceedings of the Ocean Optics XX, Anchorage, AK, USA, 27 September–1 October 2011.
- Chavez, P.S. An improved dark-object subtraction technique for atmospheric scattering correction of multispectral data. Remote Sens. Environ. 1988, 24, 459–479. [Google Scholar] [CrossRef]
- Tiwari, S.P.; Shanumugam, P. An optical model for the remote sensing of coloured dissolved organic matter in coastal/ocean waters. Estuar. Coast Shelf Sci. 2011, 93, 396–402. [Google Scholar] [CrossRef]
- Ferrari, G.M.; Tassan, S. Use of the 0.22 μm Millipore membrane for light-transmission measurements of aquatic particles. J. Plankton Res. 1996, 18, 1261–1267. [Google Scholar] [CrossRef]
- Haltrin, V.; Johnson, D.R.; Weidemann, A.D. Connection between salinity and light absorption coefficient. Proc. IEEE 2000. [Google Scholar] [CrossRef]
- Ahn, Y.H.; Shanmugan, P.; Moon, E.J.; Ryu, J.H. Satellite remote sensing of a low salinity water plume in the East China Sea. Ann. Geophys. 2008, 26, 2019–2013. [Google Scholar] [CrossRef]
- Du, C.; Shang, S.; Dong, Q.; Hu, C.; Wu, J. Characteristics of chromophoric dissolved organic matter in the nearshore waters of the western Taiwan Strait. Estuar. Coast. Shelf Sci. 2010, 88, 350–356. [Google Scholar] [CrossRef]
- Bai, Y.; Pan, D.; Cai, W.J.; He, X.; Wang, D.; Tao, B.; Zhu, Q. Remote sensing of salinity from satellite-derived CDOM in the Changjiang River dominated East China Sea. J. Geophys. Res. Oceans 2013, 118, 227–243. [Google Scholar] [CrossRef]


| Estuary | Abbreviation | State |
|---|---|---|
| Narragansett Bay | NB | Rhode Island |
| New Bedford Harbor | NBH | Massachusetts |
| Neuse River | NR | North Carolina |
| Pensacola Bay | PB | Florida |
| Choctawhatchee Bay | CB | Florida |
| St. Andrews Bay | SAB | Florida |
| St. Joseph Bay | SJB | Florida |
| Indicator | Model | n | p Value | R2 |
|---|---|---|---|---|
| aCDOM412 (m−1) | 1.3307 × (Rrs665/Rrs489) − 0.1246 | 74 | <0.0001 | 0.83 |
| Salinity (S) | 33.686 × exp(−0.374 × aCDOM412) | 183 | <0.0001 | 0.81 |
| Indicator | Model | n | R2 | m | RMSE (m−1) | %RMSE |
|---|---|---|---|---|---|---|
| aCDOM412 (m−1) | 1.3307 × (Rrs665/Rrs489) − 0.1246 | 91 | 0.95 | 0.95 | 0.20 | 29.4 |
| Salinity (S) | 33.686 × exp(−0.374 × aCDOM412) | 331 | 0.76 | 0.88 | 3.60 | 15.9 |
| Method | Description |
|---|---|
| Twari and Shanmugam [50] | acdom412 = 0.00411 + 2.0 × (Rrs 670/Rrs 490) |
| Schaeffer et al. [43] | acdom412 = 2.48 × (Rrs 667/Rrs 488) − 0.82 |
| Method | n | RMSE (m−1) | %RMSE | R2 | m |
|---|---|---|---|---|---|
| Equation (9) | 84 | 0.13 | 34.9 | 0.78 | 1.06 |
| Twari and Shanmugam [50] | 84 | 0.58 | 118.0 | 0.78 | 2.09 |
| Schaeffer et al. [43] | 84 | 0.41 | 84.4 | 0.78 | 2.63 |
| Indicator | Model | n | R2 | m | RMSE (m−1) | %RMSE |
|---|---|---|---|---|---|---|
| aCDOM412 (m−1) | 1.3307 × (Rrs665/Rrs489) − 0.1246 | 18 | 0.93 | 1.40 | 0.58 | 37.8 |
| Salinity (S) | 33.686 × exp(−0.374 × aCDOM412) | 14 | 0.70 | 1.27 | 3.15 | 15.7 |
© 2016 by the authors; licensee MDPI, Basel, Switzerland. This article is an open access article distributed under the terms and conditions of the Creative Commons by Attribution (CC-BY) license (http://creativecommons.org/licenses/by/4.0/).
Share and Cite
Keith, D.J.; Lunetta, R.S.; Schaeffer, B.A. Optical Models for Remote Sensing of Colored Dissolved Organic Matter Absorption and Salinity in New England, Middle Atlantic and Gulf Coast Estuaries USA. Remote Sens. 2016, 8, 283. https://doi.org/10.3390/rs8040283
Keith DJ, Lunetta RS, Schaeffer BA. Optical Models for Remote Sensing of Colored Dissolved Organic Matter Absorption and Salinity in New England, Middle Atlantic and Gulf Coast Estuaries USA. Remote Sensing. 2016; 8(4):283. https://doi.org/10.3390/rs8040283
Chicago/Turabian StyleKeith, Darryl J., Ross S. Lunetta, and Blake A. Schaeffer. 2016. "Optical Models for Remote Sensing of Colored Dissolved Organic Matter Absorption and Salinity in New England, Middle Atlantic and Gulf Coast Estuaries USA" Remote Sensing 8, no. 4: 283. https://doi.org/10.3390/rs8040283
APA StyleKeith, D. J., Lunetta, R. S., & Schaeffer, B. A. (2016). Optical Models for Remote Sensing of Colored Dissolved Organic Matter Absorption and Salinity in New England, Middle Atlantic and Gulf Coast Estuaries USA. Remote Sensing, 8(4), 283. https://doi.org/10.3390/rs8040283