
An Automatic Procedure for Early Disaster Change Mapping Based on Optical Remote Sensing


Abstract
:
1. Introduction
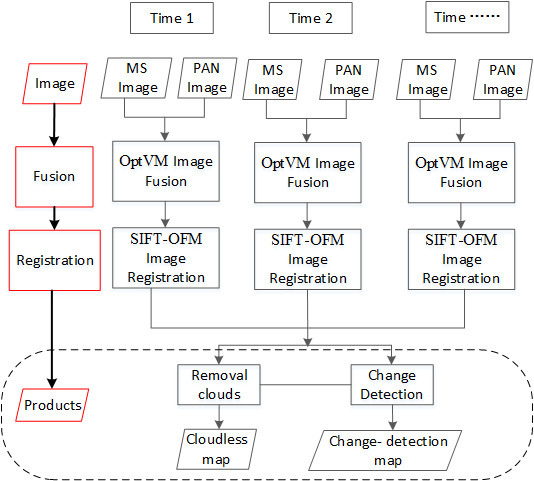
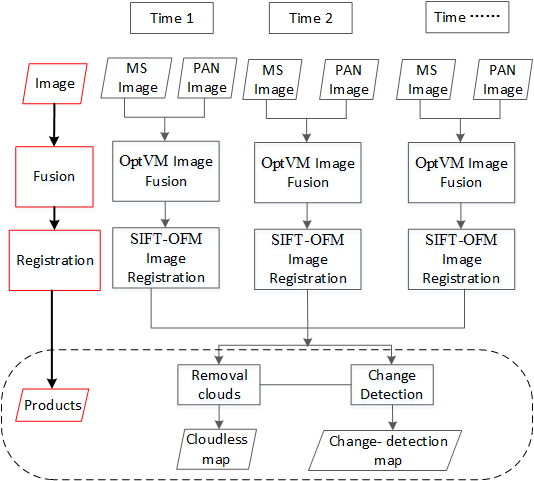
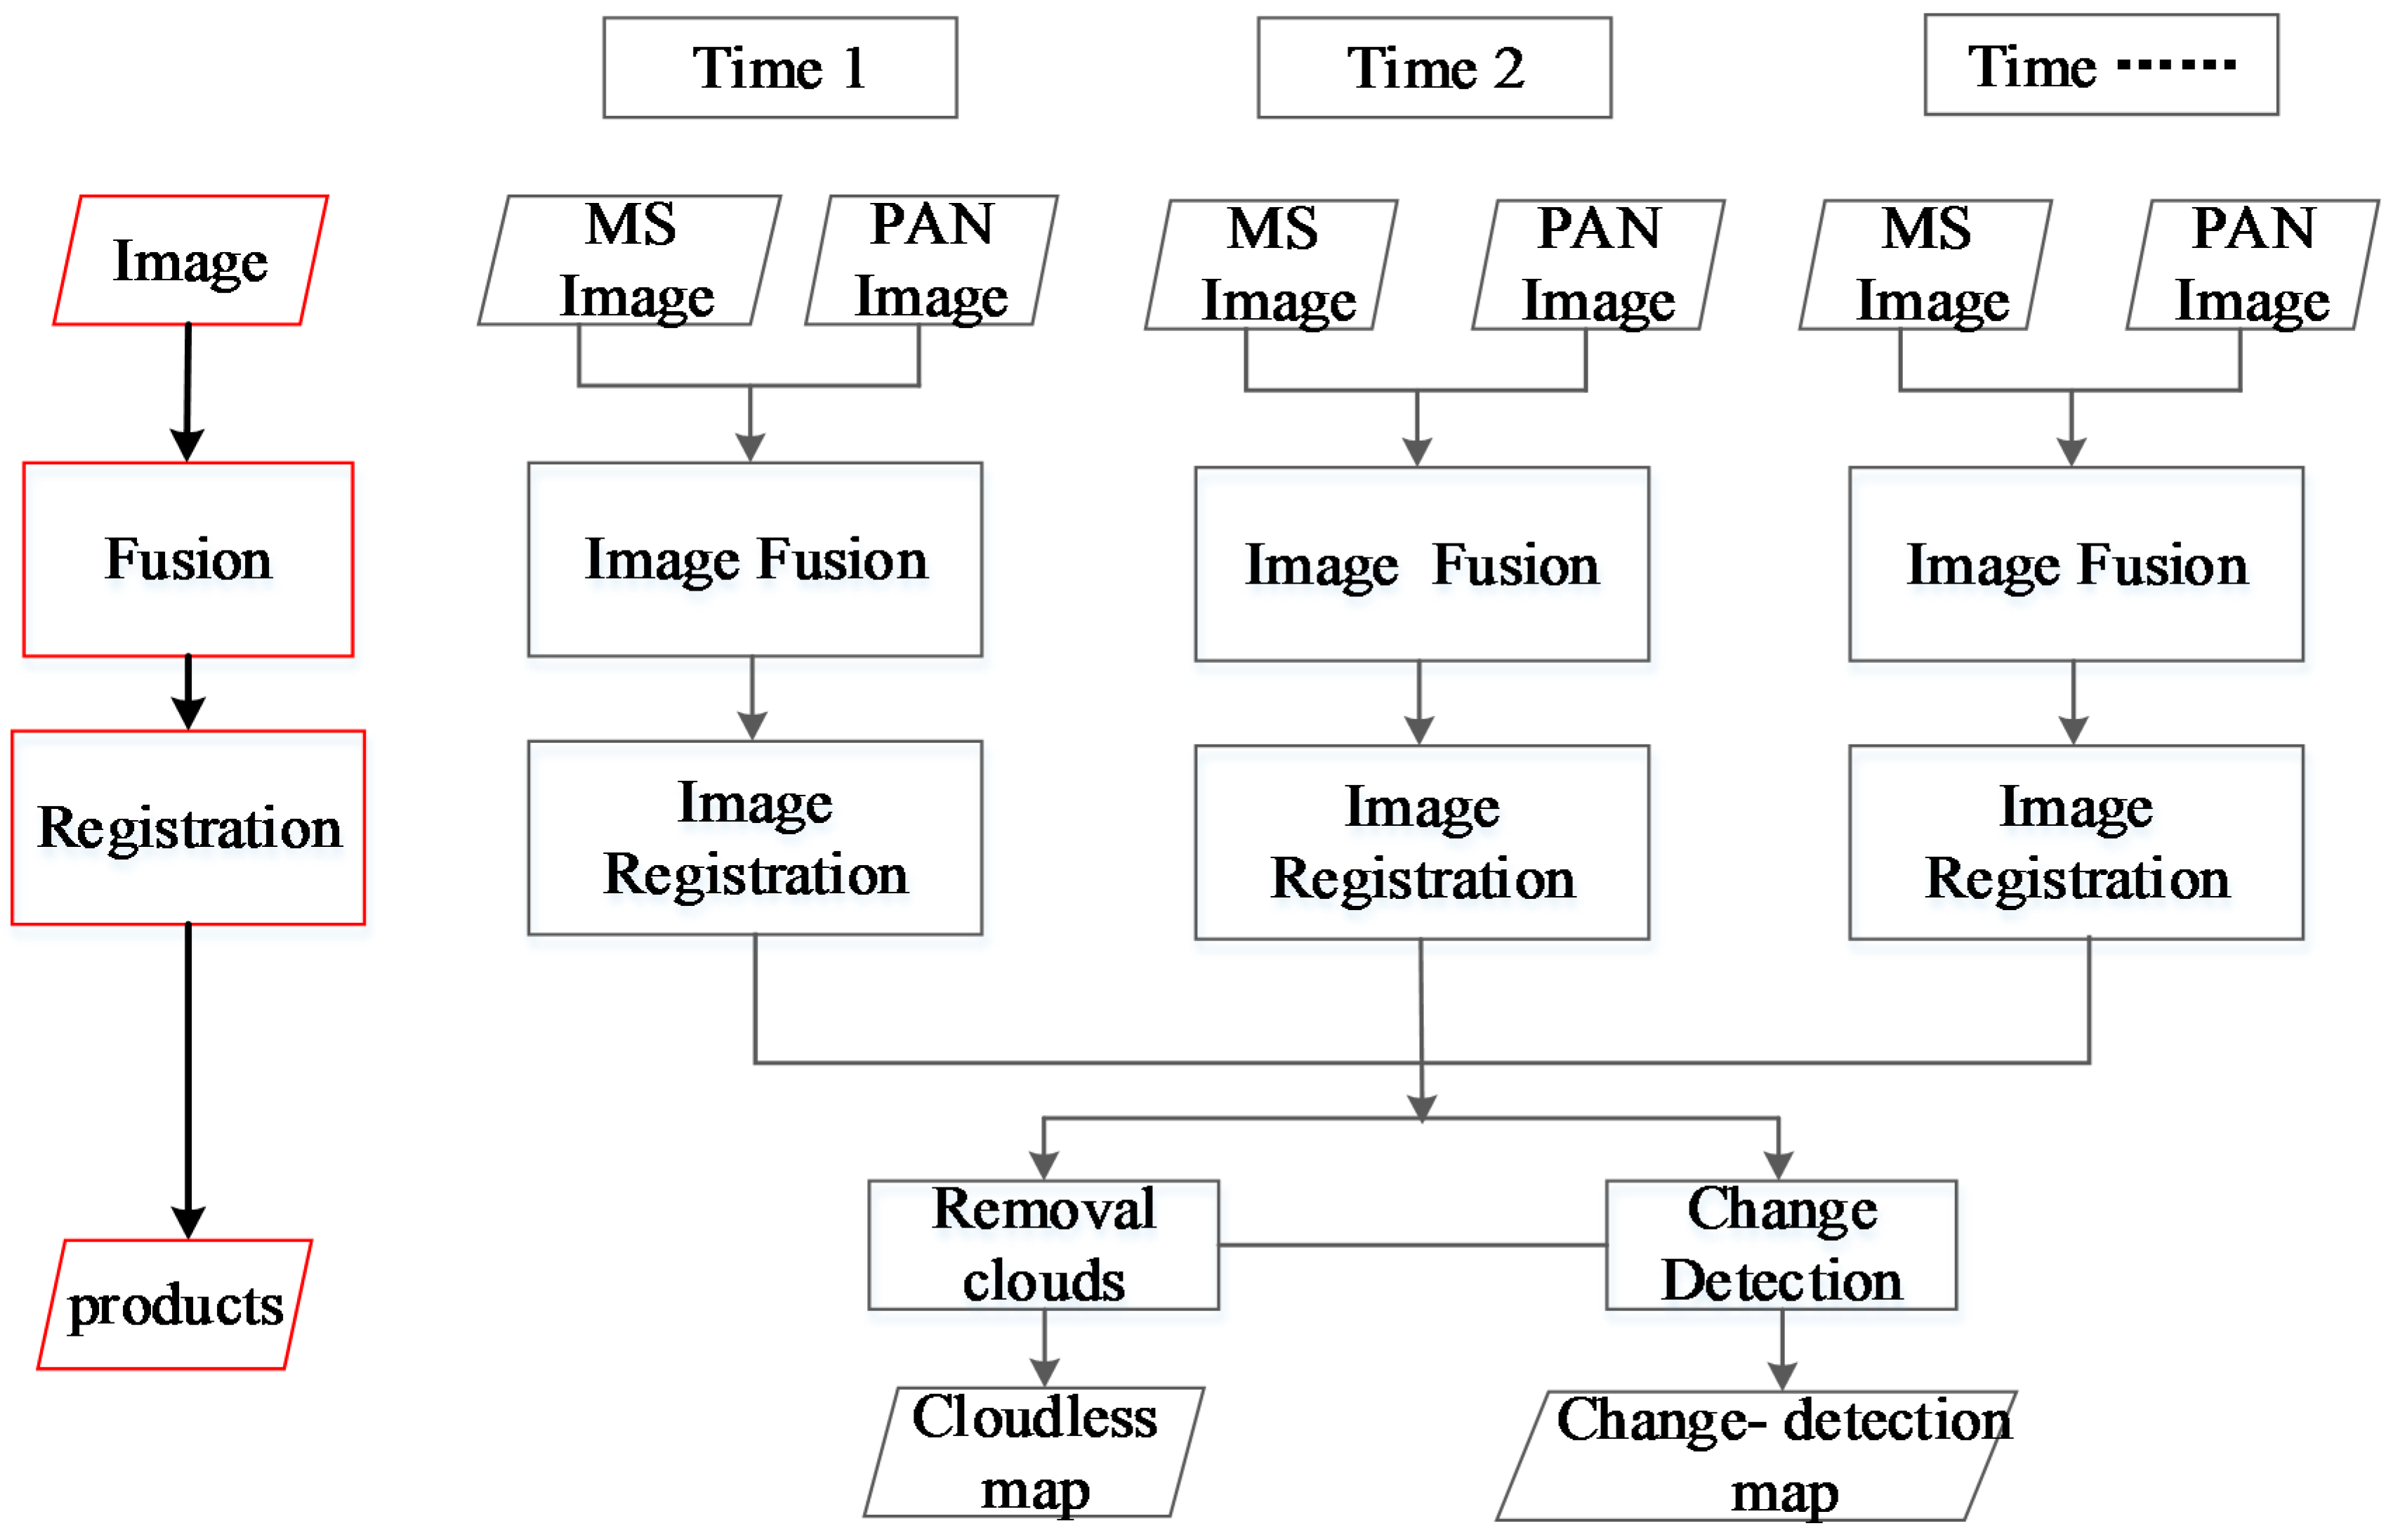
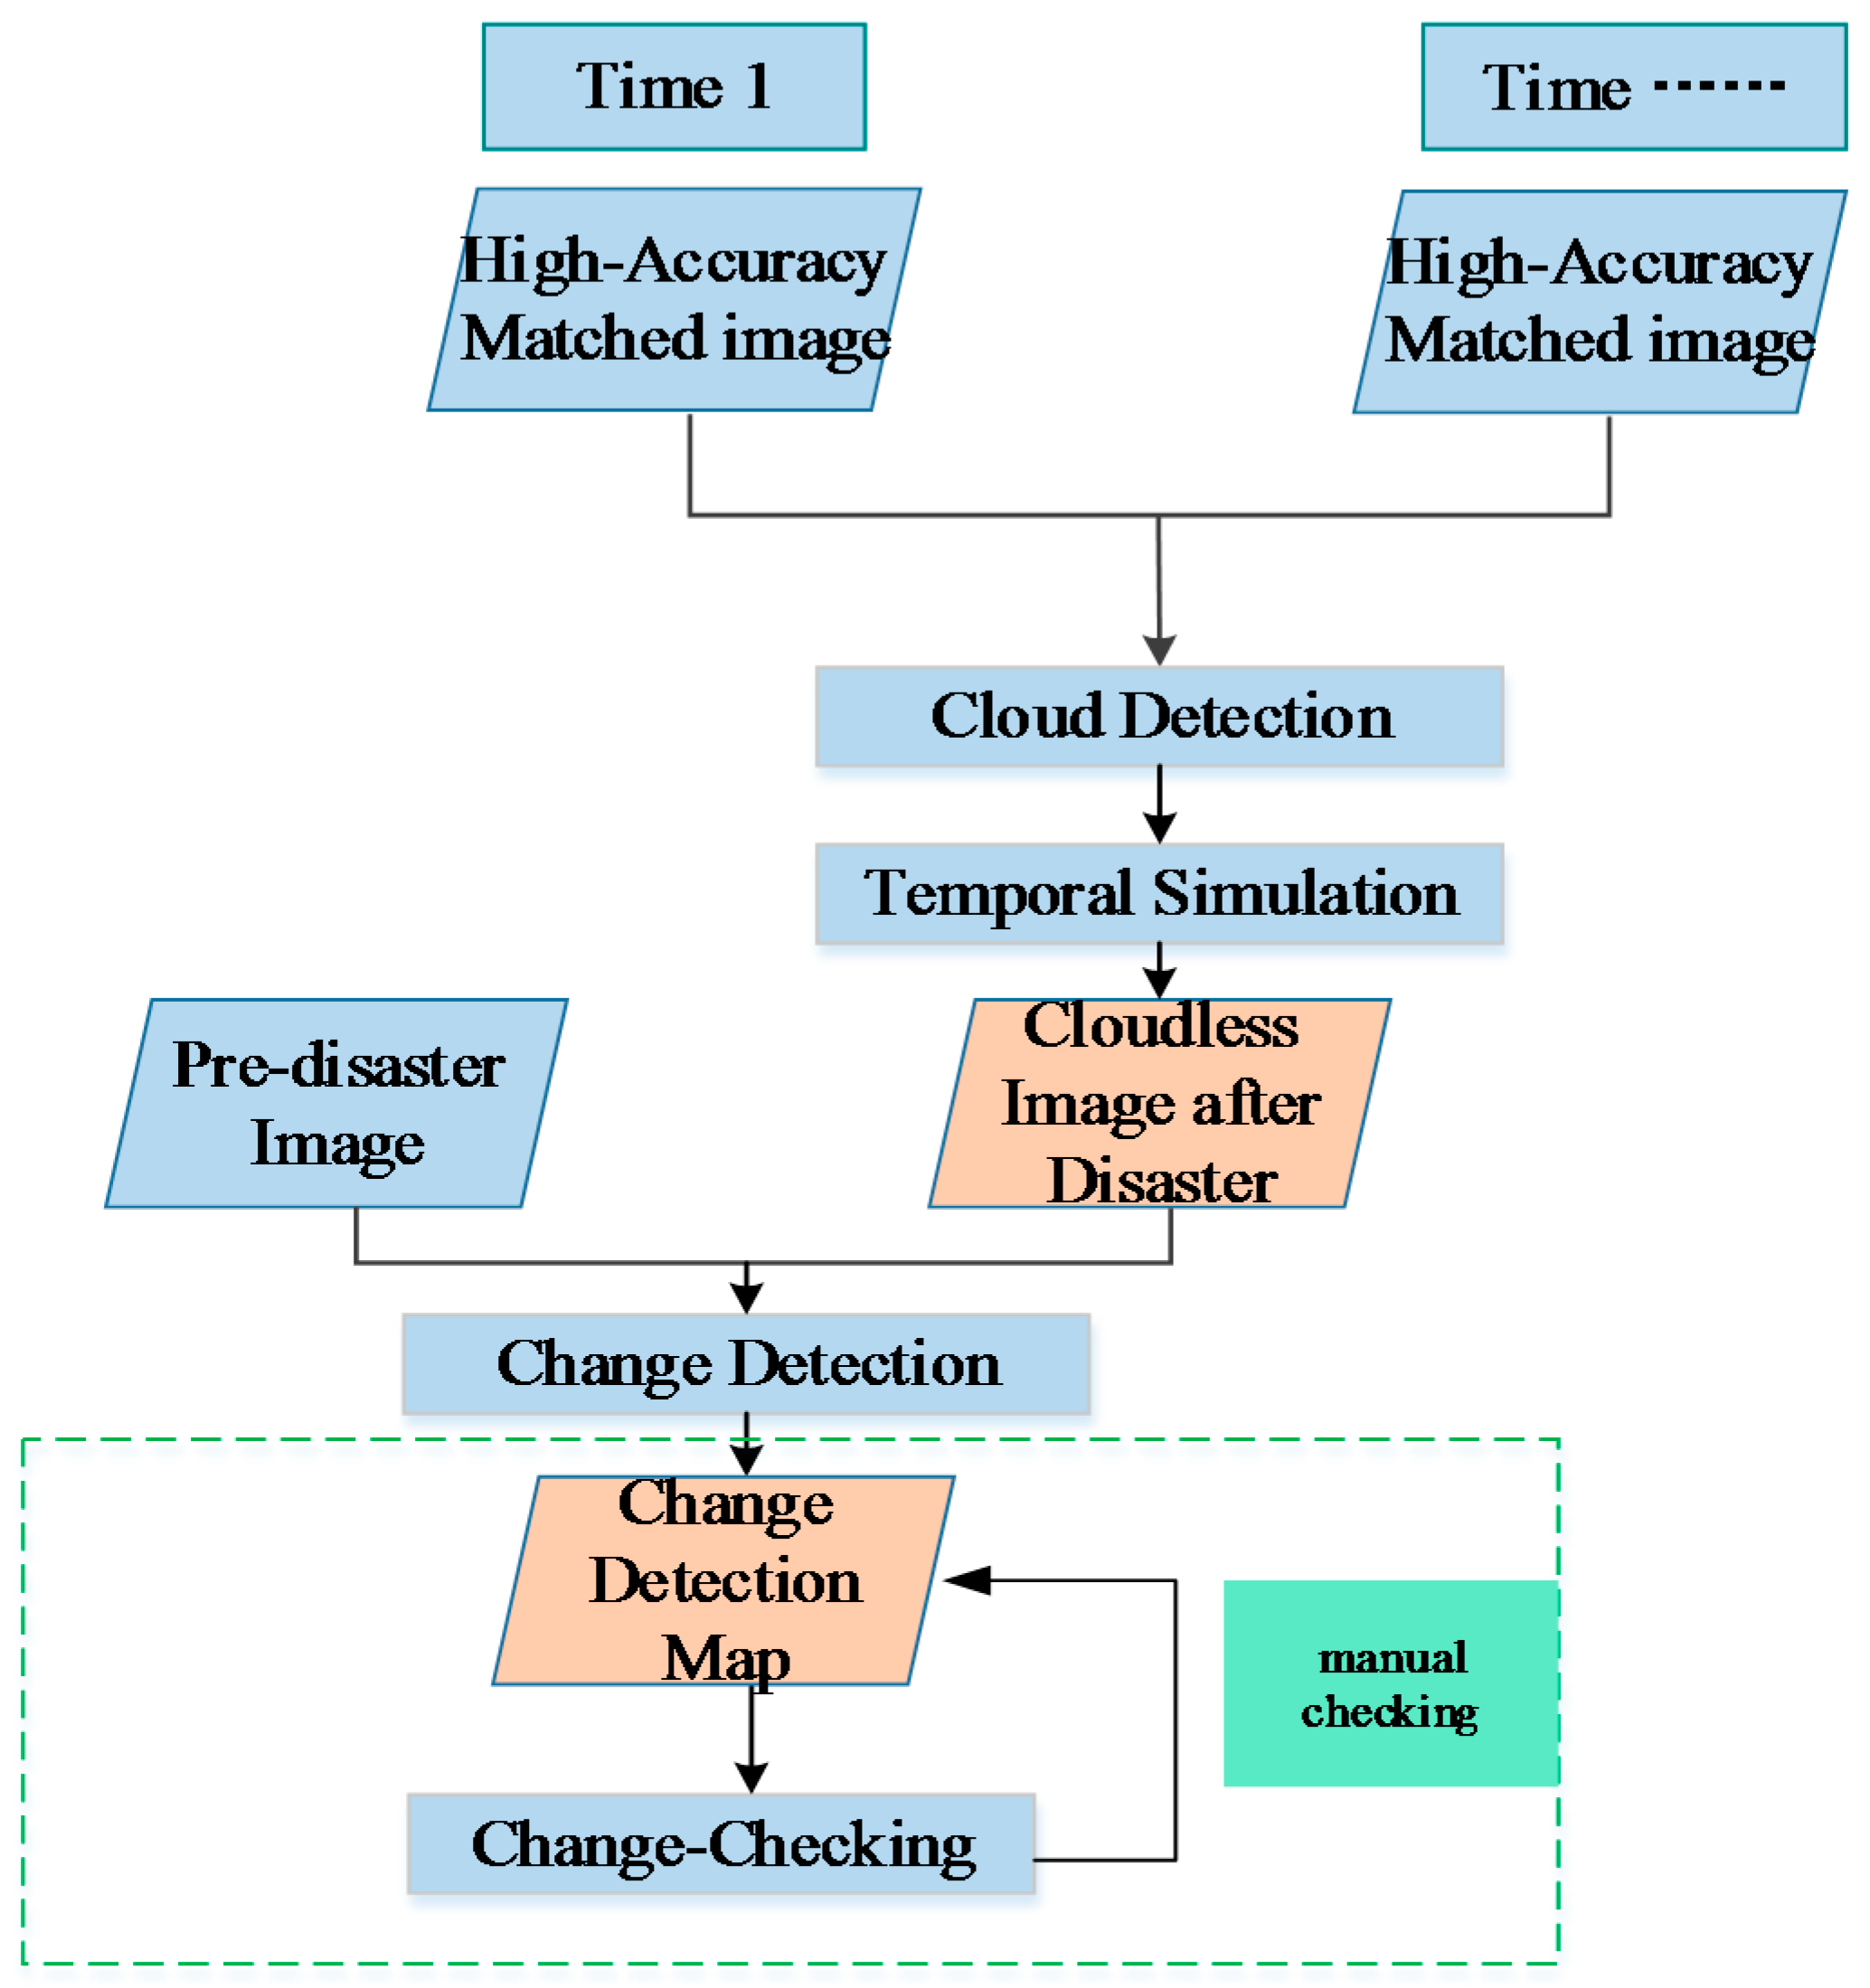
2. The Procedure and Methods
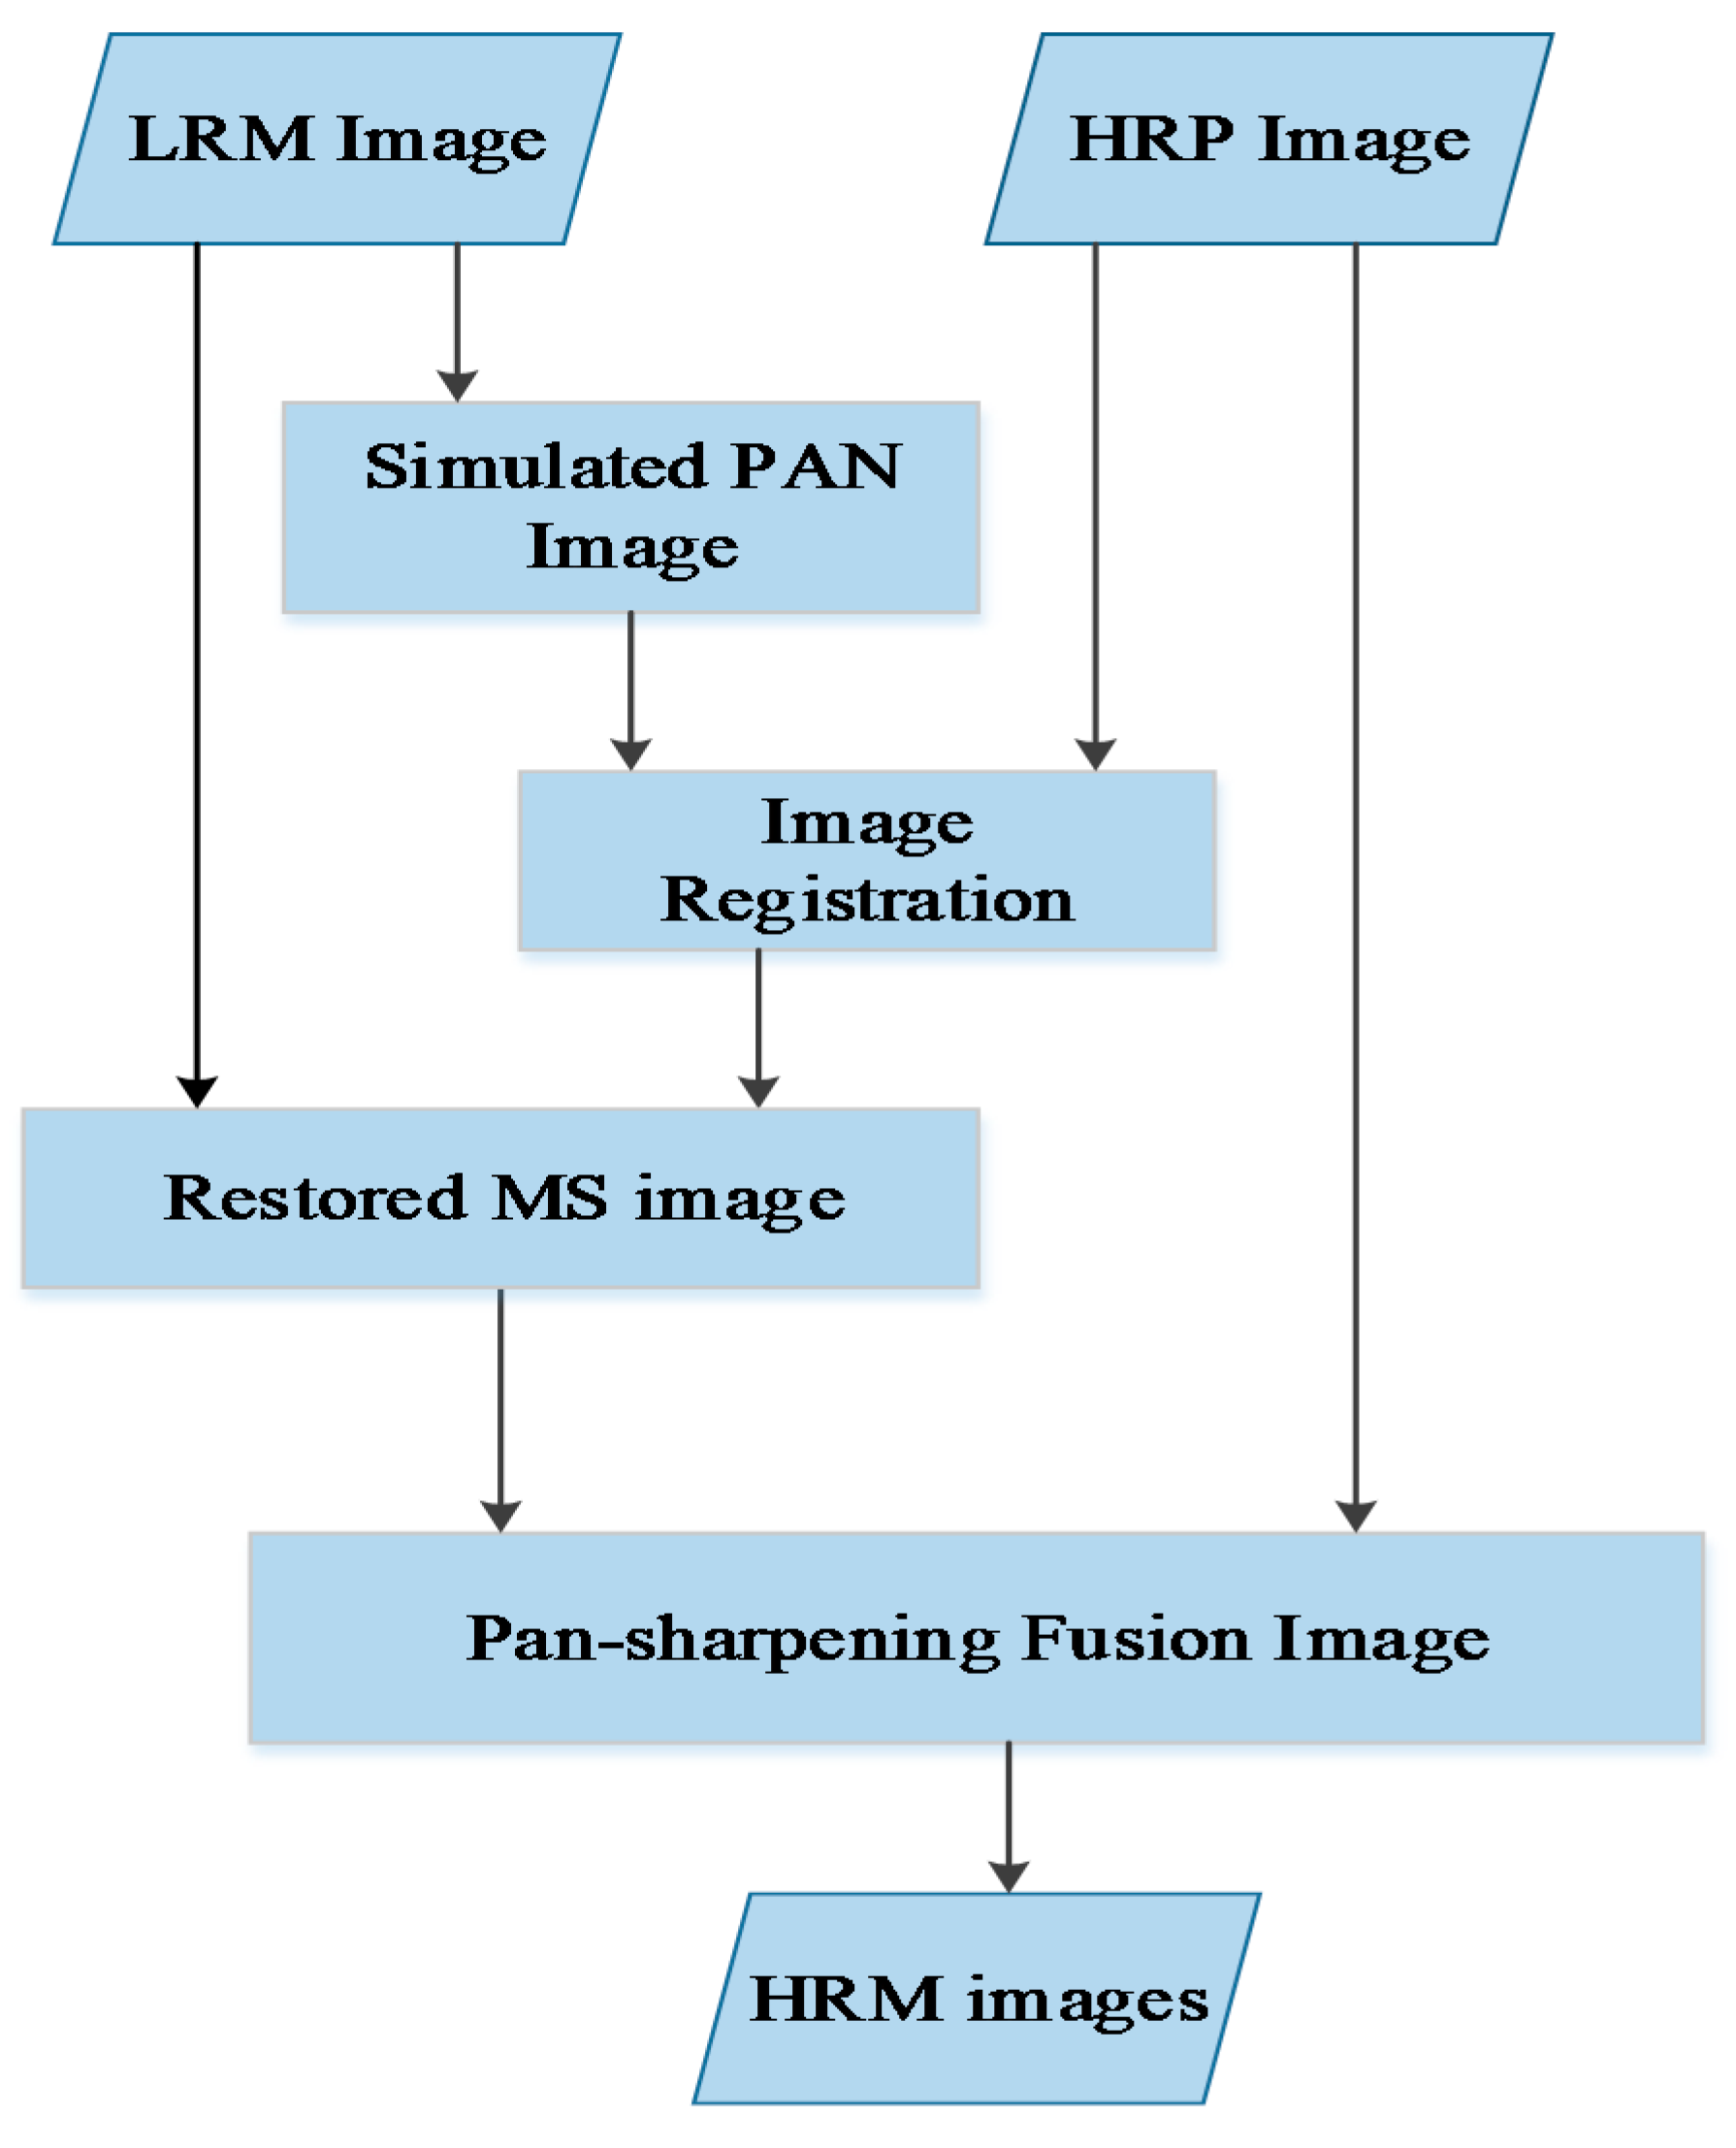
2.1. Image Fusion
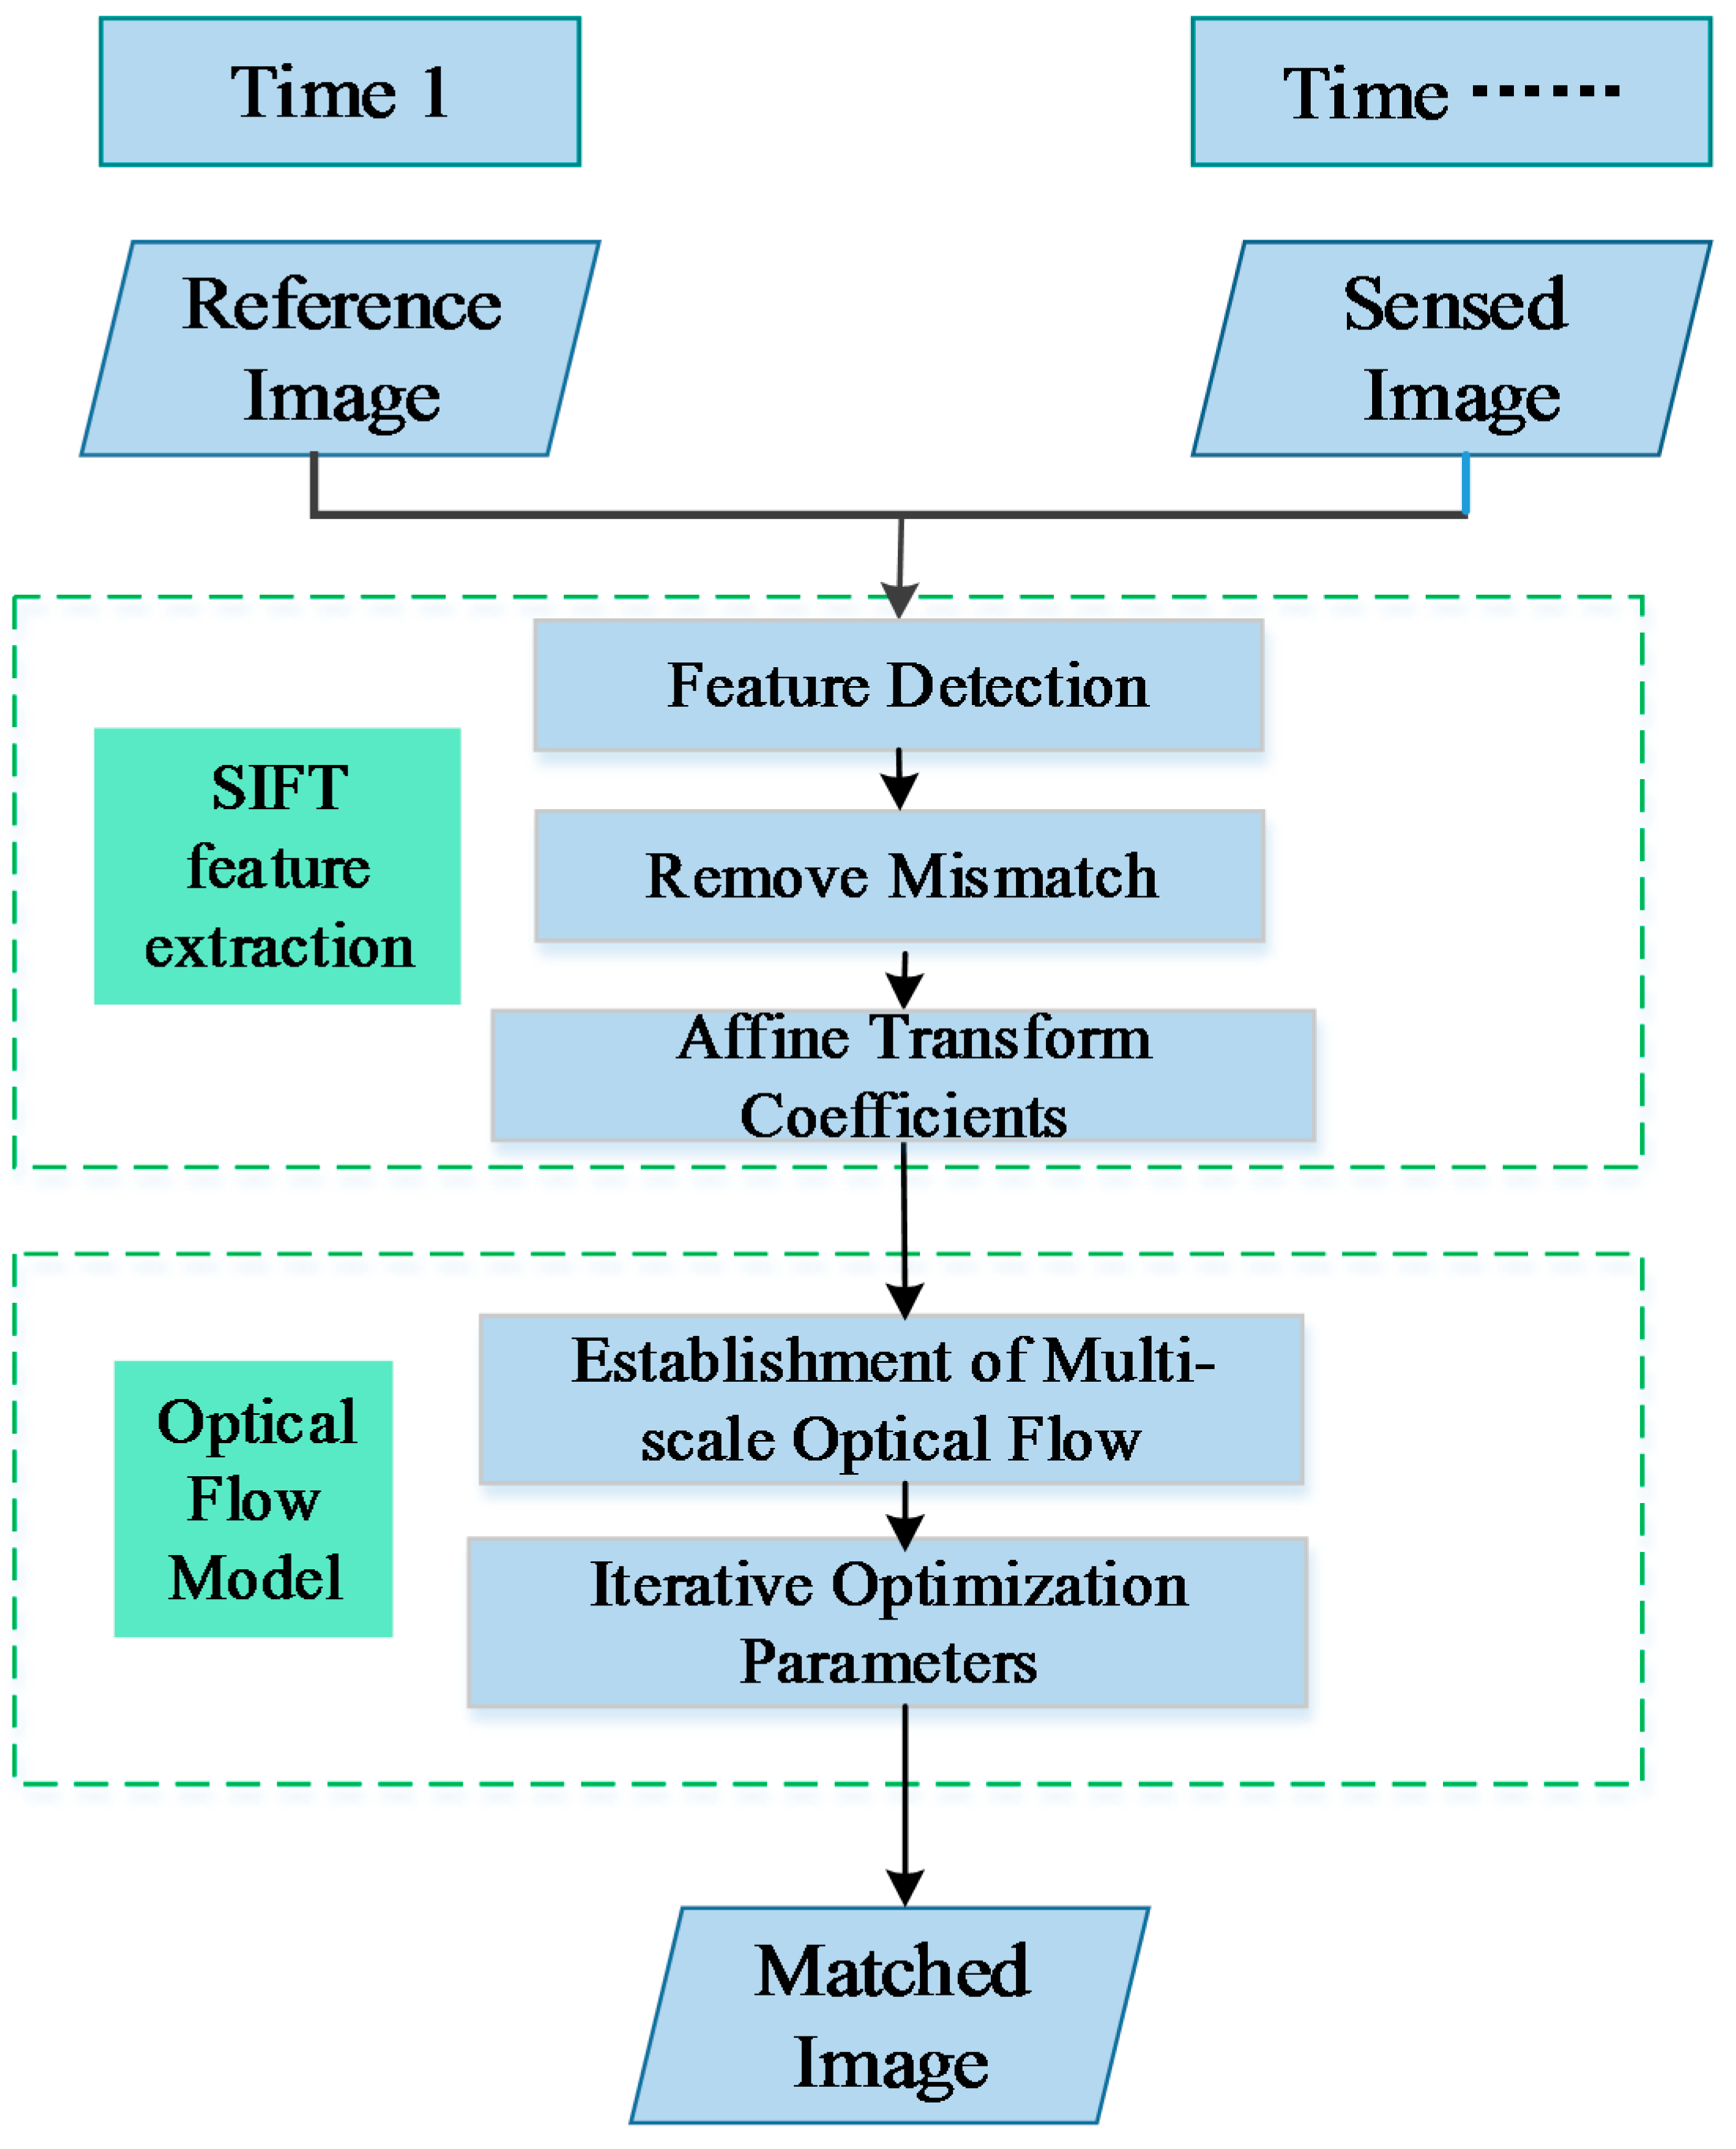
2.2. Image Registration
2.3. Map Production
3. Experiments Results and Analysis
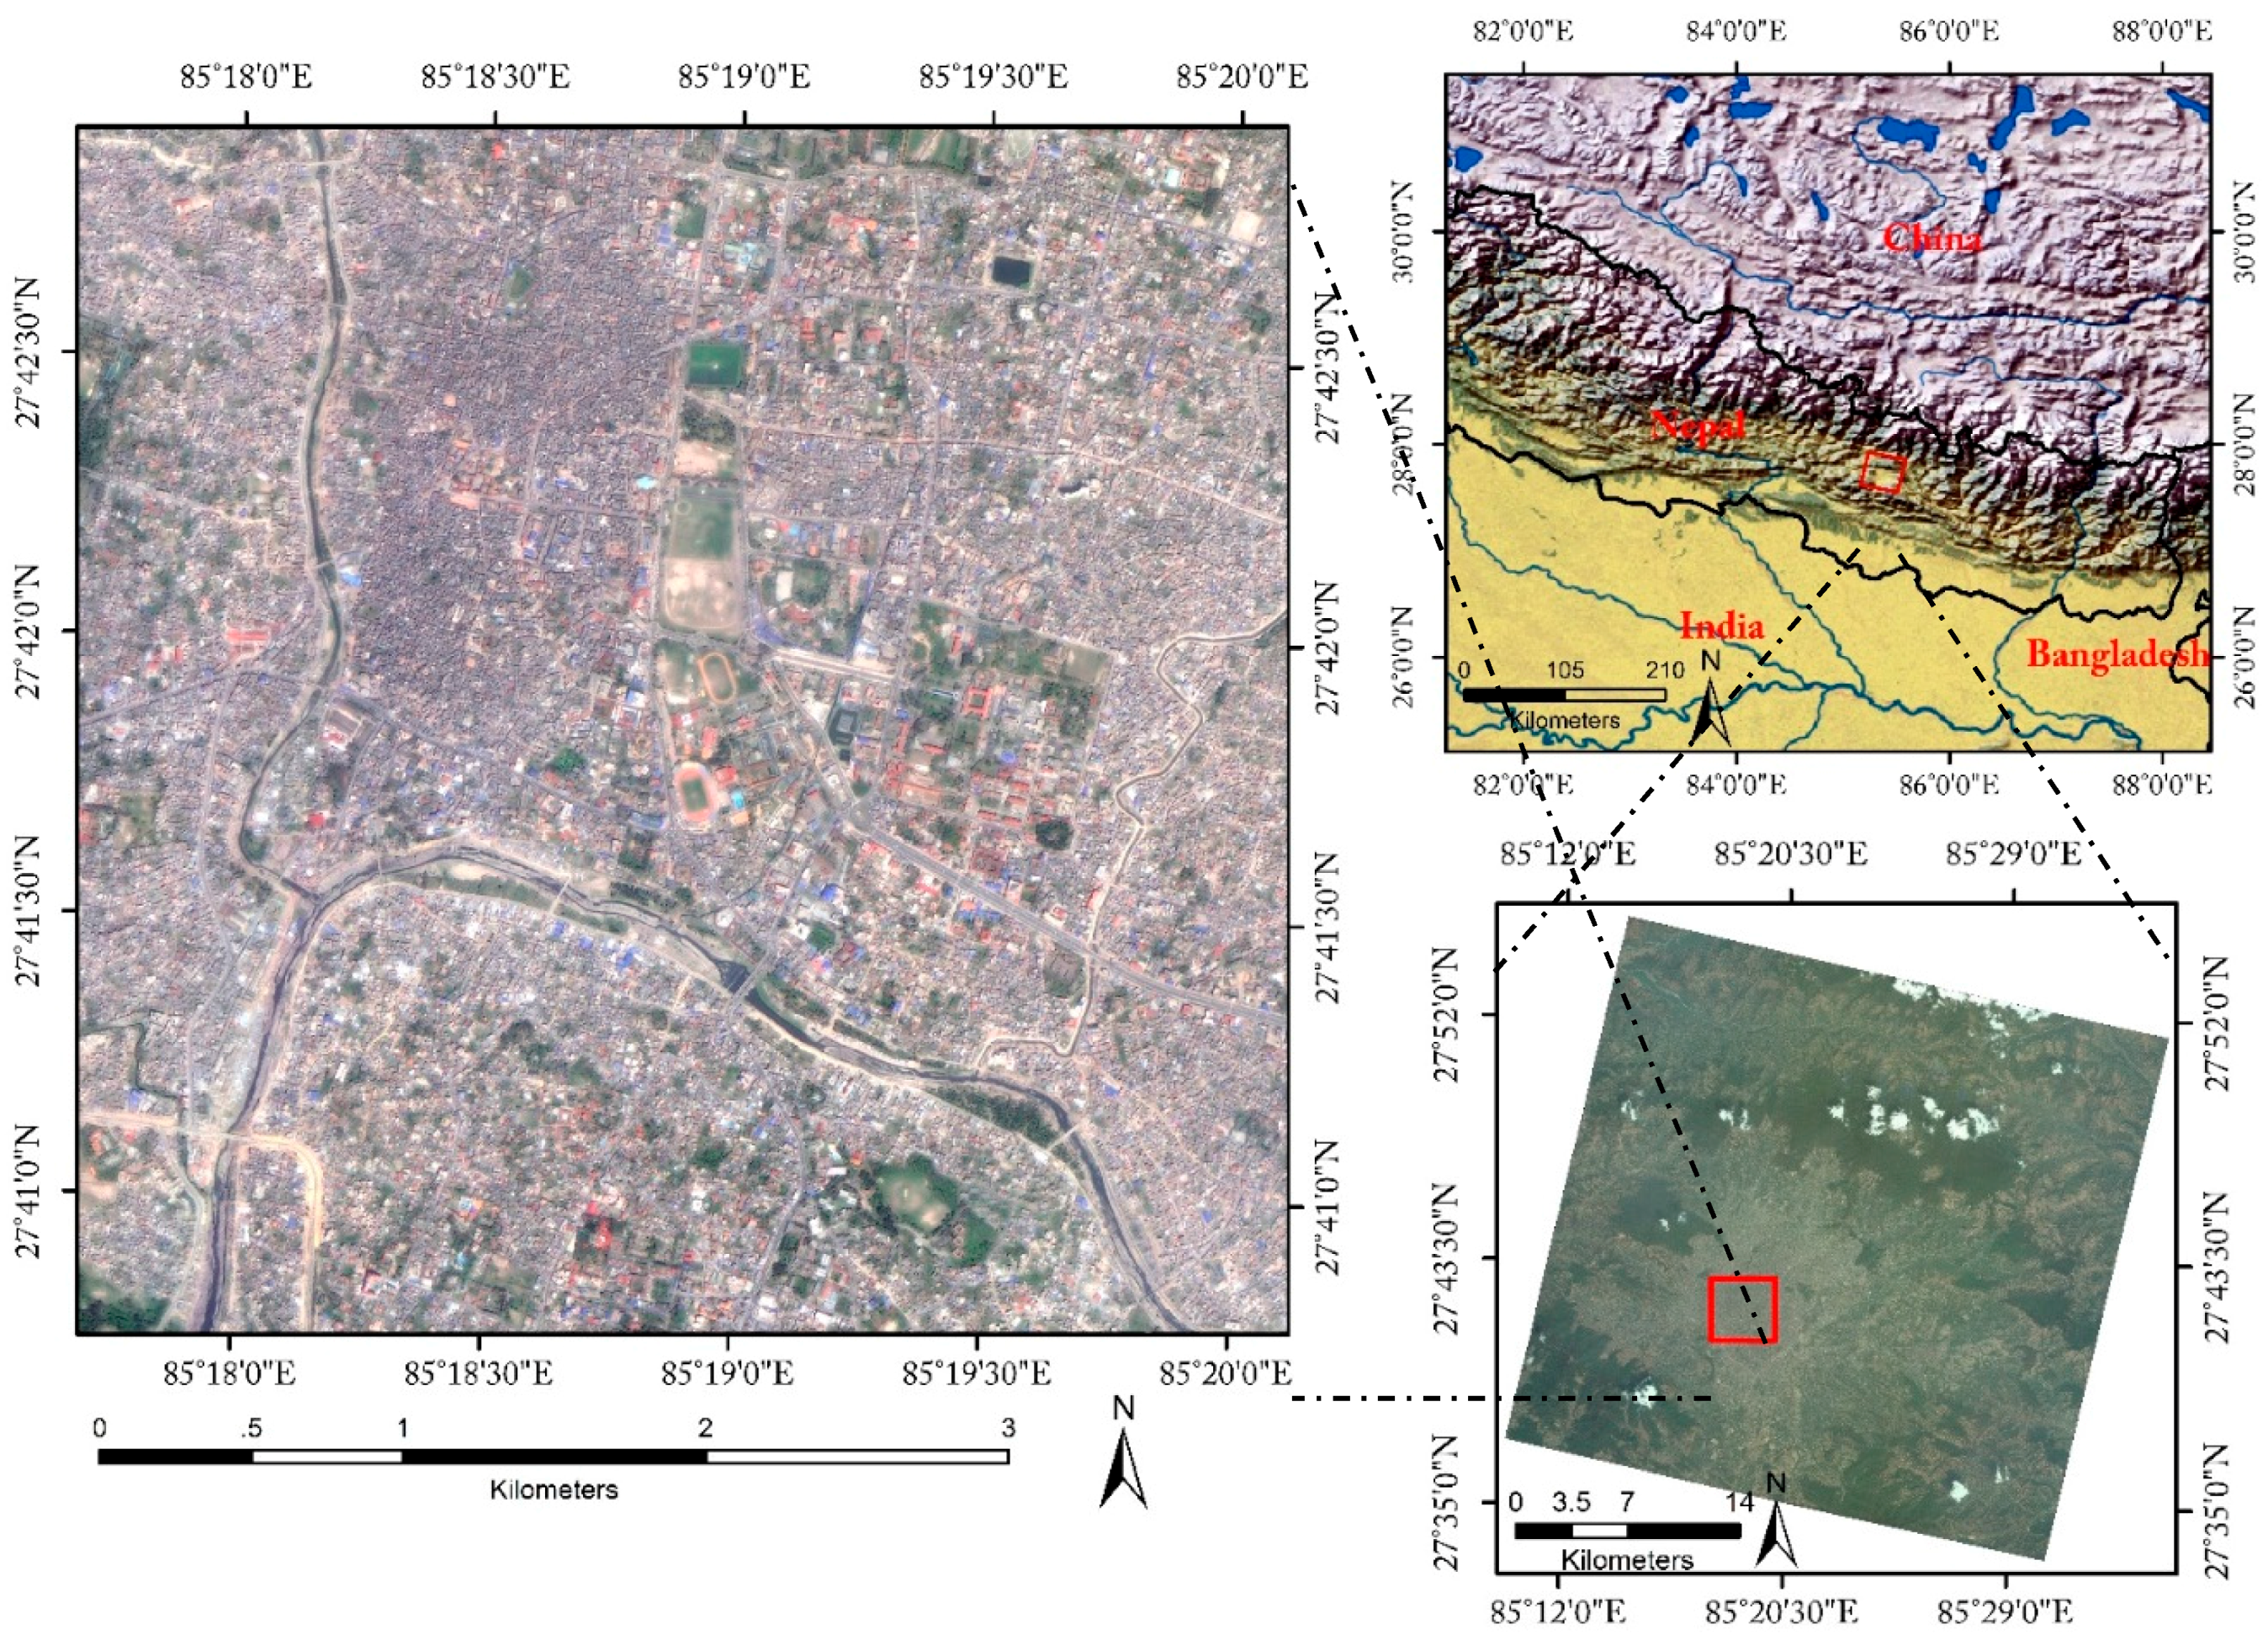
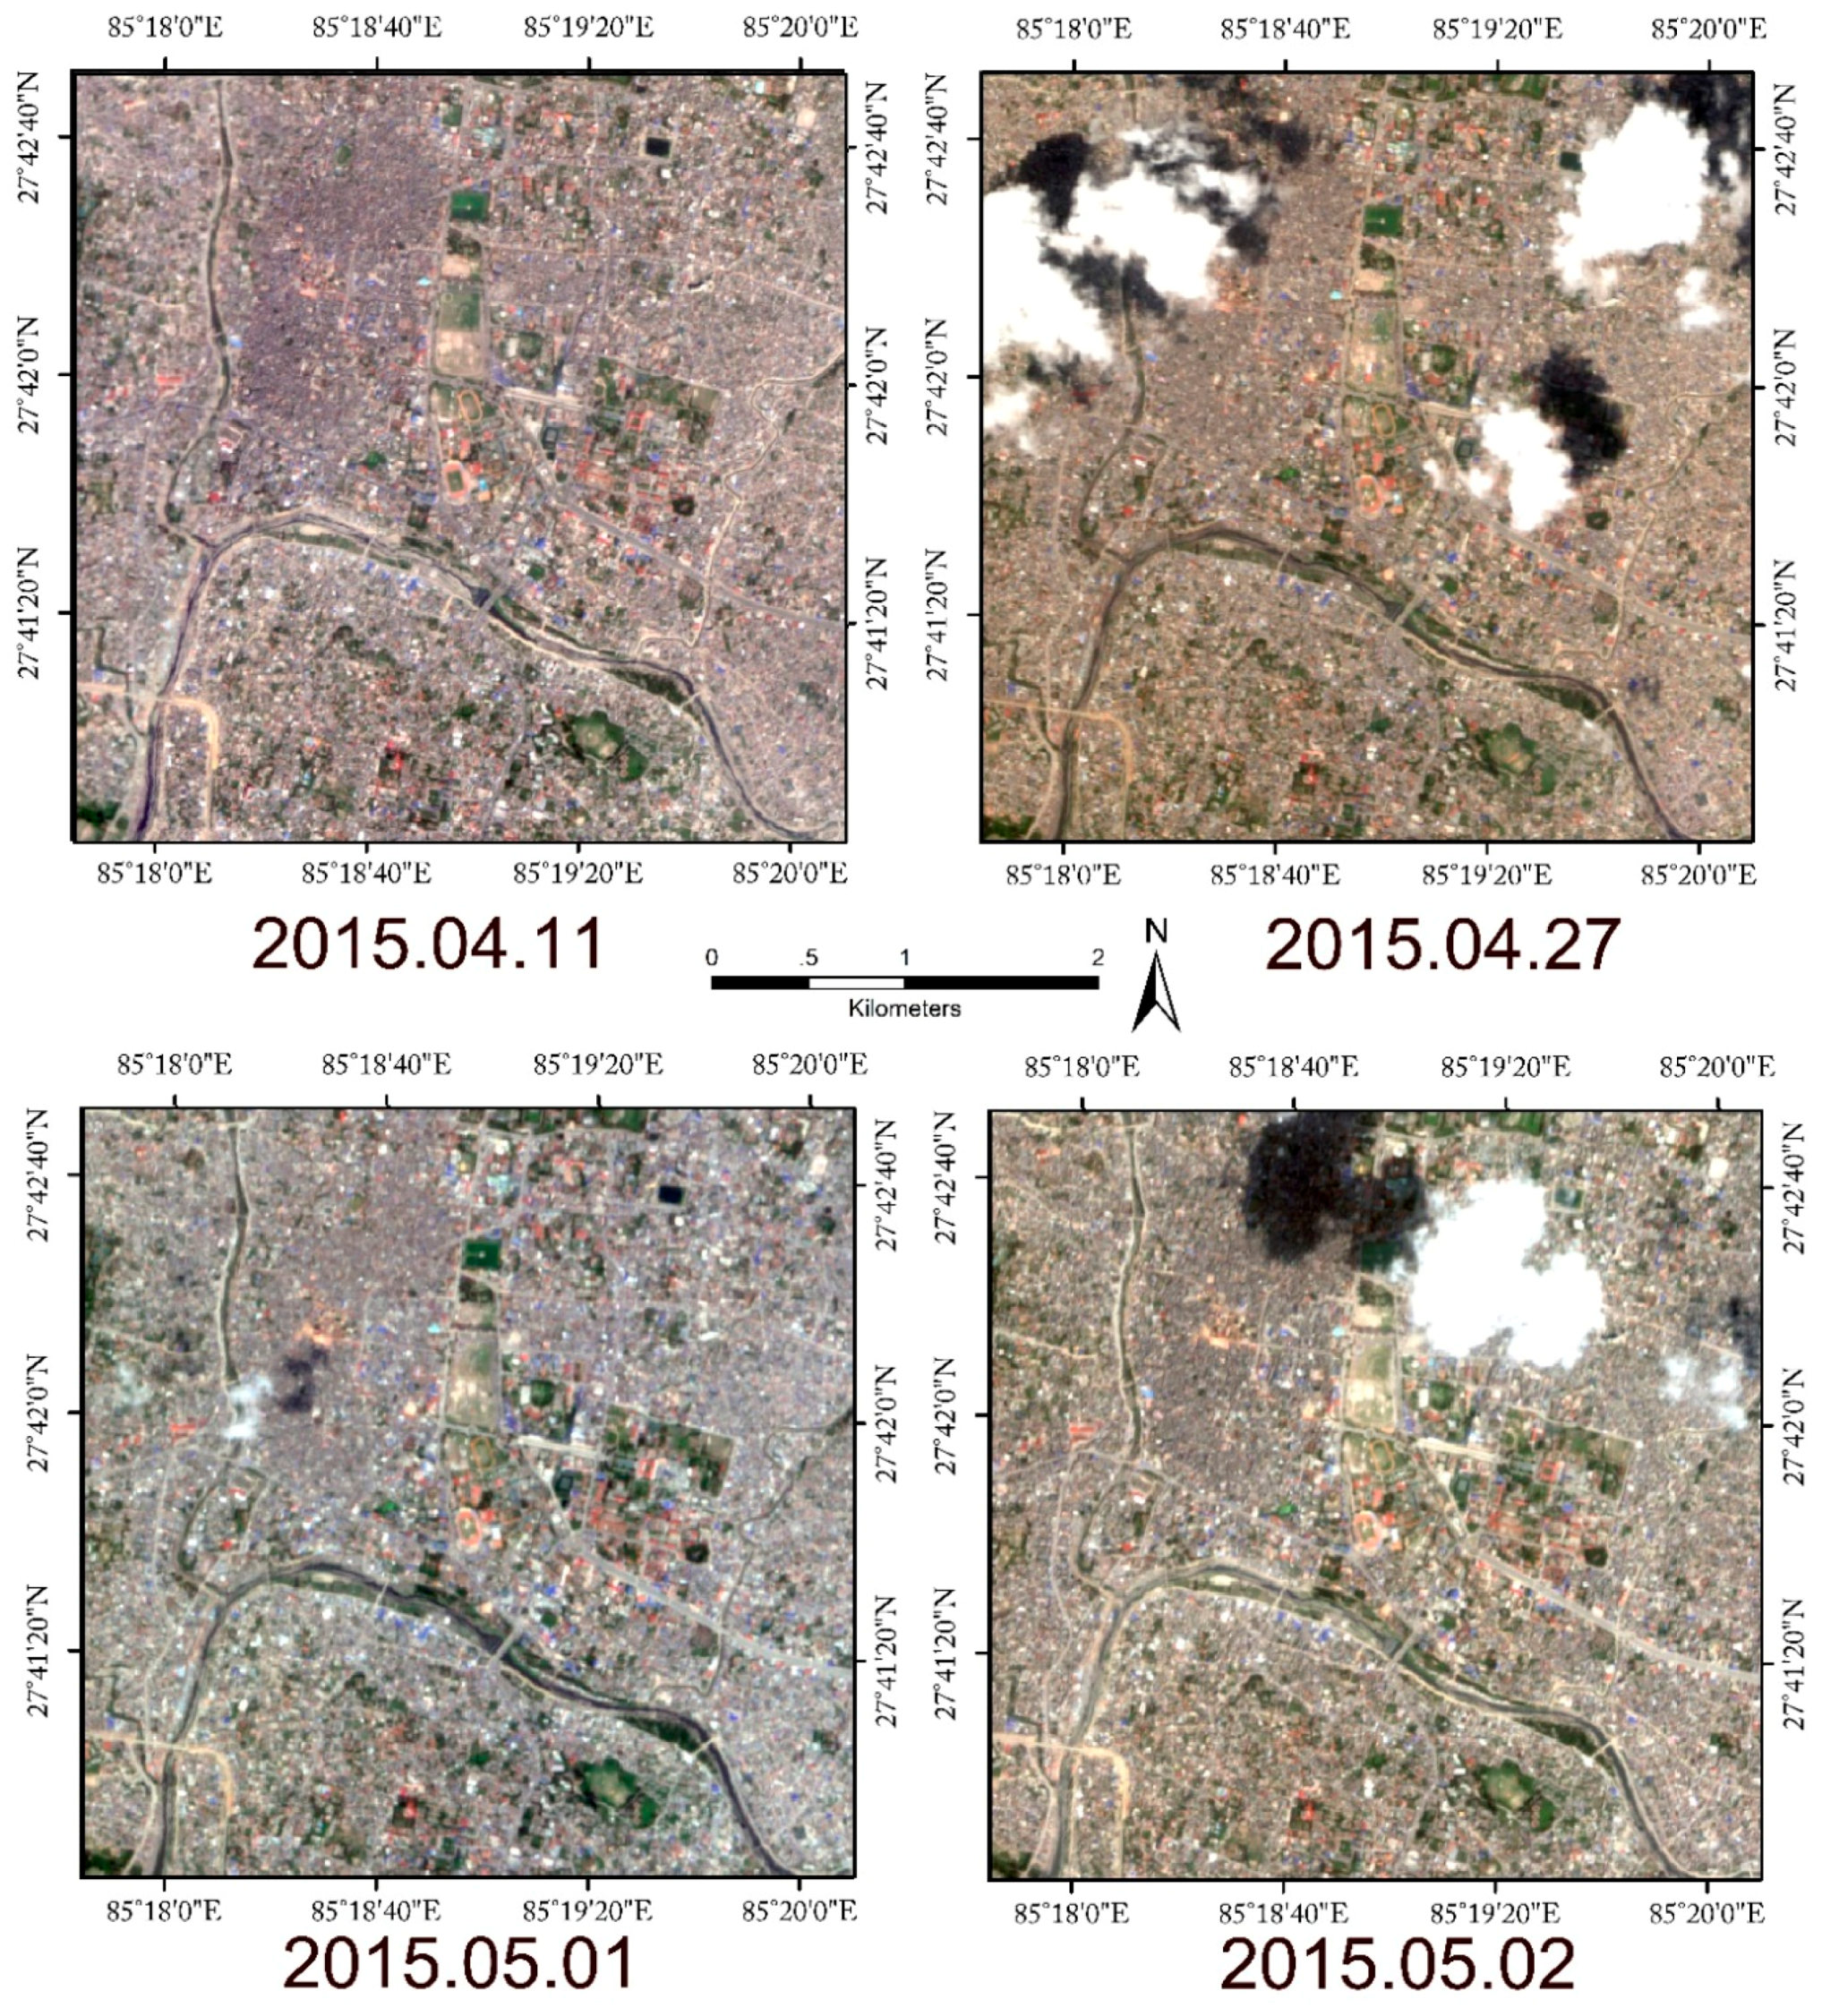
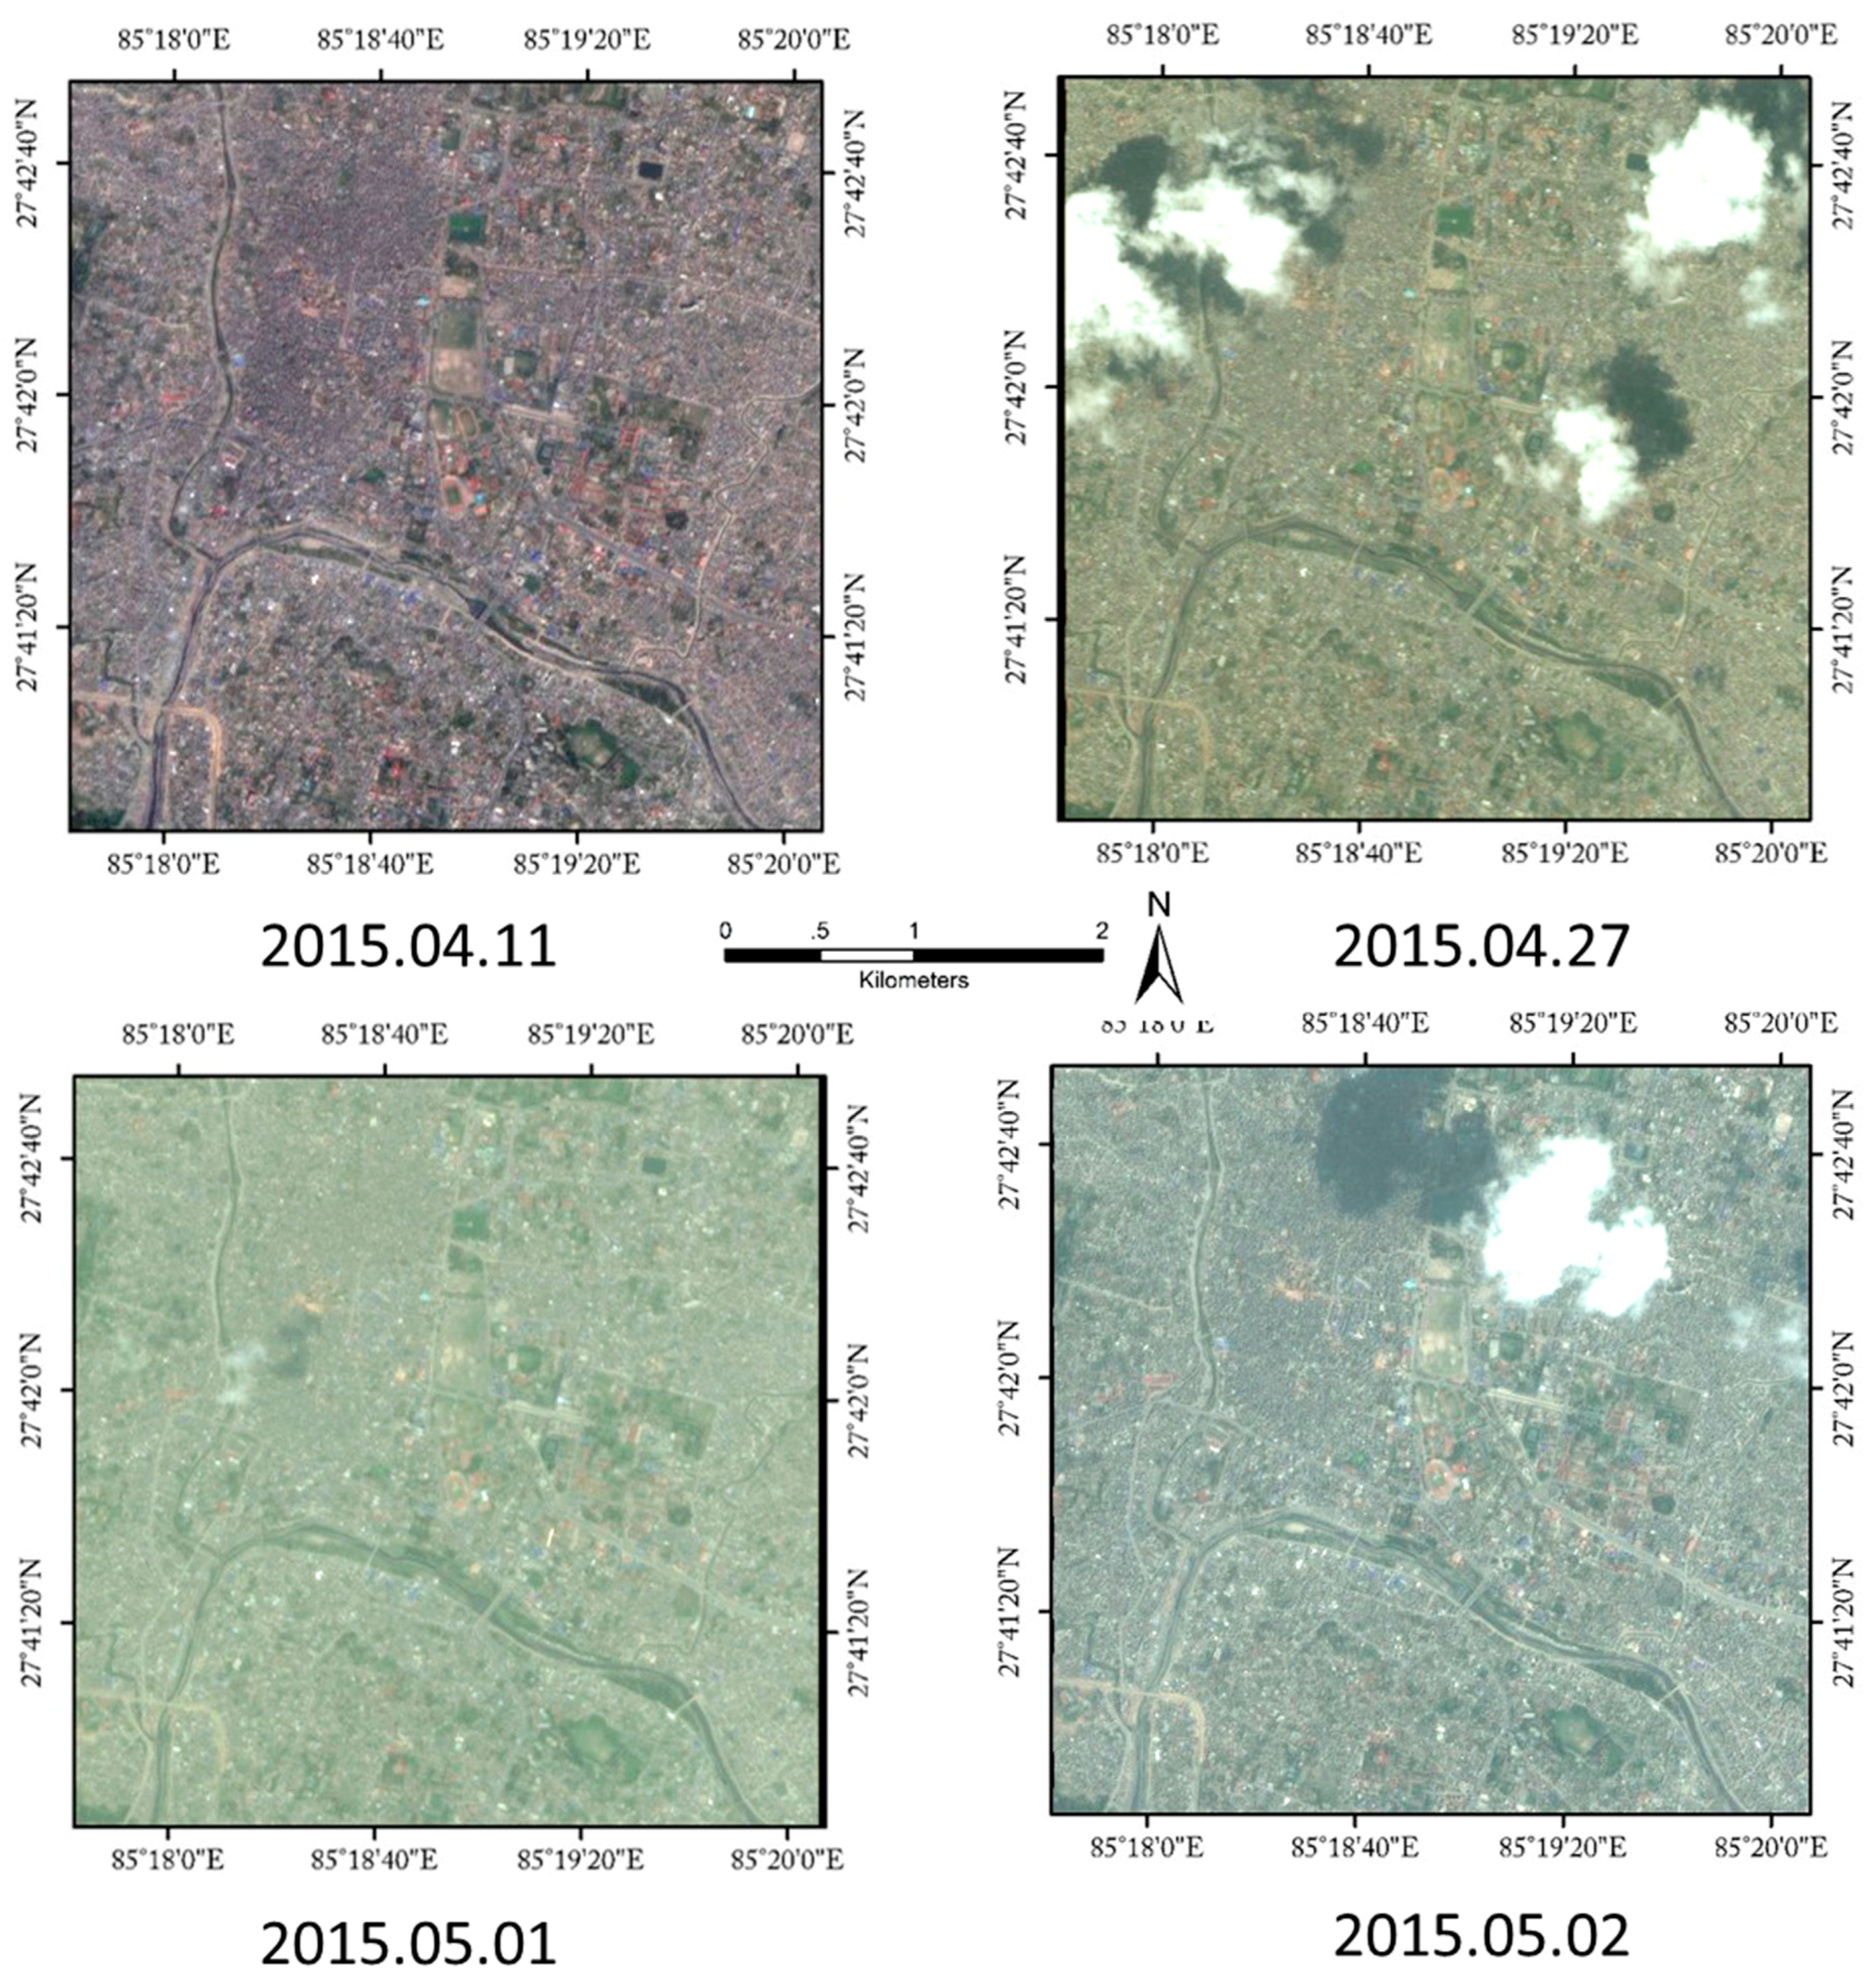
3.1. Study Area and Data Sets
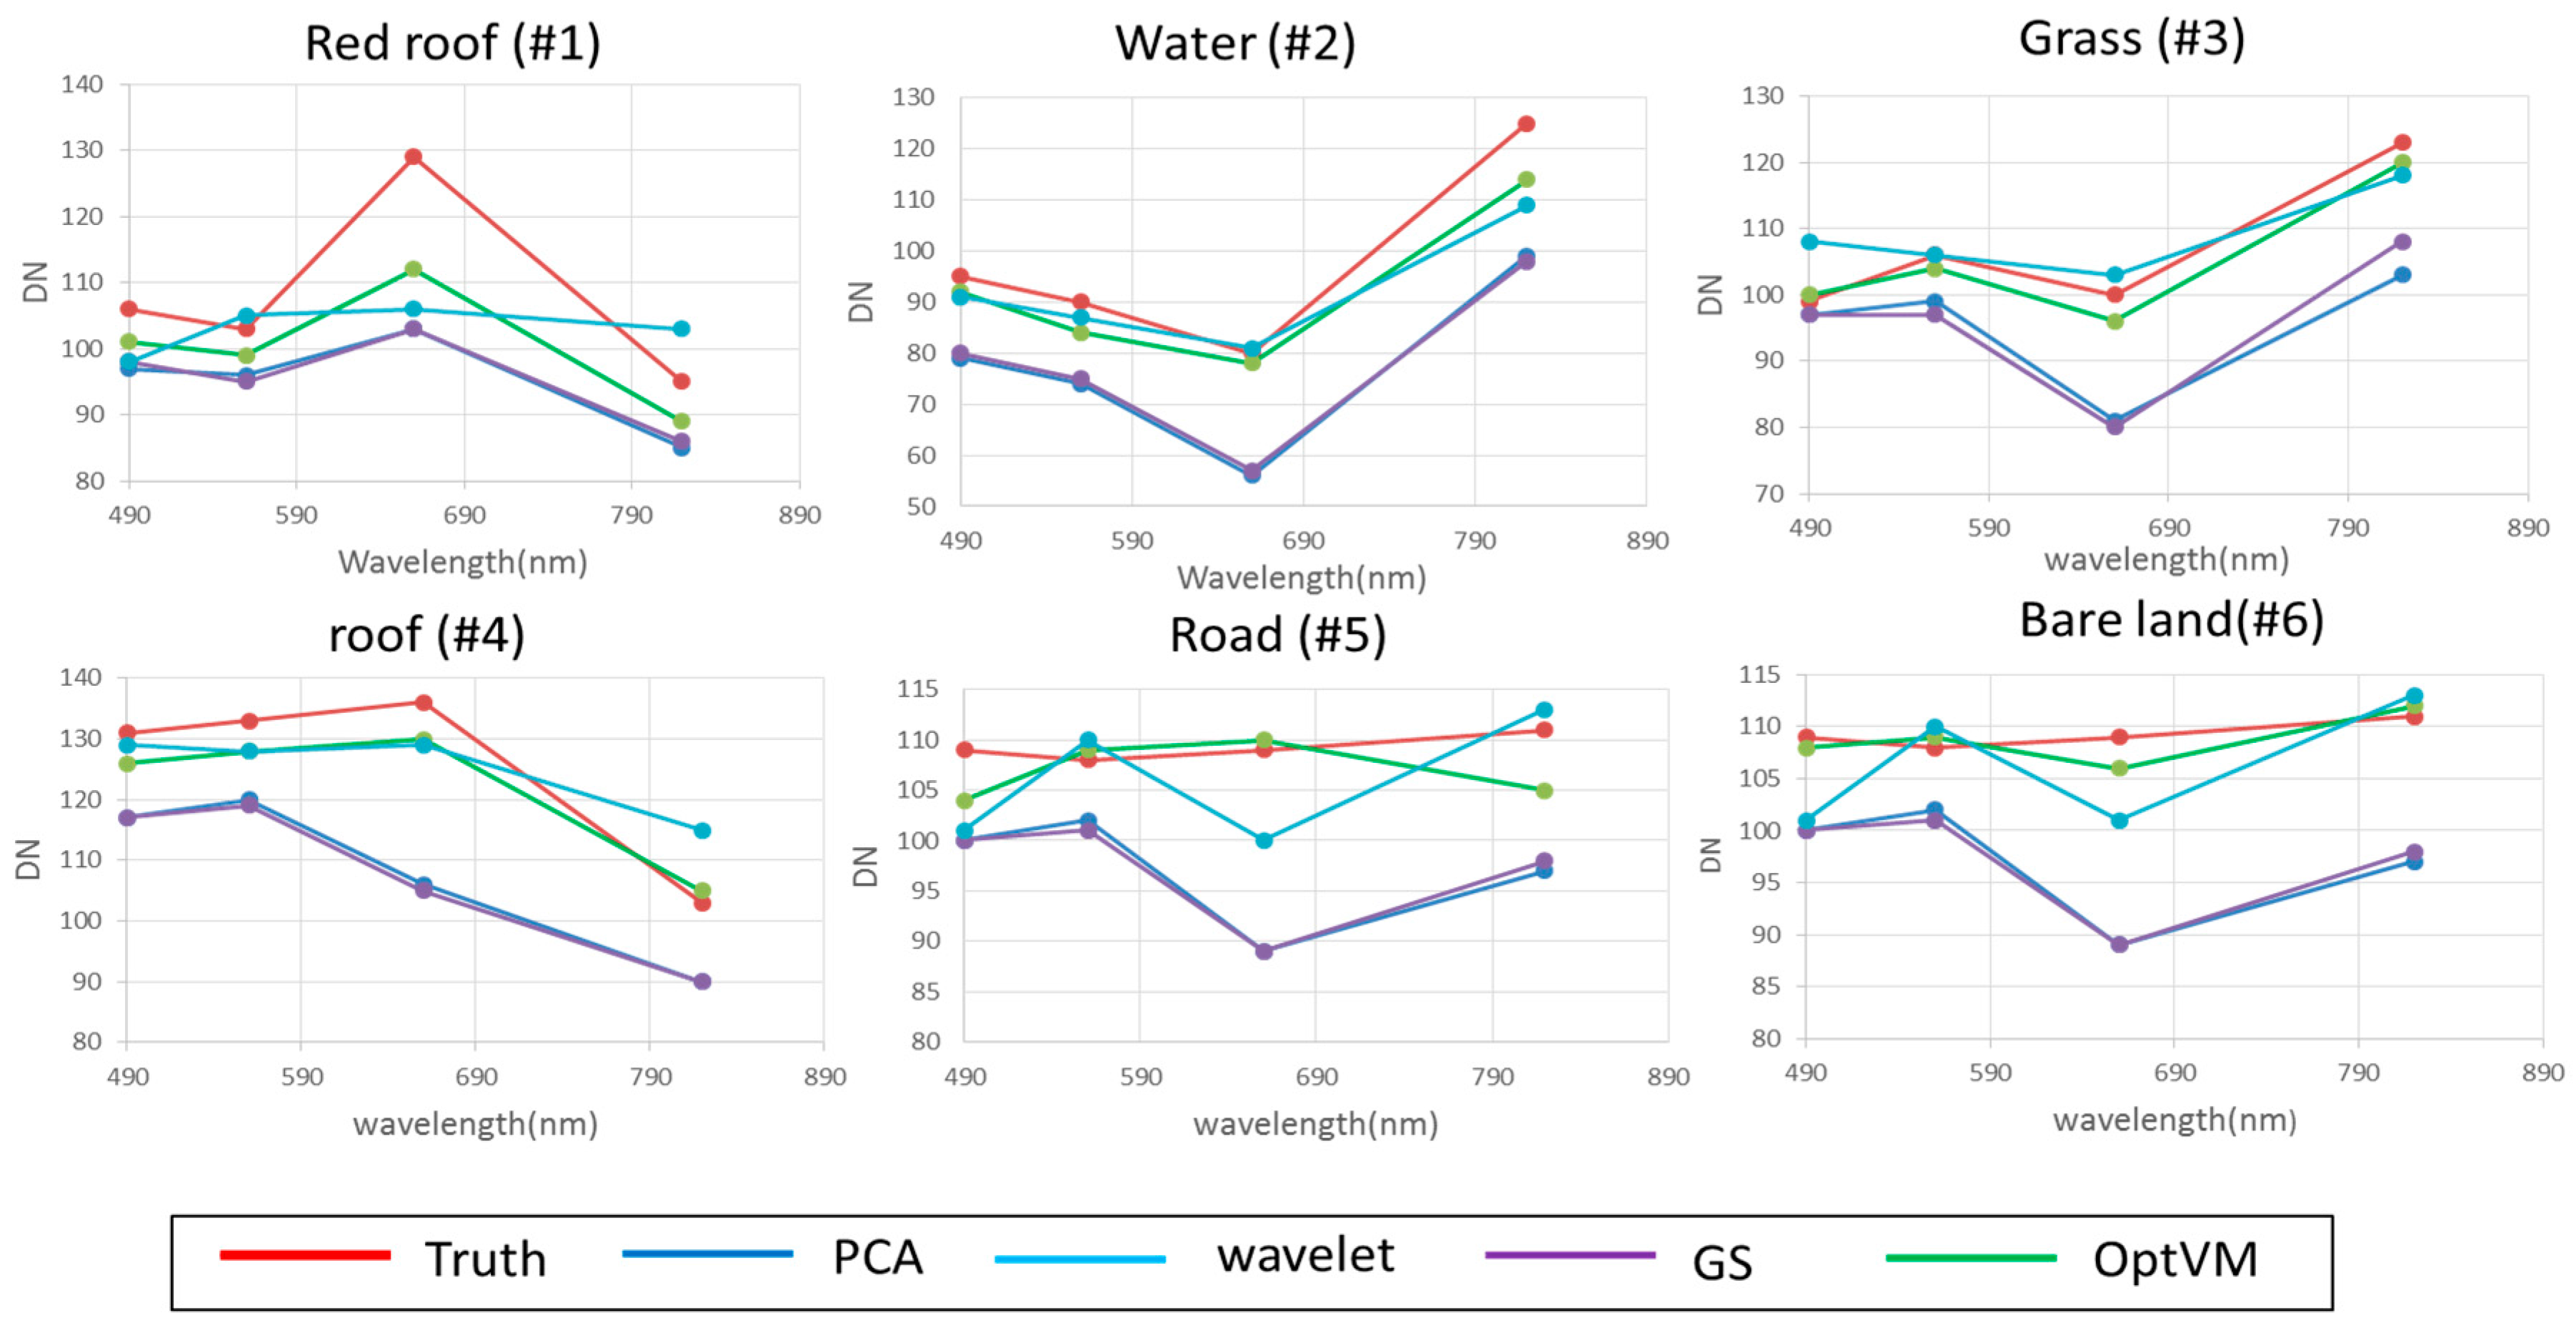
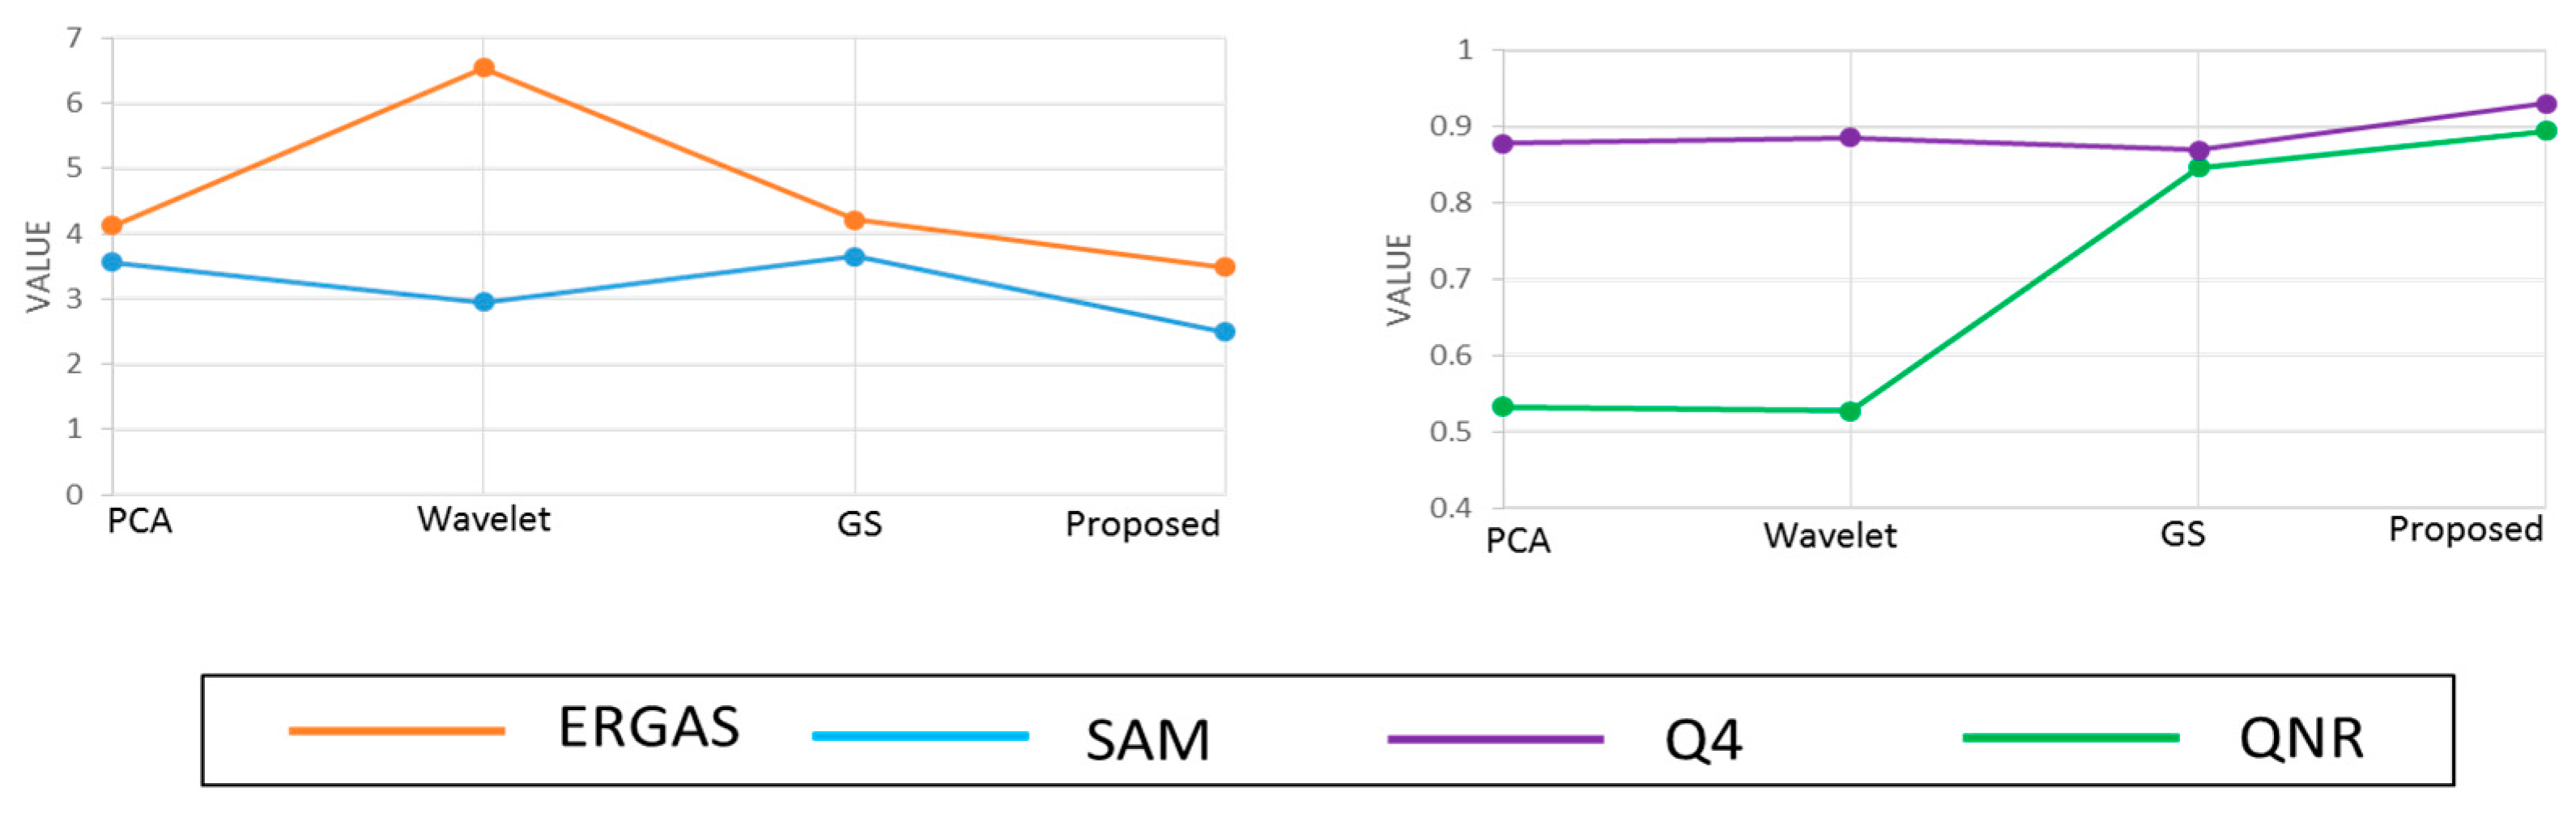
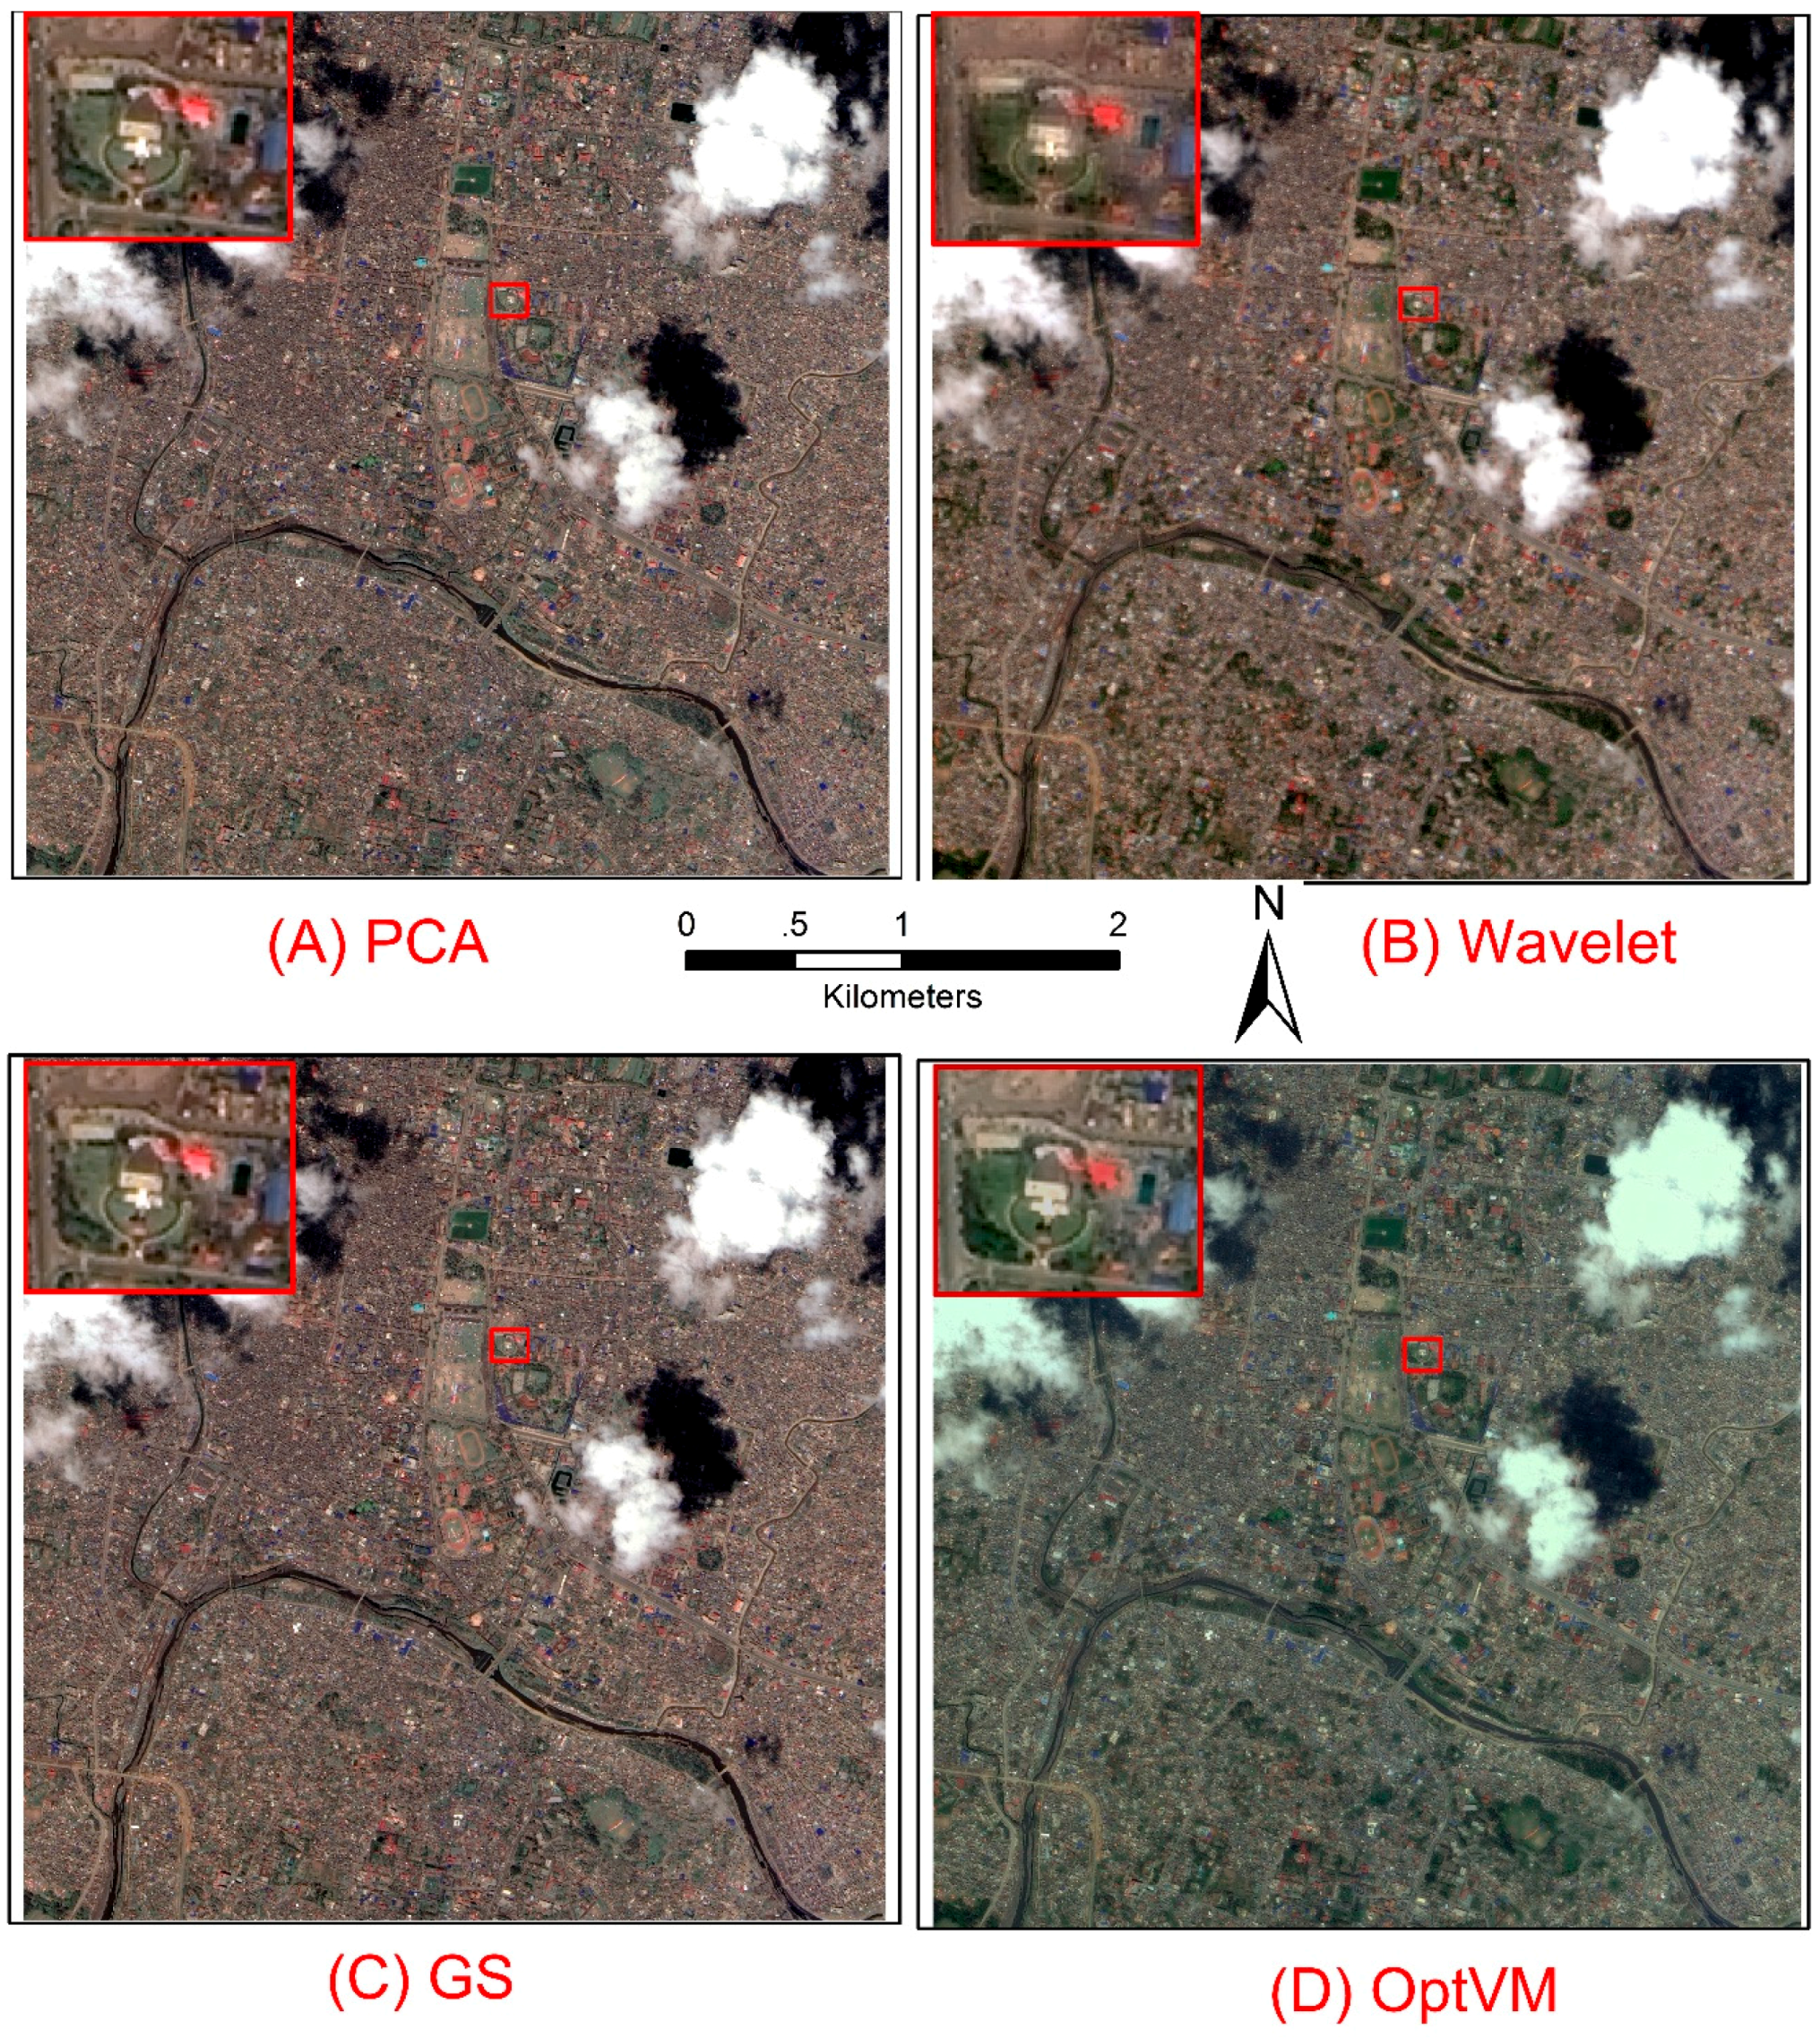
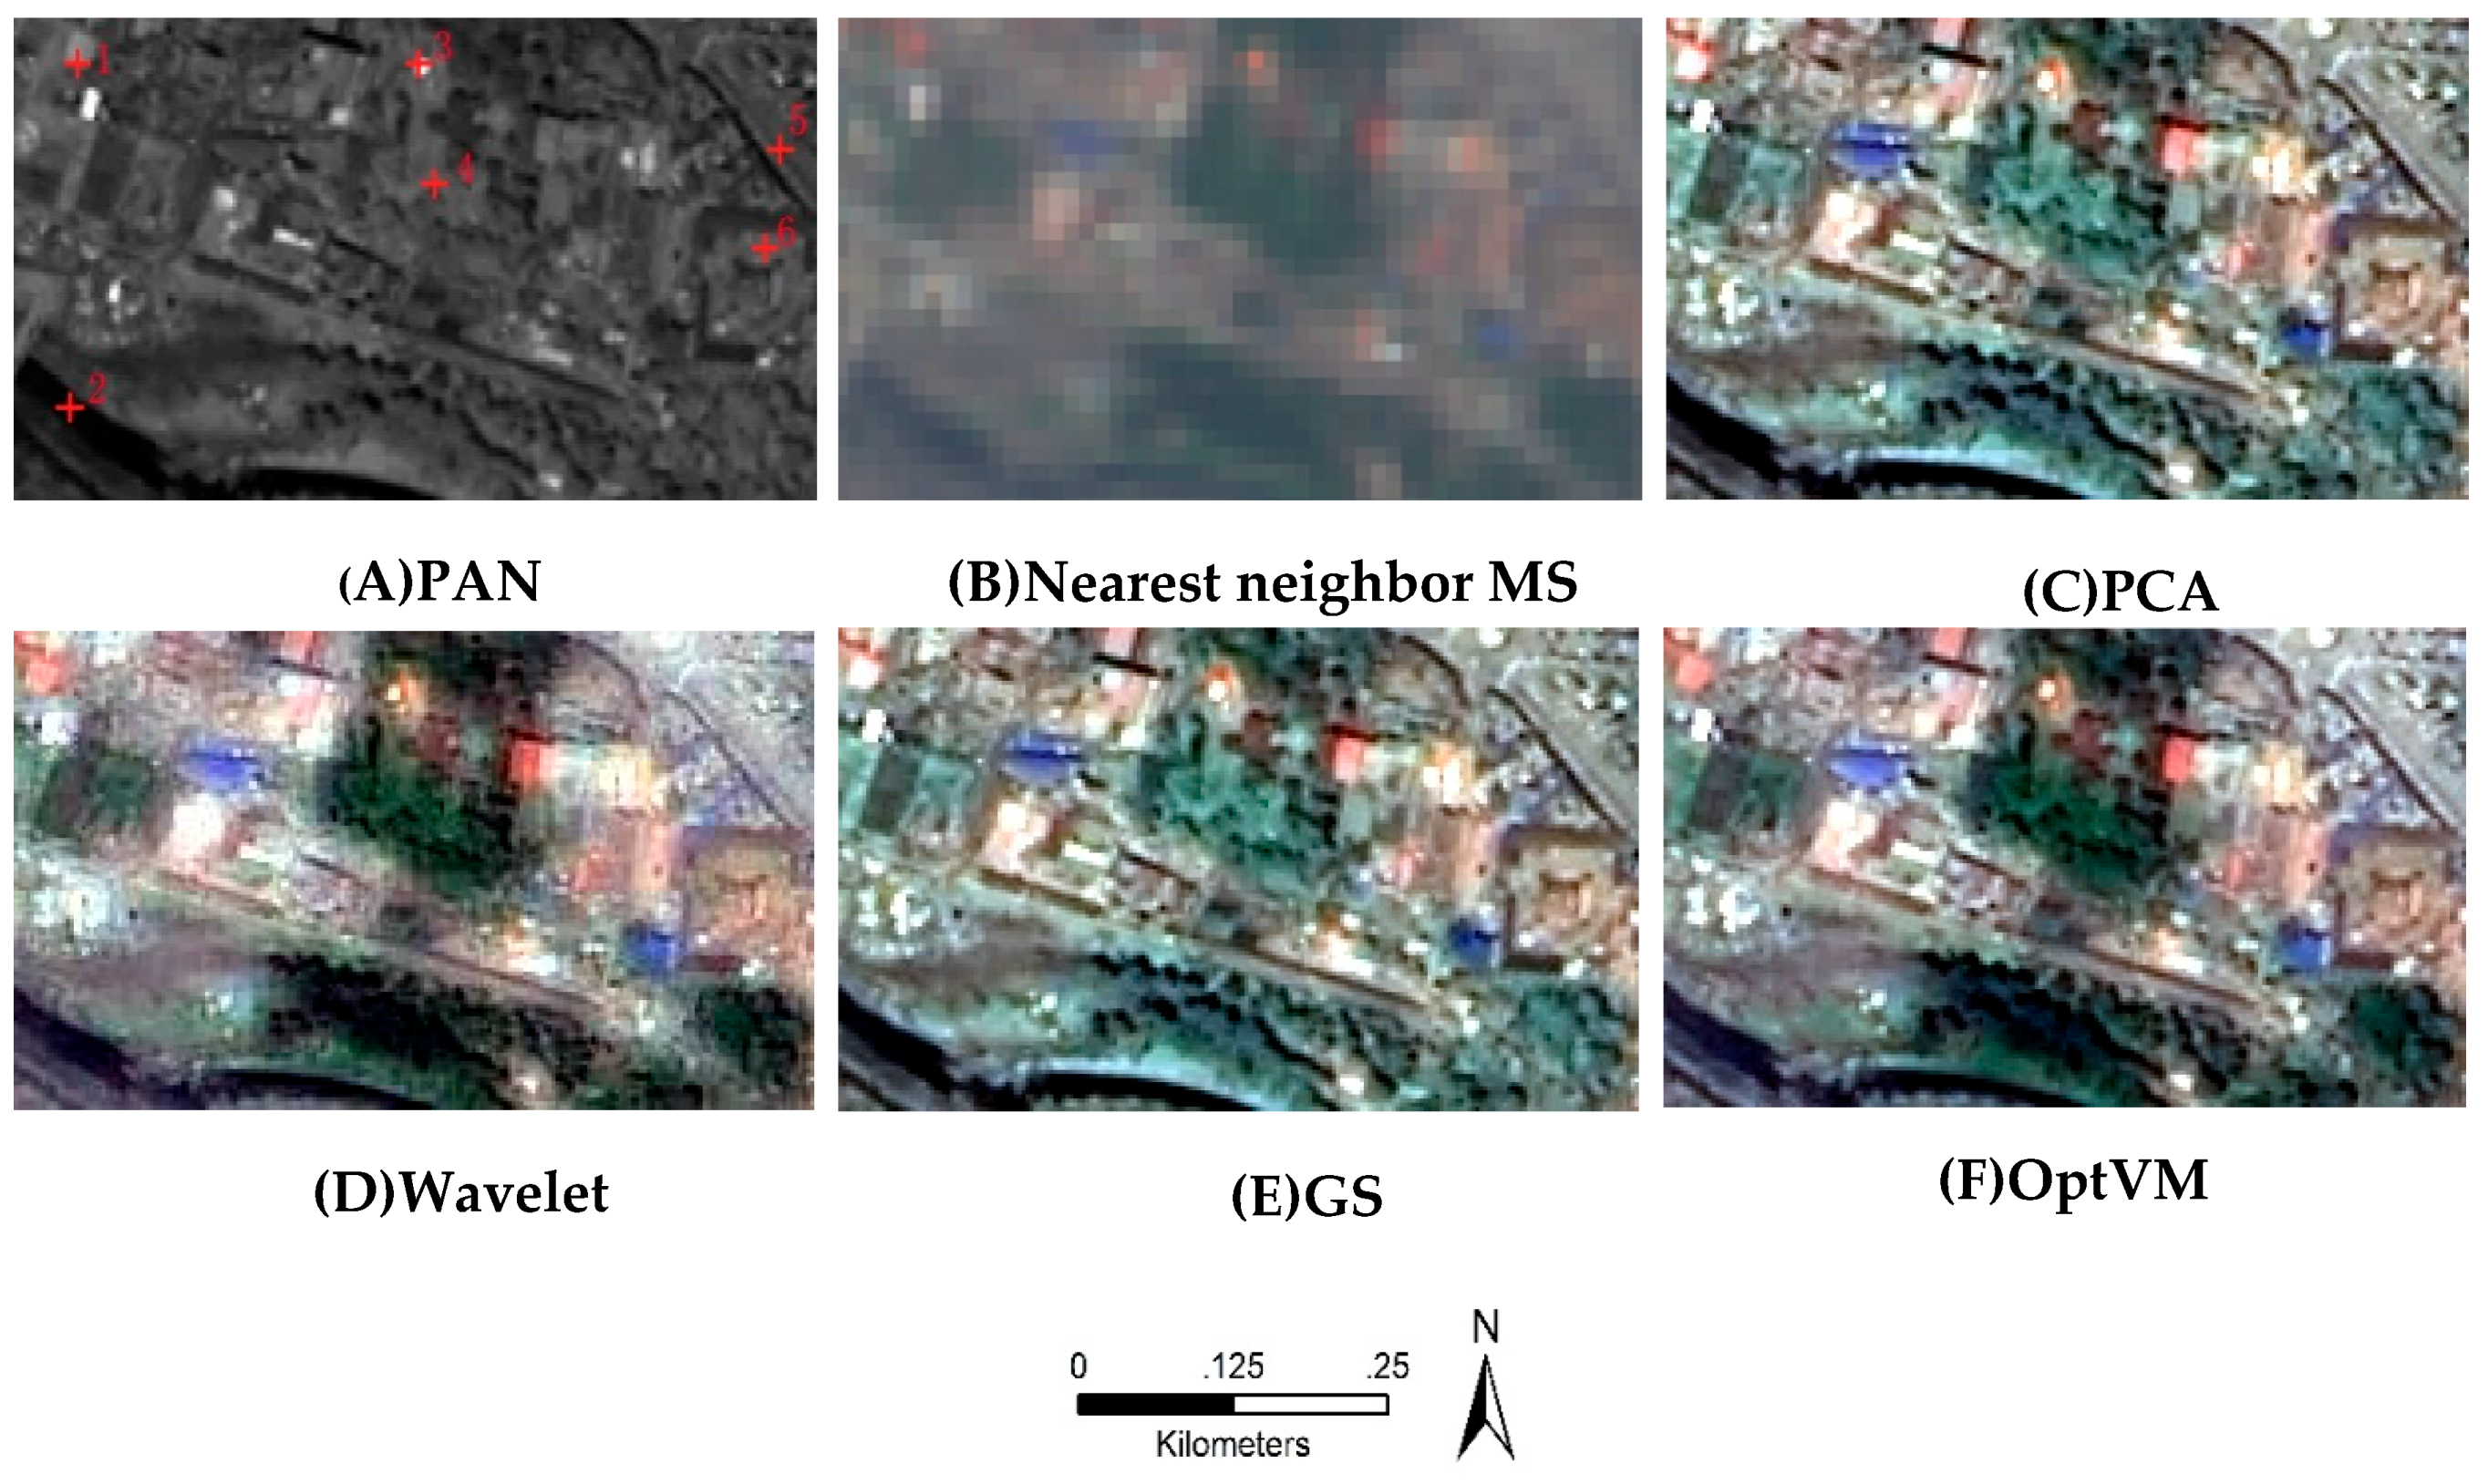
3.2. Image Fusion Results and Analysis
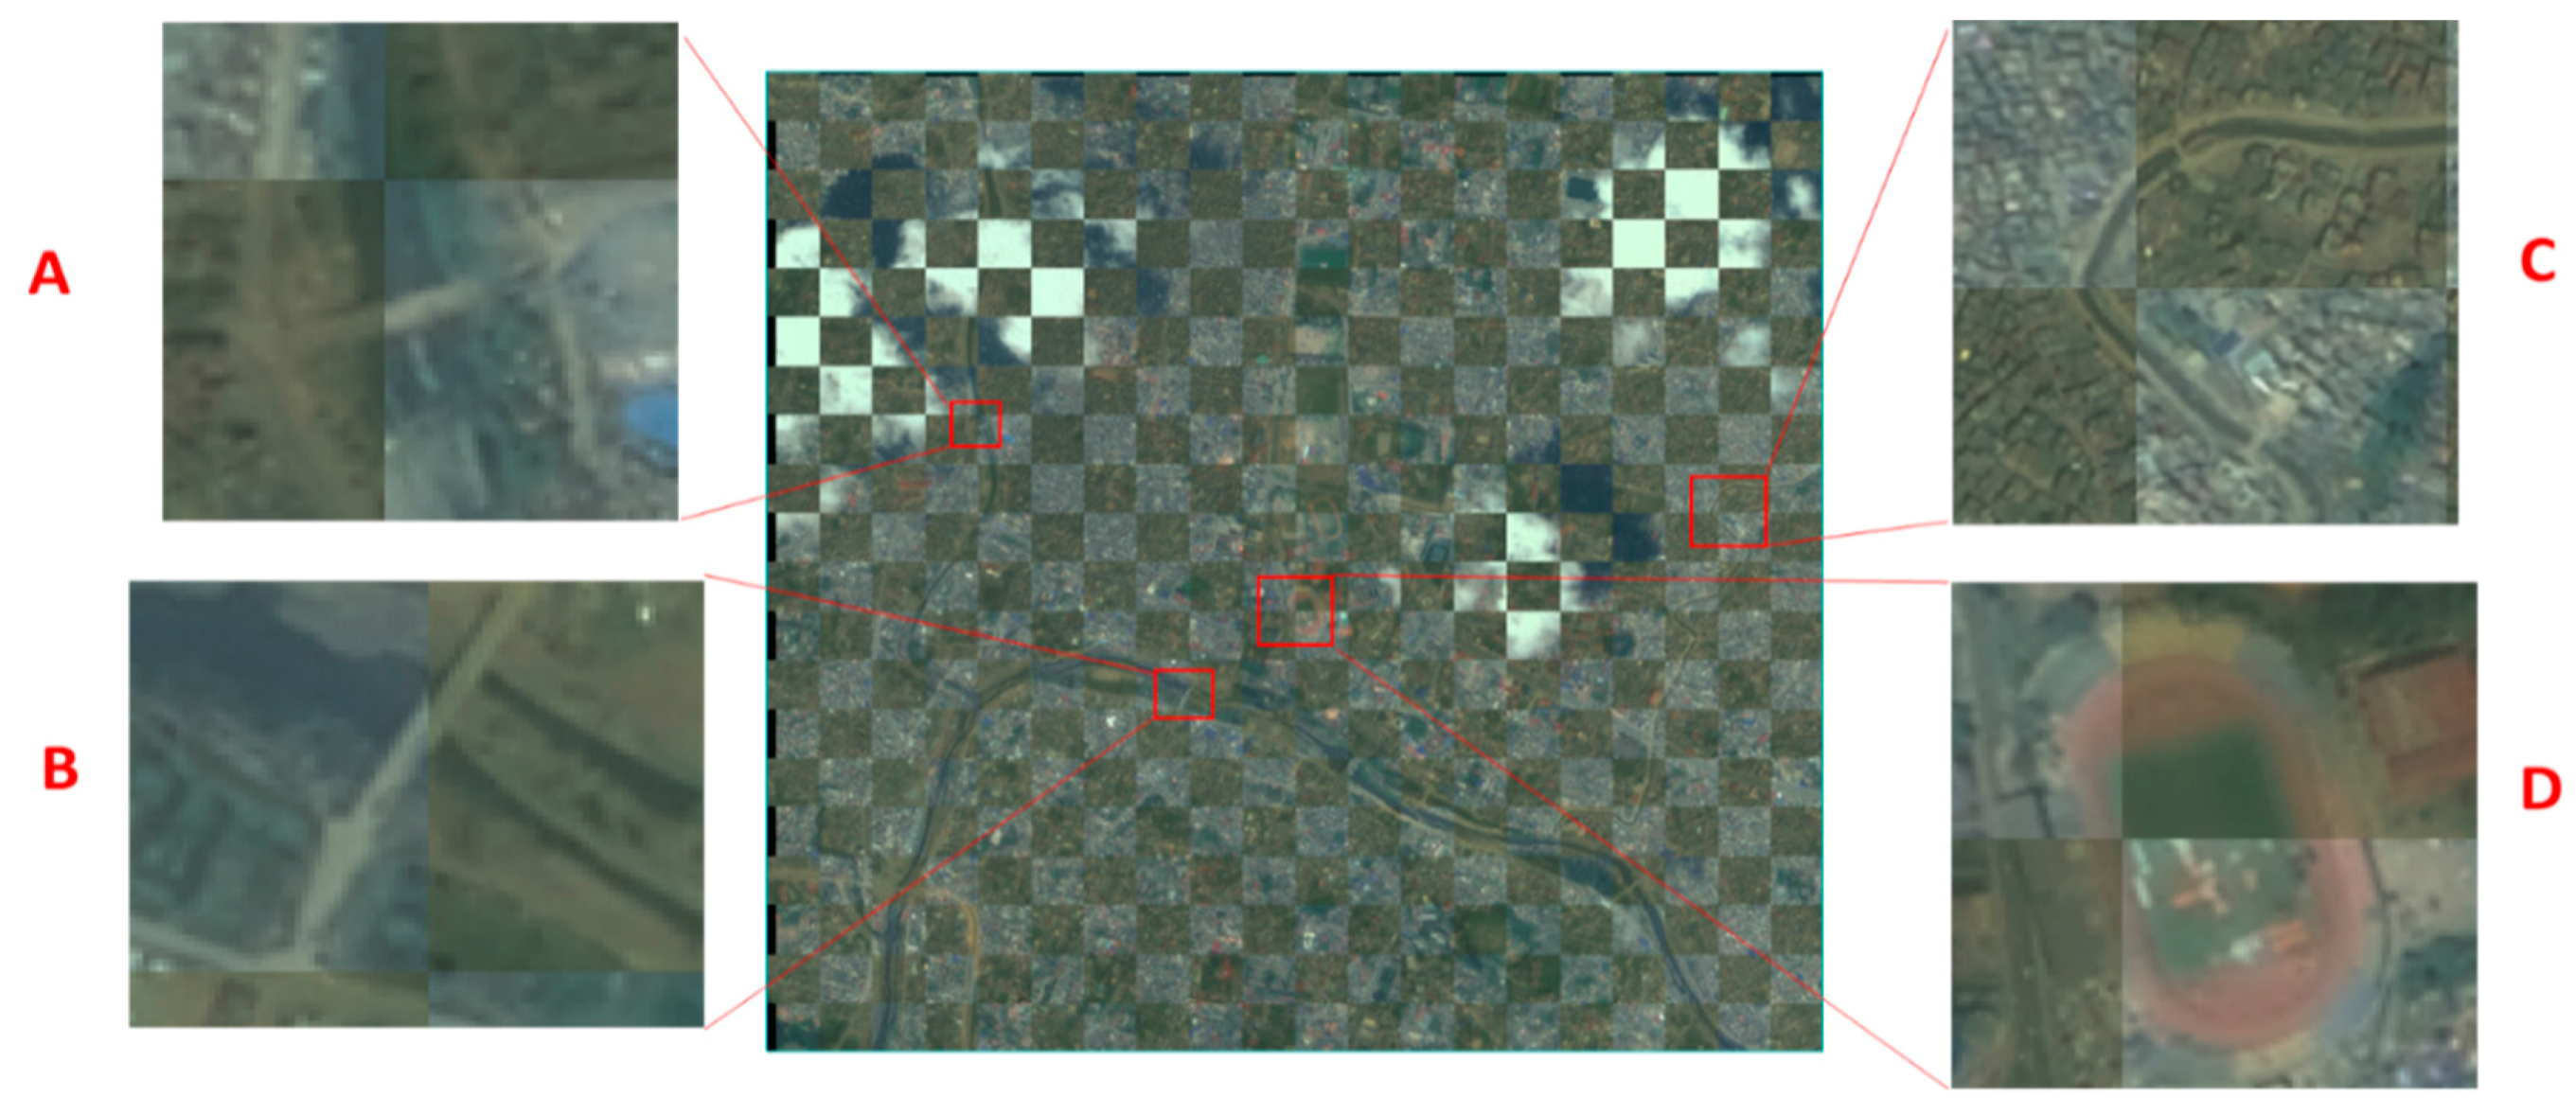
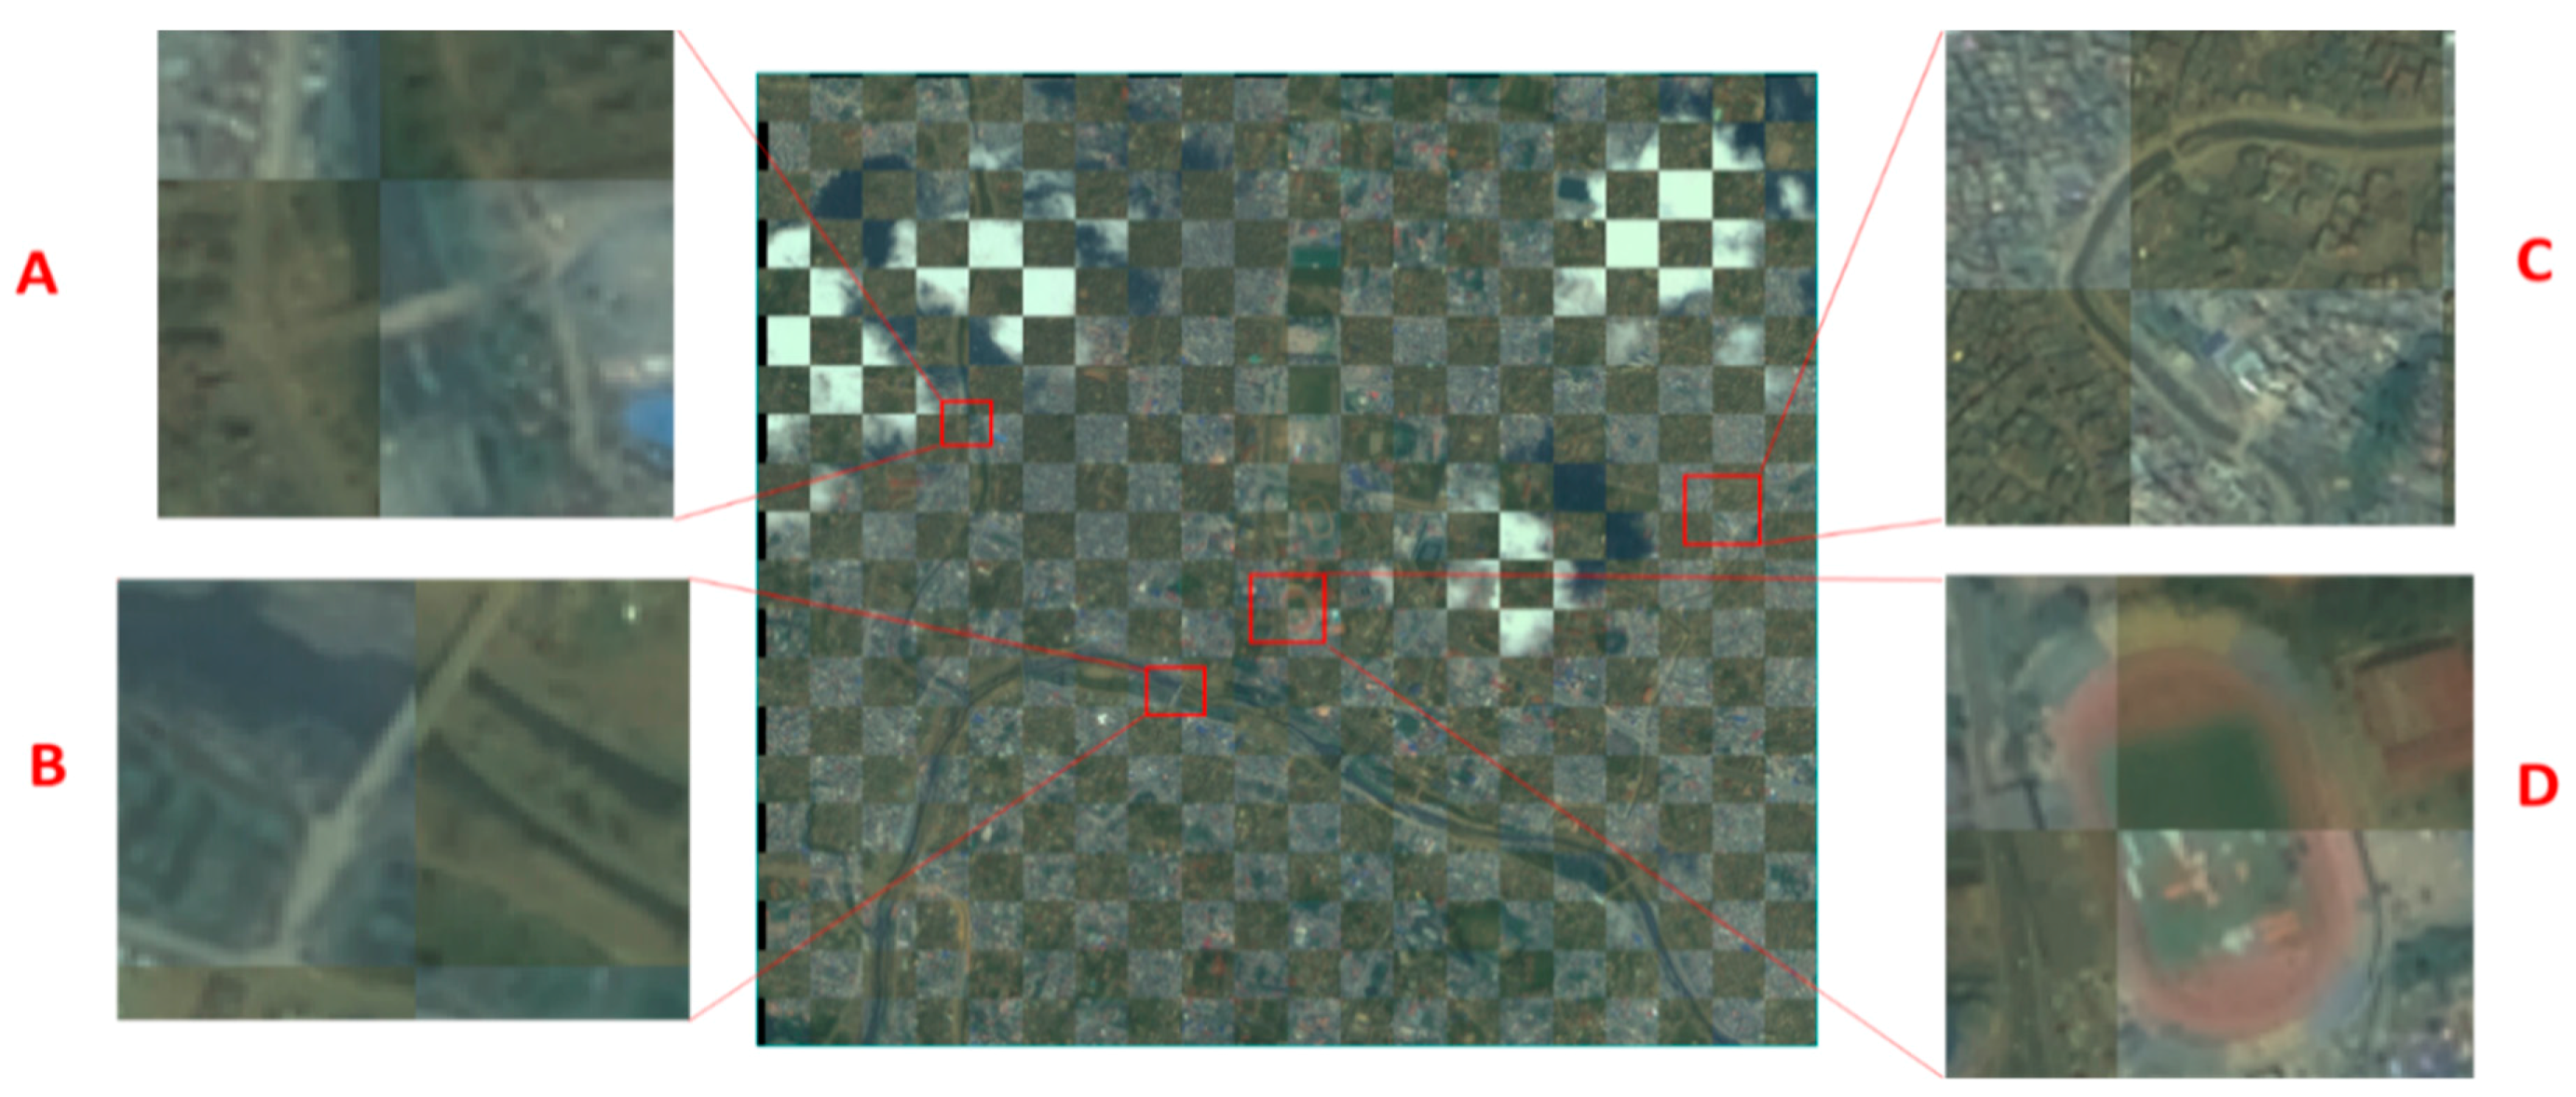
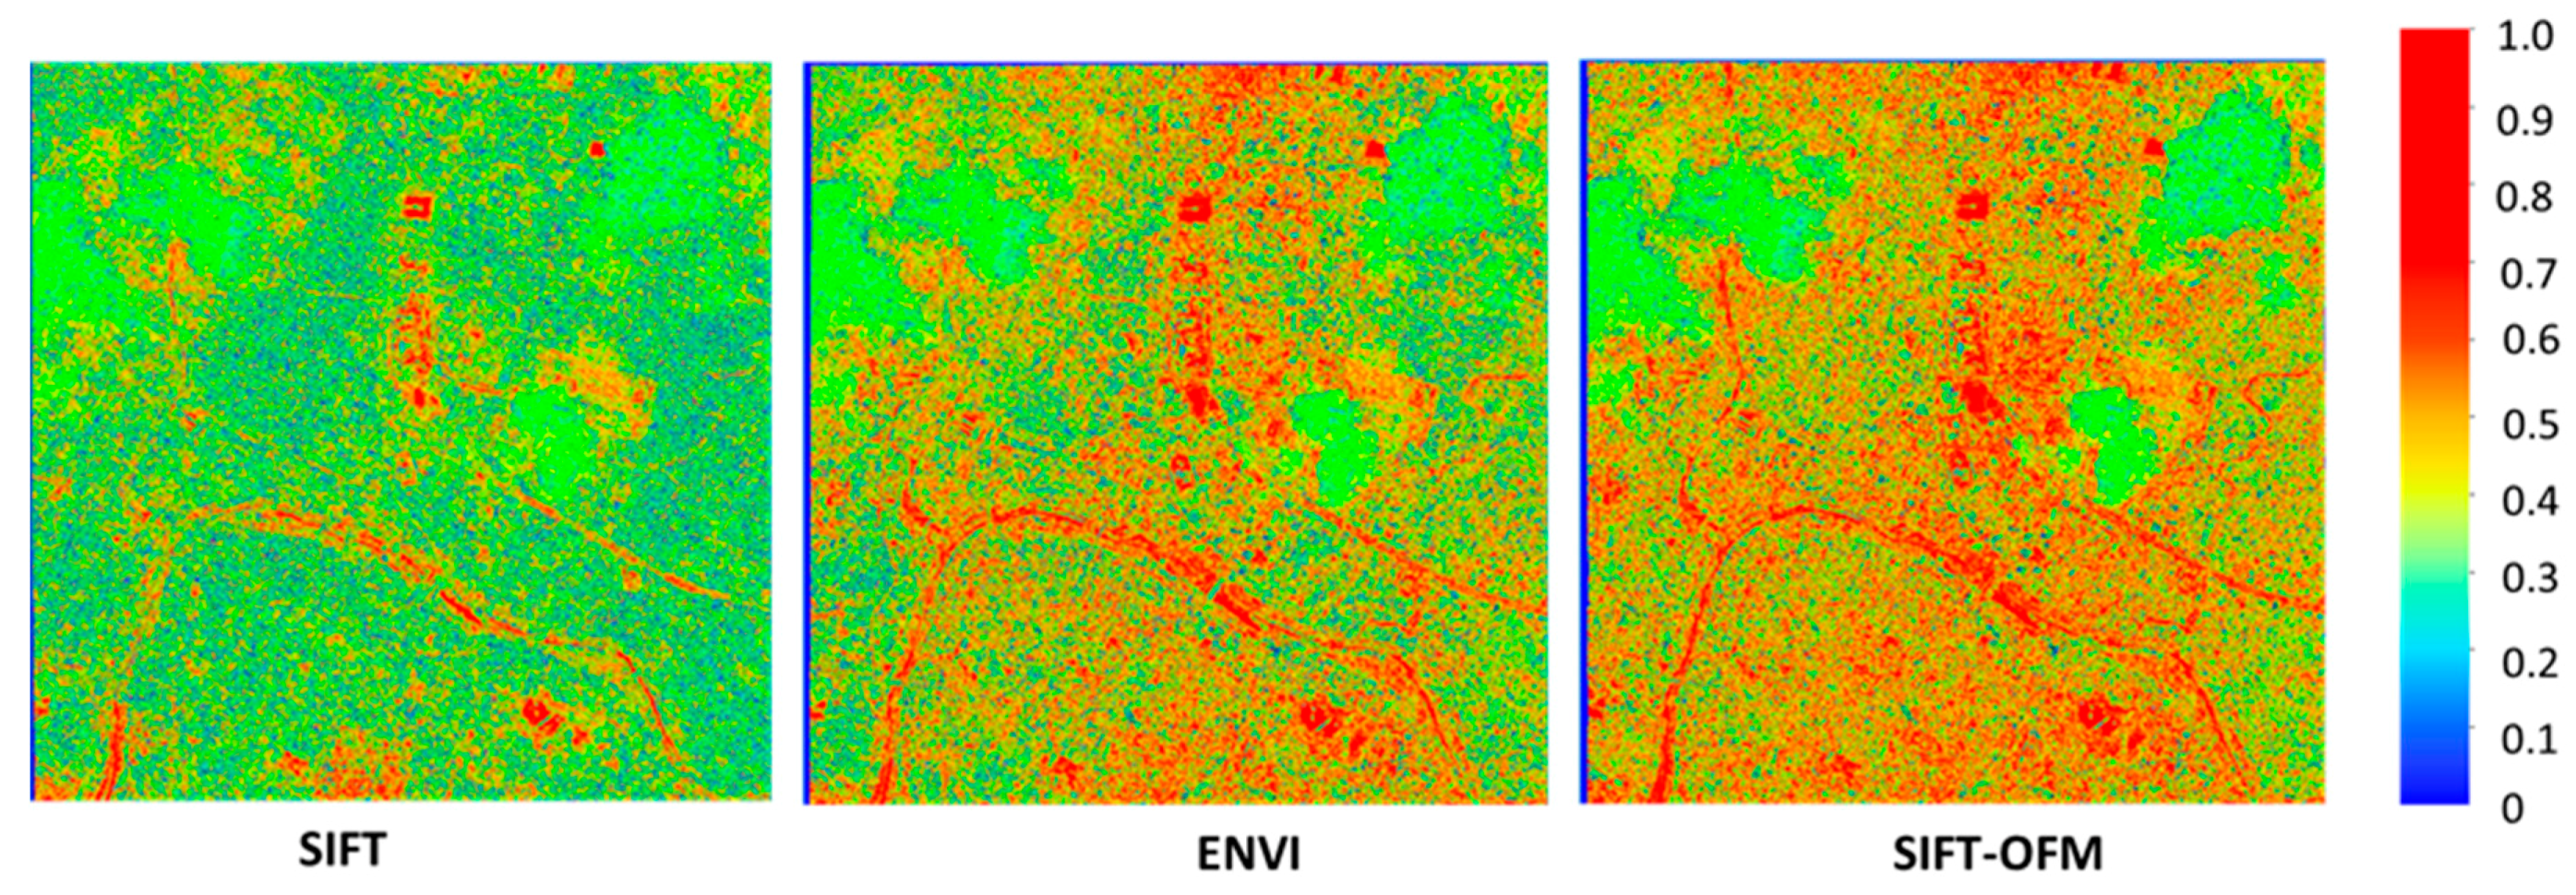
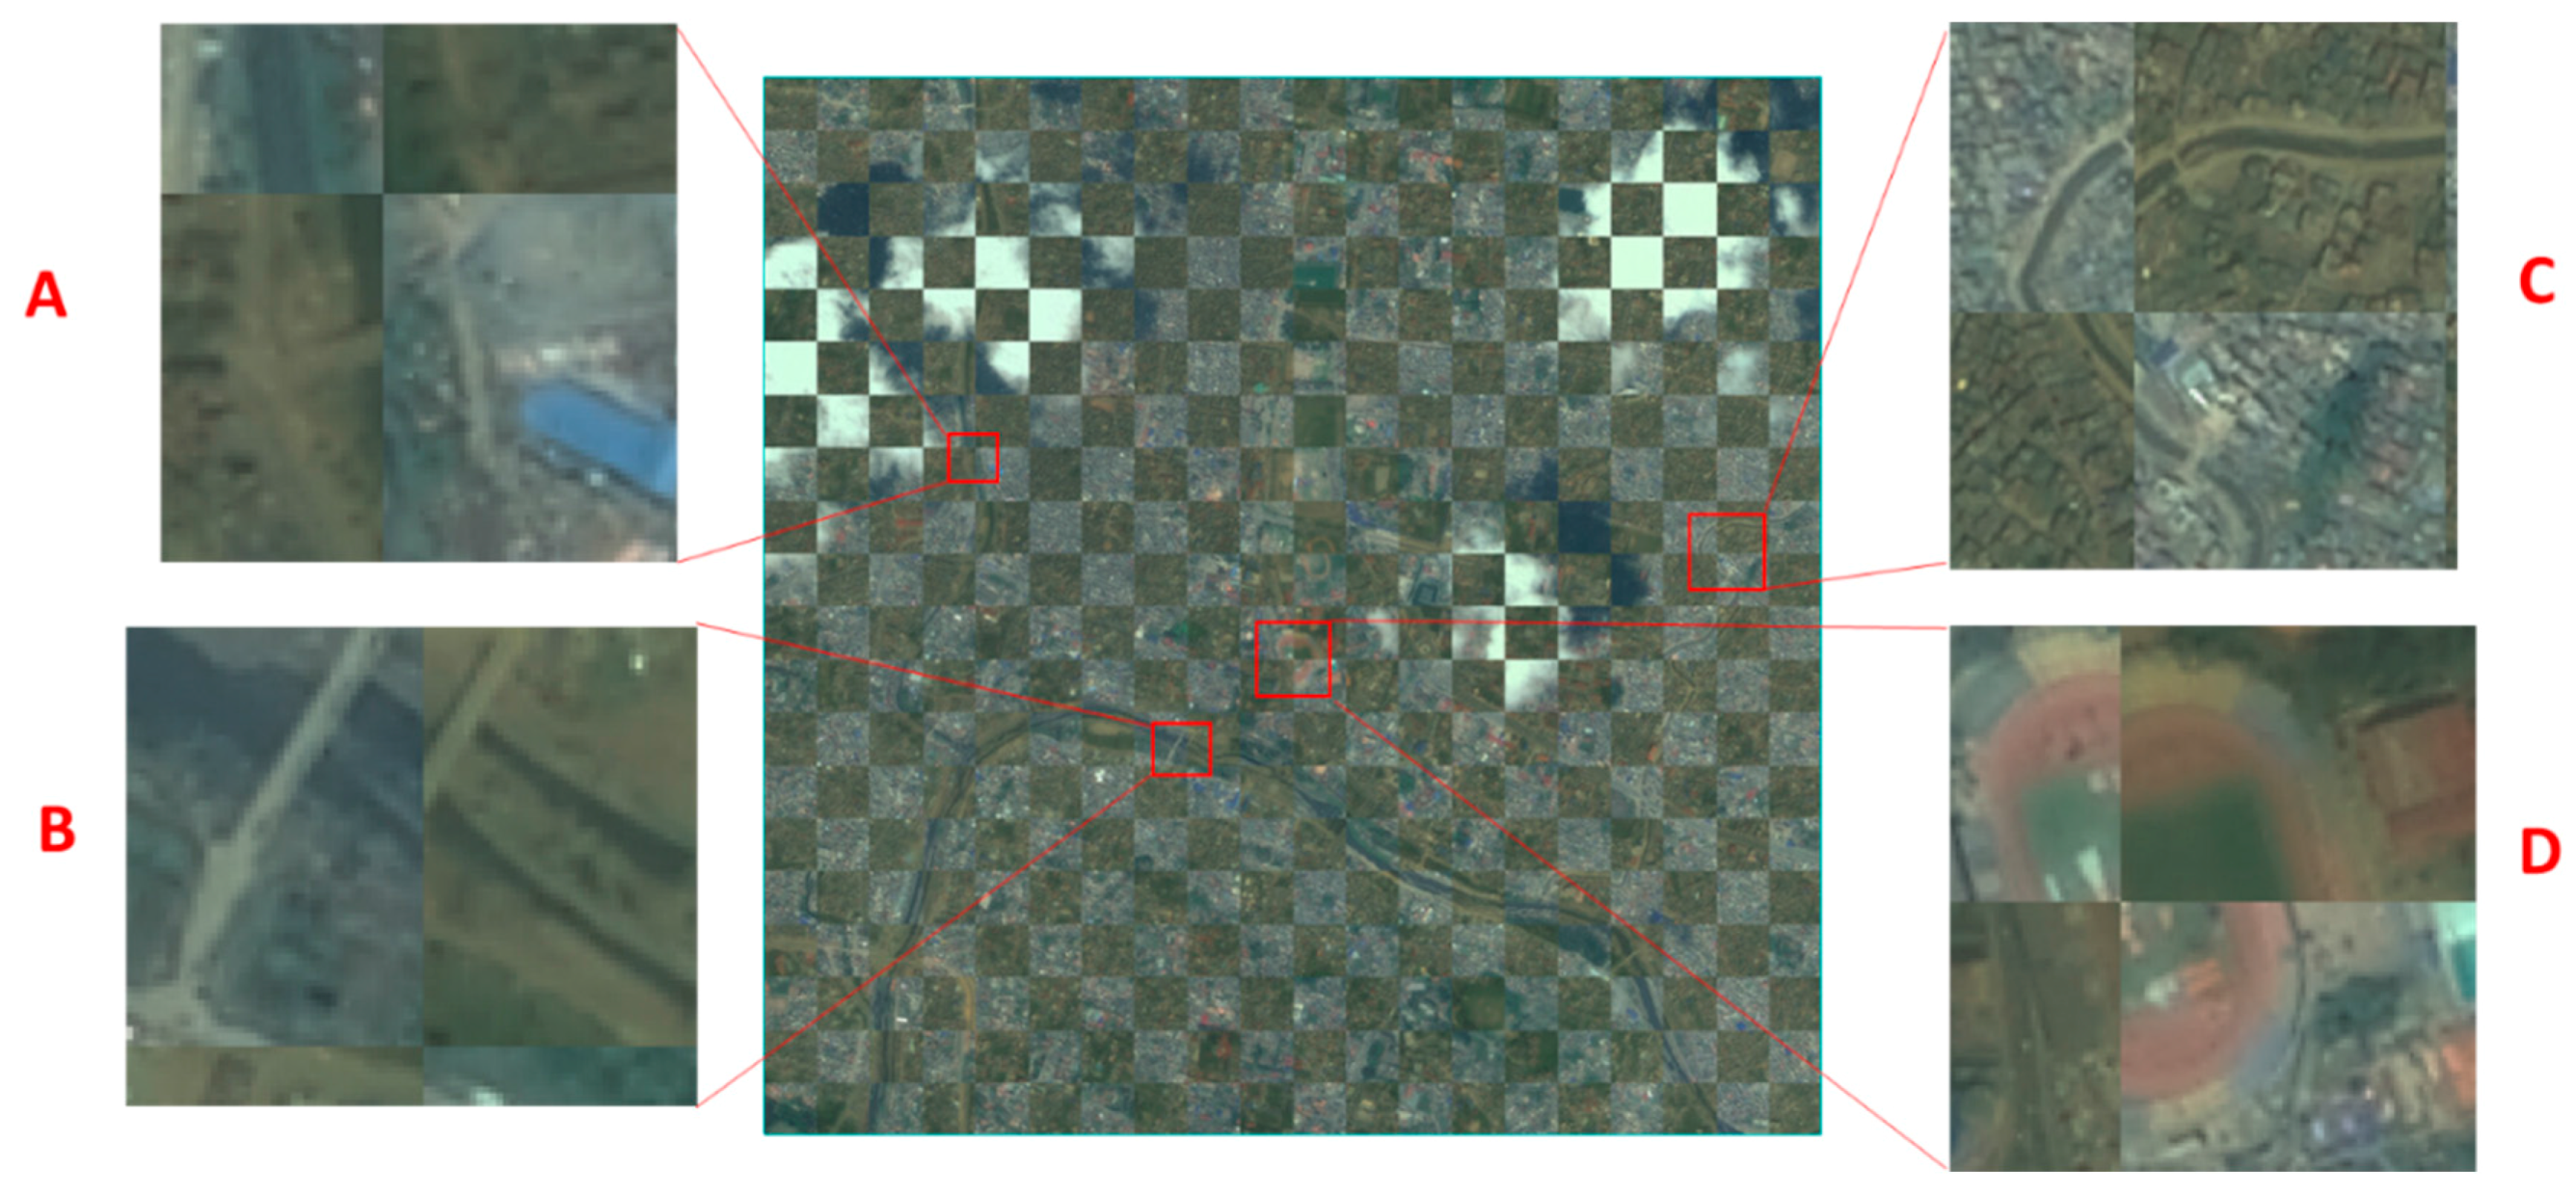
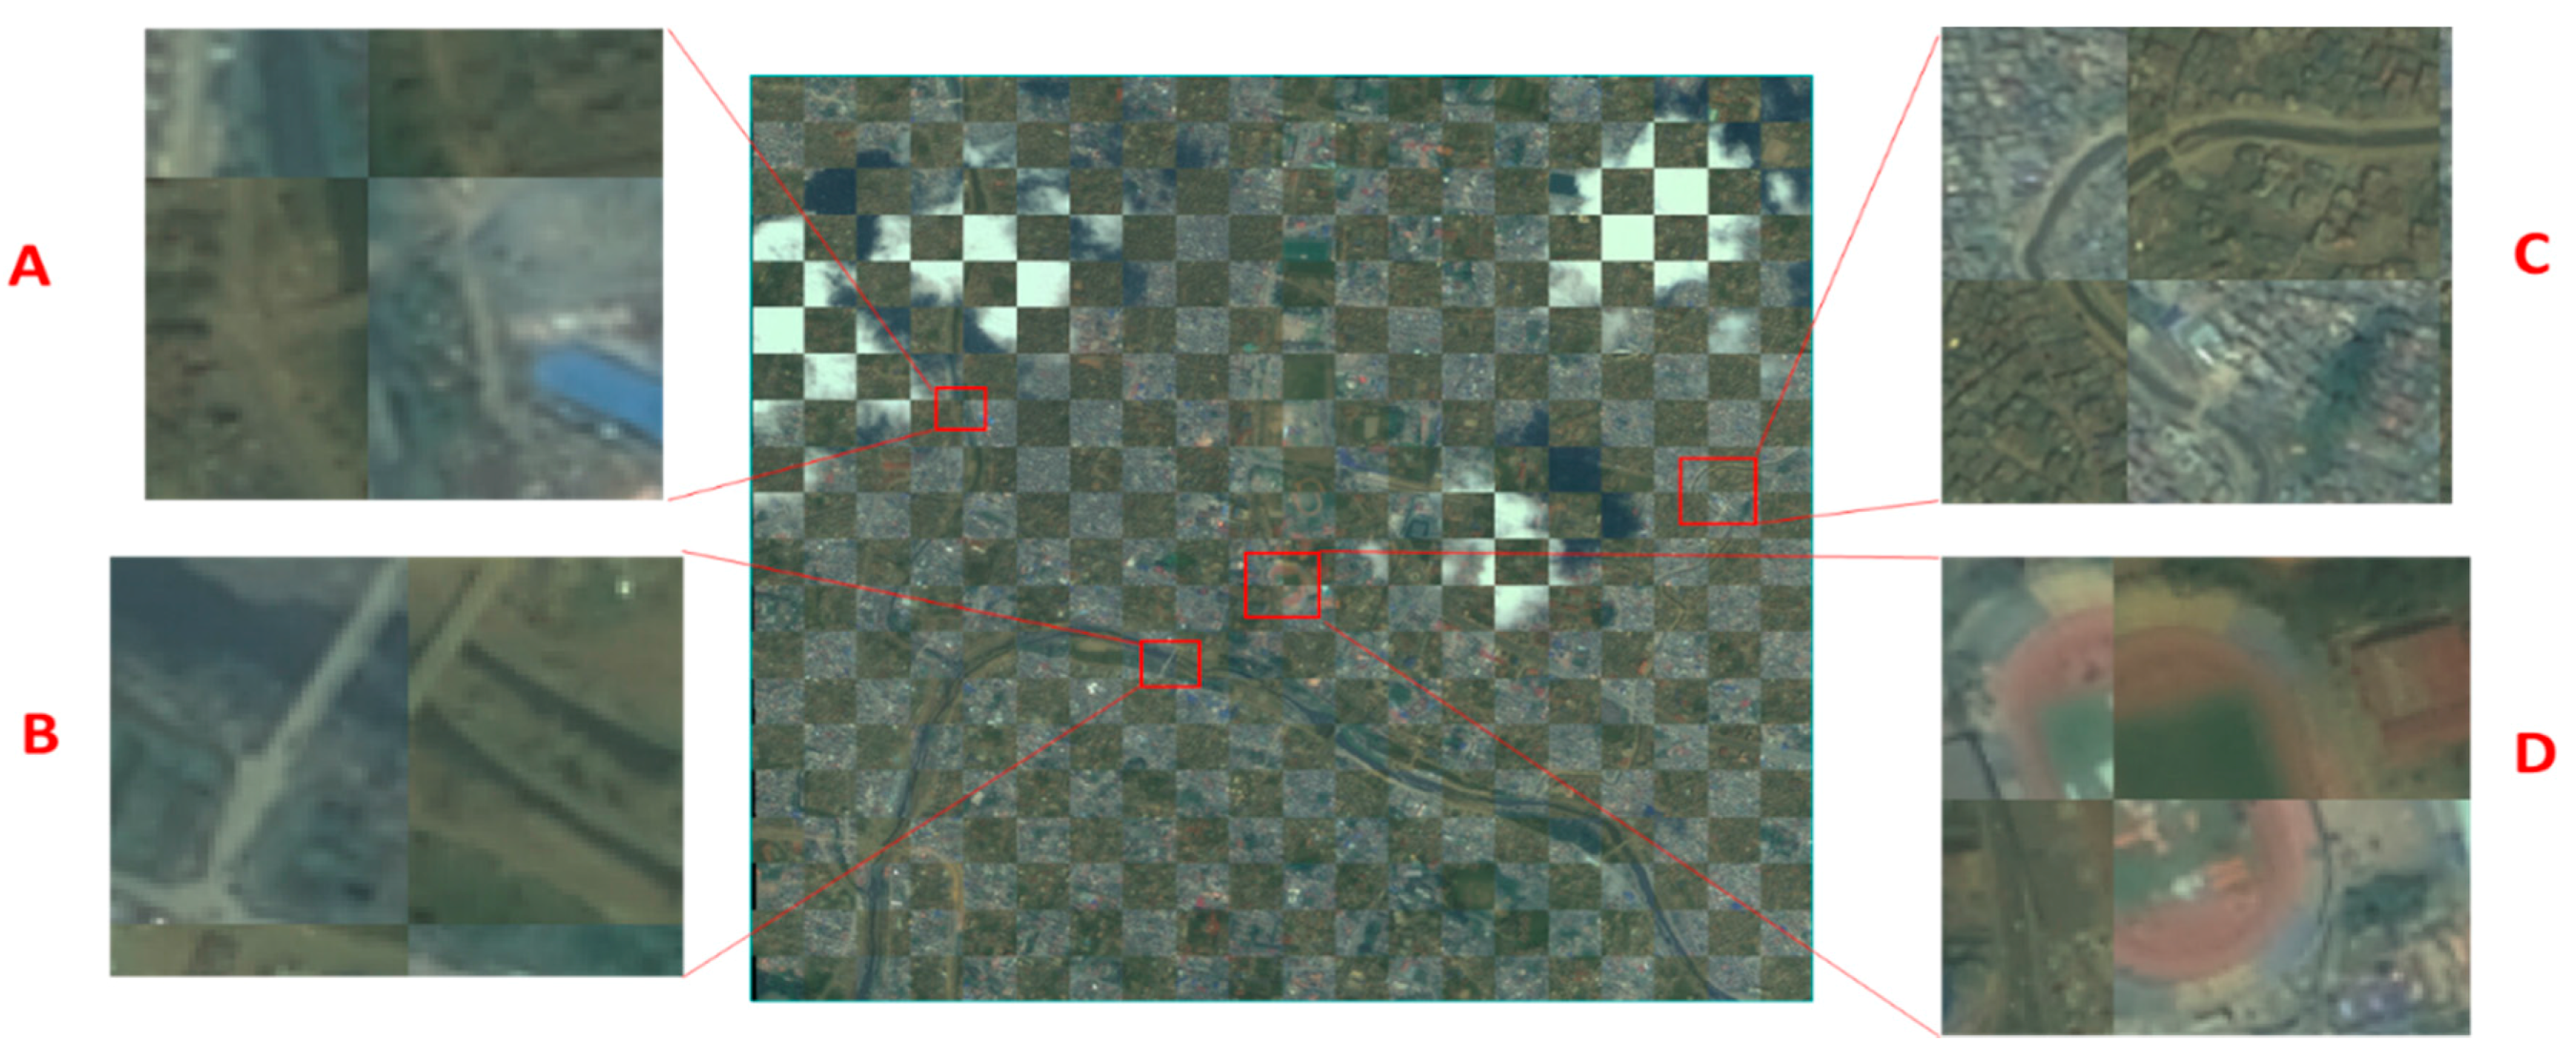
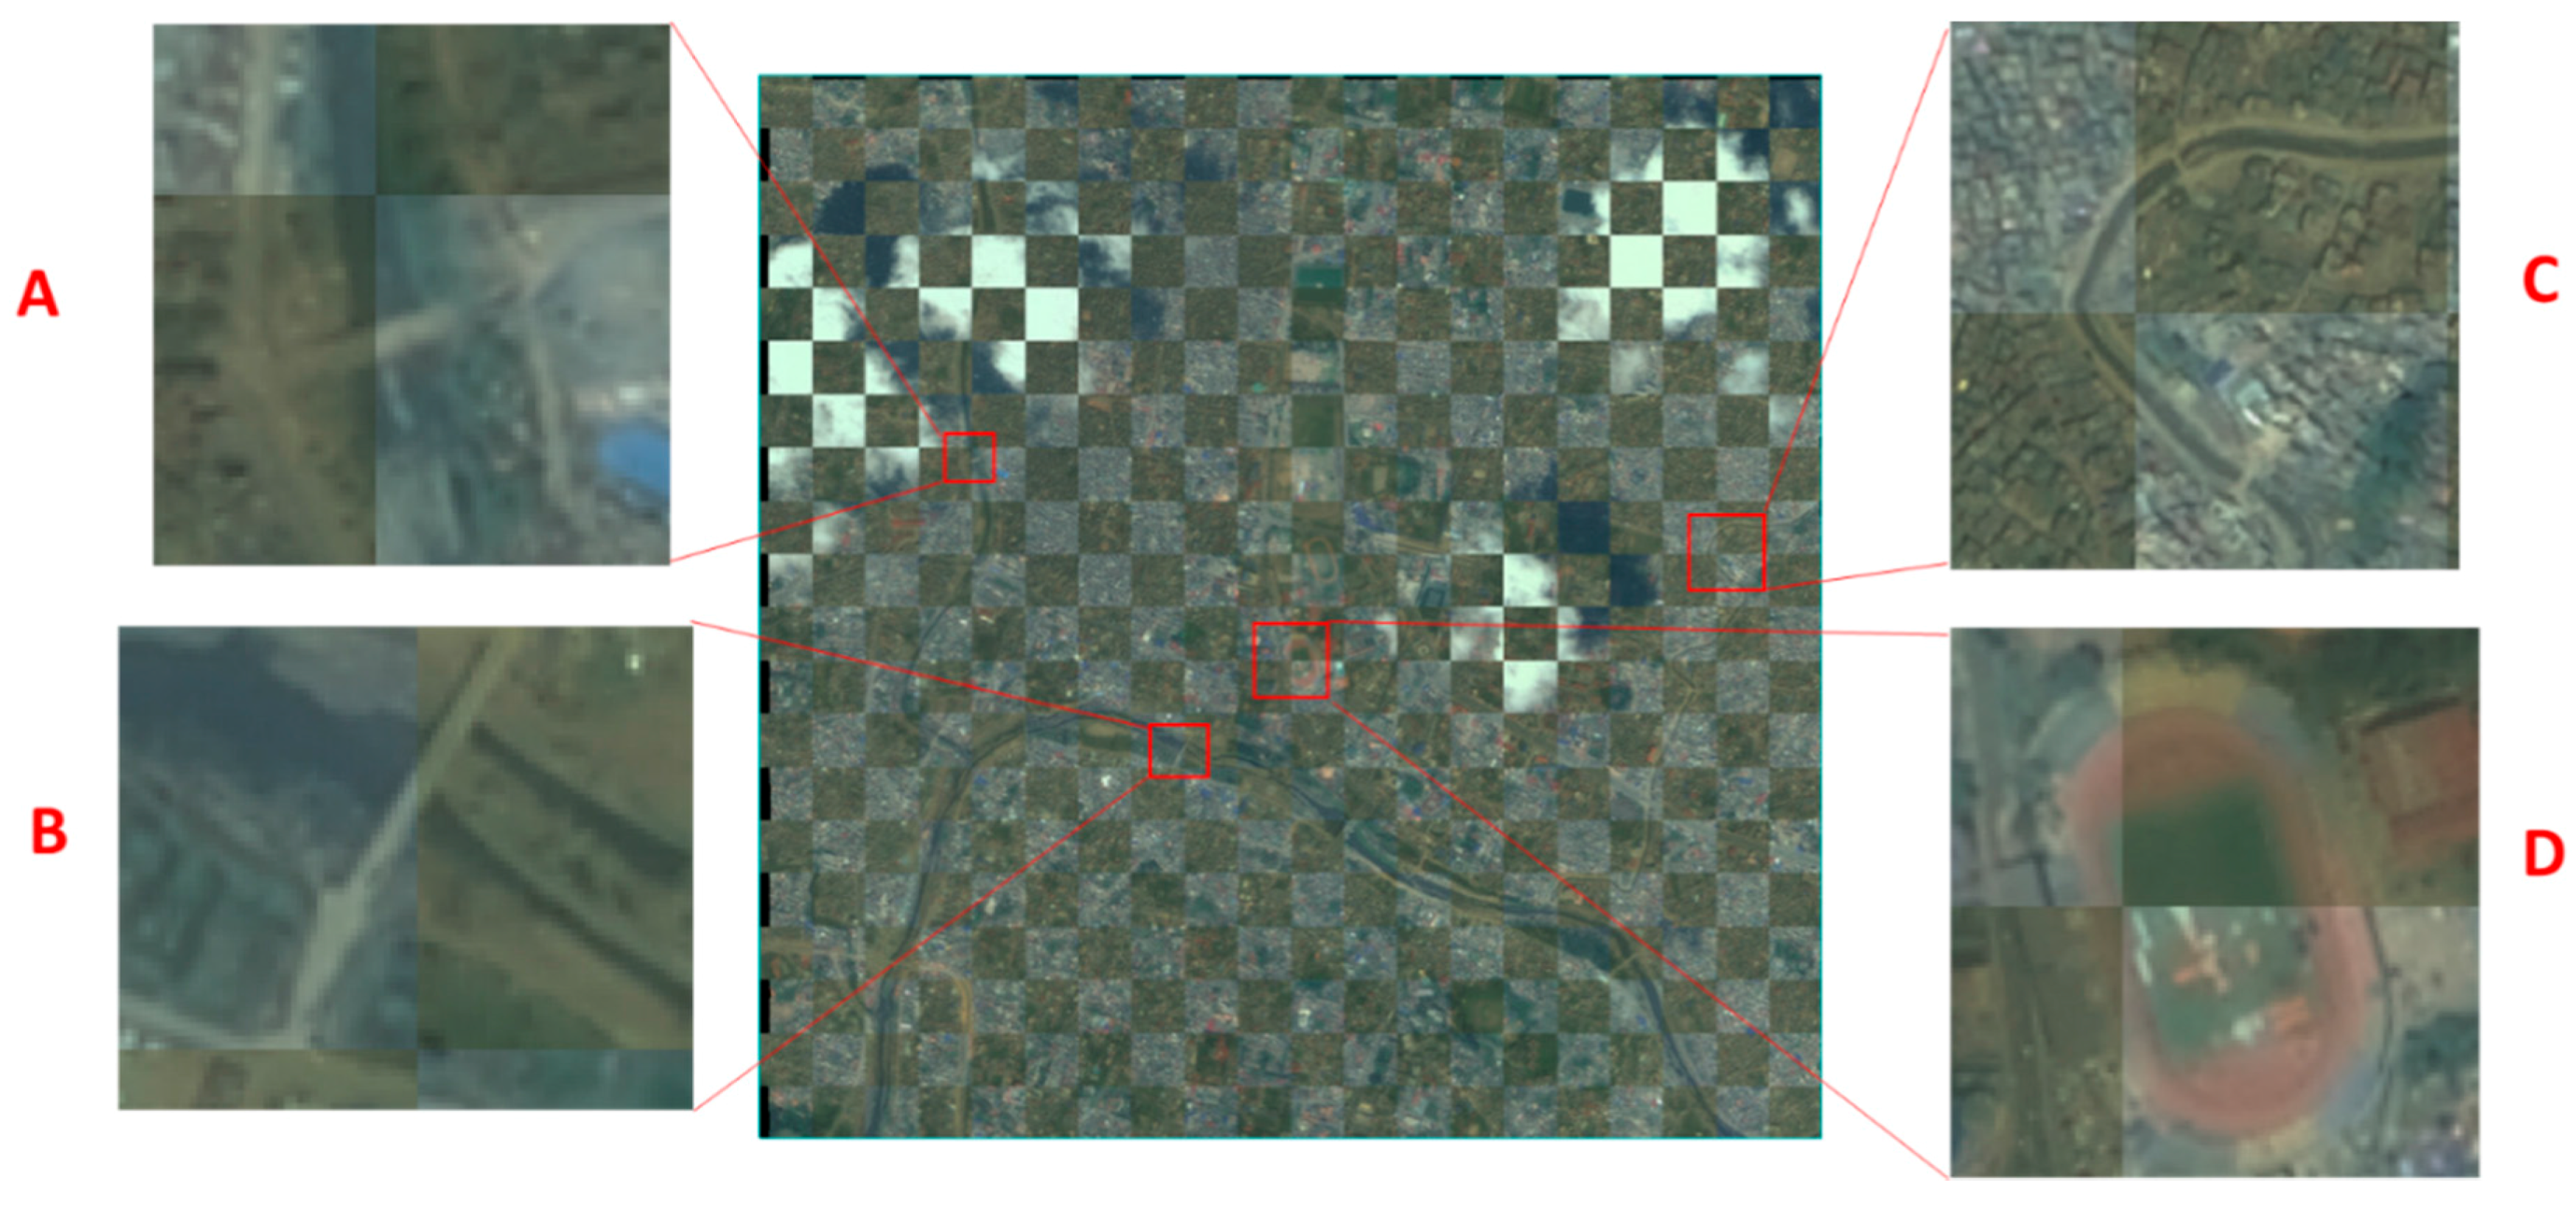
3.3. Image Registration Results and Analysis
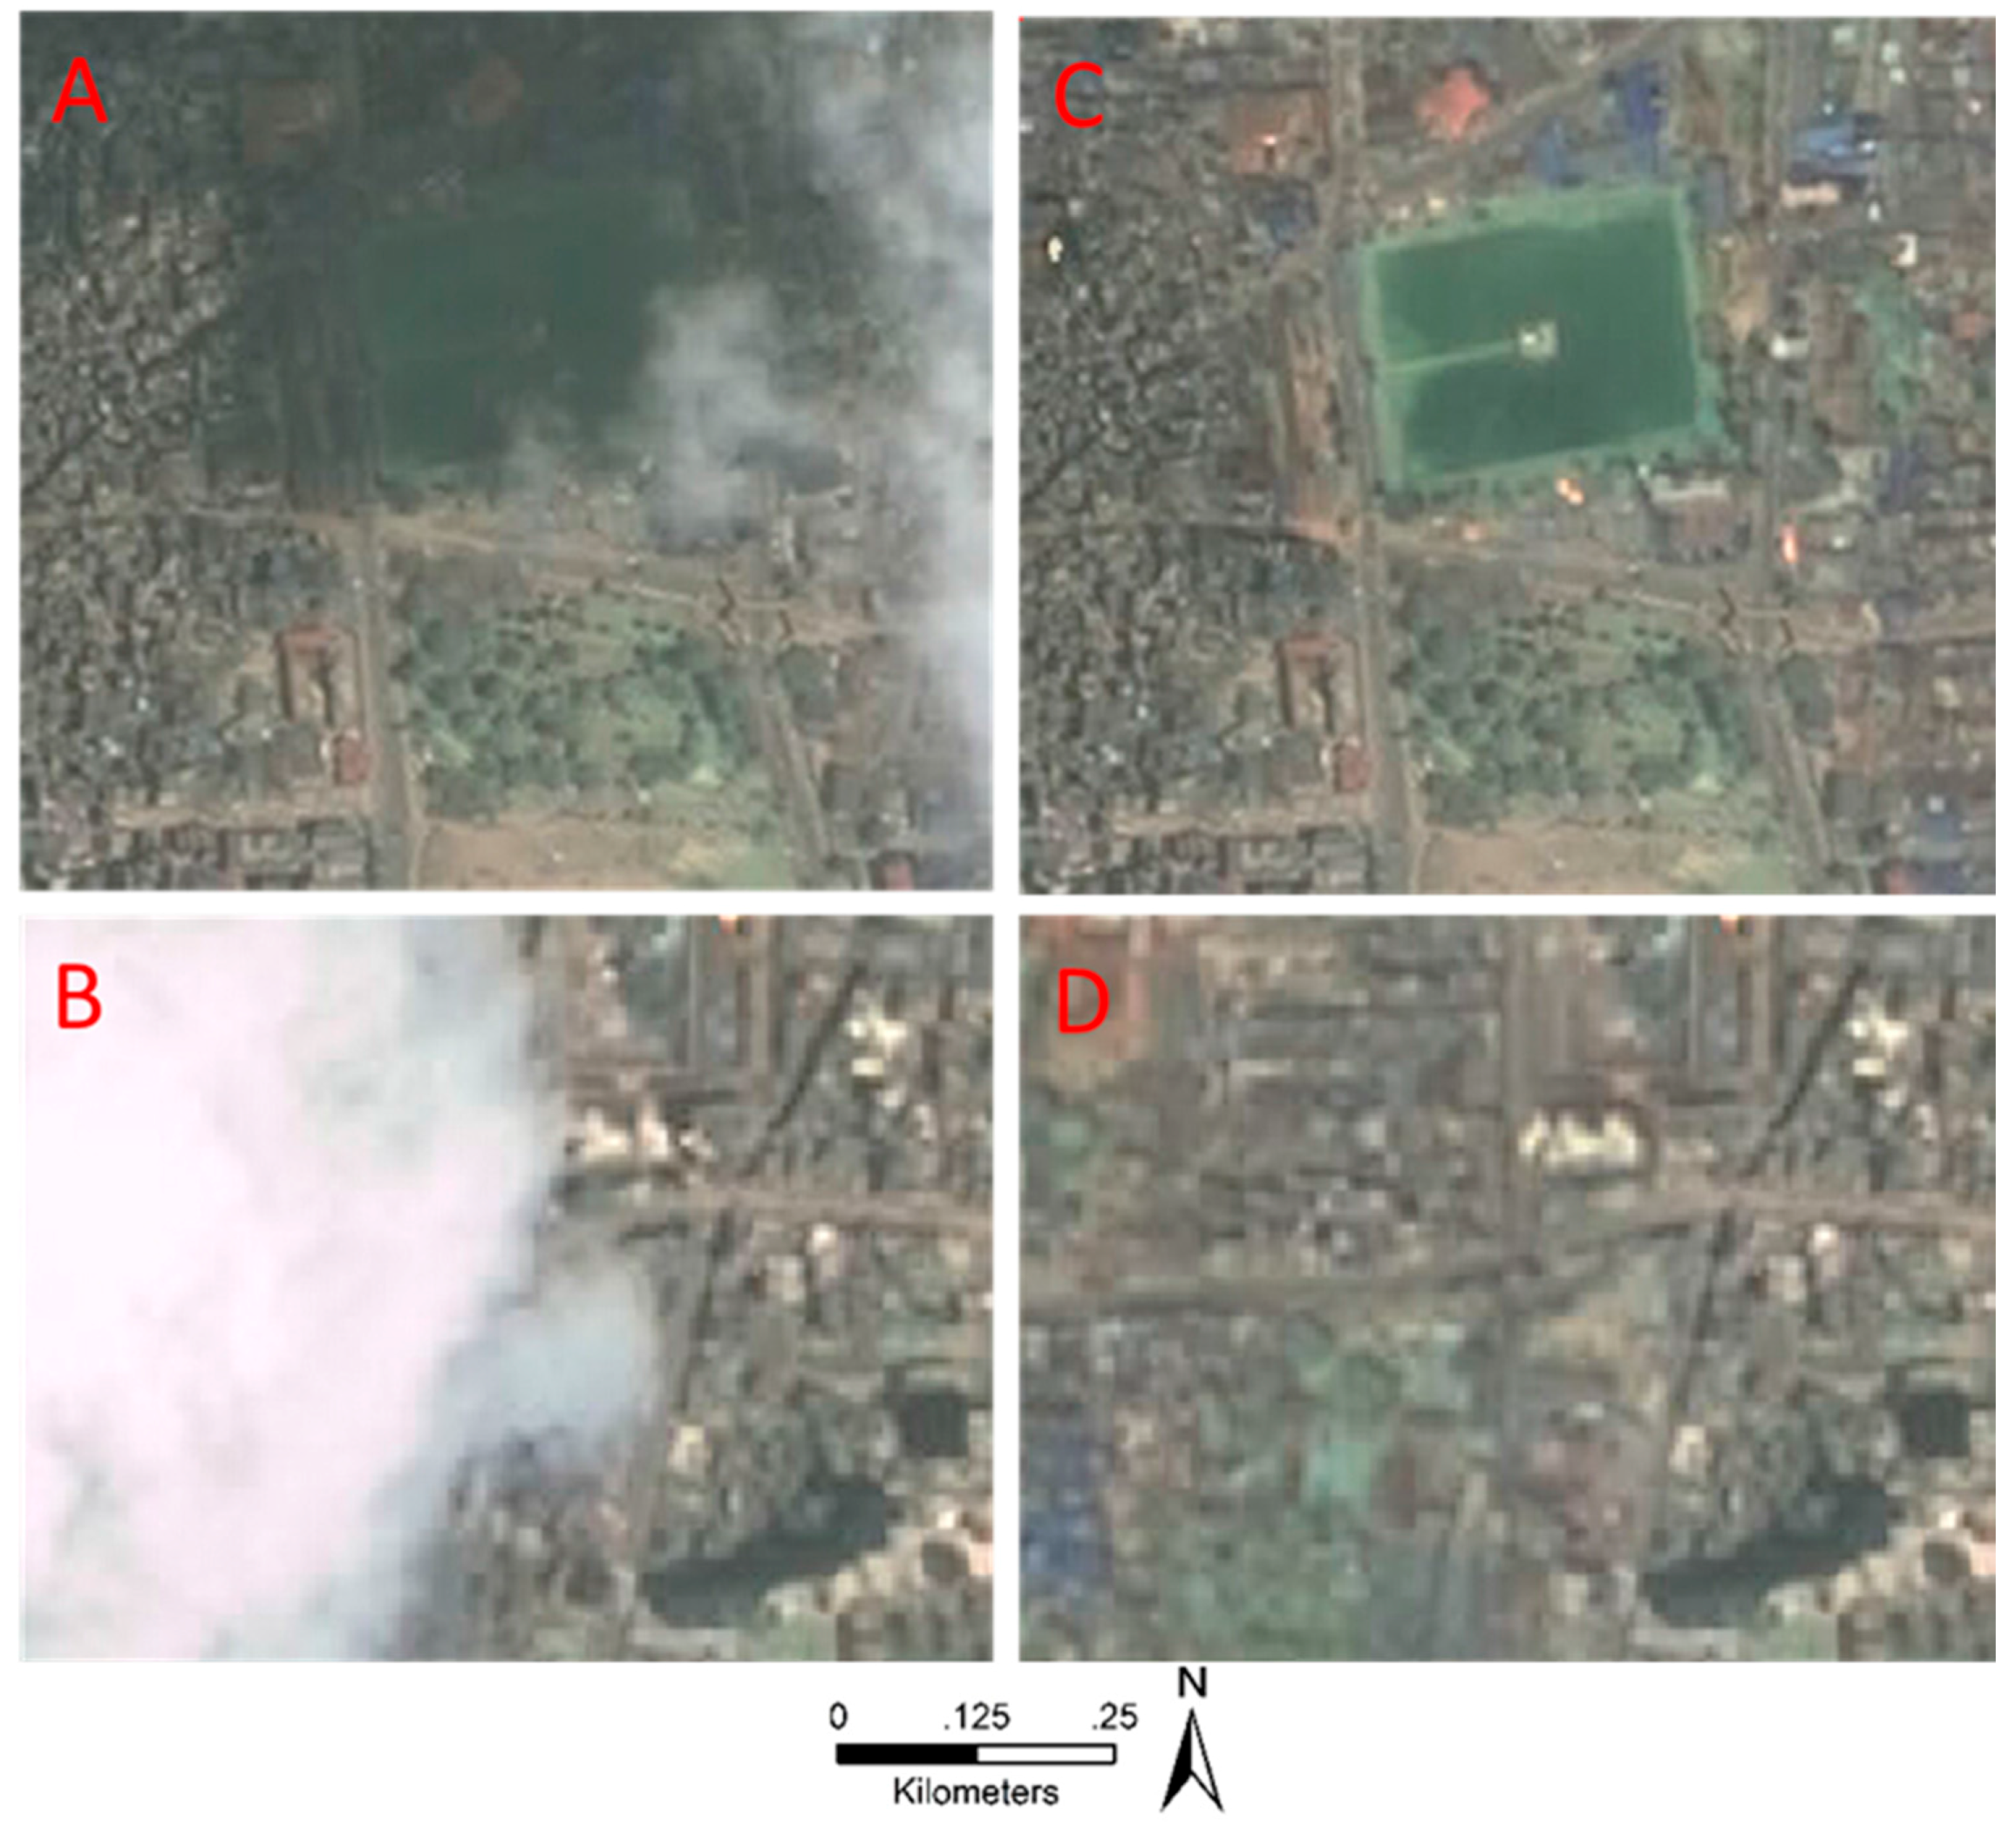
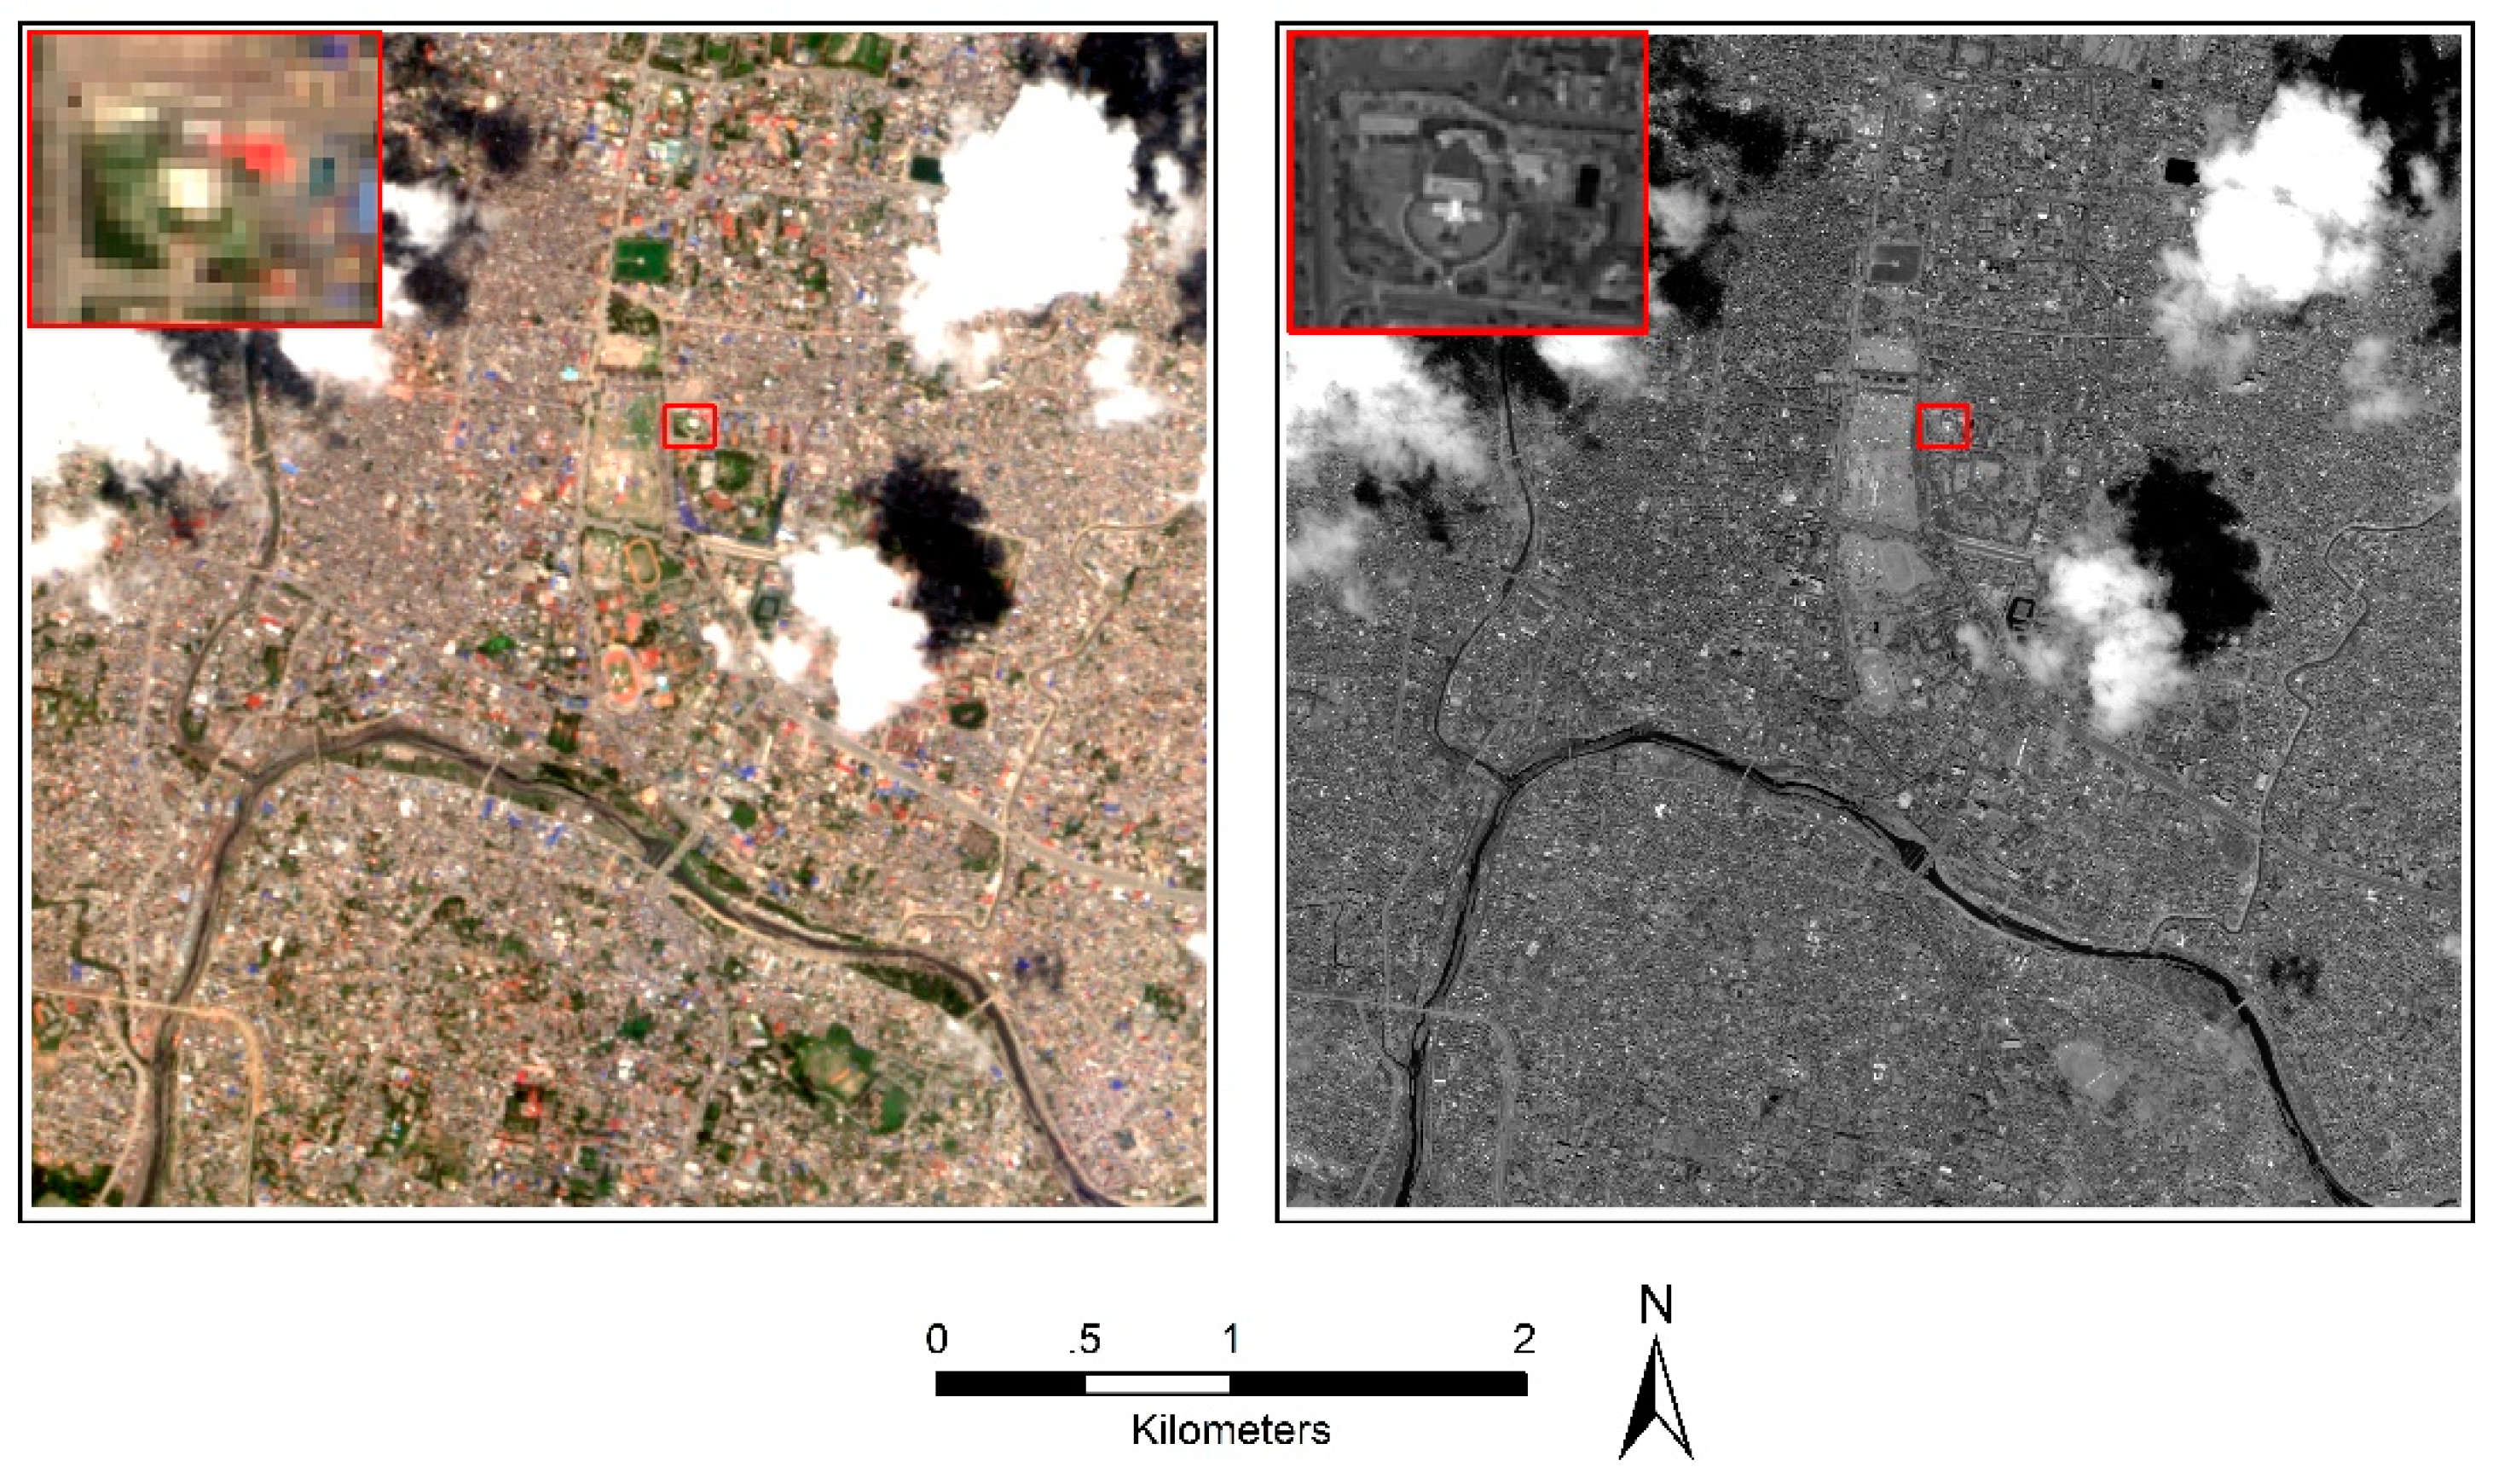
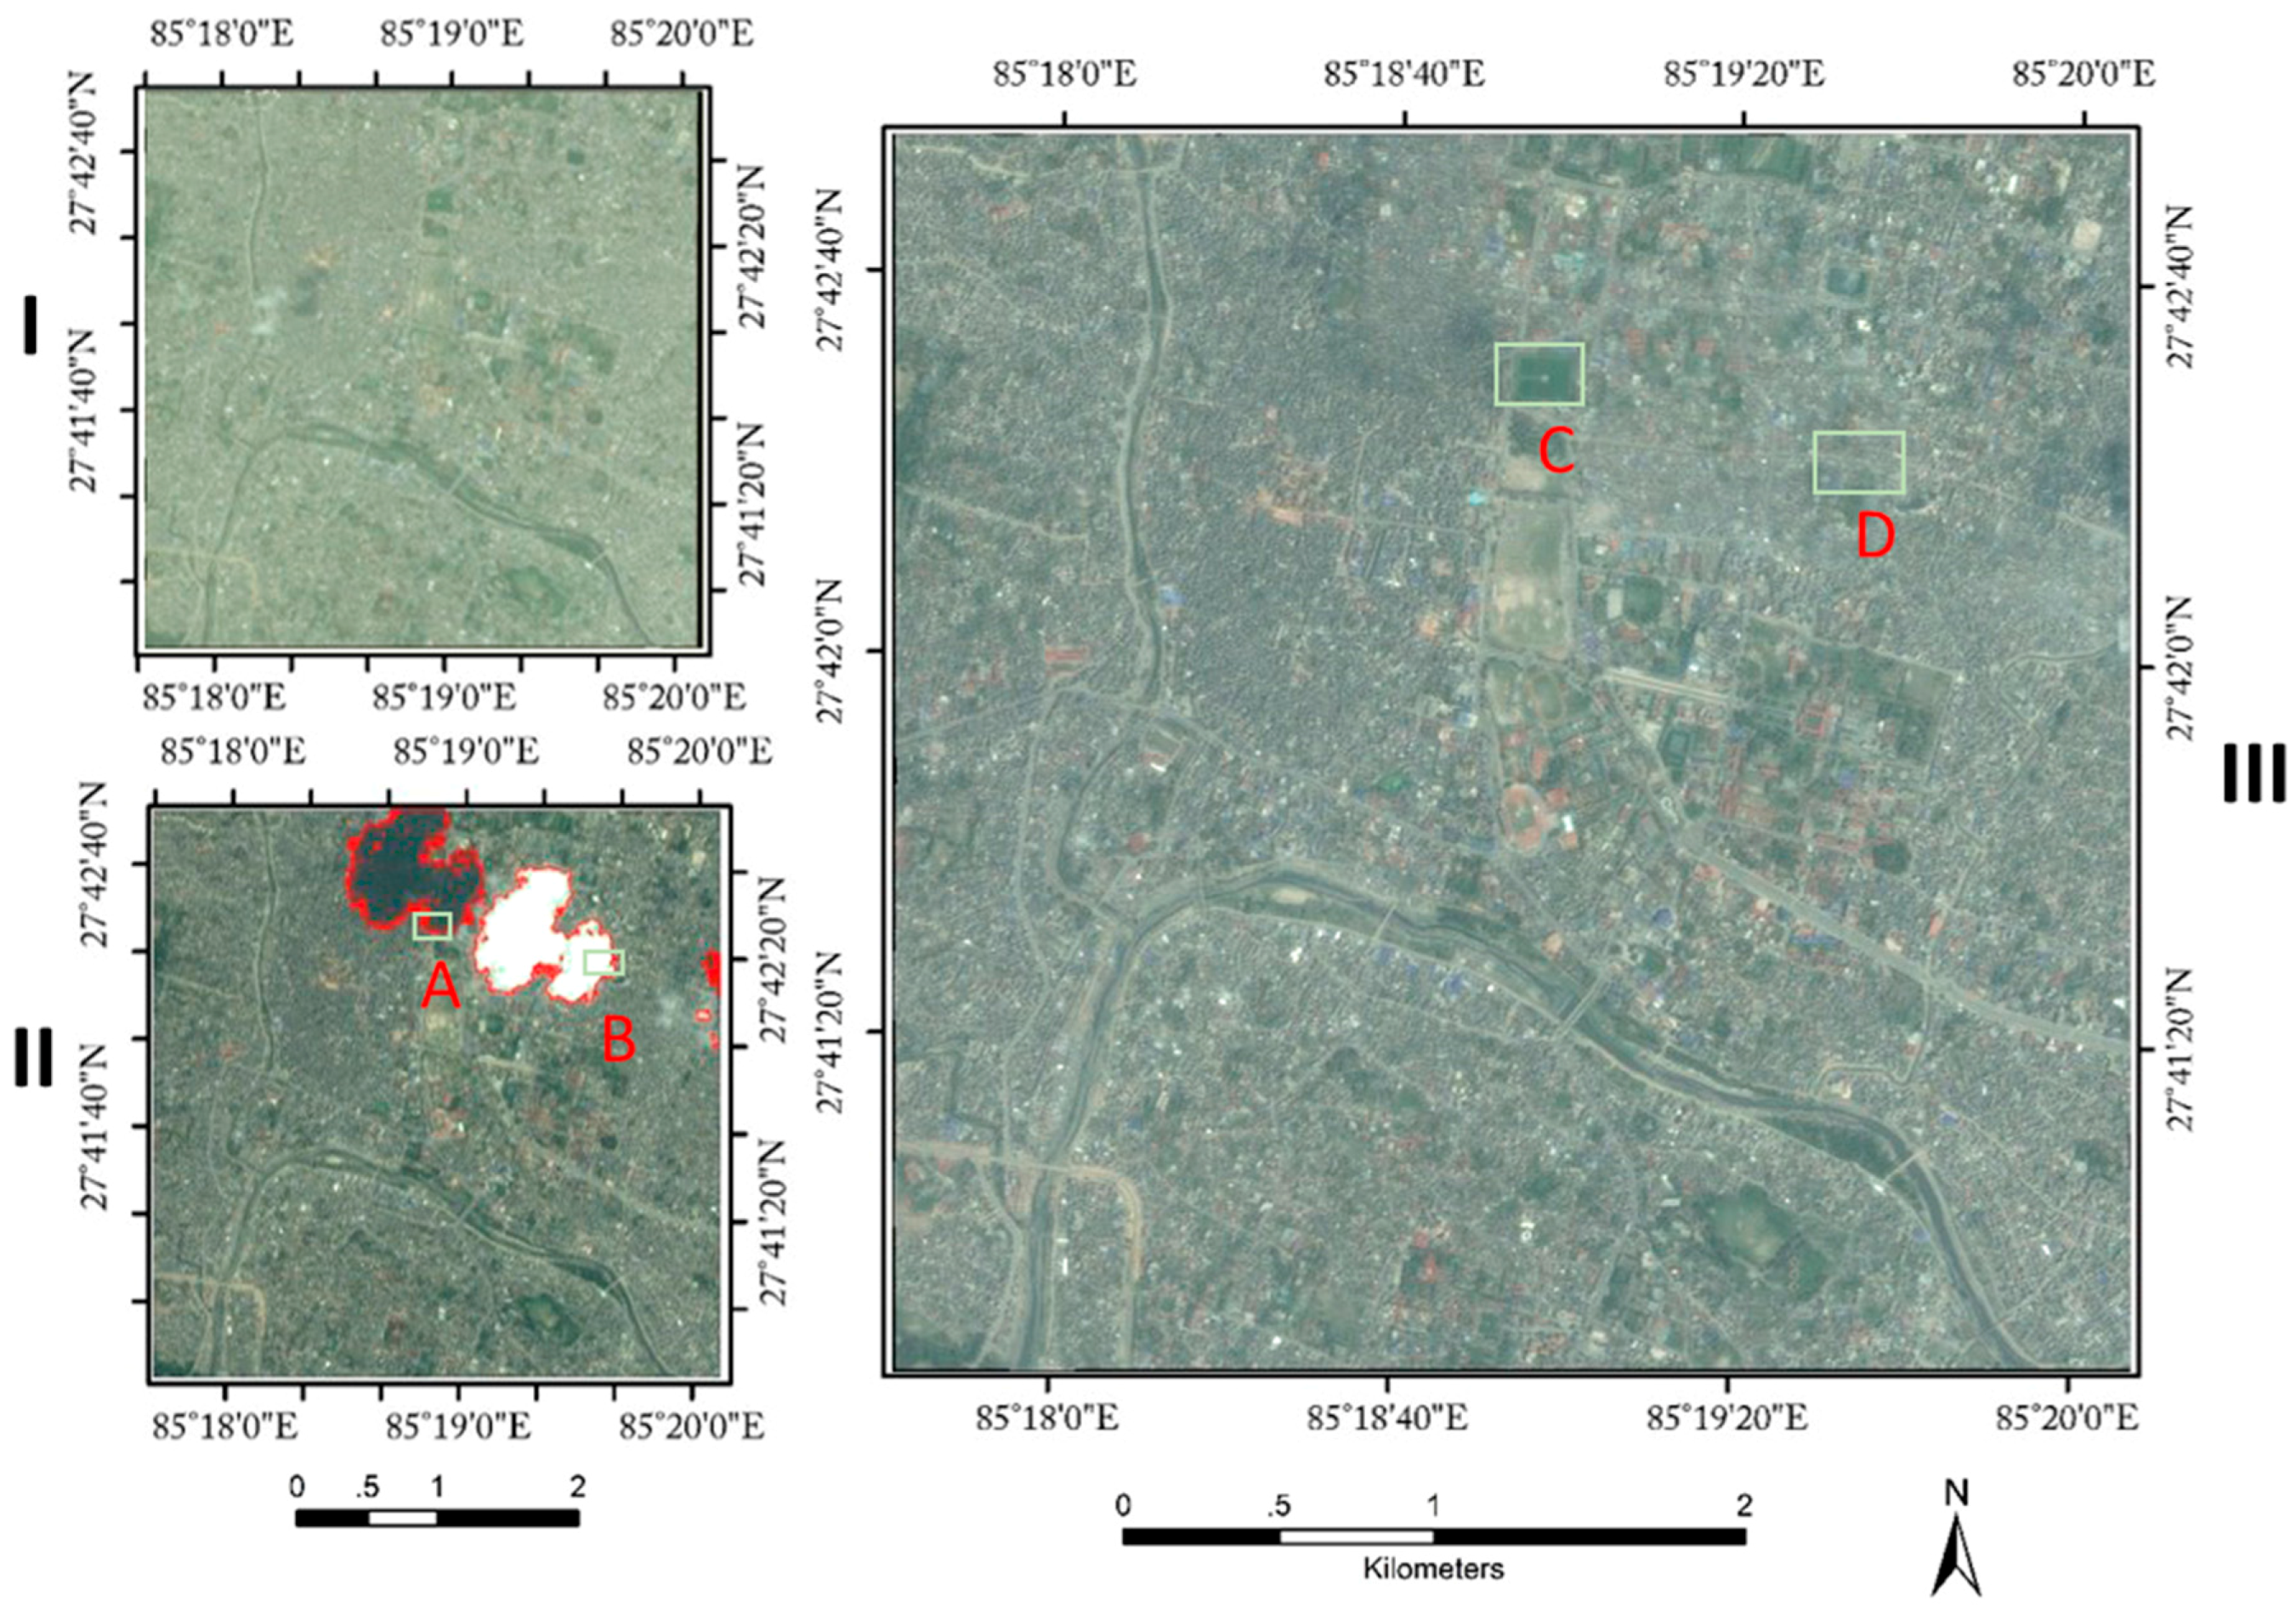
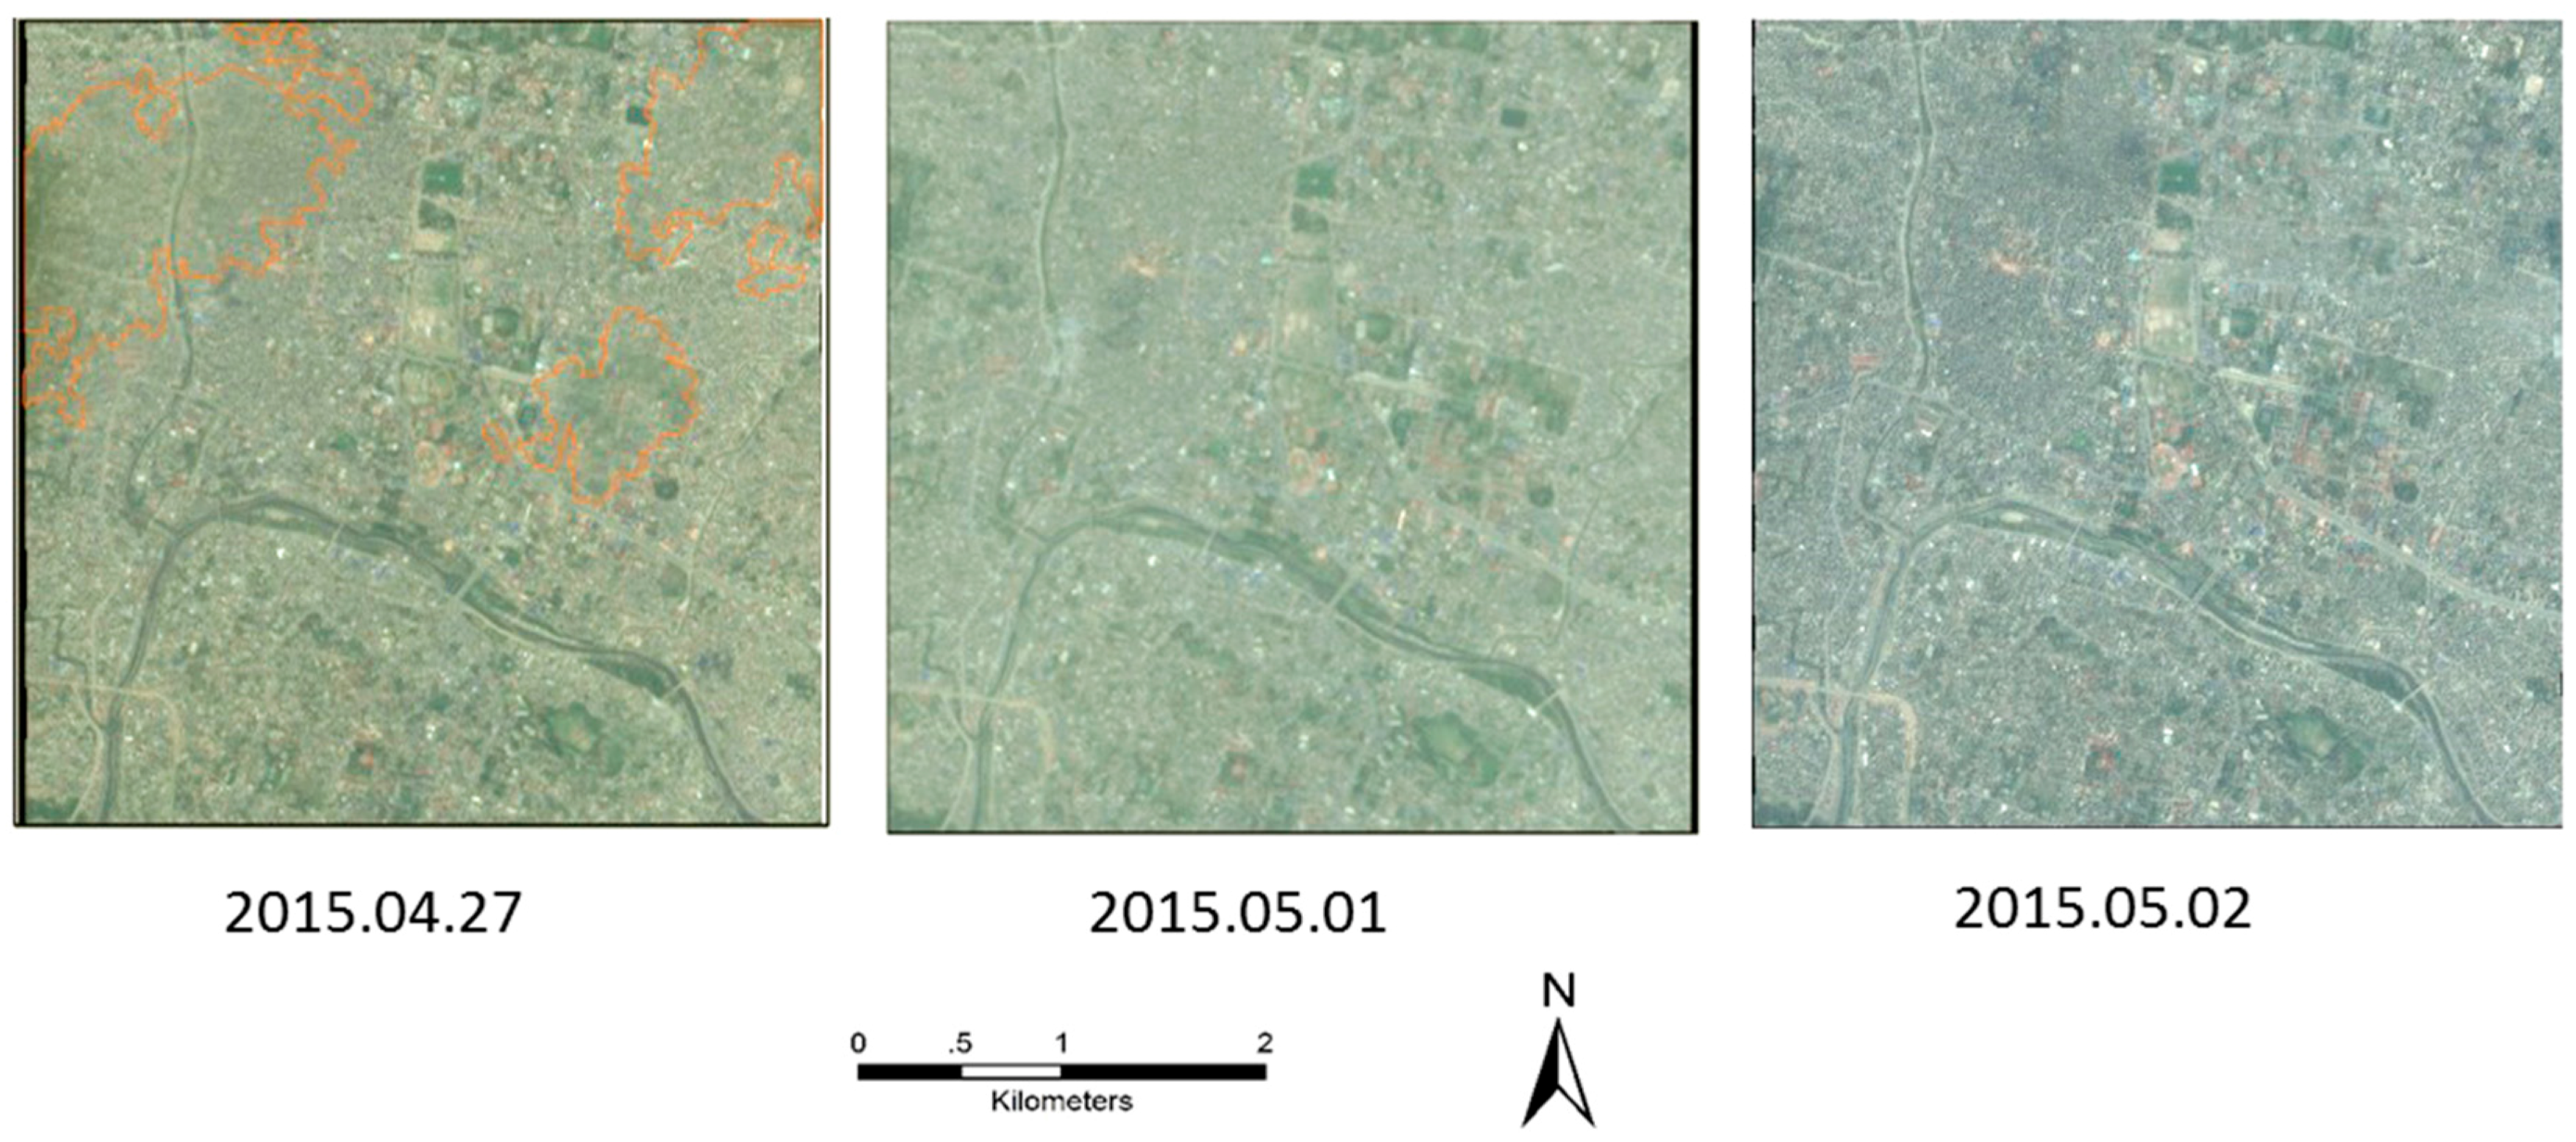
3.4. Cloudless Product and Analysis
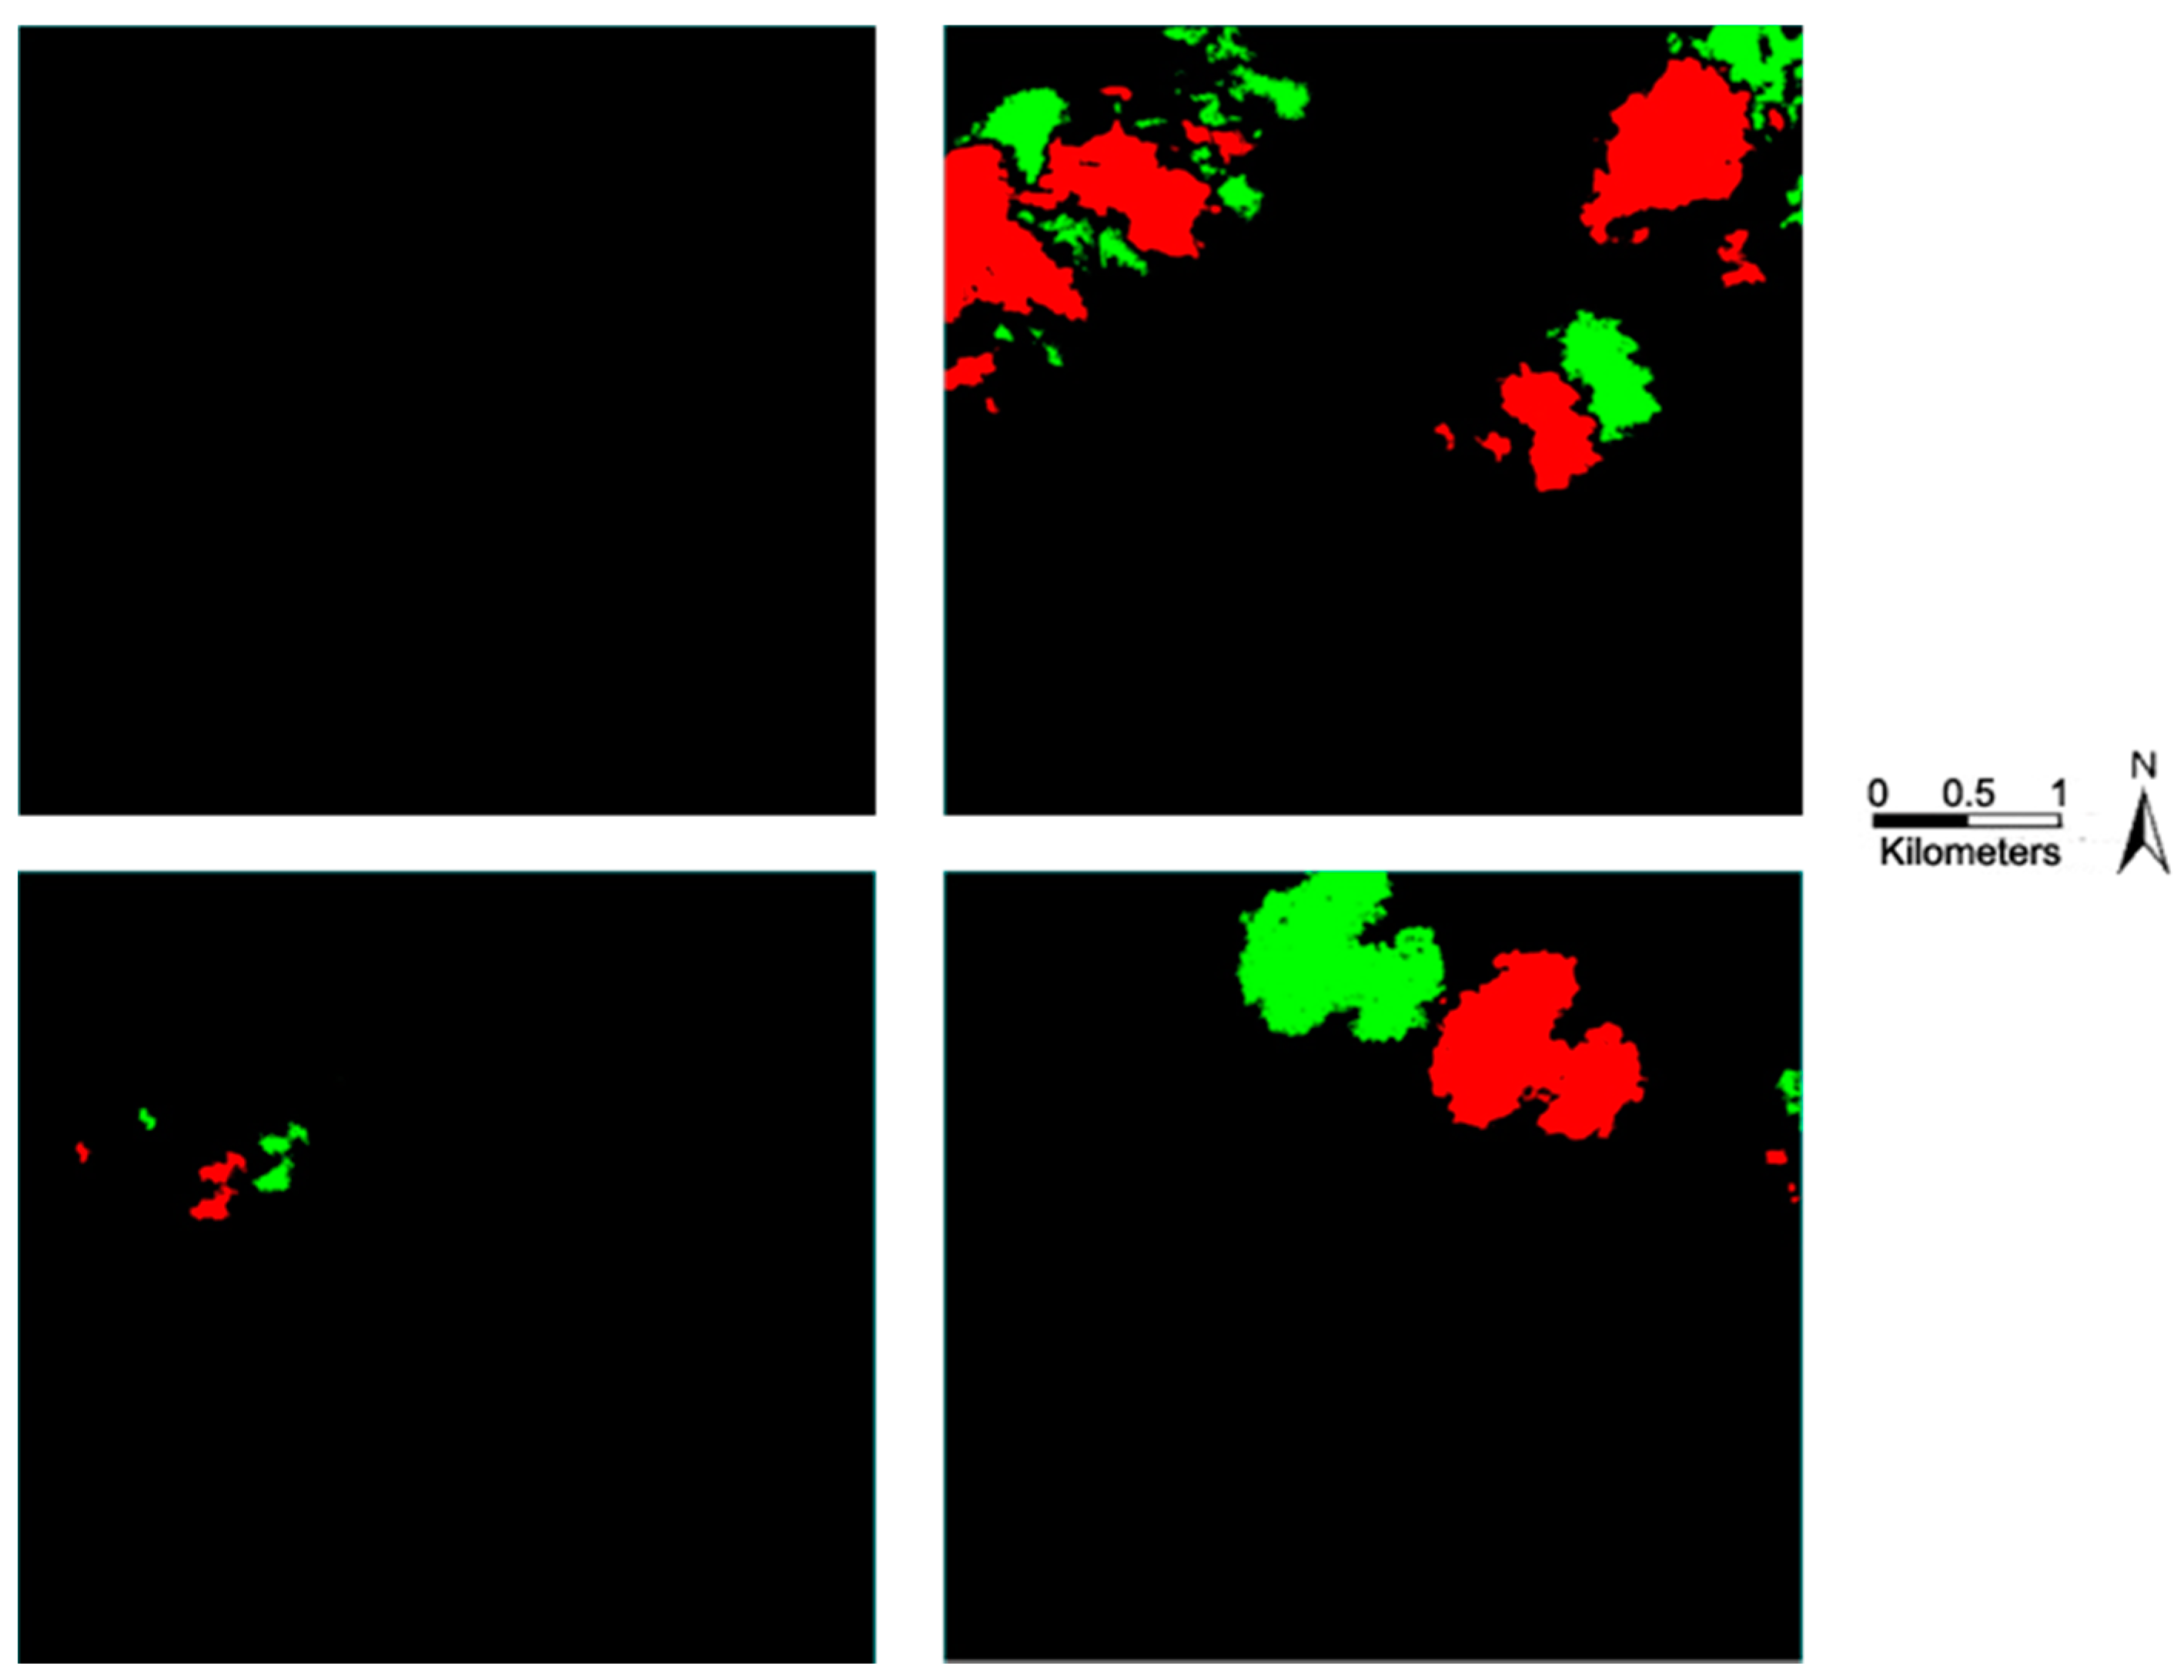
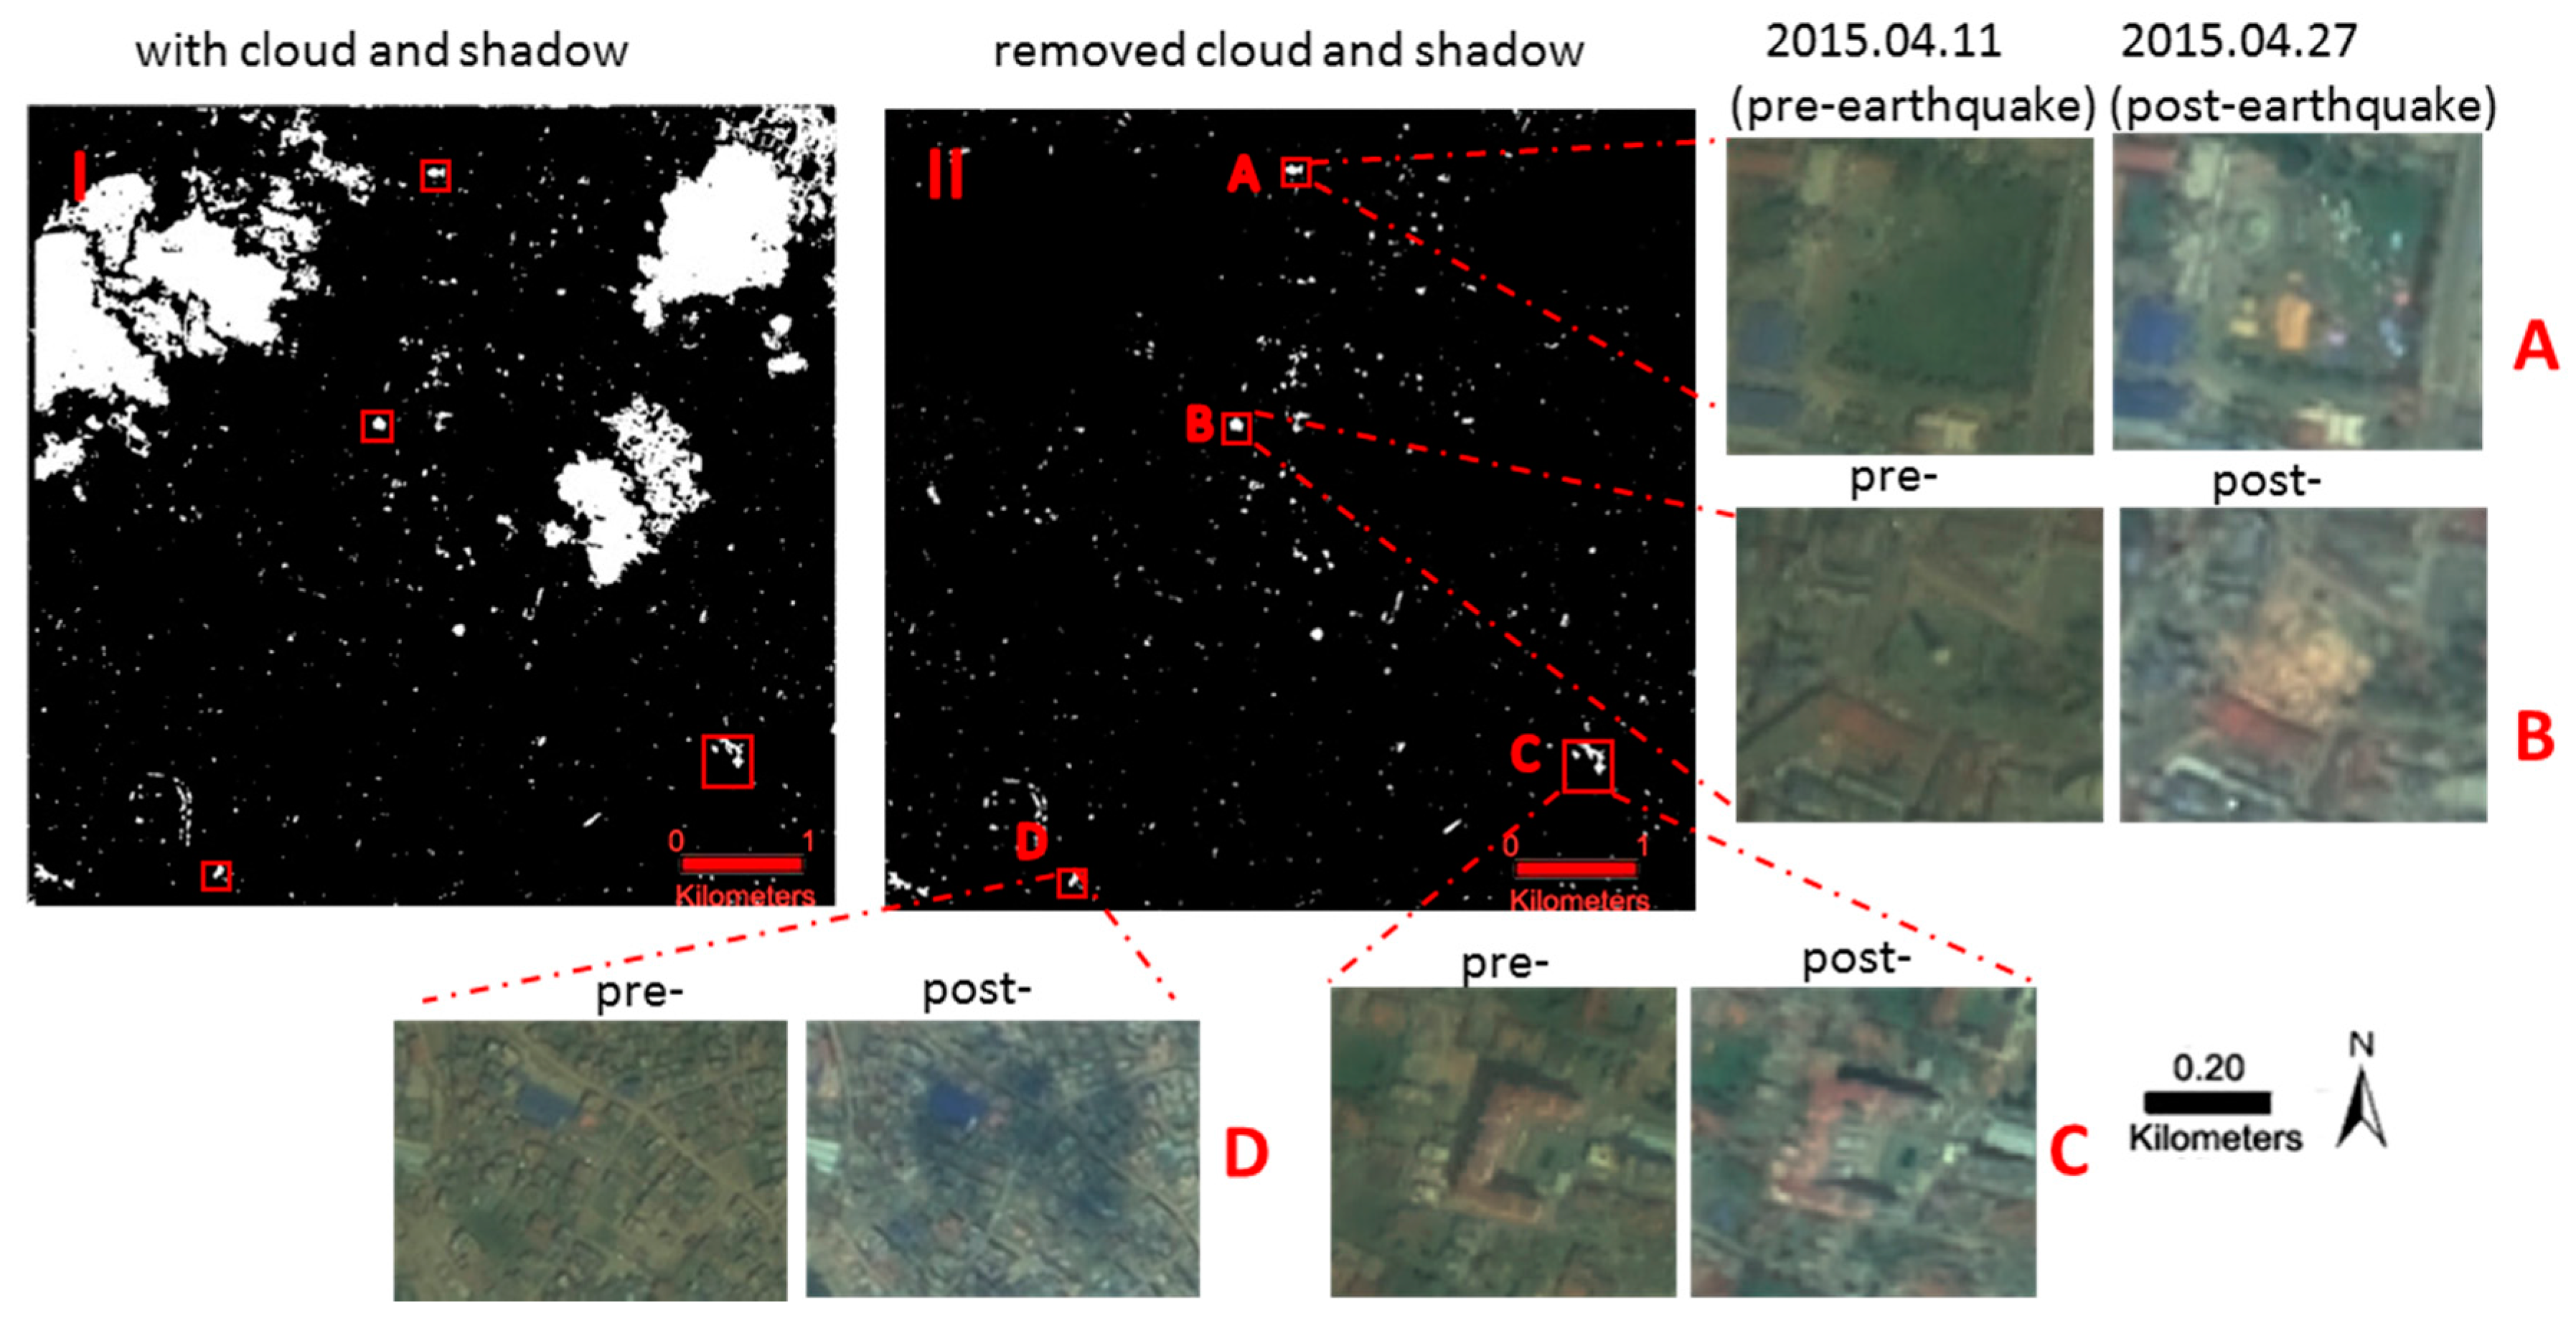
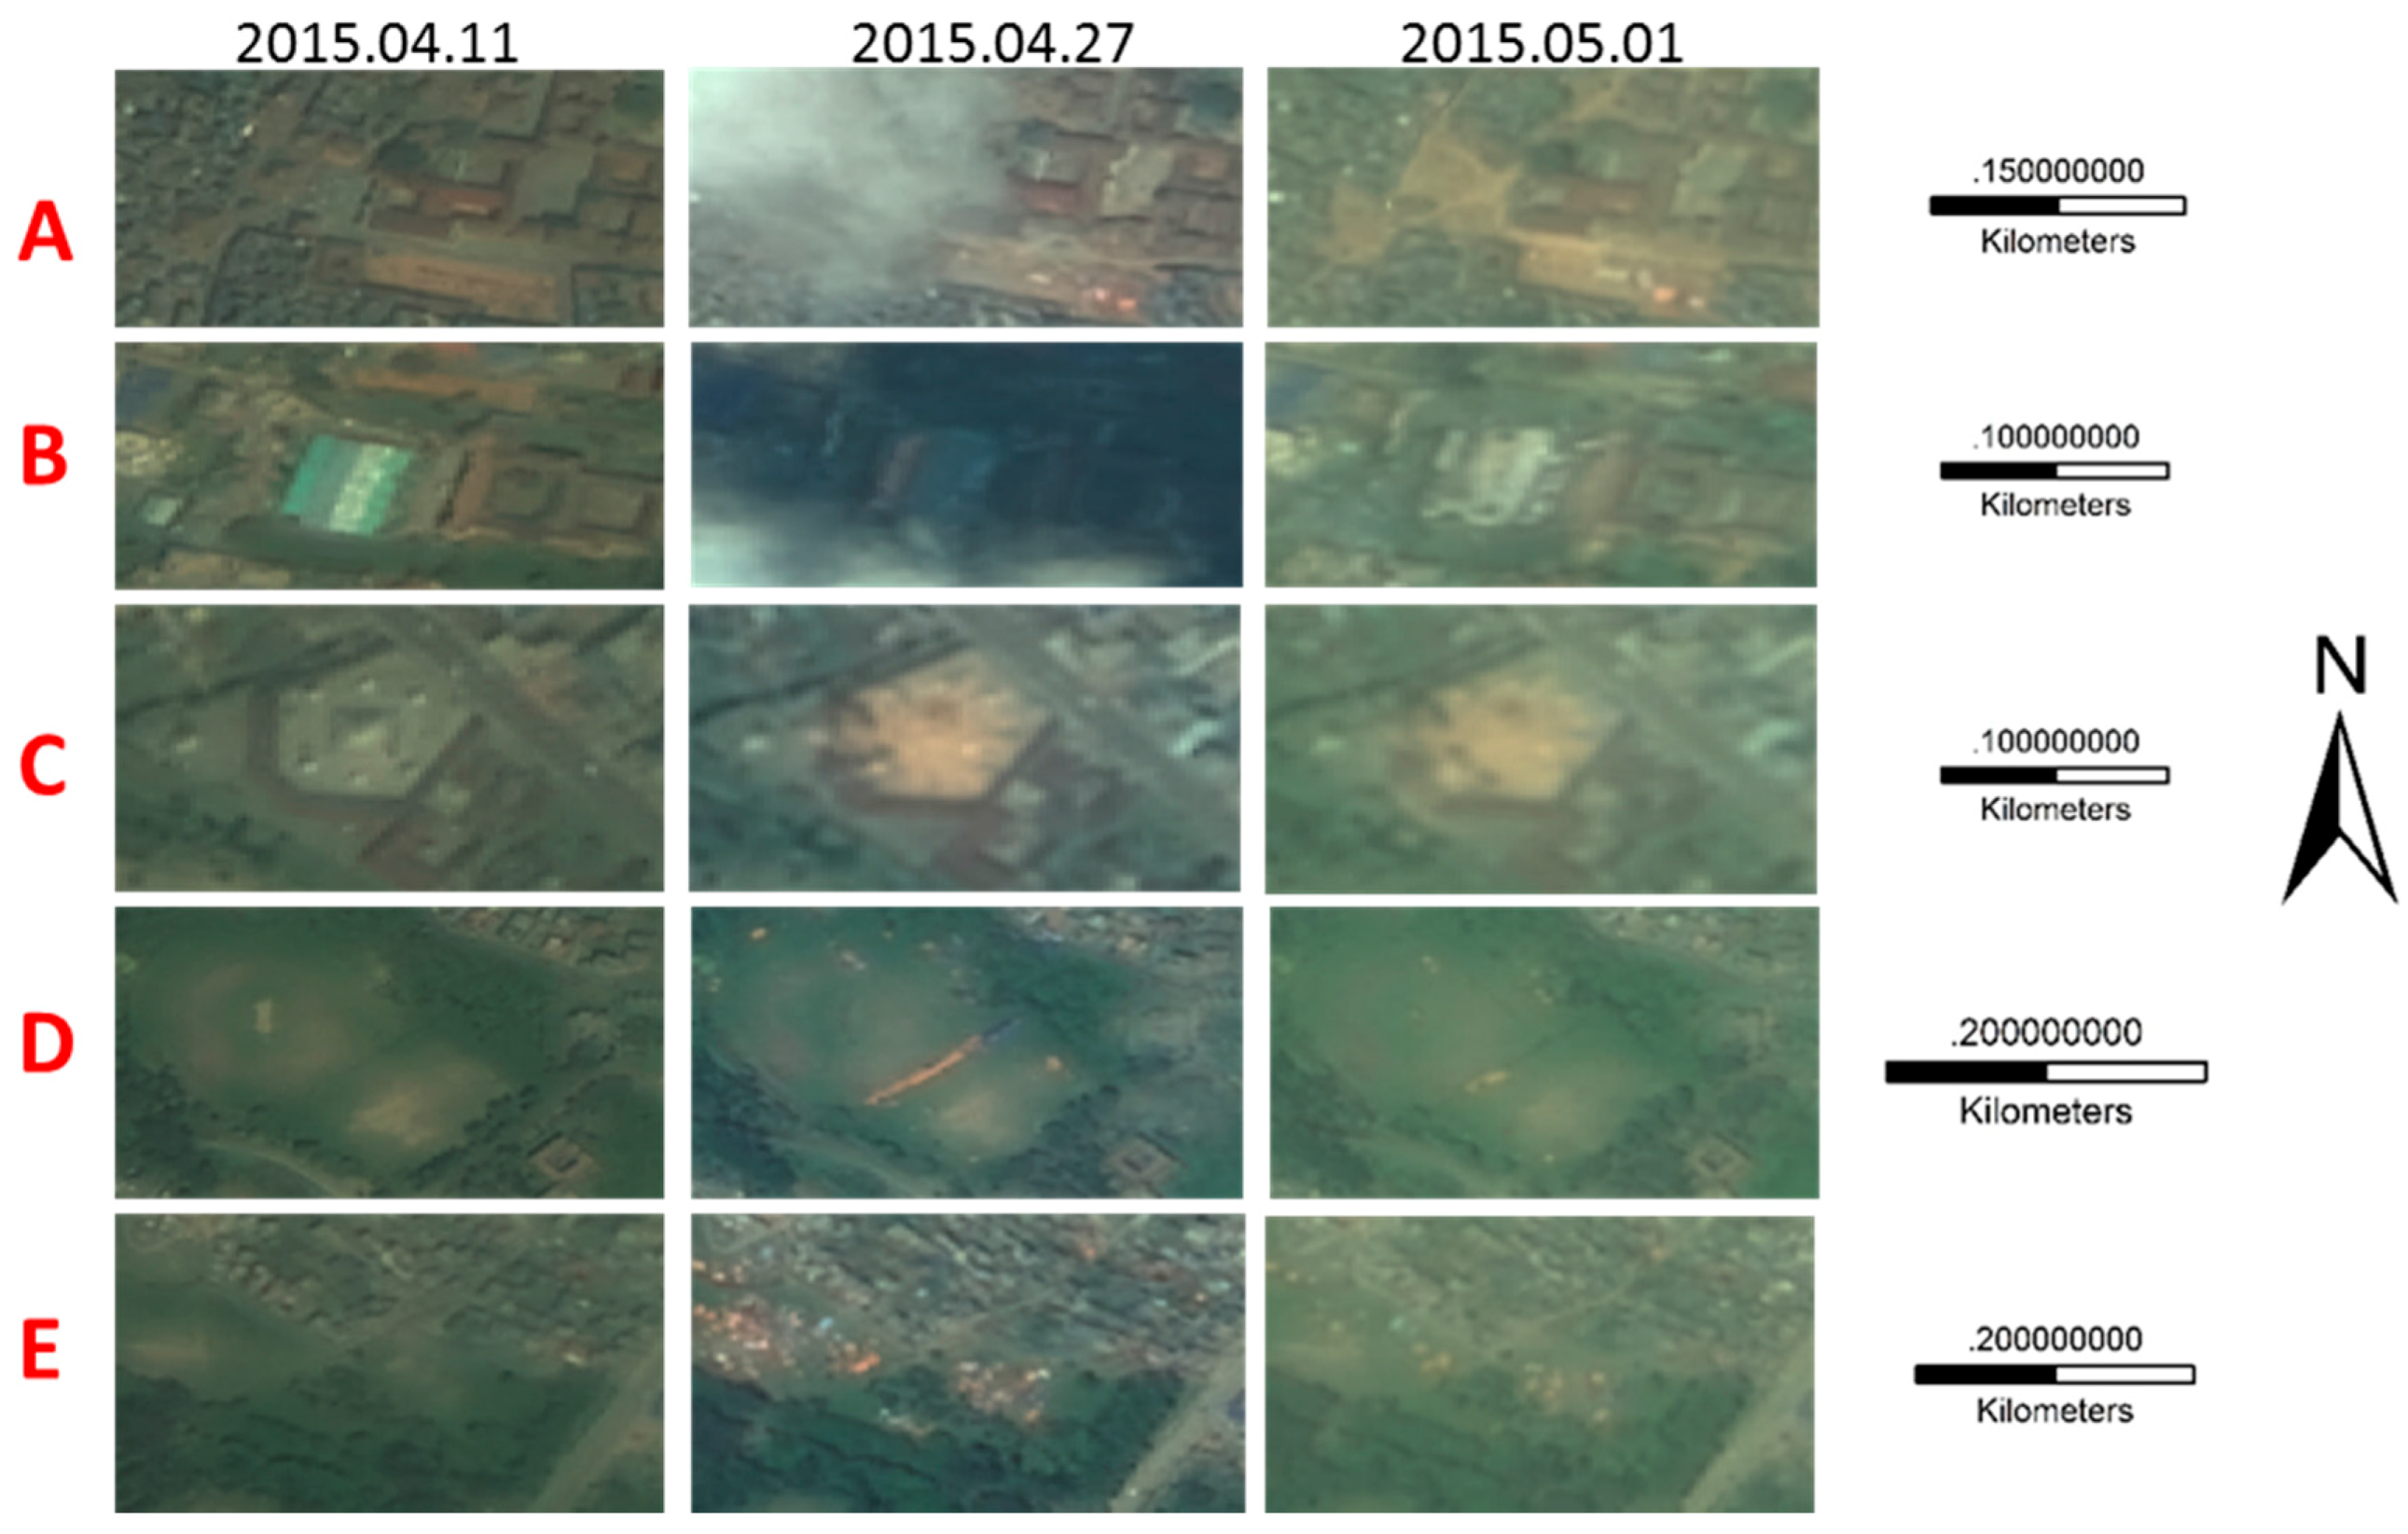
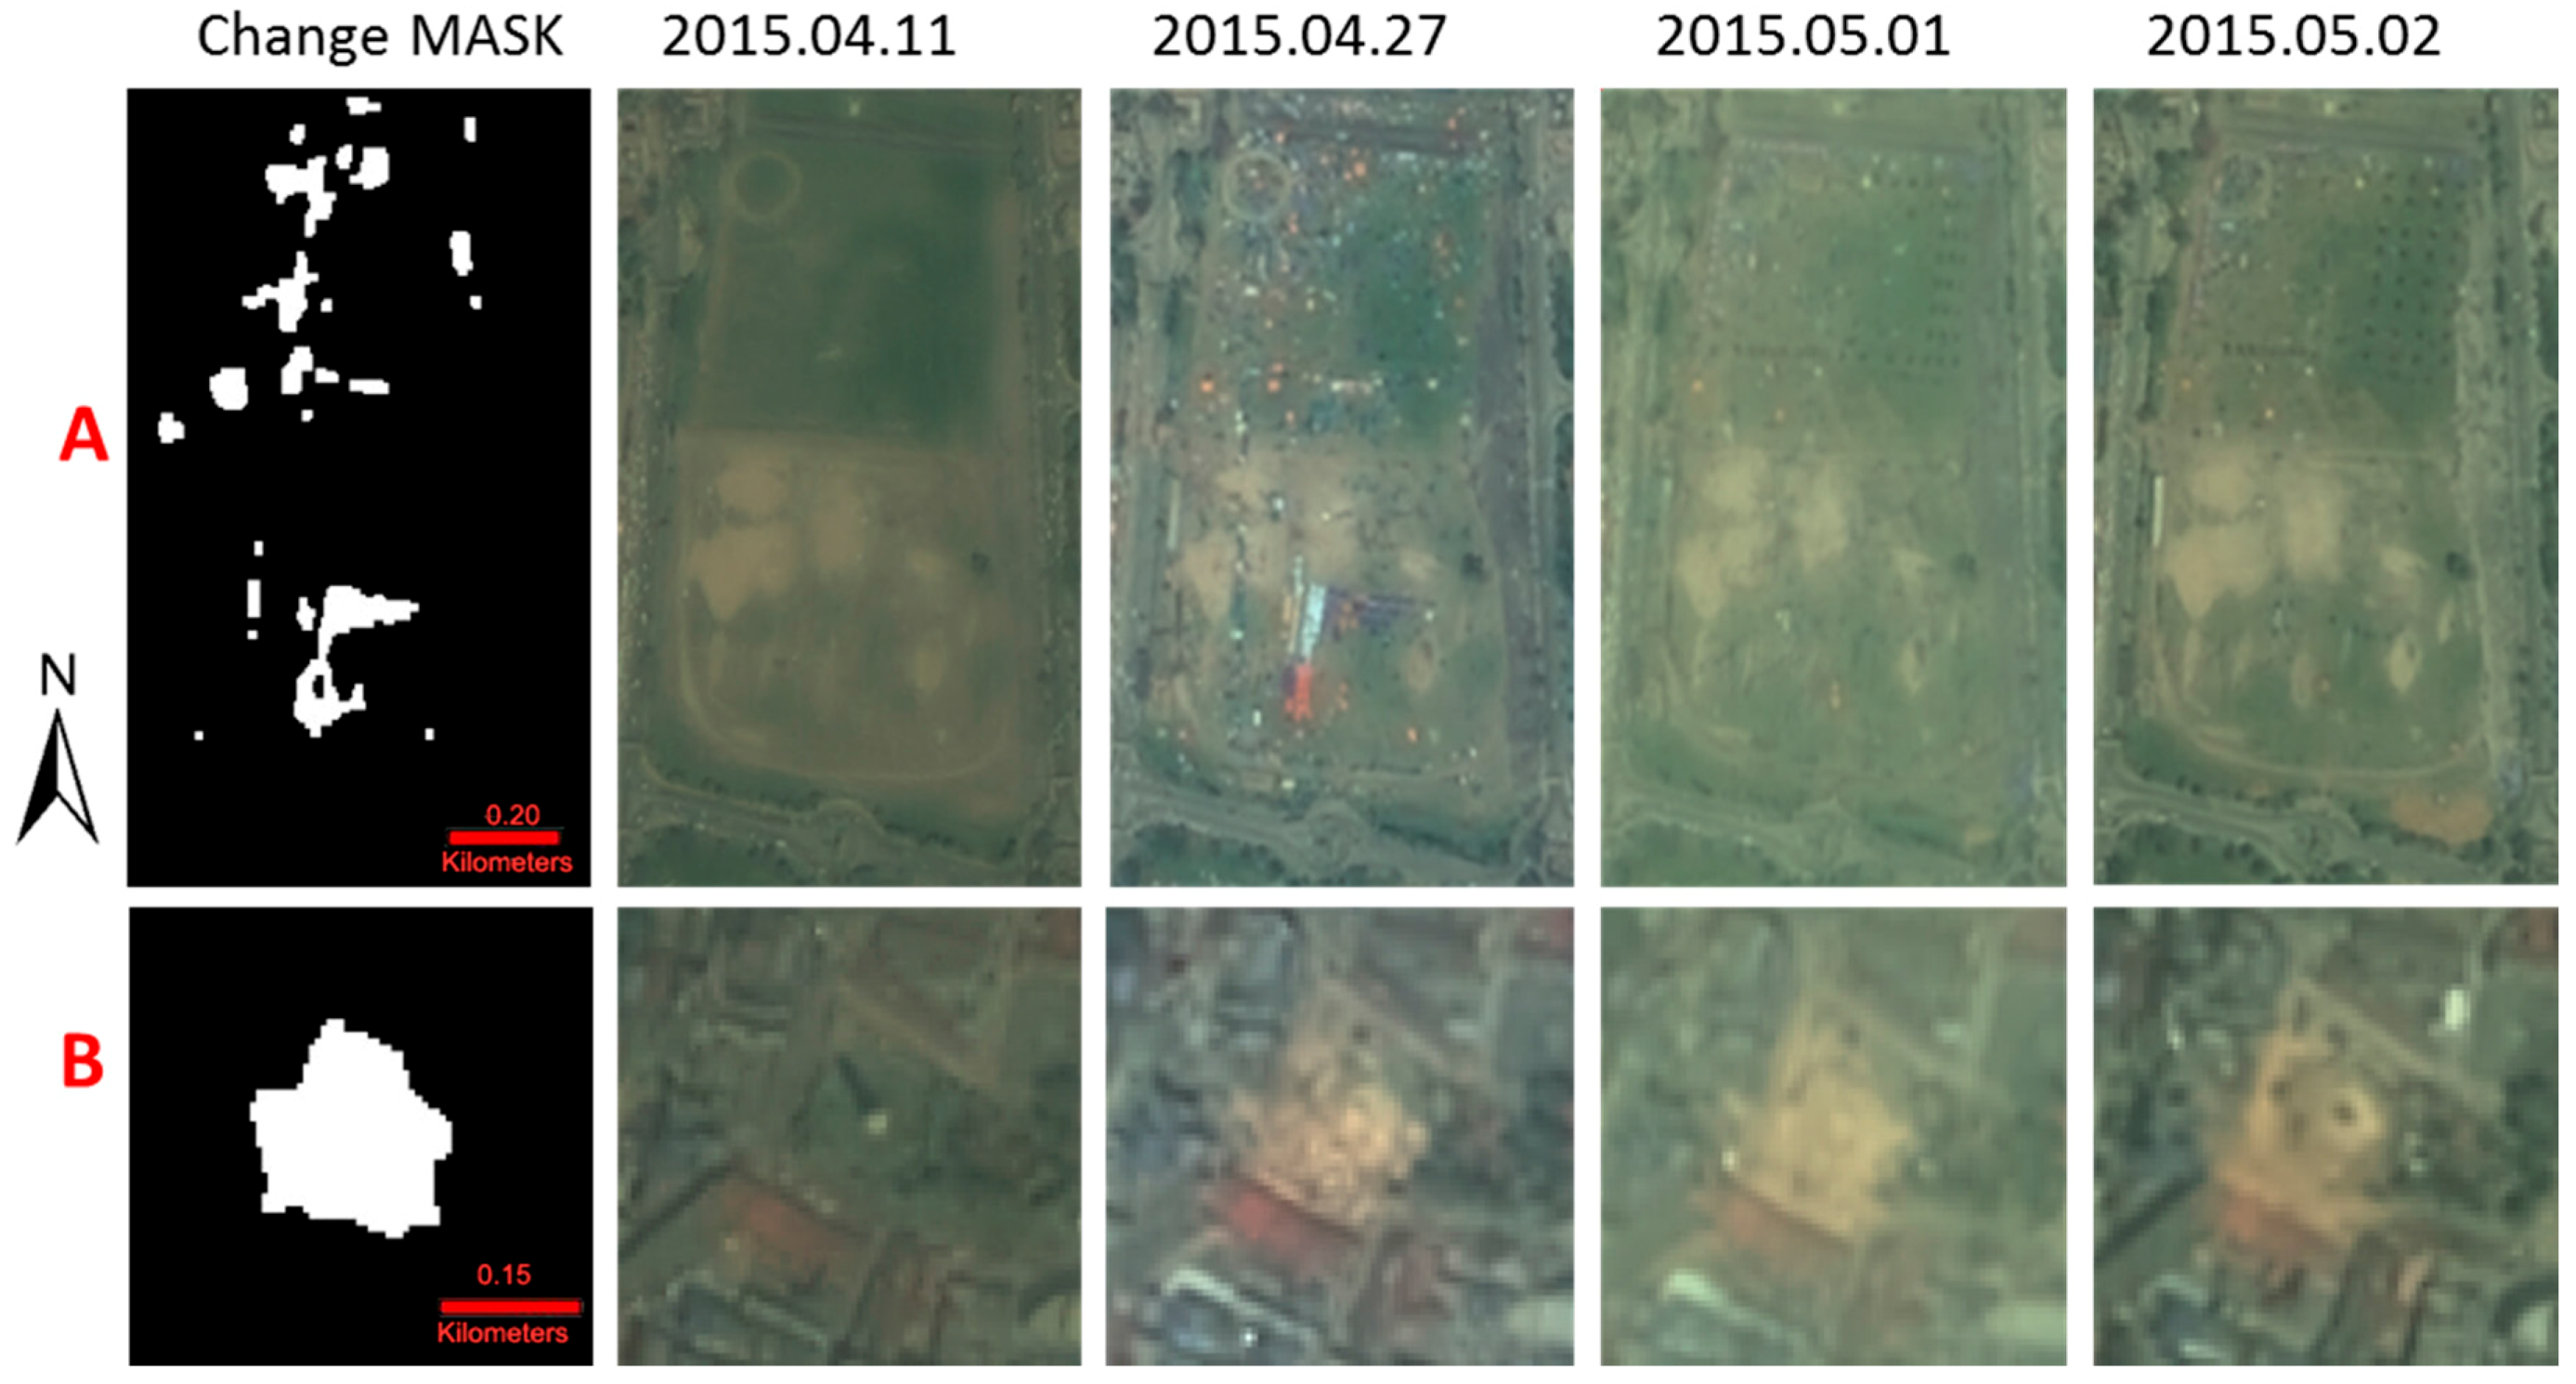
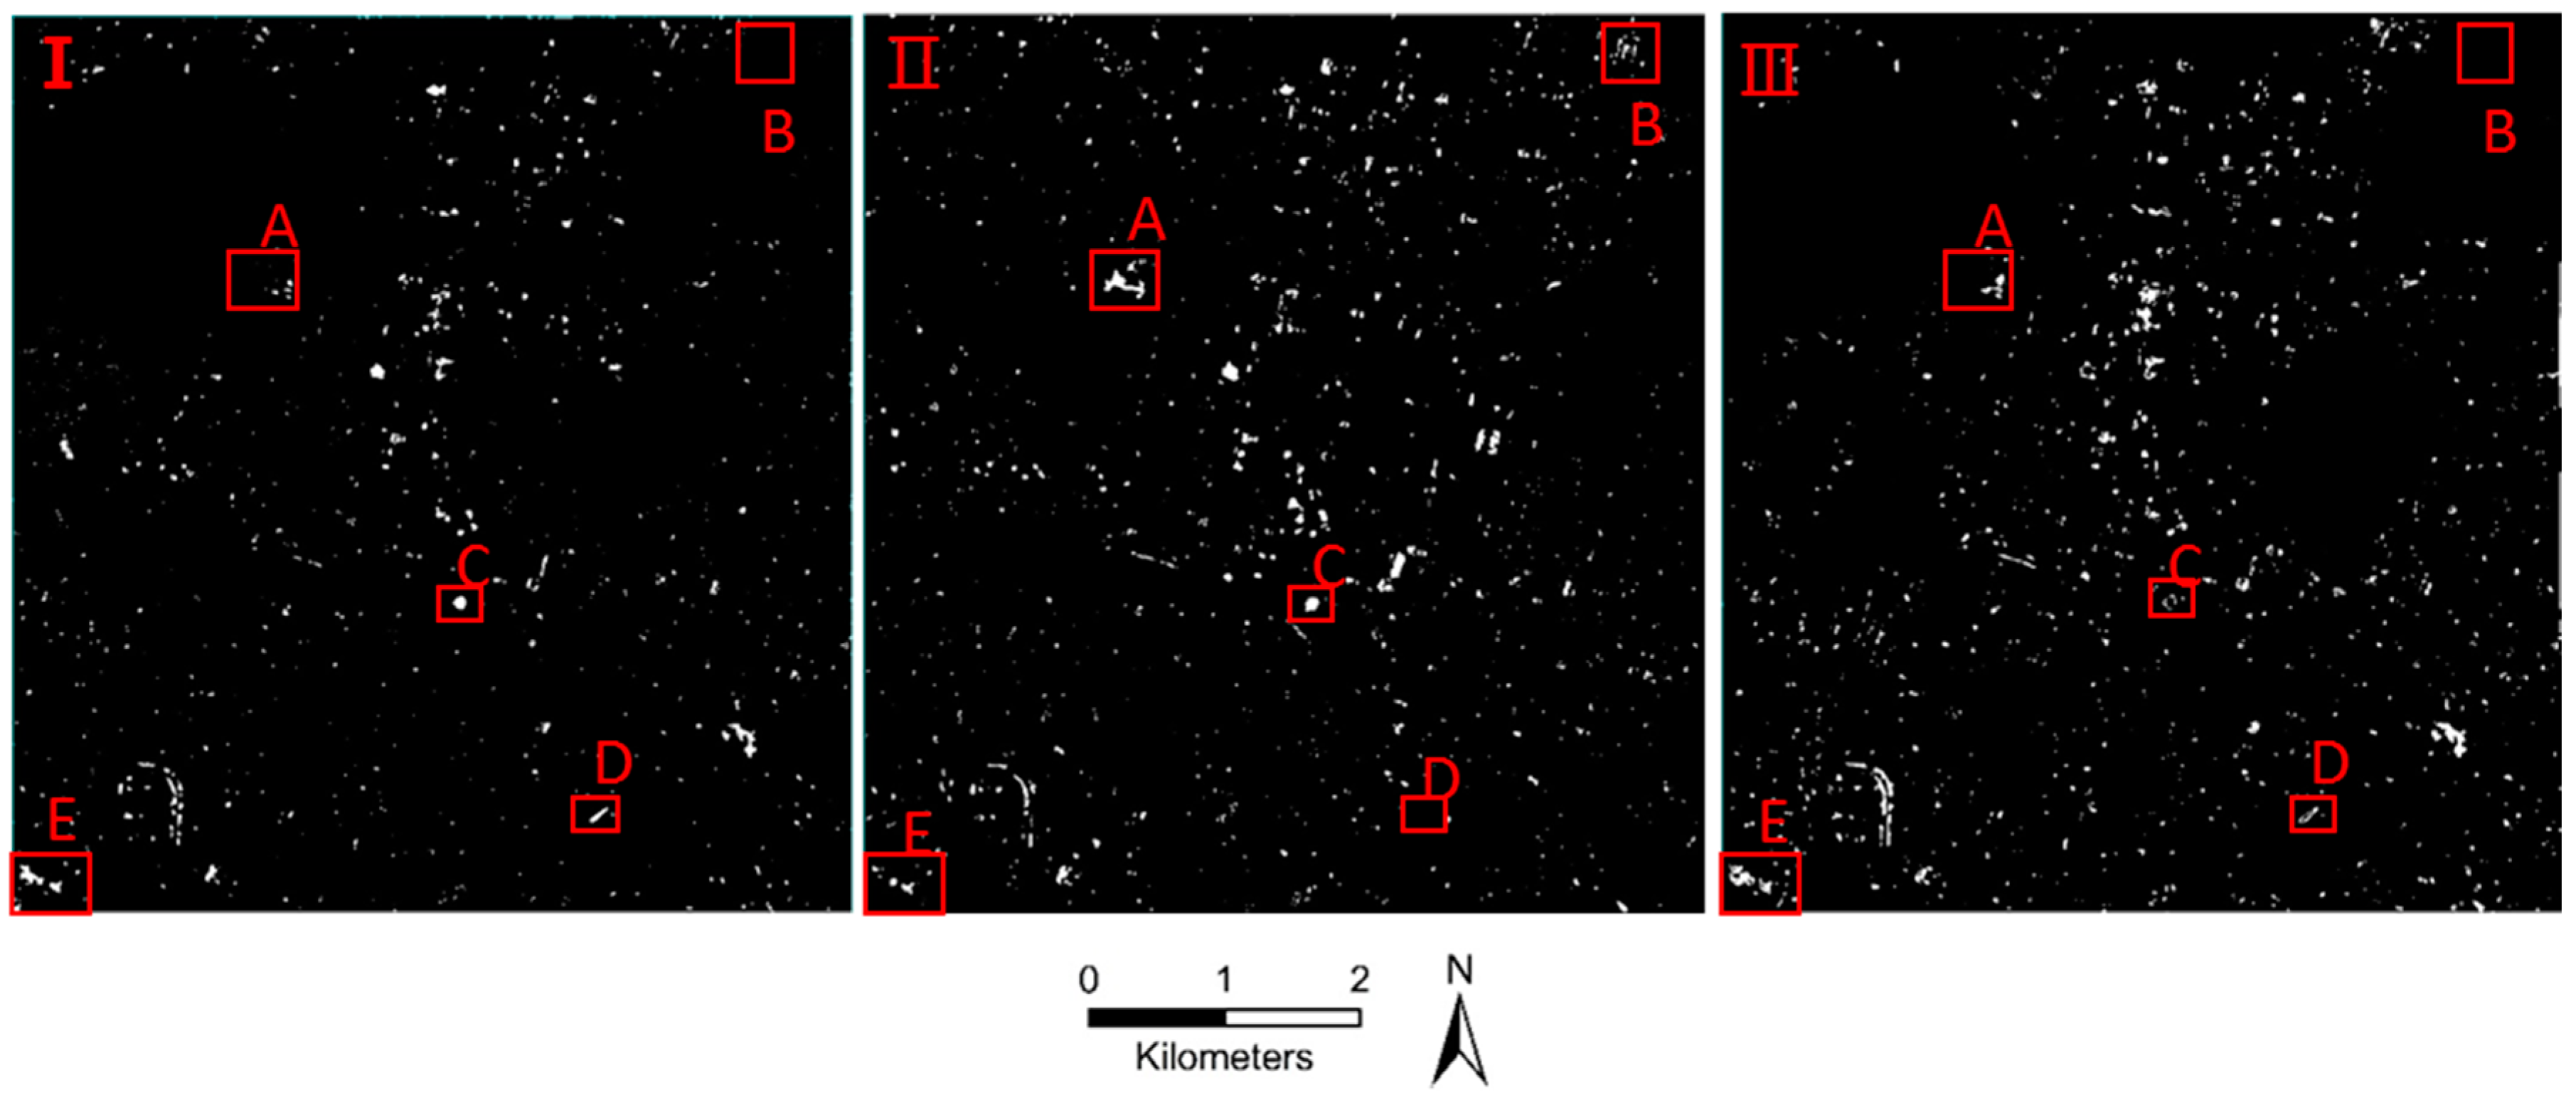
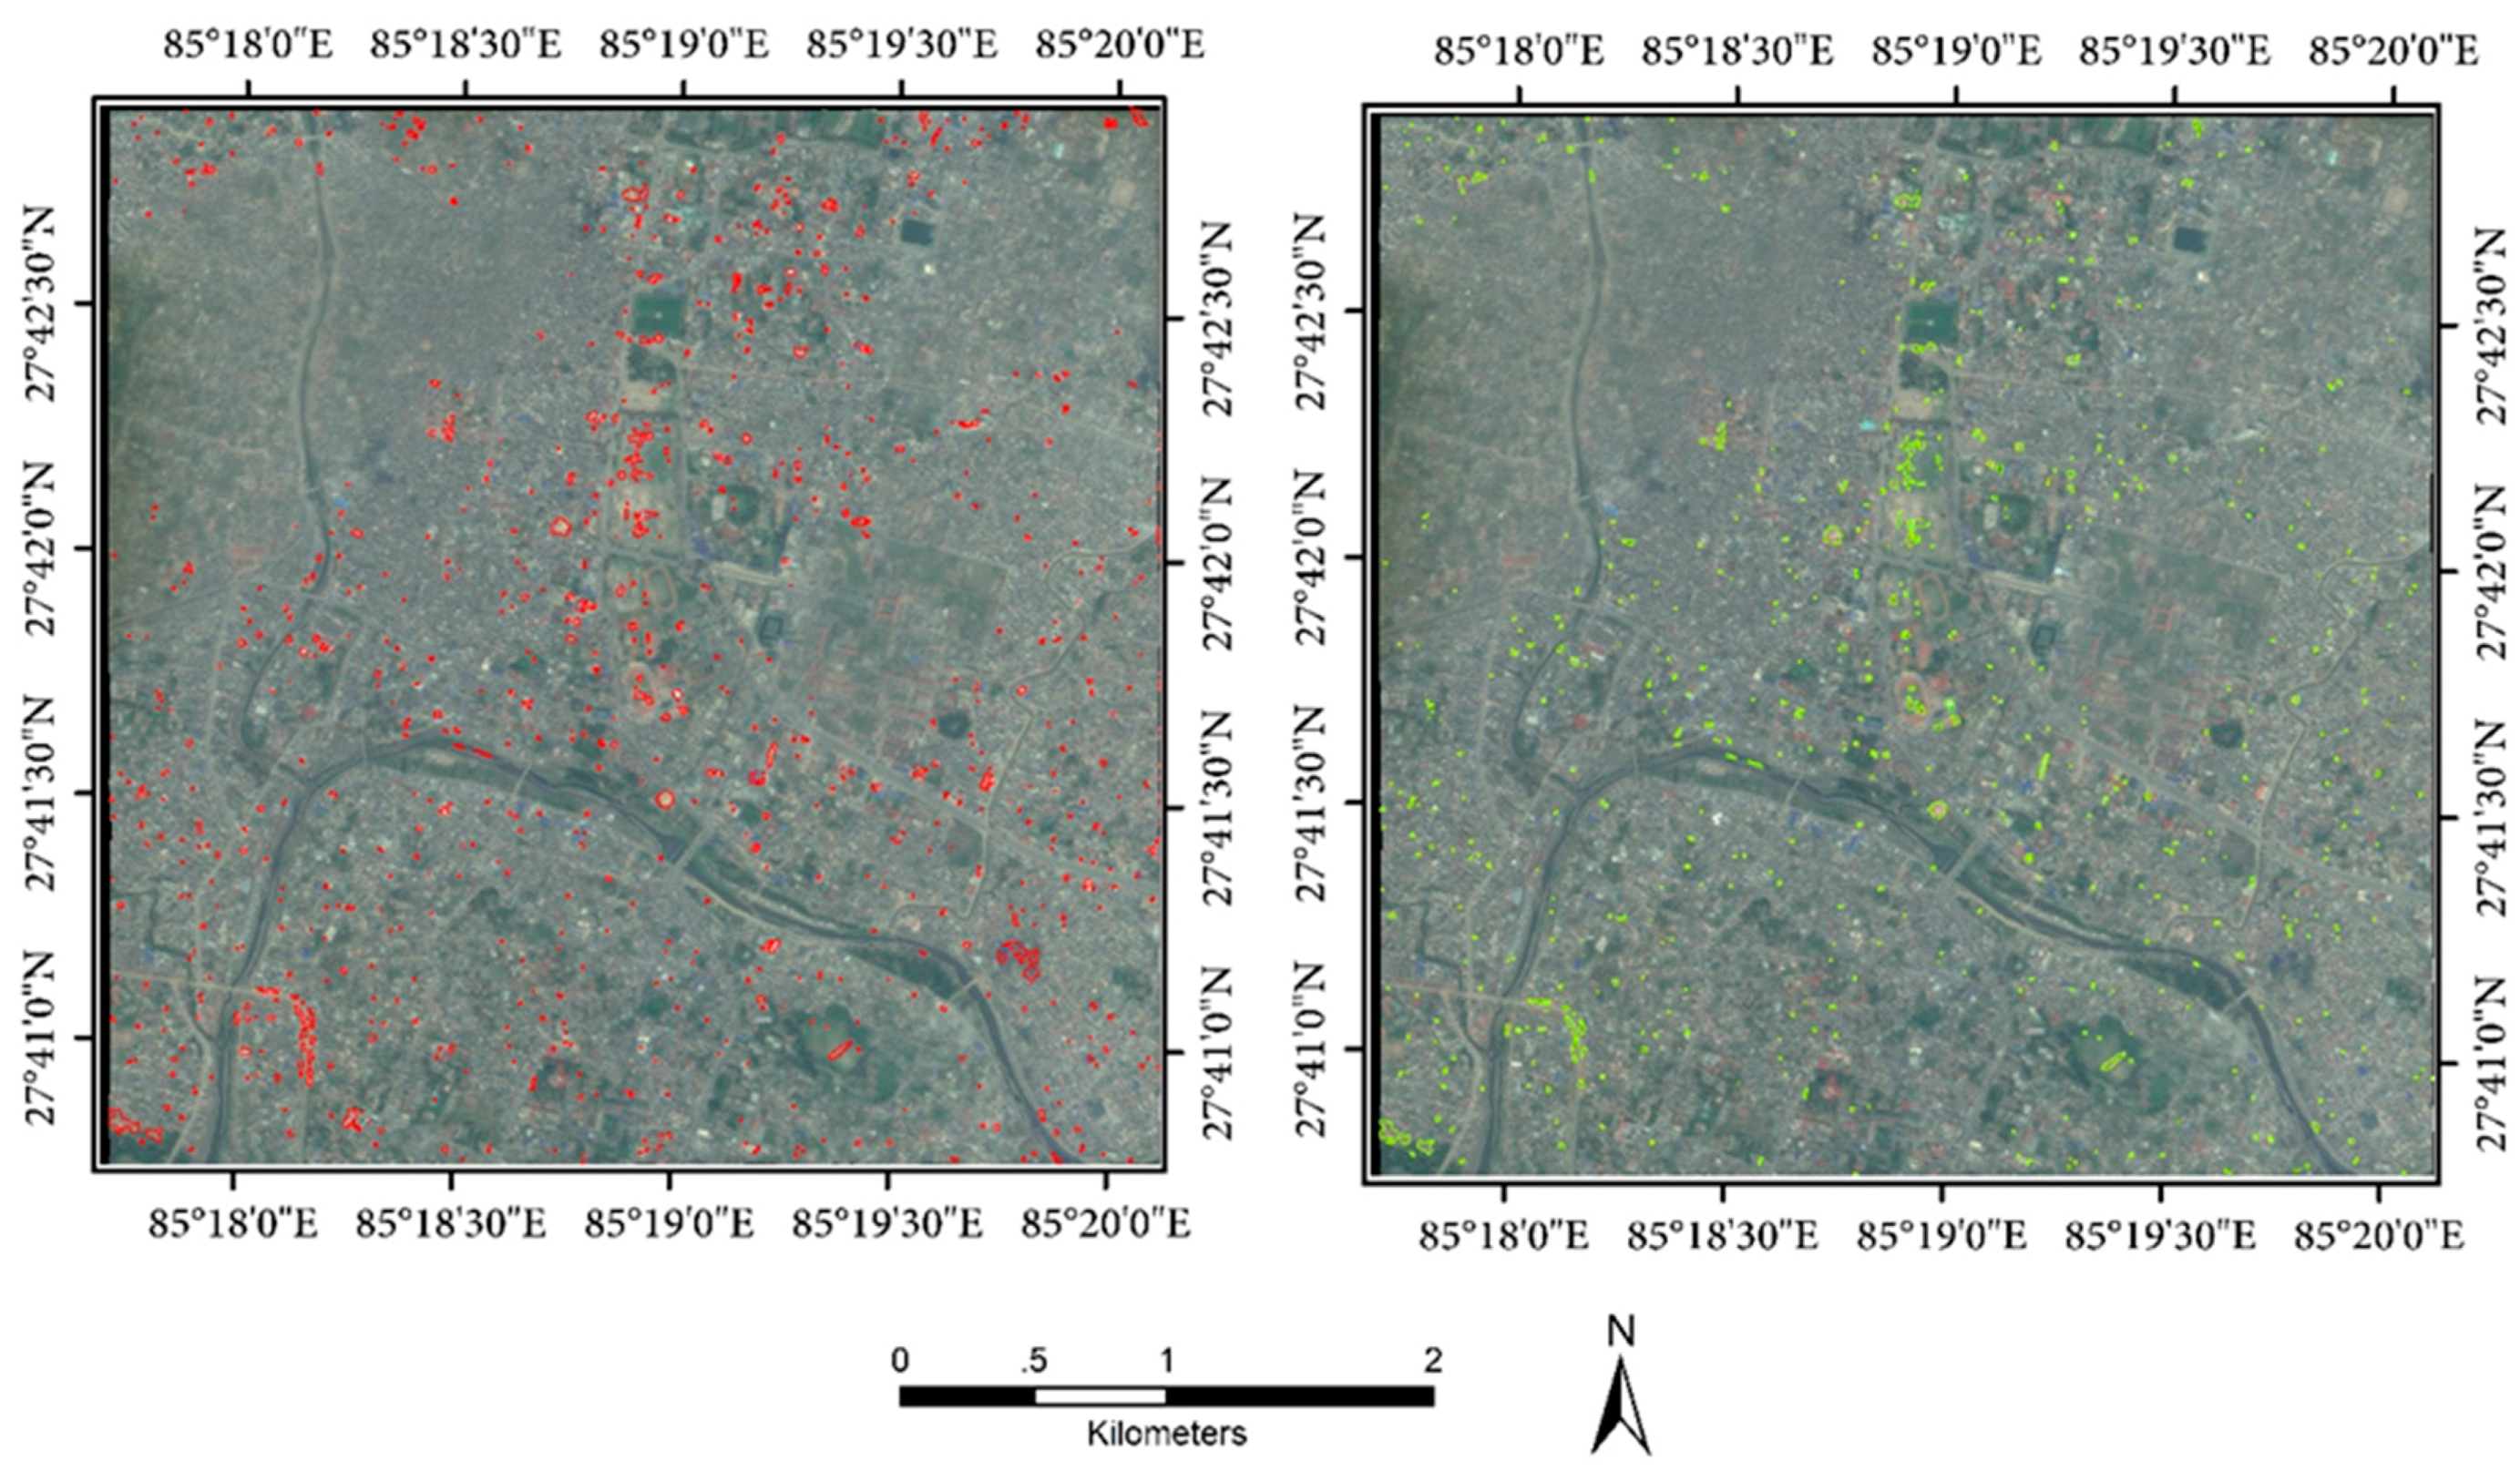
3.5. Change-Detection Product and Analysis
4. Discussion
4.1. Map Accuracy and Timeliness
4.2. Limitations
5. Conclusions and Future Work
Acknowledgments
Author Contributions
Conflicts of Interest
Appendix
References
- Dou, M.; Chen, J.; Chen, D.; Chen, X.; Deng, Z.; Zhang, X.; Xu, K.; Wang, J. Modeling and simulation for natural disaster contingency planning driven by high-resolution remote sensing images. Future Gener. Comput. Syst. 2014, 37, 367–377. [Google Scholar] [CrossRef]
- Huyck, C.; Verrucci, E.; Bevington, J. Remote Sensing for Disaster Response: A Rapid, Image-Based Perspective. In Earthquake Hazard, Risk, and Disasters; Academic Press: Cambridge, MA, USA, 2014; pp. 1–24. [Google Scholar]
- Joyce, K.E.; Belliss, S.E.; Samsonov, S.V.; McNeill, S.J.; Glassey, P.J. A review of the status of satellite remote sensing and image processing techniques for mapping natural hazards and disasters. Prog. Phys. Geogr. 2009, 33, 183–207. [Google Scholar] [CrossRef]
- Voigt, S.; Kemper, T.; Riedlinger, T.; Kiefl, R.; Scholte, K.; Mehl, H. Satellite image analysis for disaster and crisis-management support. IEEE Trans. Geosci. Remote Sens. 2007, 45, 1520–1528. [Google Scholar] [CrossRef]
- Boccardo, P.; Tonolo, F.G. Remote Sensing Role in Emergency Mapping for Disaster Response. In Engineering Geology for Society and Territory; Springer International Publishing: New York, NY, USA, 2015; Volume 5, pp. 17–24. [Google Scholar]
- Arciniegas, G.A.; Bijker, W.; Kerle, N.; Tolpekin, V.A. Coherence- and amplitude-based analysis of seismogenic damage in Bam, Iran, using ENVISAT ASAR data. IEEE Trans. Geosci. Remote Sens. 2007, 45, 1571. [Google Scholar] [CrossRef]
- Voigt, S.; Schneiderhan, T.; Twele, A.; Gähler, M.; Stein, E.; Mehl, H. Rapid damage assessment and situation mapping: Learning from the 2010 Haiti earthquake. Photogramm. Eng. Remote Sens. 2011, 77, 923–931. [Google Scholar] [CrossRef]
- Baiocchi, V.; Dominici, D.; Giannone, F.; Zucconi, M. Rapid building damage assessment using EROS B data: The case study of L’Aquila earthquake. Ital. J. Remote Sens. 2012, 44, 153–165. [Google Scholar] [CrossRef]
- Kerle, N. Satellite-based damage mapping following the 2006 Indonesia earthquake—How accurate was it? Int. J. Appl. Earth Obs. 2010, 12, 466–476. [Google Scholar] [CrossRef]
- Ehrlich, D.; Guo, H.; Molch, K.; Ma, J.; Pesaresi, M. Identifying damage caused by the 2008 Wenchuan earthquake from VHR remote sensing data. Int. J. Digit. Earth 2009, 2, 309–326. [Google Scholar] [CrossRef]
- Chini, M. Earthquake Damage Mapping Techniques Using SAR and Optical Remote Sensing Satellite Data; INTECH Open Access Publisher: Rijeka, Croatia, 2009. [Google Scholar]
- Dell’Acqua, F.; Bignami, C.; Chini, M.; Lisini, G.; Polli, D.A.; Stramondo, S. Earthquake damages rapid mapping by satellite remote sensing data: L’Aquila 6 April 2009 event. IEEE J. Sel. Top. Appl. Earth Obs. Remote Sens. 2011, 4, 935–943. [Google Scholar] [CrossRef]
- Yamazaki, F.; Kouchi, K.I.; Kohiyama, M.; Muraoka, N.; Matsuoka, M. Earthquake damage detection using high-resolution satellite images. In Proceedings of the IEEE International Geoscience and Remote Sensing Symposium, Anchorage, Alaska, 20–24 September 2004; IEEE: Piscataway, NJ, USA, 2004; Volume 4, pp. 2280–2283. [Google Scholar]
- Ajmar, A.; Boccardo, P.; Disabato, F.; Tonolo, F.G. Rapid Mapping: Geomatics role and research opportunities. Rend. Lincei 2015, 26, 63–73. [Google Scholar] [CrossRef]
- Zhang, Y. Understanding image fusion. Photogramm. Eng. Remote Sens. 2004, 70, 657–661. [Google Scholar]
- Jiang, C.; Zhang, H.; Shen, H.; Zhang, L. A practical compressed sensing-based pan-sharpening method. IEEE Geosci. Remote Sens. Lett. 2012, 9, 629–633. [Google Scholar] [CrossRef]
- Shahdoosti, H.R.; Ghassemian, H. Spatial PCA as a new method for image fusion. In Proceedings of the 16th CSI International Symposium on Artificial Intelligence and Signal Processing (AISP), Shiraz, Iran, 2–3 May 2012; IEEE: Piscataway, NJ, USA, 2012; pp. 90–94. [Google Scholar]
- El-Mezouar, M.C.; Taleb, N.; Kpalma, K.; Ronsin, J. An IHS-based fusion for color distortion reduction and vegetation enhancement in IKONOS imagery. IEEE Trans. Geosci. Remote Sens. 2011, 49, 1590–1602. [Google Scholar] [CrossRef]
- Zhang, Y. Problems in the Fusion of Commercial High-Resolution Satelitte as well as Landsat 7 Images and Initial Solutions. Int. Arch. Photogramm. Remote Sens. Spat. Inf. Sci. 2002, 34, 587–592. [Google Scholar]
- Pradhan, P.S.; King, R.L.; Younan, N.H.; Holcomb, D.W. Estimation of the number of decomposition levels for a wavelet-based multiresolution multisensor image fusion. IEEE Trans. Geosci. Remote Sens. 2006, 44, 3674–3686. [Google Scholar] [CrossRef]
- Zhang, L.; Shen, H.; Gong, W.; Zhang, H. Adjustable model-based fusion method for multispectral and panchromatic images. IEEE Trans. Syst. Man Cybern. B Cybern. 2012, 42, 1693–1704. [Google Scholar] [CrossRef] [PubMed]
- Li, S.; Yang, B. A new pan-sharpening method using a compressed sensing technique. IEEE Trans. Geosci. Remote Sens. 2011, 49, 738–746. [Google Scholar] [CrossRef]
- Ghahremani, M.; Ghassemian, H. Remote sensing image fusion using ripplet transform and compressed sensing. IEEE Geosci. Remote Sens. Lett. 2015, 12, 502–506. [Google Scholar] [CrossRef]
- Ballester, C.; Caselles, V.; Igual, L.; Verdera, J.; Rougé, B. A variational model for P+ XS image fusion. Int. J. Comput. Vis. 2006, 69, 43–58. [Google Scholar] [CrossRef]
- Paige, C.C.; Saunders, M.A. LSQR: An algorithm for sparse linear equations and sparse least squares. ACM Trans. Math. Softw. (TOMS) 1982, 8, 43–71. [Google Scholar] [CrossRef]
- Le Moigne, J.; Netanyahu, N.S.; Eastman, R.D. Image Registration for Remote Sensing; Cambridge University Press: England, UK, 2011. [Google Scholar]
- Avants, B.B.; Epstein, C.L.; Grossman, M.; Gee, J.C. Symmetric diffeomorphic image registration with cross-correlation: Evaluating automated labeling of elderly and neurodegenerative brain. Med. Image Anal. 2008, 12, 26–41. [Google Scholar] [CrossRef] [PubMed]
- Dame, A.; Marchand, E. Second-order optimization of mutual information for real-time image registration. IEEE Trans. Image Process. 2012, 21, 4190–4203. [Google Scholar] [CrossRef] [PubMed]
- Yu, X.; Chen, X.; Jiang, M. Motion detection in moving background using a novel algorithm based on image features guiding self-adaptive Sequential Similarity Detection Algorithm. Optik-Int. J. Light Electron Opt. 2012, 123, 2031–2037. [Google Scholar] [CrossRef]
- Lowe, D.G. Distinctive image features from scale-invariant keypoints. Int. J. Comput. Vis. 2004, 60, 91–110. [Google Scholar] [CrossRef]
- Mikolajczyk, K.; Schmid, C. Scale & affine invariant interest point detectors. Int. J. Comput. Vis. 2004, 60, 63–86. [Google Scholar]
- Sima, A.A.; Buckley, S.J. Optimizing SIFT for matching of short wave infrared and visible wavelength images. Remote Sens. 2013, 5, 2037–2056. [Google Scholar] [CrossRef]
- Bajcsy, R.; Kovačič, S. Multiresolution elastic matching. Comput. Vis. Graph. Image Process. 1989, 46, 1–21. [Google Scholar] [CrossRef]
- Zhang, Z.; Li, J.Z.; Li, D.D. Research of automated image registration technique for infrared images based on optical flow field analysis. J. Infrared Millim. Waves 2003, 22, 307–312. [Google Scholar]
- Liu, J.; Yan, H. Phase correlation pixel-to-pixel image co-registration based on optical flow and median shift propagation. Int. J. Remote Sens. 2008, 29, 5943–5956. [Google Scholar] [CrossRef]
- Huo, C.; Pan, C.; Huo, L.; Zhou, Z. Multilevel SIFT matching for large-size VHR image registration. IEEE Geosci. Remote Sens. Lett. 2012, 9, 171–175. [Google Scholar] [CrossRef]
- Horn, B.K.; Schunck, B.G. Determining optical flow. In 1981 Technical Symposium East; International Society for Optics and Photonics: Bellingham, WA, USA, 1981. [Google Scholar]
- Allahviranloo, T. Successive over relaxation iterative method for fuzzy system of linear equations. Appl. Math. Comput. 2005, 162, 189–196. [Google Scholar] [CrossRef]
- Shen, H.; Li, H.; Qian, Y.; Zhang, L.; Yuan, Q. An effective thin cloud removal procedure for visible remote sensing images. ISPRS J. Photogramm. Remote Sens. 2014, 96, 224–235. [Google Scholar] [CrossRef]
- Lin, C.-H.; Tsai, P.-H.; Lai, K.-H.; Chen, J.-Y. Cloud removal from multitemporal satellite images using information cloning. IEEE Trans. Geosci. Remote Sens. 2013, 51, 232–241. [Google Scholar] [CrossRef]
- Chen, J.; Zhu, X.; Vogelmann, J.E.; Gao, F.; Jin, S. A simple and effective method for filling gaps in Landsat ETM+ SLC-off images. Remote Sens. Environ. 2011, 115, 1053–1064. [Google Scholar] [CrossRef]
- Zhang, Y.; Guindon, B.; Cihlar, J. An image transform to characterize and compensate for spatial variations in thin cloud contamination of Landsat images. Remote Sens. Environ. 2002, 82, 173–187. [Google Scholar] [CrossRef]
- Gao, F.; Masek, J.; Schwaller, M.; Hall, F. On the blending of the Landsat and MODIS surface reflectance: Predicting daily Landsat surface reflectance. IEEE Trans. Geosci. Remote Sens. 2006, 44, 2207–2218. [Google Scholar]
- Helmer, E.; Ruefenacht, B. Cloud-free satellite image mosaics with regression trees and histogram matching. Photogramm. Eng. Remote Sens. 2005, 71, 1079–1089. [Google Scholar] [CrossRef]
- Cheng, Q.; Shen, H.; Zhang, L.; Yuan, Q.; Zeng, C. Cloud removal for remotely sensed images by similar pixel replacement guided with a spatio-temporal MRF model. ISPRS J. Photogramm. Remote Sens. 2014, 92, 54–68. [Google Scholar] [CrossRef]
- Zhengke, G.; Fu, C.; Jin, Y.; Xinpeng, L.; Fangjun, L.; Jing, Z. Automatic cloud and cloud shadow removal method for landsat TM images. In Proceedings of the 10th International Conference on Electronic Measurement & Instruments (ICEMI), Chengdu, China, 16–19 August 2011; IEEE: Piscataway, NJ, USA, 2011; Volume 3, pp. 80–84. [Google Scholar]
- Zhu, Z.; Woodcock, C.E. Object-based cloud and cloud shadow detection in Landsat imagery. Remote Sens. Environ. 2012, 118, 83–94. [Google Scholar] [CrossRef]
- Chini, M.; Pierdicca, N.; Emery, W.J. Exploiting SAR and VHR optical images to quantify damage caused by the 2003 Bam earthquake. IEEE Trans. Geosci. Remote Sens. 2009, 47, 145–152. [Google Scholar] [CrossRef]
- Turker, M.; Sumer, E. Building-based damage detection due to earthquake using the watershed segmentation of the post-event aerial images. Int. J. Remote Sens. 2008, 29, 3073–3089. [Google Scholar] [CrossRef]
- Miura, H.; Midorikawa, S.; Kerle, N. Detection of building damage areas of the 2006 central Java, Indonesia, earthquake through digital analysis of optical satellite images. Earthq. Spectra 2013, 29, 453–473. [Google Scholar] [CrossRef]
- Canty, M.J.; Nielsen, A.A. Automatic radiometric normalization of multitemporal satellite imagery with the iteratively re-weighted MAD transformation. Remote Sens. Environ. 2008, 112, 1025–1036. [Google Scholar] [CrossRef]
- Nielsen, A.A. The regularized iteratively reweighted MAD method for change detection in multi-and hyperspectral data. IEEE Trans. Image Process. 2007, 16, 463–478. [Google Scholar] [CrossRef] [PubMed]
- Marpu, P.R.; Gamba, P.; Canty, M.J. Improving change detection results of IR-MAD by eliminating strong changes. IEEE Geosci. Remote Sens. Lett. 2011, 8, 799–803. [Google Scholar] [CrossRef]
- Qiang, L.; Yuan, G.; Ying, C. Study on disaster information management system compatible with VGI and crowdsourcing. In Proceedings of the 2014 IEEE Workshop on Advanced Research and Technology in Industry Applications (WARTIA), Ottawa, ON, Canada, 29–30 September 2014; IEEE: Piscataway, NJ, USA, 2014; pp. 464–468. [Google Scholar]
- Resor, E.E.L. The Neo-Humanitarians: Assessing the Credibility of Organized Volunteer Crisis Mappers. Ph.D. Thesis, Massachusetts Institute of Technology, Cambridge, MA, USA, 2013. [Google Scholar]
- Boccardo, P. New perspectives in emergency mapping. Eur. J. Remote Sens. 2013, 46, 571–582. [Google Scholar] [CrossRef]
- Barrington, L.; Ghosh, S.; Greene, M.; Har-Noy, S.; Berger, J.; Gill, S.; Lin, A.Y.-M.; Huyck, C. Crowdsourcing earthquake damage assessment using remote sensing imagery. Ann. Geophys. 2012, 54. [Google Scholar] [CrossRef]
- Alparone, L.; Baronti, S.; Garzelli, A.; Nencini, F. A global quality measurement of pan-sharpened multispectral imagery. IEEE Geosci. Remote Sens. Lett. 2004, 1, 313–317. [Google Scholar] [CrossRef]
- Khan, M.M.; Alparone, L.; Chanussot, J. Pansharpening quality assessment using the modulation transfer functions of instruments. IEEE Trans. Geosci. Remote Sens. 2009, 47, 3880–3891. [Google Scholar] [CrossRef]
- Amintoosi, M.; Fathy, M.; Mozayani, N. Precise image registration with structural similarity error measurement applied to superresolution. EURASIP J. Adv. Signal Process. 2009, 2009, 1–7. [Google Scholar] [CrossRef]
- Fernandez Galarreta, J.; Kerle, N.; Gerke, M. UAV-based urban structural damage assessment using object-based image analysis and semantic reasoning. Nat. Hazards Earth Sys. Sci. 2015, 15, 1087–1101. [Google Scholar] [CrossRef]
- Vetrivel, A.; Gerke, M.; Kerle, N.; Vosselman, G. Identification of damage in buildings based on gaps in 3D point clouds from very high resolution oblique airborne images. ISPRS J. Photogramm. Remote Sens. 2015, 105, 61–78. [Google Scholar] [CrossRef]
- Kerle, N.; Hoffman, R.R. Collaborative damage mapping for emergency response: The role of cognitive systems engineering. Nat. Hazards Earth Syst. Sci. 2013, 13, 97–113. [Google Scholar] [CrossRef]
- Eguchi, R.T.; Huyck, C.K.; Ghosh, S.; Adams, B.J.; McMillan, A. Utilizing New Technologies in Managing Hazards and Disasters Geospatial Techniques in Urban Hazard and Disaster Analysis; Springer: Houten, The Netherlands, 2010; pp. 295–323. [Google Scholar]


| Acquisition Date | Sensor | Viewing Angle |
|---|---|---|
| 11 April 2015 | PMS-1 | 0° |
| 27 April 2015 | PMS-2 | −24° |
| 1 May 2015 | PMS-1 | −23° |
| 2 May 2015 | PMS-1 | 23° |
| Parameter | PMS-1/PMS-2 Sensor | |
|---|---|---|
| Spectral range | PAN | 0.45–0.90 μm |
| MS | 0.45–0.52 μm | |
| 0.52–0.59 μm | ||
| 0.63–0.69 μm | ||
| 0.77–0.89 μm | ||
| Spatial resolution | PAN | 2 m |
| MS | 8 m | |
| Category | Spectral Angle Difference | Euclidean Distance Difference | ||||||
|---|---|---|---|---|---|---|---|---|
| PCA | Wavelet | GS | OptVM | PCA | Wavelet | GS | OptVM | |
| Red roof | 29.75 | 25.71 | 30.10 | 19.13 | 0.066 | 0.108 | 0.065 | 0.044 |
| Water | 41.33 | 16.79 | 42.00 | 13.04 | 0.056 | 0.058 | 0.055 | 0.028 |
| Grass | 26.65 | 10.72 | 28.53 | 5.48 | 0.068 | 0.048 | 0.075 | 0.017 |
| Roof | 39.01 | 14.90 | 37.87 | 9.49 | 0.063 | 0.059 | 0.060 | 0.023 |
| Road | 26.44 | 12.37 | 26.70 | 7.94 | 0.051 | 0.050 | 0.054 | 0.030 |
| Bare land | 26.44 | 9.00 | 26.70 | 7.75 | 0.051 | 0.039 | 0.054 | 0.031 |
| Index | PCA | Wavelet | GS | OptVM |
|---|---|---|---|---|
| ERGAS | 4.118 | 6.551 | 4.214 | 3.485 |
| SAM | 3.566 | 2.957 | 3.656 | 2.492 |
| Q4 | 0.533 | 0.527 | 0.846 | 0.894 |
| QNR | 0.878 | 0.886 | 0.86 | 0.931 |
| Index | SIFT | ENVI | SIFT-OFM |
|---|---|---|---|
| SSIM | 0.6266 | 0.6415 | 0.7442 |
| Method | Number of Regions | Change Category | Number of Regions |
|---|---|---|---|
| Total detected change | 758 | ||
| Visual interpretation checking real change | 556 | Damage Building(collapsed) | 21 |
| Tent/shelter | 396 | ||
| Cars or other temporary feature | 139 | ||
| Visual interpretation checking error change | 202 | changes as different view angles | 112 |
| change as undetected thin cloud or shadow | 34 | ||
| other error detected changes | 56 |
© 2016 by the authors; licensee MDPI, Basel, Switzerland. This article is an open access article distributed under the terms and conditions of the Creative Commons by Attribution (CC-BY) license (http://creativecommons.org/licenses/by/4.0/).
Share and Cite
Ma, Y.; Chen, F.; Liu, J.; He, Y.; Duan, J.; Li, X. An Automatic Procedure for Early Disaster Change Mapping Based on Optical Remote Sensing. Remote Sens. 2016, 8, 272. https://doi.org/10.3390/rs8040272
Ma Y, Chen F, Liu J, He Y, Duan J, Li X. An Automatic Procedure for Early Disaster Change Mapping Based on Optical Remote Sensing. Remote Sensing. 2016; 8(4):272. https://doi.org/10.3390/rs8040272
Chicago/Turabian StyleMa, Yong, Fu Chen, Jianbo Liu, Yang He, Jianbo Duan, and Xinpeng Li. 2016. "An Automatic Procedure for Early Disaster Change Mapping Based on Optical Remote Sensing" Remote Sensing 8, no. 4: 272. https://doi.org/10.3390/rs8040272
APA StyleMa, Y., Chen, F., Liu, J., He, Y., Duan, J., & Li, X. (2016). An Automatic Procedure for Early Disaster Change Mapping Based on Optical Remote Sensing. Remote Sensing, 8(4), 272. https://doi.org/10.3390/rs8040272