Abstract
This work concerns a proposal of the integration of InSAR (Interferometric Synthetic Aperture Radar) data acquired by ground-based (GB) and satellite platforms. The selected test site is the Åknes rockslide, which affects the western Norwegian coast. The availability of GB-InSAR and satellite InSAR data and the accessibility of a wide literature make the landslide suitable for testing the proposed procedure. The first step consists of the organization of a geodatabase, performed in the GIS environment, containing all of the available data. The second step concerns the analysis of satellite and GB-InSAR data, separately. Two datasets, acquired by RADARSAT-2 (related to a period between October 2008 and August 2013) and by a combination of TerraSAR-X and TanDEM-X (acquired between July 2010 and October 2012), both of them in ascending orbit, processed applying SBAS (Small BAseline Subset) method, are available. GB-InSAR data related to five different campaigns of measurements, referred to the summer seasons of 2006, 2008, 2009, 2010 and 2012, are available, as well. The third step relies on data integration, performed firstly from a qualitative point of view and later from a semi-quantitative point of view. The results of the proposed procedure have been validated by comparing them to GPS (Global Positioning System) data. The proposed procedure allowed us to better define landslide sectors in terms of different ranges of displacements. From a qualitative point of view, stable and unstable areas have been distinguished. In the sector concerning movement, two different sectors have been defined thanks to the results of the semi-quantitative integration step: the first sector, concerning displacement values higher than 10 mm, and the 2nd sector, where the displacements did not exceed a 10-mm value of displacement in the analyzed period.
1. Introduction
On the basis of recent evaluations, landslides represent the most frequent geo-hazard, occurring worldwide more frequently than any other natural disaster, including earthquakes and volcanic eruptions [1]. Landslides pose great threats to human lives, causing thousands of deaths and injured people every year (e.g., [2,3,4]). Moreover, every year, landslides cause billions of dollars (e.g., [5,6,7]) of direct and indirect socio-economic losses, in terms of property and infrastructure damage and environmental degradation.
In addition, landslide disasters show a documented increasing trend, mainly owing to the over exploitation of natural resources, improper land use planning and growing urbanization, which determines an increase in the population exposed to the landslide risk [8]. In this sense, the effort of the scientific community is focused on determining every possible measure of risk mitigation.
At the basis of the risk mitigation strategies, there is the deep knowledge of the phenomena, which, in the landslide field, is related to monitoring activities. Dealing with landslides, monitoring activities rely on the measurement of displacement fields in order to assess the temporal evolution and spatial distribution of moving areas.
This type of information represents key parameters to geometry and kinematics assessment of a mass movement; it is of great value especially in those urbanized areas endangered by movement and where the investigated phenomenon is going to threat valuable elements at risk.
Remote sensing and Earth observation (EO) data have a major role to play for studying geohazard-related events at different stages, such as detection, mapping, hazard zonation, modeling, prediction and monitoring.
During the last decade, different monitoring and remote sensing techniques, devoted to landslide analysis, have undergone rapid development. Among them, Interferometric Synthetic Aperture Radar (InSAR) techniques have seen an increasingly greater spread. Firstly conceived of and developed for data acquired from space-borne platforms, InSAR methods were later applied also on ground-based platforms (GB-InSAR). Especially as regards landslide and unstable slope monitoring activities, GB-InSAR systems have become more and more popular over the last few years [9,10,11].
InSAR techniques belong to the family of active remote sensing techniques, and thanks to their intrinsic characteristics, they present many advantages in the field of landslide monitoring and management with respect to conventional, geodetic techniques.
Among the several advantages that could be counted, the possibility to collect systematic and easily updatable acquisitions and to produce time displacement maps of several square kilometer wide areas can be considered the crucial benefits of these techniques. Moreover, they are able to observe the investigated instable areas under any light and weather conditions, obtaining displacement measurements with high precision.
PS-InSAR (Permanent Scatterer InSAR) [12,13] was the first technique, developed by TRE (TeleRilevamento Europa), specifically implemented for the processing of several (at least 15 or more) co-registered, multi-temporal space-borne SAR images of the same target area.
This kind of technique is useful in order to obtain the deformation time series and the deformation velocity of stable reflective point-wise targets, called PS, with respect to a reference point considered as stable. These targets are represented by hand-made artifacts (e.g., buildings, railways) and/or natural targets, such as rocky outcrops. The measurement of the PS displacement occurs along the satellite line of sight (LOS).
Specifically, the precision on the deformation rate is about 0.1–1 mm/y [12,13,14,15,16,17] by using satellite InSAR techniques.
Several other approaches have been proposed for the processing of multi-interferometric long series of SAR images; most of them have been satisfactorily compared by [16] and by [18].
Among the several approaches, the Small BAseline Subset (SBAS) technique uses small baselines, multilook data and a coherent-based selection criterion [18,19].
The ground-based SAR interferometer (GB-InSAR) is a terrestrial system that emits and receives microwaves moving along a rail track, multiple times [9,10,11,20,21]. Its cross-range resolution is directly proportional to the length of the rail. This kind of sensor measures both the amplitude and the phase of the radar signal. The phase can be profitably used in order to monitor ground deformation. The GB-InSAR can acquire an image every few minutes, allowing the monitoring of faster movements with respect to the satellite sensors. As regards GB-InSAR techniques, they are able to acquire sub-millimetric deformation rates [11]. Finally, the possibility to retrieve the temporal evolution of a single landslide(s) system without physical access to the unstable slope or the necessity of positioning any targets on the ground is a great advantage when the observed area is a steep, mountainous slope [22,23,24].
In this paper, in order to improve the applicability of InSAR techniques in the field of landslide monitoring, a proposal of the integration between ground-based and satellite InSAR datasets is presented. The integration is possible thanks to the intrinsic features of the techniques, which can be considered partially complementary, in terms of spatial and temporal resolution.
The integration procedure is based on three main steps: a qualitative integration, with the implementation of a geodatabase to differentiate stable from unstable areas; a semi-quantitative integration, which is based on data homogenization and evaluation of macro-areas with different displacement values; and a quantitative integration, where data can also be analyzed in terms of time series, which can be used to apply forecasting algorithms. This third step is possible only if high precision long time series data are available.
In this work, the Åknes test site has been selected to apply the first and second steps of the proposed procedure. The Åknes rockslide is located on the western coast of Norway, a country highly susceptible to large rockslides due to its numerous fjords, steep topography and high relief [25]. The Åknes rockslide is an unstable mass rock of about 50 million m3 [26]. The unstable area represents a threat, in case of collapse, for the several communities located on the same fjord (Sunnylvsfjorden), mainly in terms of a possible induced tsunami. The availability of GB-InSAR and satellite InSAR data, with a period of overlapping measurements, makes the rockslide suitable to test the proposed integration procedure, in its first and second steps. Thanks to the implementation of this new approach, more precise information on the ground displacement pattern was obtained, together with an implementation in data coverage on the observed scenario. These improvements could be helpful in risk mitigation strategies.
2. Materials and Methods
2.1. Data Integration
The intrinsic features of ground-based and satellite InSAR techniques, in terms of both their advantages and limitations, make them particularly suitable to be applied together in the field of landslide mapping, monitoring and risk management [27,28,29]. These techniques are indeed in a way that is complementary and suitable to be used in a synergistic way. On the one hand, satellite InSAR techniques are useful for monitoring unstable areas under specific conditions: the main limitations related to its applicability regard the satellite revisiting time, the slope exposure with respect to the sensor LOS and the velocity of the investigated movements with respect to the wavelength and the repeat-pass interval [30]. Due to the inherent limitations of current space observation systems and relevant data processing technique, satellite InSAR techniques are currently applicable only to two classes of the Cruden and Varnes (1996) [31] classification: extremely slow and very slow movements (velocity < 16 mm/y and 16 mm/y ≤ velocity < 1.6 m/y, respectively). Nevertheless, the satellite InSAR technique ability of measuring very slow and smooth ground displacements represents a valuable support to landslide hazard prevention activities over wide areas, giving the opportunity to detect extremely slow, precursor movements that usually occur several weeks or months before the catastrophic failure, preceding major landslide disasters [32,33]; in the case of moving rockslides, the technique can also be useful to detect acceleration phases (tertiary creep) [34]. On the other hand, GB-InSAR allows a continuous monitoring of the displacements ranging from a few millimeters per day up to 1 or more meters per day, on a more local scale [11]. Furthermore, the instrument flexibility enables the investigation of shadow areas of hillsides not illuminated by the beam of the satellite radar sensor, and it allows to choose, during the installation phase, the best line of sight (LOS). These characteristics make this technique particularly useful for emergency phases [35].
Because of the above-mentioned characteristics and differences, the integration of these techniques enables us to obtain useful information on ground displacement patterns, with high precision and improved spatio-temporal resolution and coverage, compared to the stand-alone use of each technique.
In this paper, an attempt to define a procedure to integrate ground-based and satellite InSAR datasets is described, in order to use the results of both techniques, in those areas where both data are available, as in the case of the Åknes test site.
A schematic description of the proposed integration methodology is shown in Figure 1.
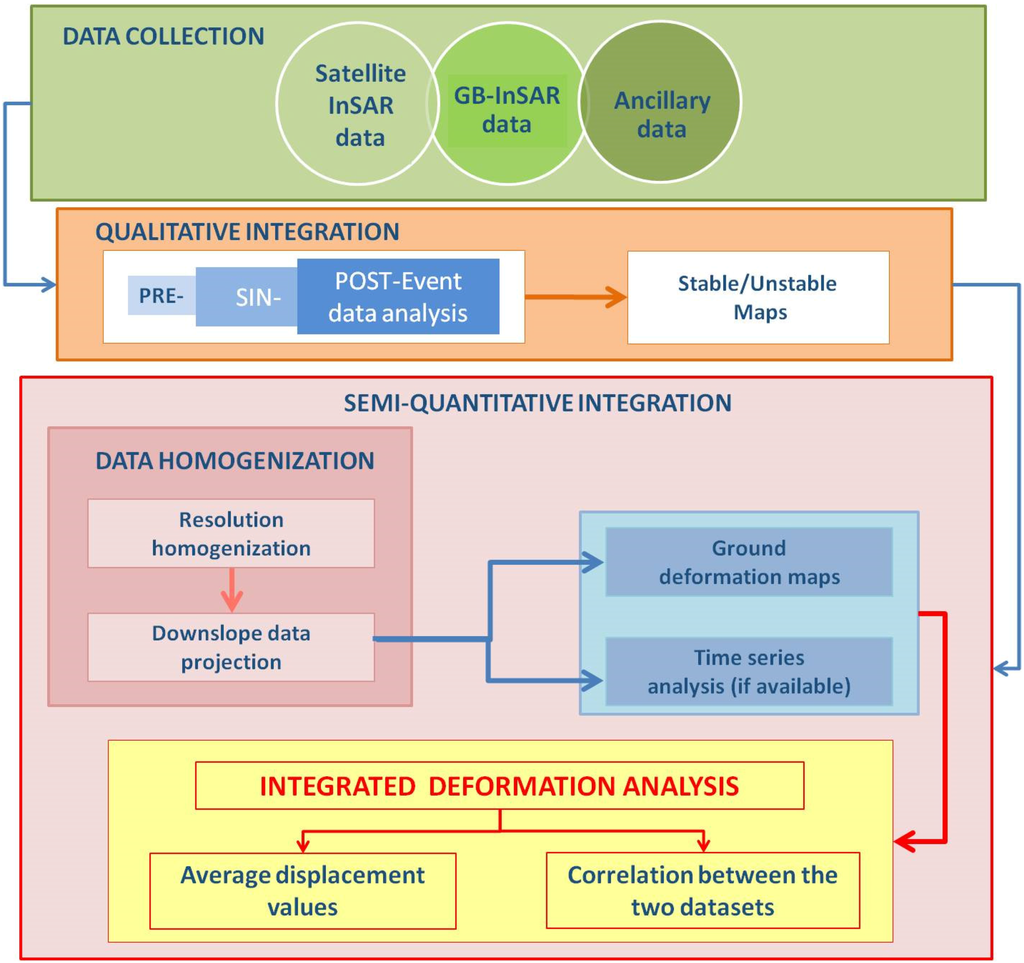
Figure 1.
Schematic representation of the proposed integration methodology.
Data integration is performed during the post-processing phase, and it can be achieved by using a qualitative and/or a semi-quantitative approach.
2.1.1. Qualitative Integration
The qualitative approach is preparatory, allowing the collection of more information about displacements, also in those areas concerning shadowing if observed using only a single dataset.
Therefore, a preliminary phase is characterized by data collection, including the acquisition of ancillary data (i.e., orthophotos of the study area, pre-existing landslide inventory maps, the results of geological and geomorphological field surveys, etc.) and the available SAR data, acquired both from space-borne and ground-based platforms (Figure 1).
In case of landslide collapse, datasets are distinguished, on the basis of the acquisition time, in pre-, during and post-event datasets, and they are compared with each other considering the time span to which they refer. Generally, SAR satellite data cover longer periods than GB-InSAR data, thanks to the existence of historical archives resulting from the spatial missions carried out over recent years, starting from 1992 with the launch of the ERS-1 satellite.
On the other hand, ground-based systems generally provide post- or at least during event data, because they are usually installed in emergency phases, when the landslide has already collapsed. An exception is represented by rockslides, which are often monitored also during the pre-collapse phase, to detect acceleration phases, as in the case of the Åknes rockslide.
By using GIS (Geographical Information System) platforms, InSAR data can be easily observed in a two-dimensional geo-referred space. Integrated satellite and ground-based displacement maps can be performed to distinguish the areas characterized by displacements from the areas without evidence of movements, following a binary approach (stable/unstable). The combined use of satellite and ground-based SAR data can provide ground displacement measurements with higher spatio-temporal resolution and coverage than the stand-alone use of the techniques, which can be satisfactorily applied for mapping and monitoring landslide phenomena [27,36].
In order to validate the integration methodology, the results can be qualitatively compared to the available ancillary data or to the results of scheduled field surveys.
2.1.2. Semi-Quantitative Integration
Moving to the semi-quantitative approach, as the first step, it is necessary to take into account the different temporal and spatial resolutions of compared datasets, in terms of time and space. Therefore, firstly, data have to be homogenized. The level of homogenization that is possible to obtain defines the integration accuracy.
Generally, datasets with finer temporal resolution are re-sampled, reducing their resolution to values comparable to the ones of the other datasets. For example, with respect to the satellites (in the best conditions, new generation sensors are able to acquire every day [37]), ground-based systems have a better resolution; they are indeed able to acquire several times per day; however, ground-based datasets are rescaled to become comparable to data acquired by space-borne sensors. The same happens for the spatial resolution, where data are re-sampled referring to the pixel size of data with coarser resolution (generally satellite data).
Another important limitation on the quantitative integration is related to the intrinsic feature of the technique to be capable of acquiring only the LOS component of displacements. With more than 2 viewing geometries, the real displacement vector can be obtained as proposed by Wright et al., 2004 [38]. With a range of approximation, 2 geometries could be enough to compute the real displacement vector components [38]. In the best conditions, satellite data are available in two different acquisition geometries: ascending and descending. Combining the information obtained by these different geometries, it is possible to extract the vertical and horizontal (in the east-west direction) components of the movement [39]. Therefore, two of the three components of the real vector displacement are identified; these two components allow the detection with a good approximation of the real displacement vector. Once the “almost real” displacement vector is identified, satellite data are compared to ground-based datasets, in order to calculate the displacement percentage also detected by GB-InSAR systems. Generally, because of the different acquisition geometries, space-borne sensors are able to estimate a small component of the 3D real motions; on the contrary, ground-based platforms are able to detect a big part of the real vector of displacement by using an LOS as parallel as possible to the displacement direction.
Usually, satellite datasets are often available in only one of the possible configurations (ascending or descending). In these very frequent cases, satellite and ground-based data are projected on a common direction, considered as the most probable direction, along which the real displacement develops. Generally, this direction is approximately considered the downslope direction; it is almost true if the investigated phenomena have a surface rupture as parallel as possible to the topography, which is typical of translational slides. The methodology used for the projection is based on a simplified formula with respect to the equation introduced by [38]; the proposed method is described in [40] and later in [27,41,42]. The input data consist of the angular values of aspect and slope (derivable from the digital terrain model) of the area affected by the investigated landslide phenomena and the azimuth angle and the incidence angle of the LOS, both from the satellite and the GB-InSAR.
After calculating the direction cosines of LOS and slope (respectively functions of azimuth and incidence angles and aspect and slope angles) in the directions of zenith (Zlos, Zslope), north (Nlos, Nslope) and east (Elos, Eslope), the coefficient C is defined as follows (Equation (1)):
C = Zlos × Zslope + Nlos × Nslope + Elos × Eslope
C gives information about the portion (percentage) of “real” displacement detected by space-borne/ground-based sensors.
The “real” displacement (Dreal, Equation (2)) is defined as the ratio between the displacement recorded along the LOS (Dlos) and the C value:
Dreal = Dlos/C
By using the MATLAB interface, an automation of the projection procedure is obtained.
In some cases, the projection algorithm could be applied to a set of angular conditions in which the LOS and the downslope angle directions are nearly perpendicular: in these situations, the projection could lead to large estimate errors, especially when small movements in the LOS are processed. These particular values, for simplicity called “outliers” (Figure 2), can be highlighted by applying a filter on the MATLAB script [43]. This problem is generally more common in satellite datasets, where the LOS is likely to be very different from the downslope direction; it is less common in the case of ground-based projected data, because of the similarity between the GB-InSAR LOS and the downslope direction of the investigated slope.

Figure 2.
Projection geometry of LOS movement on slope direction (A) and the definition of outlier angle range (B) (modified from [39]).
Finally, the result of data integration by using a semi-quantitative approach consists of the production of ground deformation maps or ground velocity maps in relation to the projected input data (displacement or velocity values). These maps, containing the information related to both satellite and ground-based InSAR data, can also be superimposed on ancillary data. An additional step in the quantitative approach to the integration methodology is represented by the time series analysis, in case of the availability of long time series; comparing displacement/velocity time series of selected points on the ground deformation/velocity maps allows the quantitative information deriving from projected data to be increased. The points, selected for extracting time series, are generally chosen in areas where the radar signal is characterized by high stability, a high signal/noise ratio, high power and coherence parameters.
For these high quality points, both the satellite- and ground-based time series can be analyzed and compared.
2.2. Åknes Test Site
2.2.1. Location
The Åknes rockslide is located in the northwestern side of Sunnylvsfjorden, a branch of the Storfjorden, on the western Norwegian coast (Figure 3). It is considered one of the most hazardous rockslide areas in Norway [44], including about 50 million m3 of rock [26], characterized by continuous creep. The location of the landslide body, which develops above the fjord and near several communities, makes the surrounding area exposed to a high level of risk, mainly in terms of a possible tsunami, induced by the collapse of rock material into the fjord [45,46]. The area also represents one of Norway’s most visited tourist attractions, thanks to the natural beauty of the mentioned fjord (the nearby Geirangerfjord is listed on UNESCO’s World heritage list). The importance of the study area makes Åknes one of the most investigated and monitored rockslides in the world.

Figure 3.
Åknes rockslide location on the Norwegian coast (A) and zoom on the area affected by the rockslide, whose location is emphasized by a red polygon (B).
2.2.2. Geological and Geomorphological Setting
From a geological point of view, the Åknes rockslide is located in the Western Gneiss Region of Norway. Gneisses of Proterozoic age represent the bedrock’s dominant lithology of the area, and they exhibit the effects of alteration and reshuffle suffered during the Caledonian orogeny [47].
The geological setting of the area, especially as regards gneisses lithologies, is characterized by intense foliation, which strongly contributes to determine slope instability; the main cracks are indeed developed along foliation plans [48].
Various sub-domains can be distinguished in the rockslide body [44].
Kristensen et al. [49] identified two main sectors based on different deformation patterns and consequently different risk scenarios. The first scenario corresponds to the upper portion of the slope, and it is characterized by higher displacement values with respect to the second scenario, which corresponds to the middle sector of the slope; nowadays, the lower part of the slope is not affected by significant deformation [44]; therefore, it is not taken into account in this work (Figure 4).

Figure 4.
Rockslide distinction in two different risk scenarios and its delimitation taking into account the main detected geomorphological features [44,50].
As regards the deformation pattern, the upper part of the landslide is mainly concerning extension forces, in contrast to the lower part, which is characterized by generalized compression. The upper zone is delimited by a back scarp, which is controlled by pre-existing foliation planes or pre-existing fractures; the major upper crack is about 800 m long. The basal sliding surface seems to be controlled by foliation, as well; it dips 30°–35° to S-SSE, and it extends almost parallel to the topography. A steeply-dipping, NNW-SSE-trending fault defines the western boundary, and the eastern boundary is defined by a gently-dipping, NNE-SSW-trending fault [44]. The toe location is not so clear, but it can be approximately located at 75–100 m a.s.l. [50] (Figure 4).
More information about the rock slope geological setting can be found in [51,52,53] and in [54], where the results of extensive field and non-field work activities are summarized, such as geological and geophysical investigations, numerical modelling, etc.
2.3. Available Datasets
2.3.1. GB-InSAR Monitoring Activity
Åknes is one of the most studied rockslides in the world.
It takes advantage of one of the best organized early warning systems, which, in turn, can exploit a really complete monitoring network [55,56].
Moreover, starting from 2006, GB-InSAR campaigns have also been performed, in the context of the Åknes/Tafjord project (now part of the Norwegian Water Resources and Energy Directorate, in Norwegian Norges vassdrags- og energidirektorat (NVE) [57]). The instrument was provided by the Italian Society Ellegi LiSALab s.r.l. [58]. Five GB-InSAR campaigns have been achieved, specifically in the summer seasons of 2006, 2008, 2009, 2010 and 2012 (Table 1).

Table 1.
Dates of ground-based (GB)-InSAR campaigns.
The system was installed on the opposite side of the fjord with respect to the rockslide, in a location named Oaldsbygda (Figure 5), equipped with an Internet network and a power supply. Very strong atmospheric effects concern the images acquired from this location, because of the sudden and very fast changes of local atmospheric conditions on the fjord, which is crossed by the radar signal during the acquisitions. Because of these technical problems, the nominal sub-millimetric accuracy of GB-InSAR systems is here reduced to millimetric accuracy. The stability threshold value has been fixed at 2 mm. Technical features of the GB-InSAR system are listed in Table 2.
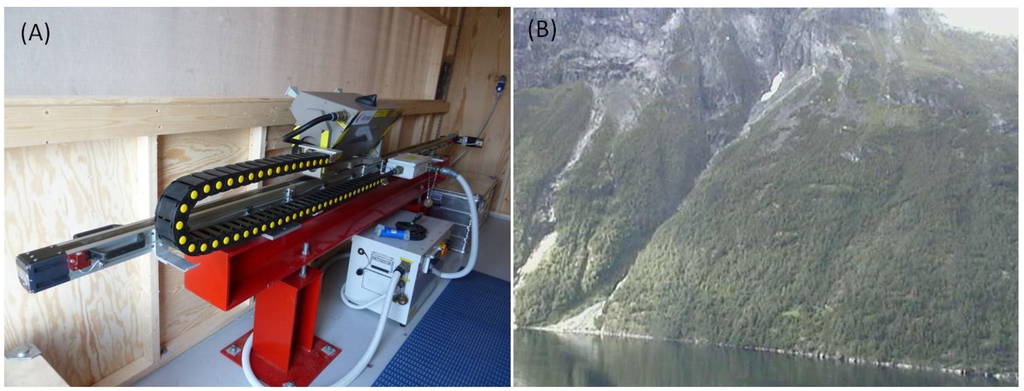
Figure 5.
GB-InSAR system employed at Oaldsbygda (A) and its view of the Åknes slope (B).
Table 2.
Parameters of the employed radar system [49].
Despite the atmospheric disturbance, whose impact was reduced during the processing phase, using proper filters, the availability of several campaigns makes the Oaldsbygda data useful to analyze the evolution of the deformation pattern of the rockslide.
Data recorded during the campaigns with the Oaldsbygda instrument, performed in the spring-summer seasons of 2009, 2010 and 2012, have been selected for the analysis; they have been processed using LiSALab s.r.l. software.
Data have been analyzed in the GIS environment, upon the application of georeferencing transformations on the SAR images.
All campaigns started in July and stopped in October; their duration differs only by a few days. In Figure 6, cumulated displacement maps related to the total period of each acquisition campaign are displayed. Lower in the slope, the correlation is much lower (weak coherence) due to dense vegetation.
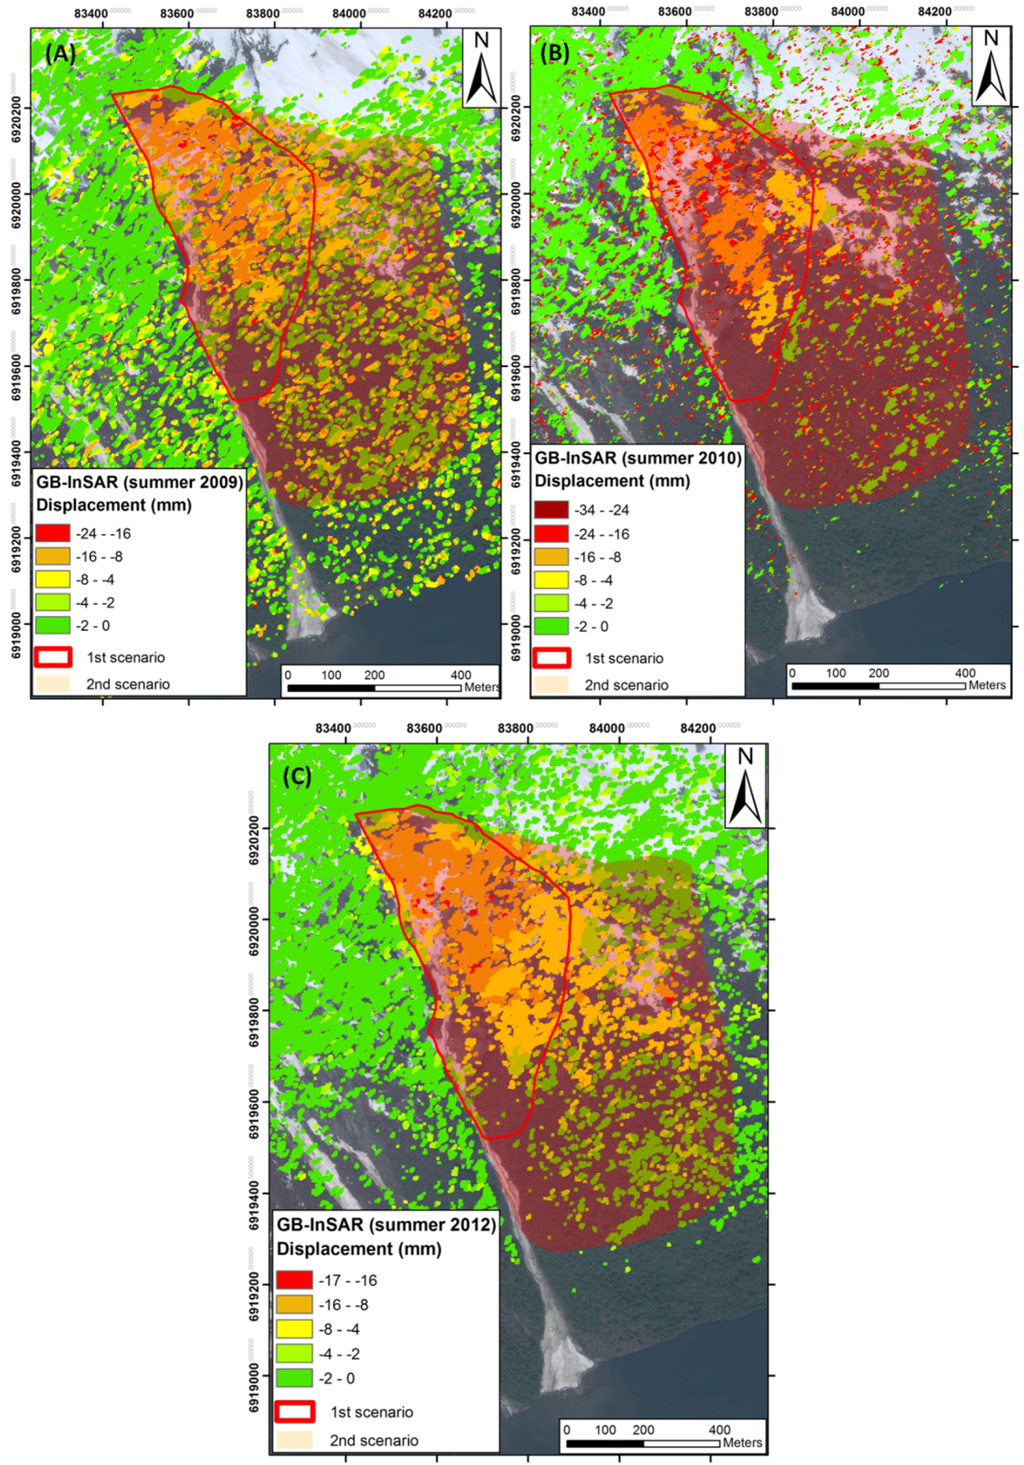
Figure 6.
Cumulated displacement maps of GB-InSAR campaigns from Oaldsbygda. (A) Time interval of 108 days, between July and October 2009; (B) time interval of 114 days, between July and October 2010; (C) time interval of 104 days, between July and October 2012. Negative displacements represent movements approaching the sensor.
The maps in Figure 6 show a quite consistent deformation pattern, measured from year to year with a maximum of 34 mm in about a 4-month interval from July–October 2010. In greater detail, movements mainly concern the upper portion of the rockslide (1st scenario in Figure 4), reaching values of about 24 mm in the period between July and October 2009, about 34 mm during July–October 2010 and about 17 mm in 2012, during the same months. The GB-InSAR ability to detect only the LOS (line of sight) component of the displacement vector [11] has been partially overcome by comparing GB-InSAR data with GPS datasets [49,54]: this comparison allowed estimating the percentage of real displacement detected by the Oaldsbygda instrument, thanks to the possibility to record a 3D displacement vector with GPS instruments (Table 3). GPS locations are displayed by arrows in Figure 7.
Table 3.
Displacement registered by GPSs (from [54]) compared to average displacement registered by GB-InSAR (mm/y) at GPS locations (GPS locations are as shown in Figure 7; G1 represents the base station location).

Figure 7.
Location of GB-InSAR instrument and relative field of view. Black arrows refer to in situ instruments (GPS); their size is proportional to the percentage of displacement, registered by GPS instruments, and detected by GB-InSAR. The upper portion of the slope is less detectable (about 30%) than the lower sector (about 70%) from the GB-InSAR location. Background ortophoto is obtained from Virtual Earth imagery; GPS data from [49].
Comparison results show that, from Oaldsbygda, the central part of the rockslide is highly detectable by GB-InSAR, which is able to identify about 70% of the real displacement, as recorded in Table 3 (bigger arrows in Figure 7). The upper sector of the landslide is mainly affected by vertical movements; therefore, in this area the instrument of Oaldsbygda is able to detect only 30% of the displacement (Table 3; smaller arrows in Figure 7).
2.3.2. Satellite InSAR Monitoring Activity
In the case of satellite InSAR acquisitions, as well as in the case of GB-InSAR monitoring activities, the vegetation cover that affects the lower part of the landslide causes a loss of coherence in the radar signal. Moreover, the available satellite InSAR datasets present non-optimal LOS for measuring the horizontal component of the movement. Generally, Earth observing satellites, flying in polar orbits, have a direction close to NS; in this condition, horizontal displacements are almost undetectable because of their deep incident angles; moreover if snow or vegetation cover concerns the observed area or if there is high variability in soil moisture, the loss in coherence of the radar signal negatively influences radar images. These unfavorable conditions widely concern mountainous Norwegian regions.
In the specific case of Åknes, two datasets are available, acquired by RADARSAT-2 (14 images) and by a combination of TerraSAR-X and TanDEM-X (13 images), both in ascending orbit, which is the best configuration to avoid layer effects in east-facing slopes’ observations. The LOS of both the satellites ranges between 76° and 77° in azimuth and between 25° and 28° in look angle. The RADARSAT-2 dataset includes images acquired between October 2008 and August 2013, with a revisiting time of 24 days; whereas TerraSAR-X/Tandem-X acquisitions are related to a shorter period, between July 2010 and October 2012, with a repeat time of 11 days. Only summer-early autumn periods are meaningful, because in other periods, the snow cover causes interferometric decorrelation (i.e., different scattering properties from one scene to another).
RADARSAT-2 and TerraSAR-X data have been processed [59], applying the SBAS (Small BAseline Subset; [19,60,61]) method.
As for GB-InSAR data, satellite datasets have been compared to GPS data [59]. Considering the small component of displacements detectable by space-borne platforms, the comparison has been implemented projecting GPS data onto the LOS direction of the satellites. Satellite LOSs have indeed angles of about 62° for RADARSAT-2 and 65° for TerraSAR-X/Tandem-X, with respect to the horizontal direction, and an ENE orientation. This acquisition geometry makes the LOS near to perpendicular to the downslope direction.
The comparison provided a good correspondence between mean velocity values registered by satellite and mean velocities registered by GPS instruments, which have been estimated to reach approximately 20 mm/y. The same stability threshold value (±2 mm/y) has been used both for C-band and X-band data, in order to make all of the used satellite data, acquired by different satellite sensors, as comparable as possible. Moreover, this value is acceptable, as it does not exceed the precision of the satellite InSAR technique. The results also show that RADARSAT-2 datasets are more relevant than TerraSAR-X/Tandem-X datasets, which registered maximum velocity values around 16 mm/y (Figure 8). This discrepancy is partially explained, besides the difference in the covered time periods, considering that, despite the improvement of spatial resolution, the use of X-band sensors’ atmospheric effects may be severe. It is shown that radar with a wavelength shorter than 4 cm is more vulnerable to atmospheric effects. Therefore, the 3 cm-long X band radar is more influenced by rain and cloud than the 5.6 cm-long C band [18,62]. As a consequence, the extraction of phase variations related to displacement for each scatterer can be inaccurate: during phase unwrapping, the component of deformation becomes indistinguishable from terms related to atmospheric effects, leading to the underestimation of the actual deformation patterns. This problem affects more those landslides located in areas affected by persistent rainfall and cloud cover; this is the case of the Åknes rockslide.
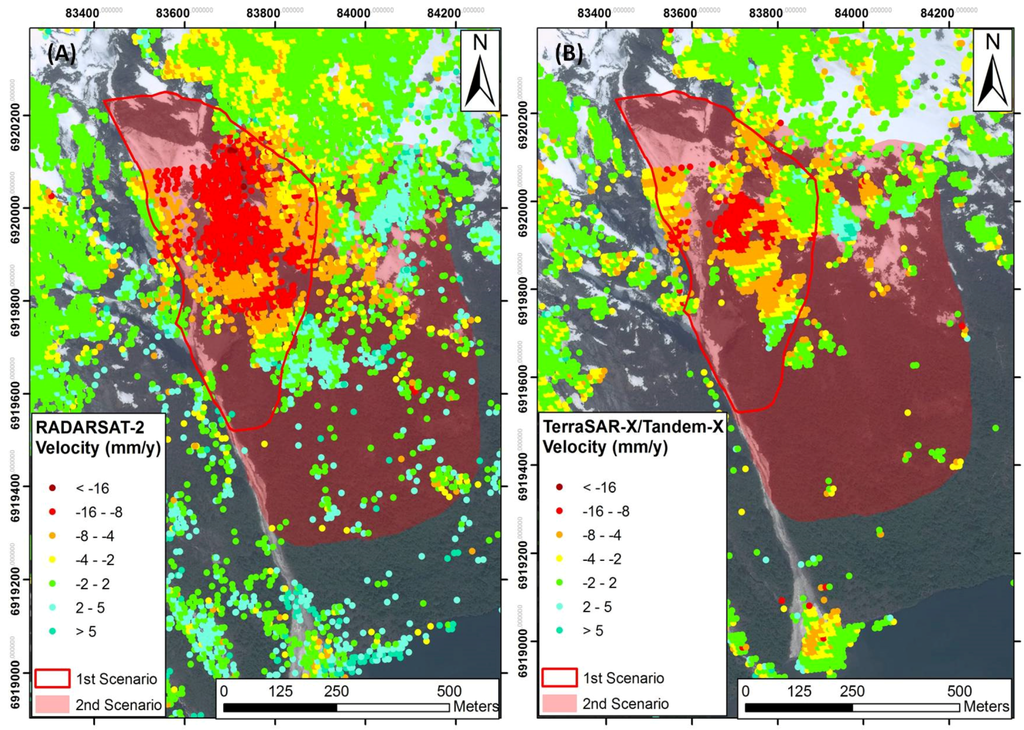
Figure 8.
Mean velocities registered by RADARSAT-2 (A) and TerraSAR-X/Tandem-X (B) between 2010 and 2012 (values detectable on the LOS of the satellites). The red line corresponds to the landslide limit in the most dangerous scenario.
3. Results
The availability of both GB-InSAR and satellite InSAR data, for the overlapping periods of measurements, makes Åknes a suitable case study to test the suggested integration procedure, firstly from a qualitative point of view and later from a semi-quantitative point of view, as proposed in Figure 1.
3.1. Qualitative Integration Results
During the first step of integration, a qualitative analysis of different available data is required. For the Åknes test site, an orthophoto of the study area is available, together with InSAR datasets. Both satellite and GB-InSAR data refer to a pre-event phase, as the Åknes rockslide has not collapsed yet.
Qualitative data integration has been performed in the GIS environment, overlapping all of the available datasets (shown separately in Figure 6, Figure 7 and Figure 8) on the available orthophoto. Data have been classified into two categories, to distinguish stable areas from unstable areas, independent of data type and relative reference period. The stability threshold has been fixed at 2 mm, according to the accuracy of both the GB-InSAR and satellite InSAR technique (Figure 9).
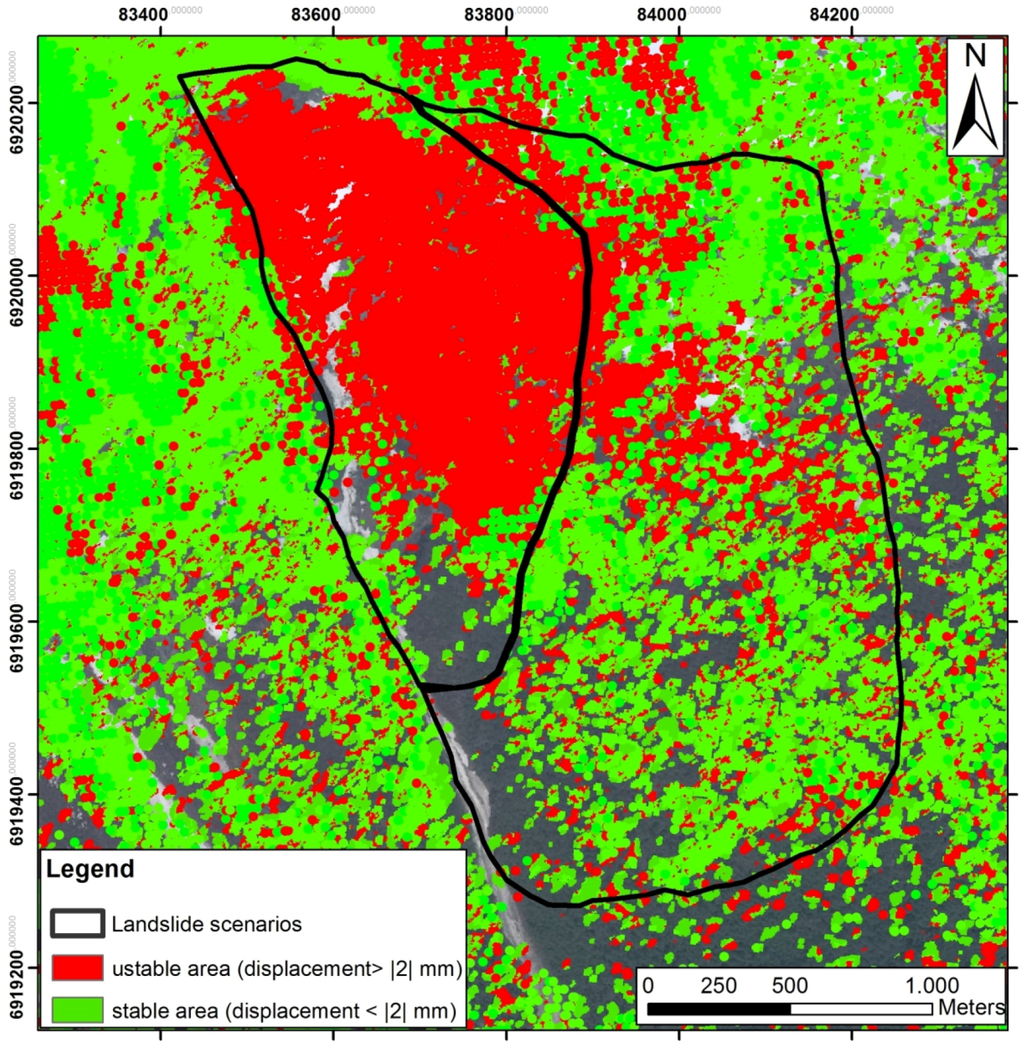
The main advantage of this integration step is in the improved density of measurements, which determines an almost complete coverage of the study area. Moreover, the distinction between stable and unstable areas is strongly emphasized: Figure 9 clearly shows that the main movements occur in the upper portion of the rockslide (first scenario in Figure 4). This area has been selected to apply the proposed integration methodology, in a more quantitative way.
3.2. Semi-Quantitative Integration Results
Among the available datasets, data referring to a period between July and October 2010 have been selected: this period indeed corresponds to the best overlap between GB-InSAR and satellite datasets.
Firstly, data have been homogenized in terms of LOS. Assuming that the most probable displacement direction is the downslope direction, both GB-InSAR and satellite data have been projected along this chosen direction. The downslope direction, especially for the middle part of the landslide, is indeed considered approximately similar to the real displacement direction, as the rockslide movement can be considered parallel to the topographic surface. In the upper part of the landslide, on the contrary, the main component of movement is vertical.
Starting from LOS displacement values, the objective was to evaluate the percentage of displacement detected by the instrument with respect to the downslope direction and to compare these percentages with the displacement values obtained by GPS campaigns (real displacement values) (Table 3; Figure 7).
The results can be summarized in a map showing the percentage of “real” displacement values (considering as “real” the displacements that happen in the downslope direction) detected in each sector of the landslide. Figure 10 shows the percentages of “real” displacement values detected by the Oaldsbygda SAR system. The upper portion of the landslide (emphasized in black in Figure 10) represents an area where the displacement direction is almost vertical and, for this reason, barely detectable along the GB-InSAR LOS (detectable displacement: about 30% of total). In any case, except for the upper sector, it is considered acceptable to assume the downslope direction as the direction of real displacement. The remaining portion of the analyzed rockslide sector seems to be highly detectable by the Oaldsbygda instrument, which can observe, along its LOS, a percentage between 60% and 90% of the “real” displacement vector. The map clearly shows a strong correspondence between the percentage of displacement detectable by GB-InSAR, considering as the “real” displacement direction the downslope direction, and the percentage of displacement detectable by GB-InSAR if compared with real displacement values registered by GPSs (Table 3; Figure 7).
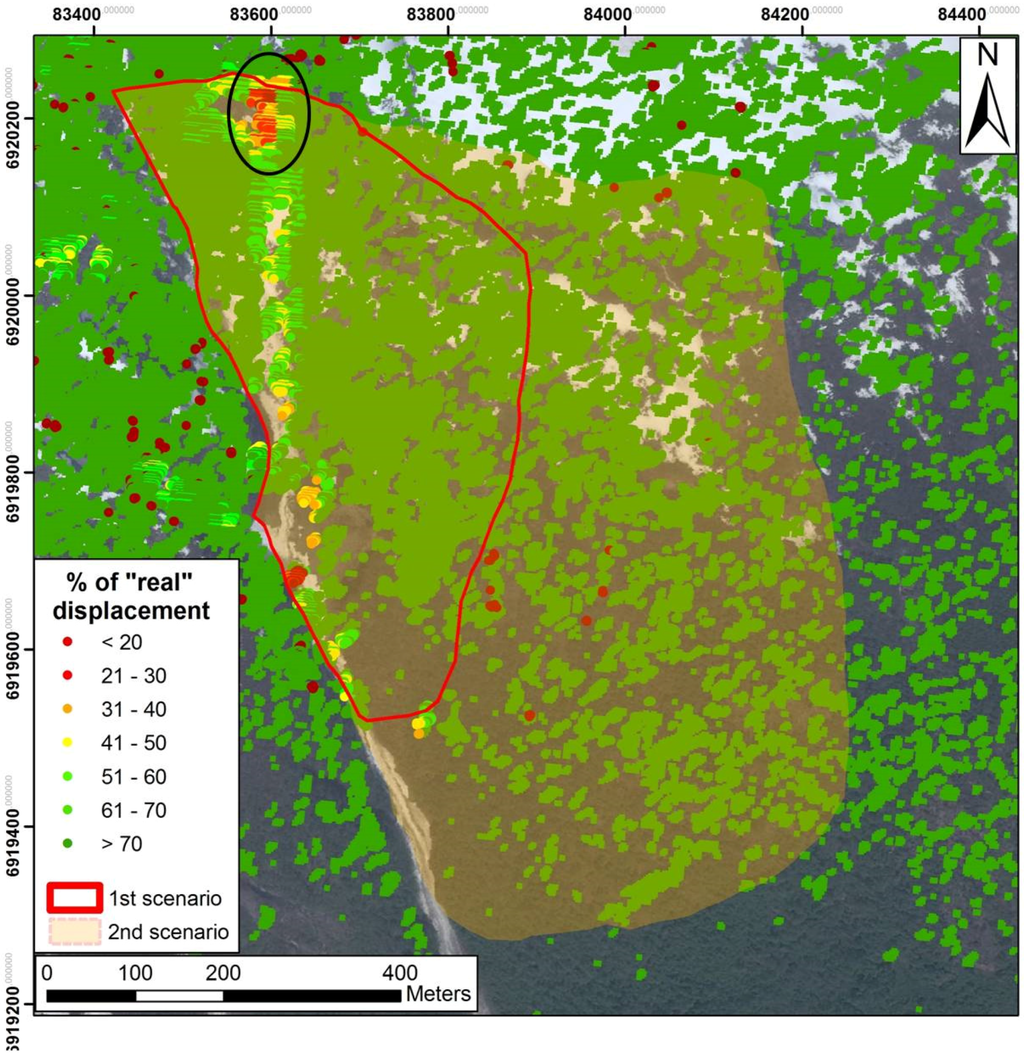
Figure 10.
Map related to the % of “real” displacements detectable along the GB-InSAR LOS, considering as “real” the downslope direction. The sector emphasized by a black oval represents the upper part of the landslide, mainly concerning vertical movements.
Satellite InSAR data have also been projected downslope, following the same procedure applied for GB-InSAR datasets.
Because of the two employed satellite platforms being characterized by similar LOS directions (about 76° and 77° in azimuth and about 25° and 28° in look angle), the results of the projections are almost similar, as well (Figure 11).
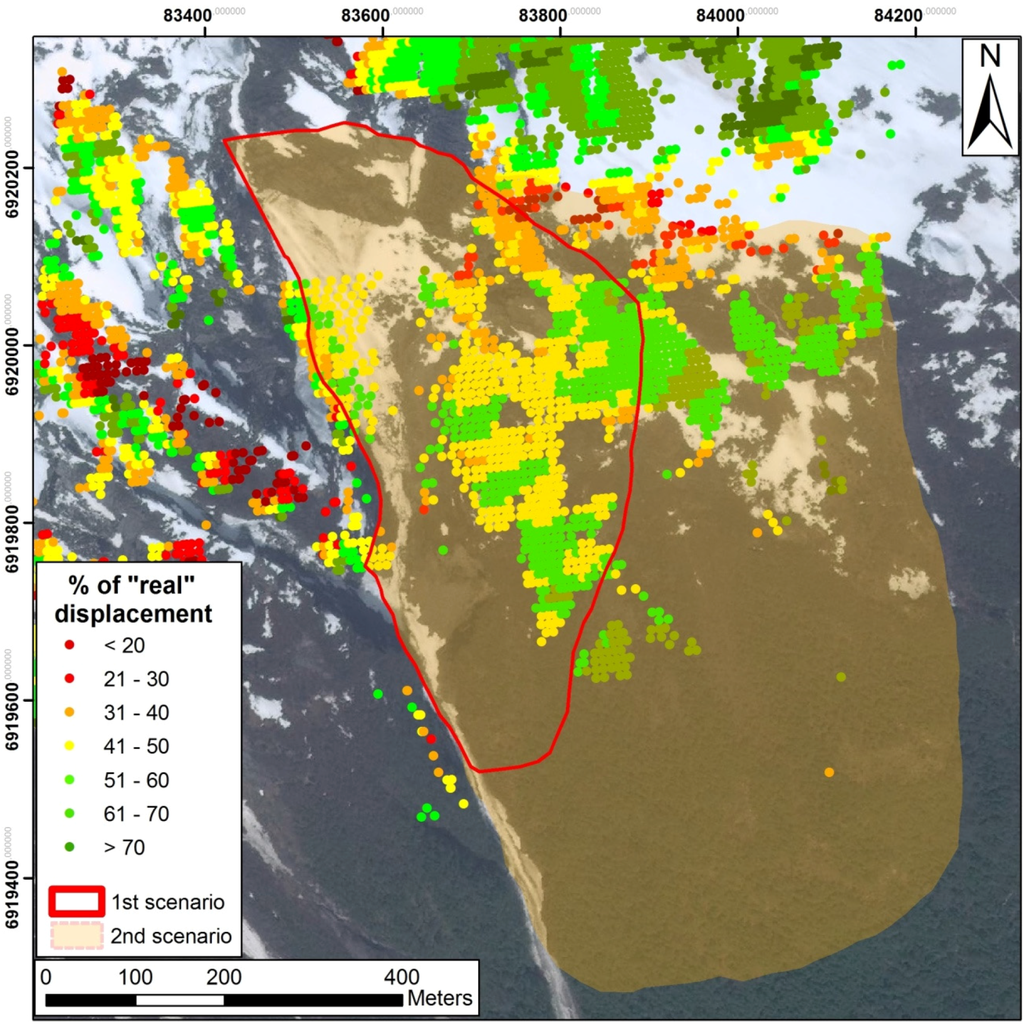
Figure 11.
The % of “real” displacements detected by RADARSAT-2 and TerraSAR-X/Tandem-X satellites. The red line corresponds to the landslide limit in the most dangerous scenario (first scenario in Figure 4).
Along satellites’ LOS, about 40%–50% on average of the “real” displacement is detectable. Instead, the maximum observable displacement corresponds to 60% of its “real” value. The upper part of the landslide, corresponding to the upper crack, is completely not visible from space-borne platforms (shadow area).
After the projection, the GB-InSAR dataset has been resampled in order to make it comparable to satellite data, in terms of temporal and spatial resolution. Finally, slope displacement values have been calculated (Figure 12A).

Figure 12.
(A) Slope displacement (mm) registered by GB-InSAR in the 2010 campaign; (B) slope displacement (mm) registered by RADARSAT-2 in 2010; (C) GB-InSAR and RADARSAT-2 datasets’ integration. The map in (C) shows “real” displacements, detected by the two different platforms; data refer to the period between July and October 2010; the red line corresponds to the landslide limit in the most dangerous scenario (first scenario in Figure 4).
Some observations can be pointed out: first of all, the detectable area from the different sensors is not the same, specifically GB-InSAR data coverage is lower in the middle and lower parts of the slope than the satellite data coverage, which in turn is lacking in the upper part of the landslide, near the major crack. Concerning the displacements, RADARSAT-2 shows very similar patterns to the GB-InSAR datasets (Figure 12A–C). To better compare the datasets, a restricted period of about three months (from July–October 2010) has been selected in the RADARSAT-2 acquisitions, in order to make it comparable to the available data of the 2010 GB-InSAR campaign.
Data projection allowed displaying the two datasets on the same map (Figure 12C). Displacement values have been compared; a stability threshold of 5 mm has been fixed. This threshold value is almost similar to the displacement accuracy of the employed satellite datasets.
Displacement values, detected by RADARSAT-2 and the GB-InSAR, agree to define the “middle” part of the landslide (defining as “landslide” only the portion of the rockslide, which is included in the limits that define the most dangerous possible scenario (first scenario in Figure 4) as concerns the major movement, reaching more than 40 mm of displacement in about three months). The upper part of the landslide, mainly affected by vertical displacements, shows displacement values around 5 mm in the downslope direction: this is probably an underestimation related to the differences between real displacement directions and the downslope direction. A further distinction in two sectors of the first landslide scenario is obtained and presented in Figure 12C. The upper part of the scenario (in red in Figure 12) represents the area concerning higher displacements, with respect to the lower part (in yellow in Figure 12). In Figure 13, the box plots and the histograms of data referring to the two different identified sectors are displayed. In Table 4, basic statistical parameters of the four datasets are displayed. Datasets show high dispersion, with a high number of outliers (very high standard deviations, as shown in Table 4); median values are lower than mean values, indicating negative skewness distributions (Figure 13B–D). Anyway, statistical analysis supports the identification of the two sectors. As regards the first sector, 50% of the GB-InSAR data distribution ranges between |11| mm and |22| mm; it does not differ so much from the RADARSAT-2 dataset, where 50% of the distribution ranges between |9| mm and |21| mm. Mean and median values detected by GB-InSAR for the first sector are respectively |17| mm and |16| mm; whereas mean and median values detected by RADARSAT-2 in the same sector are |18| mm and |13|mm. Generally, these distributions show higher values than datasets related to the second sector, where 50% of the values registered by GB-InSAR range between |6| mm and |11| mm and 50% of the values detected by RADARSAT-2 range between |4| mm and |9| mm. Mean and median values detected by GB-InSAR for the second sector are respectively |10|mm and |9| mm; instead, RADARSAT-2 distribution mean and median values, in the second sector, are |9| mm and |7| mm (Figure 12C and Figure 13, Table 4). Considering these results, in spite of the high dispersion of the distributions, it is possible to assume that the second sector is affected by lower displacement values than the first sector and that the limit between the two sectors can be fixed at |10| mm.

Table 4.
Basic statistic parameters of the analyzed datasets (GB-InSAR data in the 1st and 2nd sectors and RADARSAT-2 data in the 1st and 2nd sectors).
TerraSAR-X/Tandem-X data, referring to the same period (July–October 2010) have also been projected in the downslope direction and organized in order to be comparable to the other datasets (Figure 14).
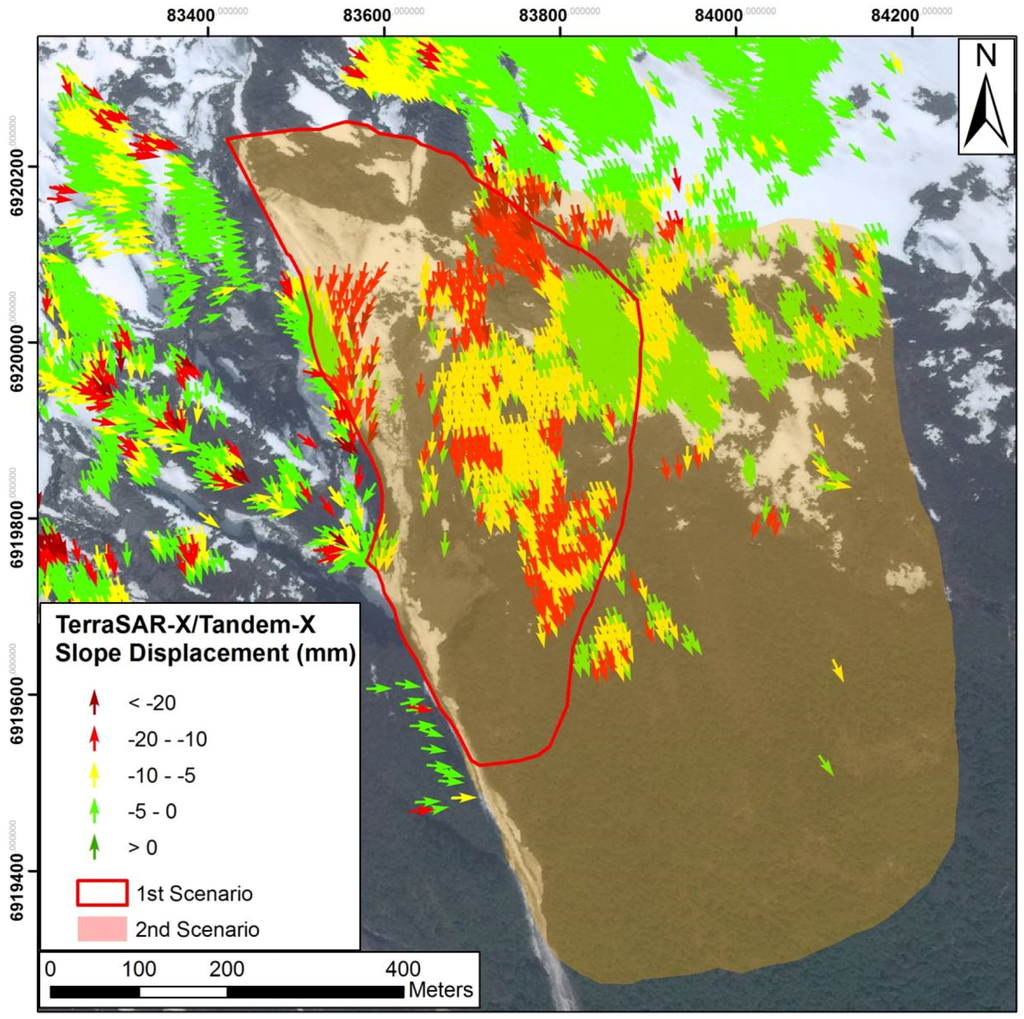
Figure 14.
Slope displacements registered by TerraSAR-X/Tandem-X in 2010. Arrows are oriented along the downslope direction. The red line corresponds to the landslide limit in the most dangerous scenario.
TerraSAR-X/Tandem-X datasets show displacement values lower than values obtained by the RADARSAT-2 platform and GB-InSAR system. This underestimation, as mentioned before, can be mainly related to the higher atmospheric disturbance, concerning new-generation X-band satellites. Anyway, the TerraSAR-X/Tandem-X data comparison with GB-InSAR and RADARSAT-2 datasets can be considered satisfactory from the qualitative point of view.
4. Discussion
The measurement of the superficial displacement of a sliding mass often represents the most effective method for defining its kinematic behavior, allowing one to observe the relationship to triggering factors and to assess the effectiveness of the mitigation measures. Hence, once we suspect an area to be sliding or when dealing with a known landslide, it is mandatory to retrieve accurate and timely updated information on the rate and extent of the occurring deformation. It may be necessary to perform several measurement campaigns to confirm suspected movements, several months to characterize the type of deformation and years of continuous monitoring to fully understand the kinematics of a sliding mass.
Repeat surveys of benchmarks allow the periodic estimation of the extent and rates of deformation. These techniques provide punctual information and are time consuming and resource intensive, since a great deal of time and economic resources are required for timely updates. In most of the cases, these methods produce scattered measurements with an uneven temporal distribution. Indeed, due to the high cost for the establishment and maintenance of an observation network, sparse measurement points are materialized and are infrequently surveyed due to logistics. Considering the characteristics and logistics of the Åknes rockslide, Earth observation and remote sensing have an important role to play for studying landslide-related deformation, as they can regularly measure surface stability over large areas.
It is worth remembering that there is no monitoring system valid for all cases; in fact, every system must be designed purposely for a specific site, because the precursors and monitored parameters may largely vary depending on the type of landslide. Whatever the type of landslide, InSAR-based techniques (both ground based and space borne), thanks to their wide spatial coverage and their millimeter accuracy, are ideally suited to measure the spatial extent and magnitude of landslide-related surface deformation. Outputs from interferometric analysis ensures an almost spatially continuous coverage of information on surface deformation and related hazards. This definitely improves confidence on the spatial pattern of the examined phenomenon.
A further benefit of satellite SAR techniques is the generation of time series of the relative LOS position for each target in correspondence with each SAR acquisition, allowing the analysis of the temporal evolution of displacement and a look back at displacement that already has taken place. The possibility to retrieve a retrospective view of displacement is a unique opportunity for studying the evolution of the uninstrumented sector of a phenomena.
Unlike the conventional ground-based technologies (which record the displacement of targets, specific points or individual reflectors), InSAR, through the generation of interferograms, can provide 2D maps of changes in the satellite-to-target path between the acquisition times of the two SAR scenes. Hence, InSAR provided a significantly increased coverage of information, leading to a better overall understanding of movements of a sliding mass. This aspect is of paramount importance in the about 50 million m3 Åknes rockslide, where a single moving benchmark can be related to localized displacements of an individual block and not to the general instability of the whole landslide body. Moreover, the information coverage allows one to accurately map the extension of the threatened area, its rate of deformation and to define, accordingly, risk scenarios.
The Åknes landslide is a large phenomenon that cannot be stabilized and may accelerate suddenly. The monitoring of its surface displacement is thus crucial for the prevention and forecast of collapse. In the case of the Åknes landslide, the synergic use of multiple SAR sensors (ground based and space borne) can lead to redundant measurements, allowing a more advanced and realistic mapping and classification of the phenomenon and a better understand of the deformation pattern. The redundancy of monitoring data is very important, being the basic condition for the design and implementation of any early warning system. Integrated use of multi-source monitoring data reduces the possibility of missing events or generating false alarms and the consequent loss of confidence and reliability of the system.
In recent years, the improved capabilities of new generation X-band satellites in terms of flexibility and time performance (revisiting time and timeliness of delivery) contributed to the use of satellite SAR sensors as operational monitoring tools [63,64]. Remote monitoring represents more and more a tool for surveying and/or early warning.
5. Conclusions
In this work, an attempt to integrate ground-based and satellite InSAR datasets is proposed. The main objective is to improve the knowledge obtainable from InSAR techniques, in the field of landslide mapping and monitoring.
The proposed procedure suggests three main steps to be performed: a qualitative phase, the result of which follows a binary approach, with the distinction, in the observed scenario, of stable and unstable areas; a semi-quantitative phase, where the distinction of macro-areas concerning different displacement ranges is possible; a quantitative integration, during which time series analysis is performed, and forecasting algorithms for the evaluation of the future behavior of the landslide can be applied.
The Åknes Norwegian rockslide has been selected to test the proposed procedure.
Firstly, data acquired by satellite and GB-InSAR platforms have been analyzed separately. Data analysis allows one to define landslide sectors concerning higher displacements, which correspond to the upper portion of the slope. Satellite data have been acquired by RADARSAT-2 and TerraSAR-X/Tandem-X satellite platforms. As in the GB-InSAR acquisitions, satellite data have been acquired in summer seasons. For the application of the integration algorithm, a defined period in the available datasets has been selected. The period between July and October 2010 has been chosen, as it is characterized by the best overlap between ground-based and satellite acquisitions.
The different datasets have been homogenized in terms of spatial and temporal resolution and also as regarding their different LOS. Homogenized data have been integrated and analyzed on the same map, in the GIS environment.
Data integration allowed increasing the data coverage on the observed scenario, which becomes widely detectable. Data projection allowed better defining of the real value of the displacement vector in the observed scenario: projection reliability has been tested comparing its result with data acquired by GPS campaigns, available in the literature. The projection also allowed defining the upper portion of the landslide as the main vertical displacements of concern.
Data integration from a semi-quantitative point of view has also been performed, allowing proposing the distinction of the upper sector of the landslide, defined as concerning higher displacements, into two sub-sections: the upper portion concerning displacements higher than 10 mm in the period between July and October 2010; and the lower portion concerning displacements lower than 10 mm in the same period.
Unfortunately, the unavailability of long time series of the observed datasets made it impossible to obtain also a quantitative integration for the selected test site.
Acknowledgments
The authors are grateful to LiSALab Company for the GB-InSAR data processing. The TerraSAR-X data have been provided by the German Aerospace Center (DLR) under the TSX-AO (TerraSAR-X Announcement of Opportunity) project Contract #GEO0764. RADARSAT-2 data have been provided by Kongsberg Satellite Services (KSAT) through an agreement with the Norwegian Space Centre. The authors also appreciate the help from staff of the Norwegian Geotechnical Institute, which contributed to this research production: especially, they would like to thank Bjorn Kalsnes, Vidar Kveldsvik and Jose Cepeda for their support. The authors are also grateful to the NVE (Norwegian Water Resources and Energy Directorate) staff, especially they would like to thank Lars Harald Blikra, for supporting this research. Michele Crosetto, Michel Jaboyedoff, Tazio Strozzi and an anonymous reviewer are thanked for their suggestions and comments, which significantly improved the original manuscript. The authors are also grateful to the Guest Editors, Zhenhong Li and Roberto Tomas, for their suggestions to improve this work.
Author Contributions
All of the authors participated in editing and reviewing the manuscript. Federica Bardi, Federico Raspini and Andrea Ciampalini developed the integration procedure of GB-InSAR and satellite InSAR data. Lene Kristensen contributed to GB-InSAR data processing and post-processing. Line Rouyet and Tom Rune Lauknes contributed to satellite InSAR data processing. Regula Frauenfelder and Nicola Casagli provided a general review. All contributed to the writing of this manuscript.
Conflicts of Interest
The authors declare no conflict of interest.
References
- IGOS (Integrated Global Observing Strategy). GEOHAZARDS Theme Report: For the Monitoring of Our Environment from Space and from Earth. European Space Agency publication, 2004. Available online: http://unesdoc.unesco.org/images/0014/001405/140532eo.pdf (accessed on 9 October 2015).
- Columbia University. Global Landslide Total Economic loss Risk Deciles. 2000, vol.1. Available online: http://sedac.ciesin.columbia.edu/data/set/ndh-landslide-total-economic-loss-risk-deciles (accessed on 9 October 2015).
- Guzzetti, F. Landslide fatalities and evaluation of landslide risk in Italy. Eng. Geol. 2000, 58, 89–107. [Google Scholar] [CrossRef]
- Petley, D.N. The global occurrence of fatal landslides in 2007. Geophys. Res. Abstr. 2008, 10, EGU2008-A-10487. [Google Scholar]
- Schuster, R.L.; Highland, L. Socioeconomic and Environmental Impacts of Landslides in the Western Hemisphere; US Department of the Interior, US Geological Survey: Cartagena, Colombia, 2001.
- Canuti, P.; Casagli, N.; Ermini, L.; Fanti, R.; Farina, P. Landslide activity as a geoindicator in Italy: Significance and new perspectives from remote sensing. Environ. Geol. 2004, 45, 907–919. [Google Scholar] [CrossRef]
- Kjekstad, O.; Highland, L. Economic and social impacts of landslides. In Landslides–Disaster Risk Reduction; Springer: Berlin, Germany; Heidelberg, Germany, 2009; pp. 573–587. [Google Scholar]
- Nadim, F.; Kjekstad, O.; Peduzzi, P.; Herold, C.; Jaedicke, C. Global landslide and avalanche hotspots. Landslides 2006, 3, 159–173. [Google Scholar] [CrossRef]
- Luzi, G.; Pieraccini, M.; Mecatti, D.; Noferini, L.; Guidi, G.; Moia, F.; Atzeni, C. Ground-based radar interferometry for landslides monitoring: Atmospheric and instrumental decorrelation sources on experimental data. IEEE Trans. Geosci. Remote Sens. 2004, 42, 2454–2466. [Google Scholar] [CrossRef]
- Luzi, G. Ground based SAR interferometry: A novel tool for geoscience. In Geoscience and Remote Sensing; New Achievements, InTech; Imperatore, P., Riccio, D., Eds.; 2010; pp. 1–26. Available online: http://www.intechopen.com/articles/show/title/ground-based-sar-interferometry-a-novel-toolfor-geoscience (accessed on 20 May 2015).
- Monserrat, O.; Crosetto, M.; Luzi, G. A review of ground-based SAR interferometry for deformation measurement. ISPRS J. Photogramm. Remote Sens. 2014, 93, 40–48. [Google Scholar] [CrossRef]
- Ferretti, A.; Prati, C.; Rocca, F. Non linear subsidence rate estimation using Permanent Scatterers in differential SAR interferometry. IEEE Trans. Geosci. Remote Sens. 2000, 38, 2202–2212. [Google Scholar] [CrossRef]
- Ferretti, A.; Prati, C.; Rocca, F. Permanent scatterers in SAR interferometry. IEEE Trans. Geosci. Remote Sens. 2001, 39, 8–20. [Google Scholar] [CrossRef]
- Ferretti, A.; Bianchi, M.; Prati, C.; Rocca, F. Higher-order permanent scatterers analysis. Eurasip J. Appl. Signal Process. 2005, 20, 3231–3242. [Google Scholar] [CrossRef]
- Hanssen, R.S. Satellite radar interferometry for deformation monitoring: A priori assessment of feasibility and accuracy. Int. J. Appl. Earth Obs. Geoinform. 2005, 6, 253–260. [Google Scholar]
- Raucoules, D.; Bourgine, B.; Michele, M.; Le Gozannet, G.; Closset, L.; Bremmer, C.; Veldkamp, H.; Tragheim, D.; Bateson, L.; Crosetto, M.; et al. Validation and intercomparison of persistent scatterers interferometry: PSIC4 project results. J. Appl. Geophys. 2009, 68, 335–347. [Google Scholar] [CrossRef]
- Crosetto, M.; Monserrat, O.; Iglesias, R.; Crippa, B. Persistent scatterer interferometry: Potential, limits and initial C- and X-band comparison. Photogramm. Eng. Remote Sens. 2010, 76, 1061–1069. [Google Scholar] [CrossRef]
- Crosetto, M.; Monserrat, O.; Cuevas-Gonzàlez, M.; Devanthèry, N.; Crippa, B. Persistent scatterer interferometry: A review. ISPRS J. Photogramm. Remote Sens. 2015, in press. [Google Scholar]
- Berardino, P.; Fornaro, G.; Lanari, R.; Sansosti, E. A new algorithm for surface deformation monitoring based on small baseline differential SAR interferograms. IEEE Trans. Geosci. Remote Sens. 2002, 40, 2375–2383. [Google Scholar]
- Rudolf, H.; Leva, D.; Tarchi, D.; Sieber, A.J. Mobile and versatile SAR system. In Proceedings of the IEEE 1999 International Geoscience and Remote Sensing Symposium, Hamburg, Germany, 28 June–2 July 1999; pp. 592–594.
- Tarchi, D.; Rudolf, H.; Luzi, G.; Chiarantini, L.; Coppo, P.; Sieber, A.J. SAR interferometry for structural changes detection: A demonstration test on a dam. In Proceedings of the IEEE 1999 International on Geoscience and Remote Sensing Symposium, Hamburg, Germany, 28 June–2 July 1999; pp. 1522–1524.
- Massonnet, D.; Feigl, K.L. Radar interferometry and its application to changes in the Earth’s surface. Rev. Geophys. 1998, 36. [Google Scholar] [CrossRef]
- Singhroy, V.; Mattar, K.E.; Gray, A.L. Landslide characterisation in Canada using interferometric SAR and combined SAR and TM images. Adv. Space Res. 1998, 21, 465–476. [Google Scholar] [CrossRef]
- Crosetto, M.; Monserrat, O.; Cuevas, M.; Crippa, B. Spaceborne differential SAR interferometry: Data analysis tools for deformation measurement. Remote Sens. 2011, 3, 305–318. [Google Scholar] [CrossRef]
- Lauknes, T.R.; Shanker, A.P.; Dehls, J.F.; Zebker, H.A.; Henderson, I.H.C.; Larsen, Y. Detailed rockslide mapping in northern Norway with small baseline and persistent scatterer interferometric SAR time series methods. Remote Sens. Environ. 2010, 114, 2097–2109. [Google Scholar]
- Blikra, L.H. The Åknes rockslide, Norway. In Landslides: Types, Mechanisms and Modeling; Clague, J.J., Stead, D., Eds.; Cambridge University Press: Cambridge, UK, 2012; pp. 323–335. [Google Scholar]
- Bardi, F.; Frodella, W.; Ciampalini, A.; Bianchini, S.; Del Ventisette, C.; Gigli, G.; Fanti, R.; Moretti, S.; Basile, G.; Casagli, N. Integration between ground based and satellite SAR data in landslide mapping: The San Fratello case study. Geomorphology 2014, 223, 45–60. [Google Scholar] [CrossRef]
- Tofani, V.; Del Ventisette, C.; Moretti, S.; Casagli, N. Integration of remote sensing techniques for intensity zonation within a landslide area: A case study in the northern Apennines, Italy. Remote Sens. 2014, 6, 907–924. [Google Scholar] [CrossRef]
- Eriksen, H.Ø.; Lauknes, T.R.; Larsen, Y.; Dehls, J.F.; Grydeland, T.; Bunkholt, H. Satellite and Ground-Based Interferometric Radar Observations of an Active Rockslide in Northern Norway. In Engineering Geology for Society and Territory; Springer International Publishing: Cham, Switzerland, 2015; pp. 167–170. [Google Scholar]
- Zebker, H.A.; Villasenor, J. Decorrelation in interferometric radar echoes. IEEE Trans. Geosci. Remote Sens. 1992, 30, 950–959. [Google Scholar] [CrossRef]
- Cruden, D.M.; Varnes, D.J. Landslide types and processes. In Landslides: Investigation and Mitigation; Transportation Research Board, Special Report, 247; Turner, A.K., Schuster, R.L., Eds.; Transportation Research Board, National Research Council, National Academy Press: Washington, DC, USA, 1996; pp. 36–75. [Google Scholar]
- Raspini, F.; Ciampalini, A.; Del Conte, S.; Lombardi, L.; Nocentini, M.; Gigli, G.; Ferretti, A.; Casagli, C. Exploitation of amplitude and phase of satellite SAR images for landslide mapping: the case of Montescaglioso (South Italy). Remote Sens. 2015, 7, 14576–14596. [Google Scholar] [CrossRef]
- Bianchini, S.; Cigna, F.; Righini, G.; Proietti, C.; Casagli, N. Landslide hotspot mapping by means of persistent scatterer interferometry. Environ. Earth. Sci. 2012, 67, 1155–1172. [Google Scholar] [CrossRef]
- Lauknes, T.R. Rockslide Mapping in Norway by Means of Interferometric SAR Time Series Analysis. Ph.D. Thesis, University of Trømso (UIT), Trømso, Norway, 2010. [Google Scholar]
- Intrieri, E.; Gigli, G.; Mugnai, F.; Fanti, R.; Casagli, N. Design and implementation of a landslide early warning system. Eng. Geol. 2012, 147–148, 124–136. [Google Scholar] [CrossRef]
- Ciampalini, A.; Bardi, F.; Bianchini, S.; Frodella, W.; Del Ventisette, C.; Moretti, S.; Casagli, N. Analysis of building deformation in landslide area using multisensor PSInSAR technique. Int. J. Appl. Earth Obs. Geoinform. 2014, 33, 166–180. [Google Scholar] [CrossRef]
- Bovenga, F.; Wasowski, J.; Nitti, D.O.; Nutricato, R.; Chiaradia, M.T. Using COSMO SkyMed X-band and ENVISAT C-band SAR interferometry for landslides analysis. Remote Sens. Environ. 2012, 119, 272–285. [Google Scholar] [CrossRef]
- Wright, T.J.; Parsons, B.E.; Lu, Z. Toward mapping surface deformation in three dimensions using InSAR. Geophys. Res. Lett. 2004, 31, L010607. [Google Scholar] [CrossRef]
- Tofani, V.; Raspini, F.; Catani, F.; Casagli, N. Persistent Scatterer Interferometry (PSI) technique for landslide characterization and monitoring. Remote Sens. 2013, 5, 1045–1065. [Google Scholar] [CrossRef]
- Colesanti, C.; Wasowski, J. Investigating landslides with space-borne Synthetic Aperture Radar (SAR) interferometry. Eng. Geol. 2006, 88, 173–199. [Google Scholar] [CrossRef]
- Cascini, L.; Fornaro, G.; Peduto, D. Advanced low- and full-resolution DInSAR map generation for slow-moving landslide analysis at different scales. Eng. Geol. 2010, 112, 29–42. [Google Scholar] [CrossRef]
- Herrera, G.; Gutiérrez, F.; Garcìa-Davalillo, J.C.; Guerrer, J.; Notti, D.; Galve, J.P.; Fernàndez-Merodo, J.A.; Cooksley, G. Multi-sensor advanced DInSAR monitoring of very slow landslides: The Tena Valley case study (Central Spanish Pyrenees). Remote Sens. Environ. 2013, 128, 31–43. [Google Scholar] [CrossRef]
- Barbieri, M.; Corsini, A.; Casagli, N.; Farina, P.; Coren, F.; Sterzai, P.; Leva, D.; Tarchi, D. Space-Borne and Ground-Based SAR Interferometry for Landslide Activity Analysis and Monitoring in the Appennines of Emilia Romagna (Italy): Review of Methods and Preliminary Results; European Space Agency, (Special Publication): Noordwijk, The Netherlands, 2004; pp. 463–470. [Google Scholar]
- Ganerød, G. V.; Grøneng, G.; Rønning, J. S.; Dalsegg, E.; Elvebakk, H.; Tønnesen, J. F.; Kveldsvik, V.; Eiken, T.; Blikra, L. H.; Braathen, A. Geological model of the Åknes rockslide, western Norway. Eng. Geol. 2008, 102, 1–18. [Google Scholar] [CrossRef]
- Blikra, L.H.; Braathen, A.; Derron, M.H.; Eiken, T.; Kveldsvik, V.; Grøneng, G.; Dalsegg, E.; Elvebakk, H.; Roth, M. The Åkerneset slope failure—A potential catastrophic rockslide in western Norway? Abstr. Proc. Geol. Soc. Nor. 2005, 1, 15–16. [Google Scholar]
- Eidsvik, U.M.; Medina-Cetina, Z.; Kveldsvik, V.; Glimsdal, S.; Harbitz, C.B.; Sandersen, F. Risk assessment of a tsunamigenic rockslide at Åknes. Nat. Hazards 2011, 56, 529–545. [Google Scholar] [CrossRef]
- Tveten, E.; Lutro, O.; Thorsnes, T. Geologisk kart over Norge, bergrunnskart Ålesund, 1:250,000, (Ålesund, Western Norway); Geological Survay of Norway: Trondheim, Norway, 1988. (In Norwegian) [Google Scholar]
- Heincke, B.; Gunther, T.; Dalsegg, E.; Ronning, J.S.; Ganerød, G.V.; Elvebakk, H. Combined three-dimensional electric and seismic tomography study on the Aknes rockslide in western Norway. J. Appl. Geophys. 2010, 70, 292–306. [Google Scholar] [CrossRef]
- Kristensen, L.; Rivolta, C.; Dehls, J.; Blikra, L.H. GB-InSAR measurement at the Åknes rockslide, Norway. In Proceedings of the International Conference Vajont 1963–2013. Thoughts and Analyses after 50 Years since the Catastrophic Landslide, Padua, Italy, 8–10 October 2013.
- Frei, C. H.; Loew, S.; Leuenberger-West, F. First results of a large-scale multi-tracer test within an unstable rockslide area (Åknes, Norway). Geophys. Res. Abstr. 2008, 10. SRef-ID:1607-7962/gra/EGU2008-A-08930. [Google Scholar]
- Kveldsvik, V.; Nilsen, B.; Einstein, H.H.; Nadim, F. Alternative approaches for analyses of a 100,000 m3 rock slide based on Barton-Bandis shear strength criterion. Landslides 2007, 5, 161–176. [Google Scholar] [CrossRef]
- Kveldsvik, V.; Kanya, A.M.; Nadim, F.; Bhasin, R.; Nilsen, B.; Einstein, H.H. Dynamic distinct-element analysis of the 800 m high Aknes rock slope. Int. J. Rock Mech. Min. Sci. 2009, 46, 686–698. [Google Scholar] [CrossRef]
- Kveldsvik, V.; Einstein, H.H.; Nilsen, B.; Blikra, L.H. Numerical analysis of the 650,000 m2 Aknes rock slope based on measured displacements and geotechnical data. Rock. Mech. Rock. Eng. 2009, 42, 689–728. [Google Scholar] [CrossRef]
- Nordvik, T.; Nyrnes, E. Statistical analysis of surface displacements—An example from the Åknes rockslide, western Norway. Nat. Hazards Earth. Syst. Sci. 2009, 9, 713–724. [Google Scholar] [CrossRef]
- Blikra, L.H. The Åknes rockslide: Monitoring, threshold values and early-warning. In Proceedings of the 10th International Symposium on Landslides and Engineered Slopes, Xian, China, 30 June–4 July 2008; pp. 1089–1094.
- Lacasse, S.; Eidsvig, U.; Nadim, F.; Hoeg, K.; Blikra, L.H. Evaluation of Åknes rockslide hazard using event trees. In Proceedings of the 42nd U.S. Rock Mechanics Symposium (USRMS), ARMA-08-340, San Francisco, CA, USA, 29 June–2 July 2008.
- The Norwegian Water Resources and Energy Directorate (NVE). Available online: http://www.nve.no/english/ (accessed on 12 March 2015).
- Tarchi, D.; Casagli, N.; Fanti, R.; Leva, D.; Luzi, G.; Pasuto, A.; Pieraccini, M.; Silvano, S. Landslide monitoring by using ground-based SAR interferometry: An example of application to the Tessina landslide in Italy. Eng. Geol. 2003, 1, 15–30. [Google Scholar] [CrossRef]
- Northern Research Institute of Trømso (NORUT) (Trømso, Norway). Unpublished work. 2013.
- Hooper, A.; Zebker, H.A.; Segall, P.; Kampes, B. A new method for measuring deformation on volcanoes and other natural terrains using InSAR persistent scatterers. Geophys. Res. Lett. 2004, 31, 1–5. [Google Scholar] [CrossRef]
- Lauknes, T.R.; Zebker, H.A.; Larsen, L. InSAR deformation time series using an L1-Norm small-baseline approach. IEEE Trans. Geosci. Remote Sens. 2011, 49, 536–546. [Google Scholar] [CrossRef]
- Lillesand, T.M.; Kiefer, R.W.; Chipman, J.W. Remote sensing and Image Interpretation, 5th ed.; Wiley, Cop.: New York, NY, USA, 2004. [Google Scholar]
- Raspini, F.; Moretti, S.; Fumagalli, A.; Rucci, A.; Novali, F.; Ferretti, A.; Prati, C.; Casagli, N. The COSMO-SkyMed constellation monitors the costa concordia wreck. Remote Sens. 2014, 6, 3988–4002. [Google Scholar] [CrossRef]
- Ciampalini, A.; Raspini, F.; Bianchini, S.; Tarchi, D.; Vespe, M.; Moretti, S.; Casagli, N. The costa concordia last cruise: The first application of high frequency monitoring based on COSMO-SkyMed constellation for wreck removal. J. Photogramm. Remote Sens. 2016. [Google Scholar] [CrossRef]
© 2016 by the authors; licensee MDPI, Basel, Switzerland. This article is an open access article distributed under the terms and conditions of the Creative Commons by Attribution (CC-BY) license (http://creativecommons.org/licenses/by/4.0/).