Assessment of GPM-IMERG and Other Precipitation Products against Gauge Data under Different Topographic and Climatic Conditions in Iran: Preliminary Results


Abstract
:
1. Introduction
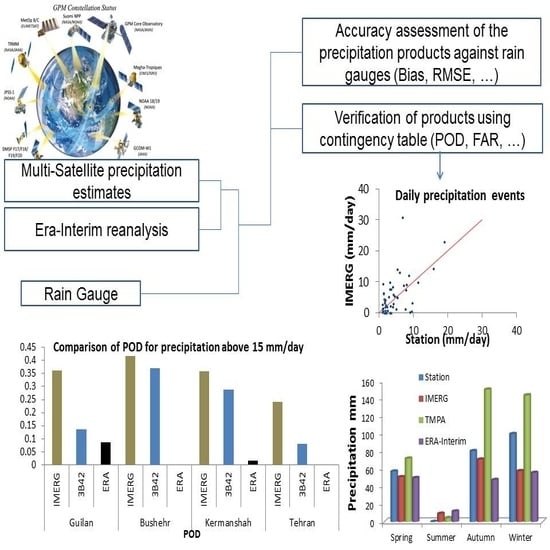
Mission Overview of GPM

| Products | Temporal Resolution | Spatial Resolution | Regions | Availability Period |
|---|---|---|---|---|
| IMERG | half-hourly | 0.1 degree | 60°N–60°S | March 2014–present |
| 3B42 | 3-hourly | 0.25 degree | 50°N–50°S | 1997–April 2015 |
| ERA-INTERIM | daily | 0.125 degree | 90°N–90°S | 1979-present |
2. Recent Works
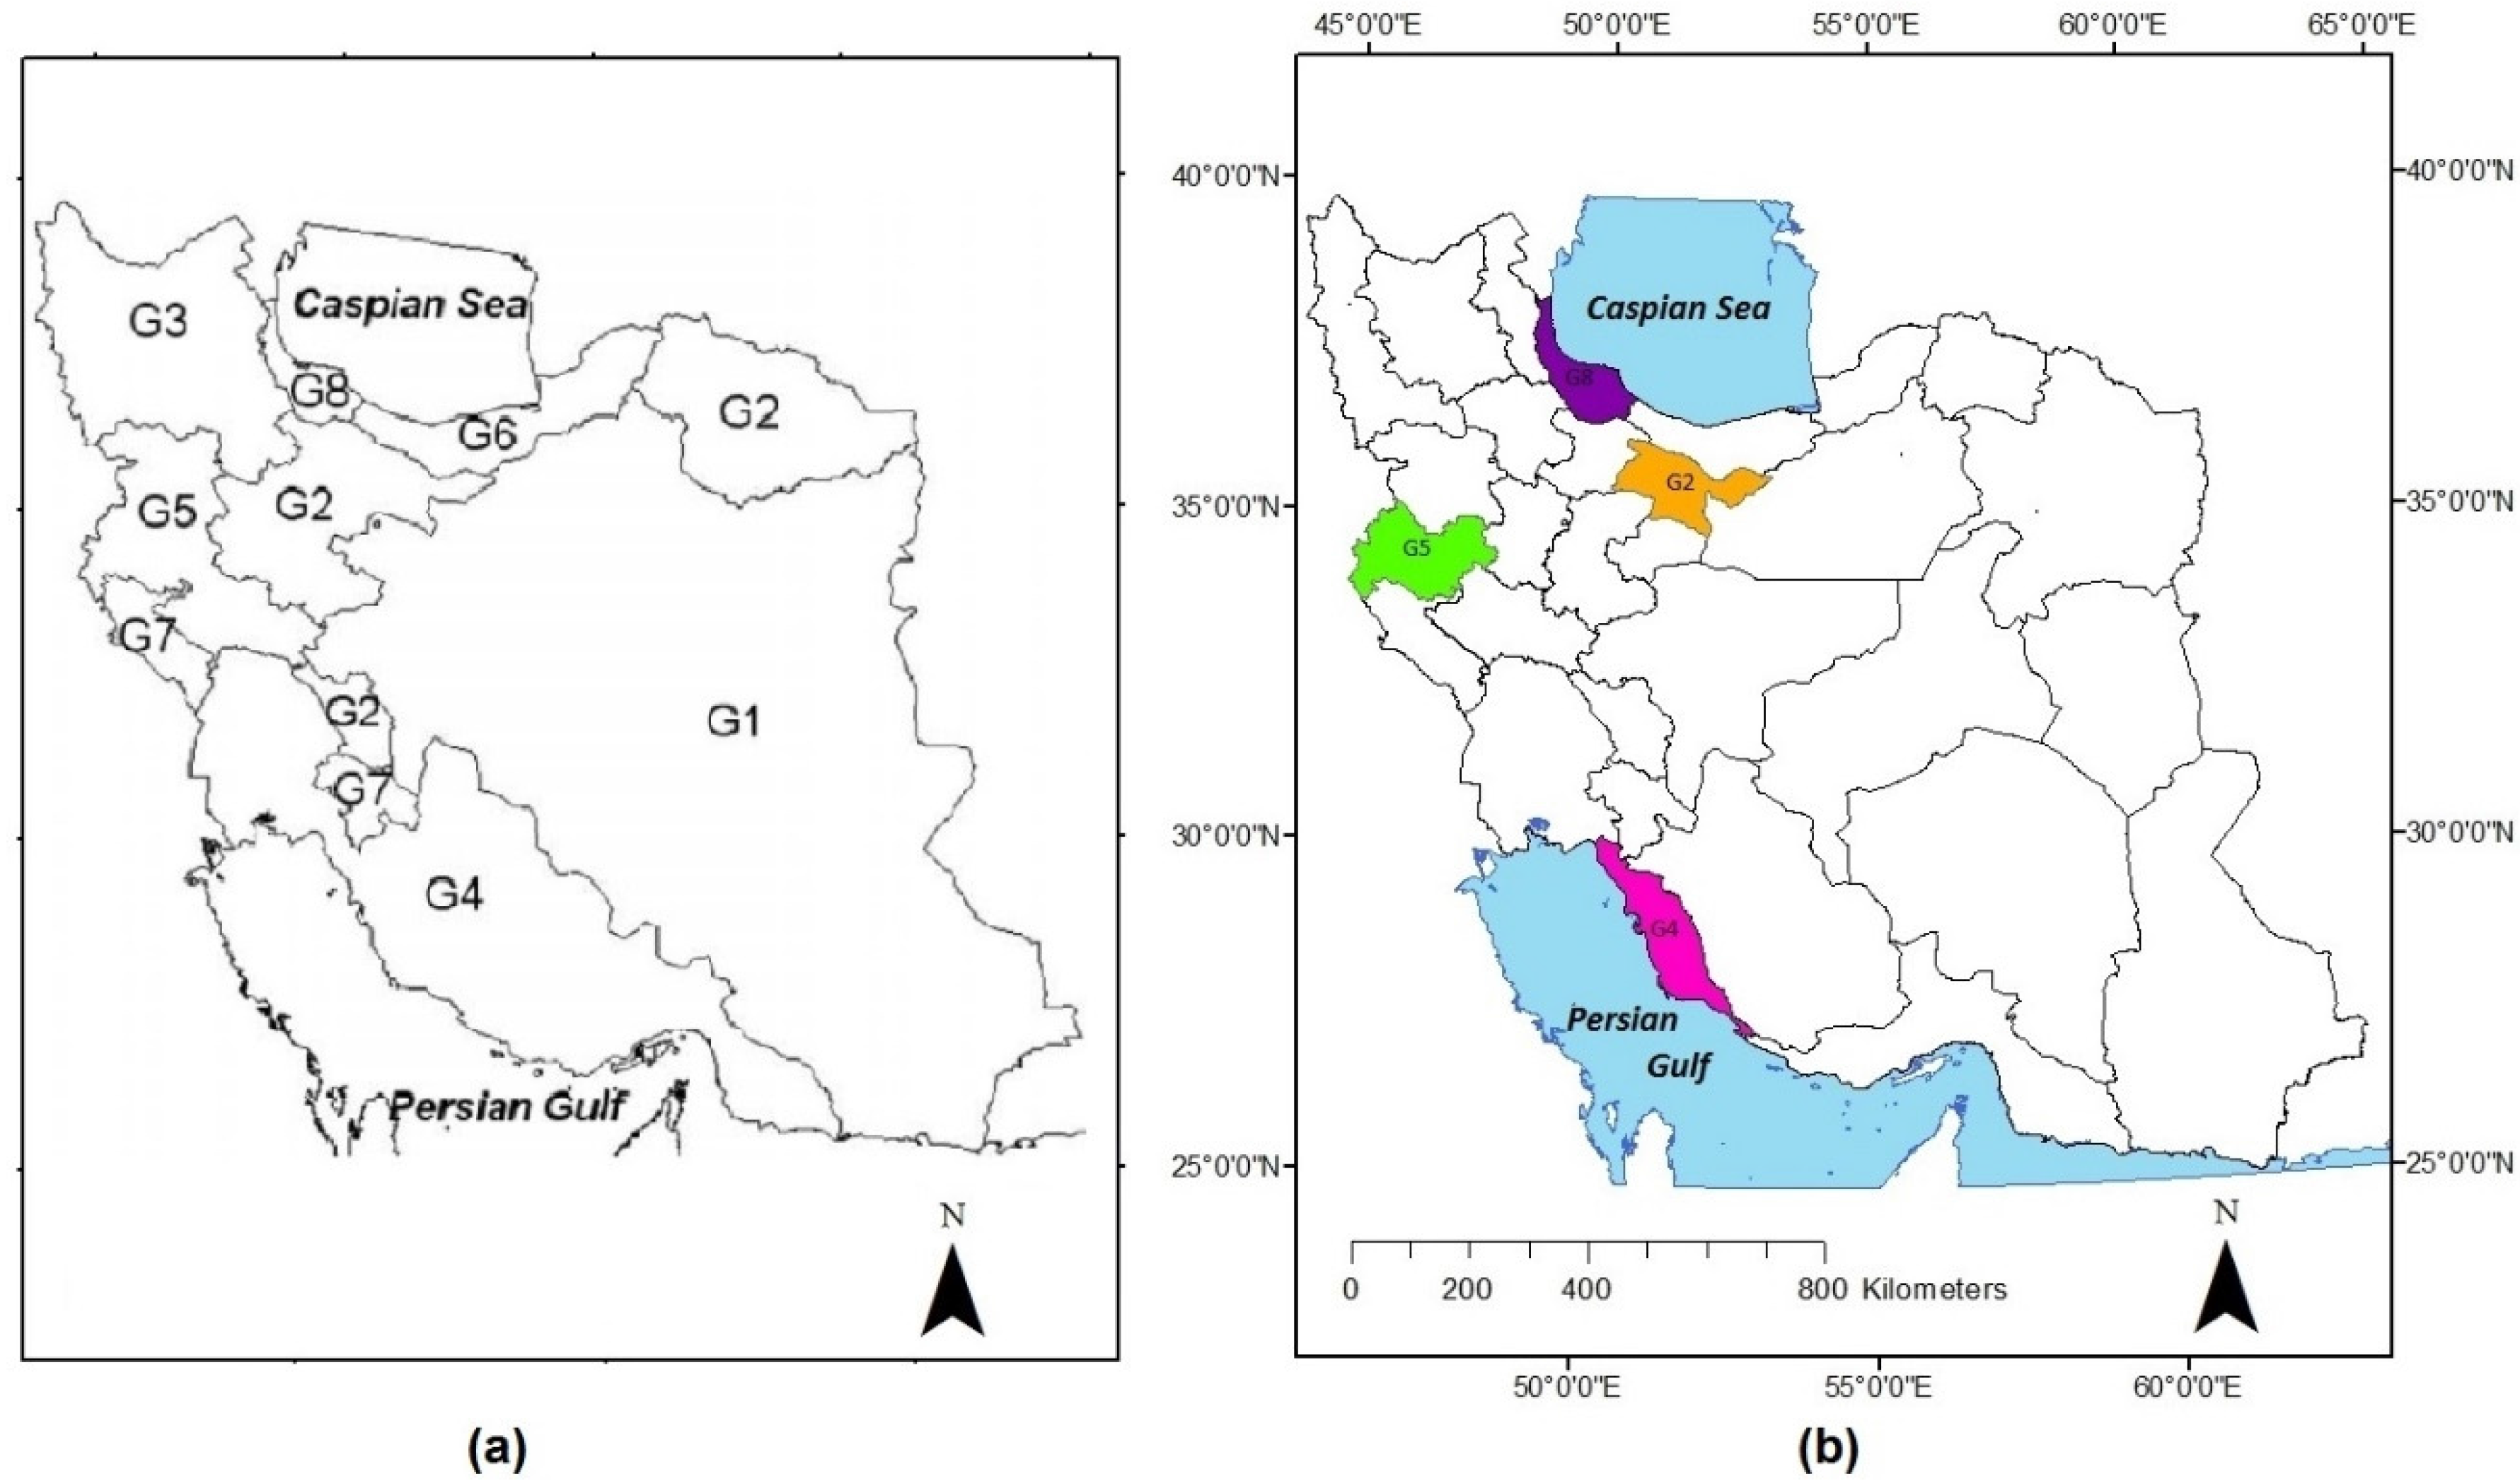
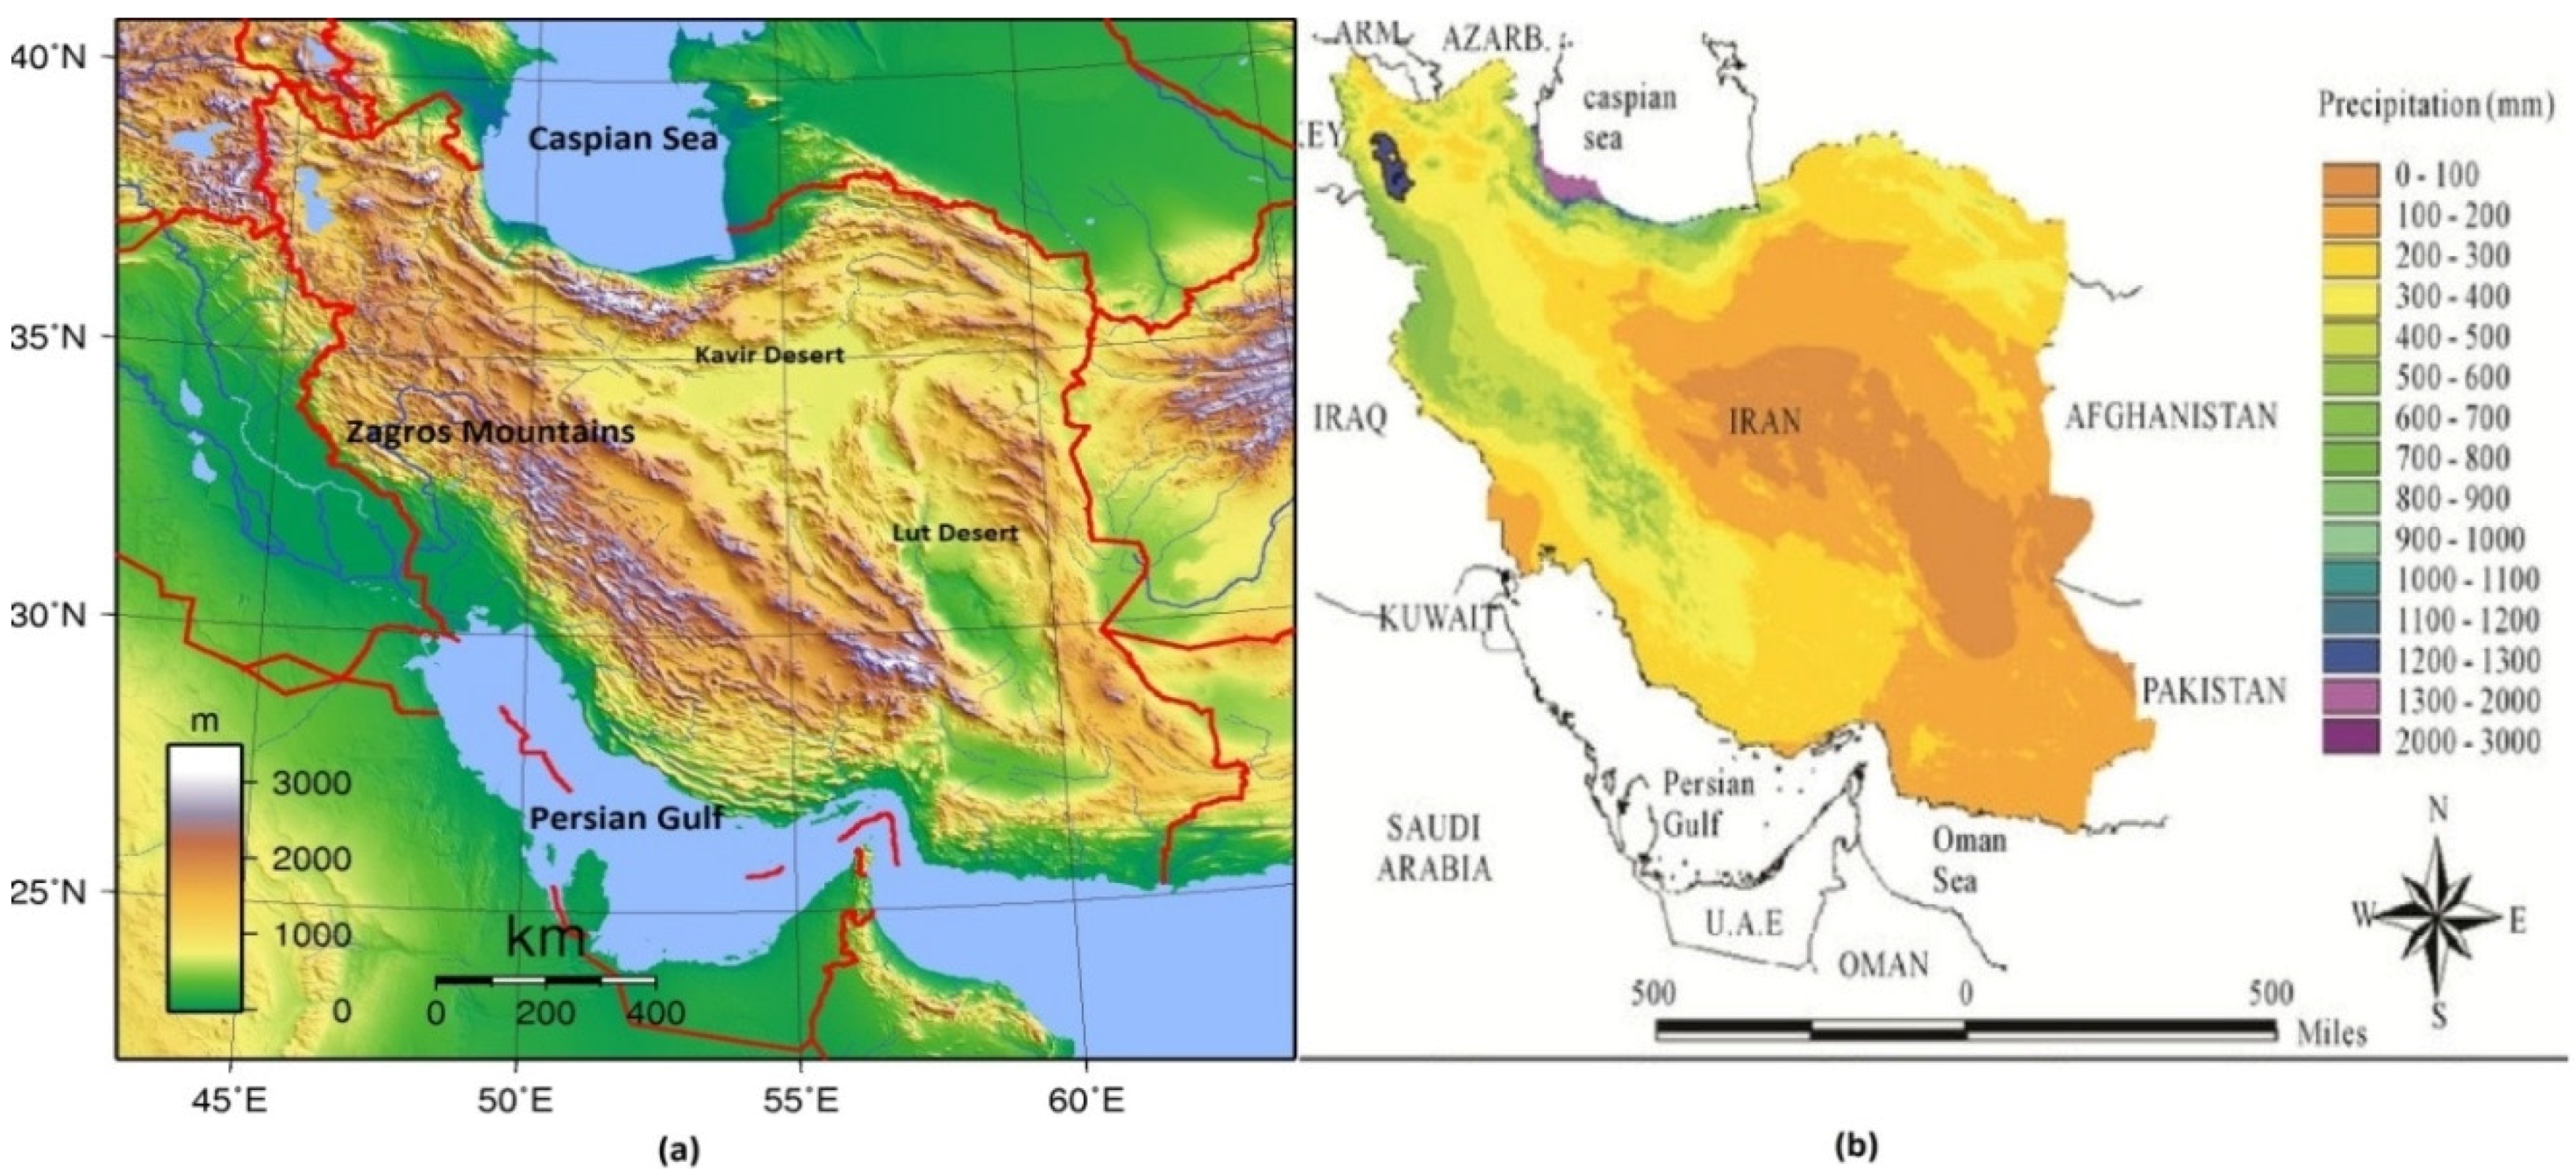
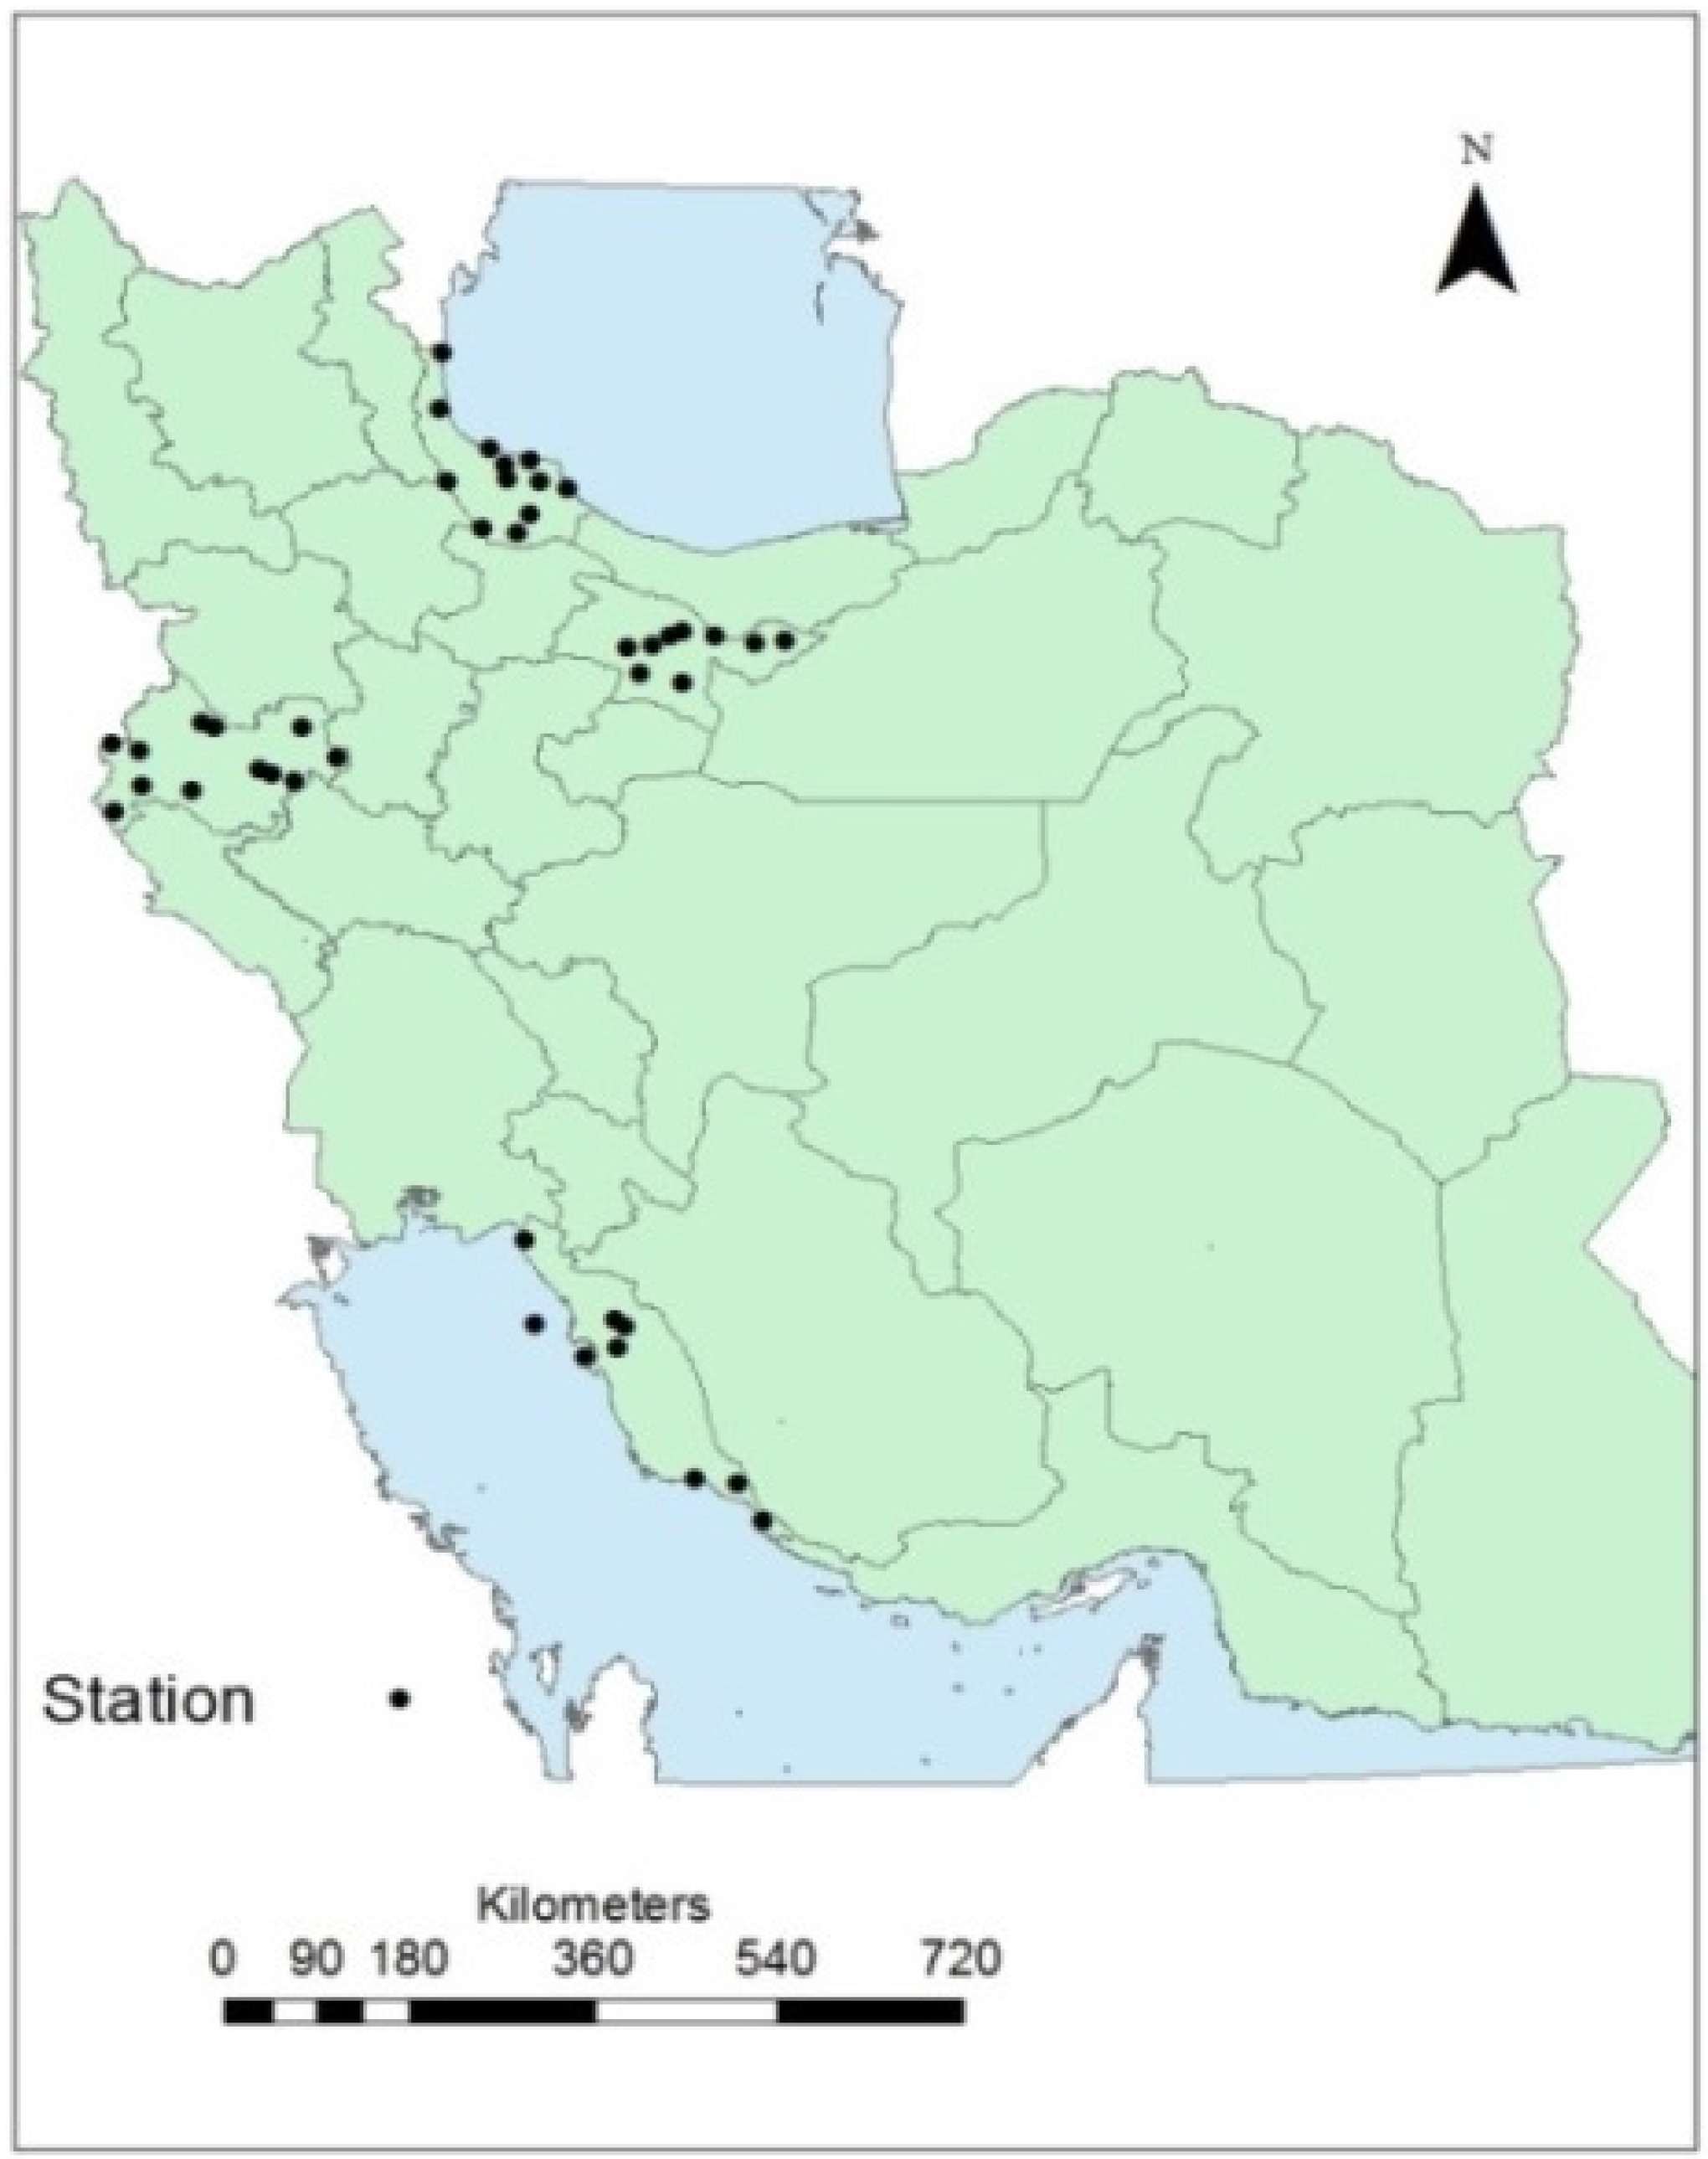
3. Study Area


4. Data and Methodology
4.1. Data Sources
| Products | Number of Pixels | |||
|---|---|---|---|---|
| Study Area | No. of Synoptic Stations | IMERG | 3B42 | ERA-Interim |
| Guilan (G8) | 12 | 23 | 23 | 20 |
| Bushehr (G4) | 9 | 15 | 18 | 12 |
| Kermanshah (G5) | 12 | 24 | 27 | 18 |
| Tehran (G2) | 10 | 16 | 22 | 19 |

4.2. Methodology
4.2.1. Statistical Analysis
4.2.2. Categorical Technique
| Satellite/Model | ||||
|---|---|---|---|---|
| Yes | No | total | ||
| Rain-Gauge | Yes | Hits (a) | Misses (c) | a + c |
| No | False alarms (b) | Correct negative (d) | b + d | |
| total | a + b | c + d | total | |
5. Results and Discussion
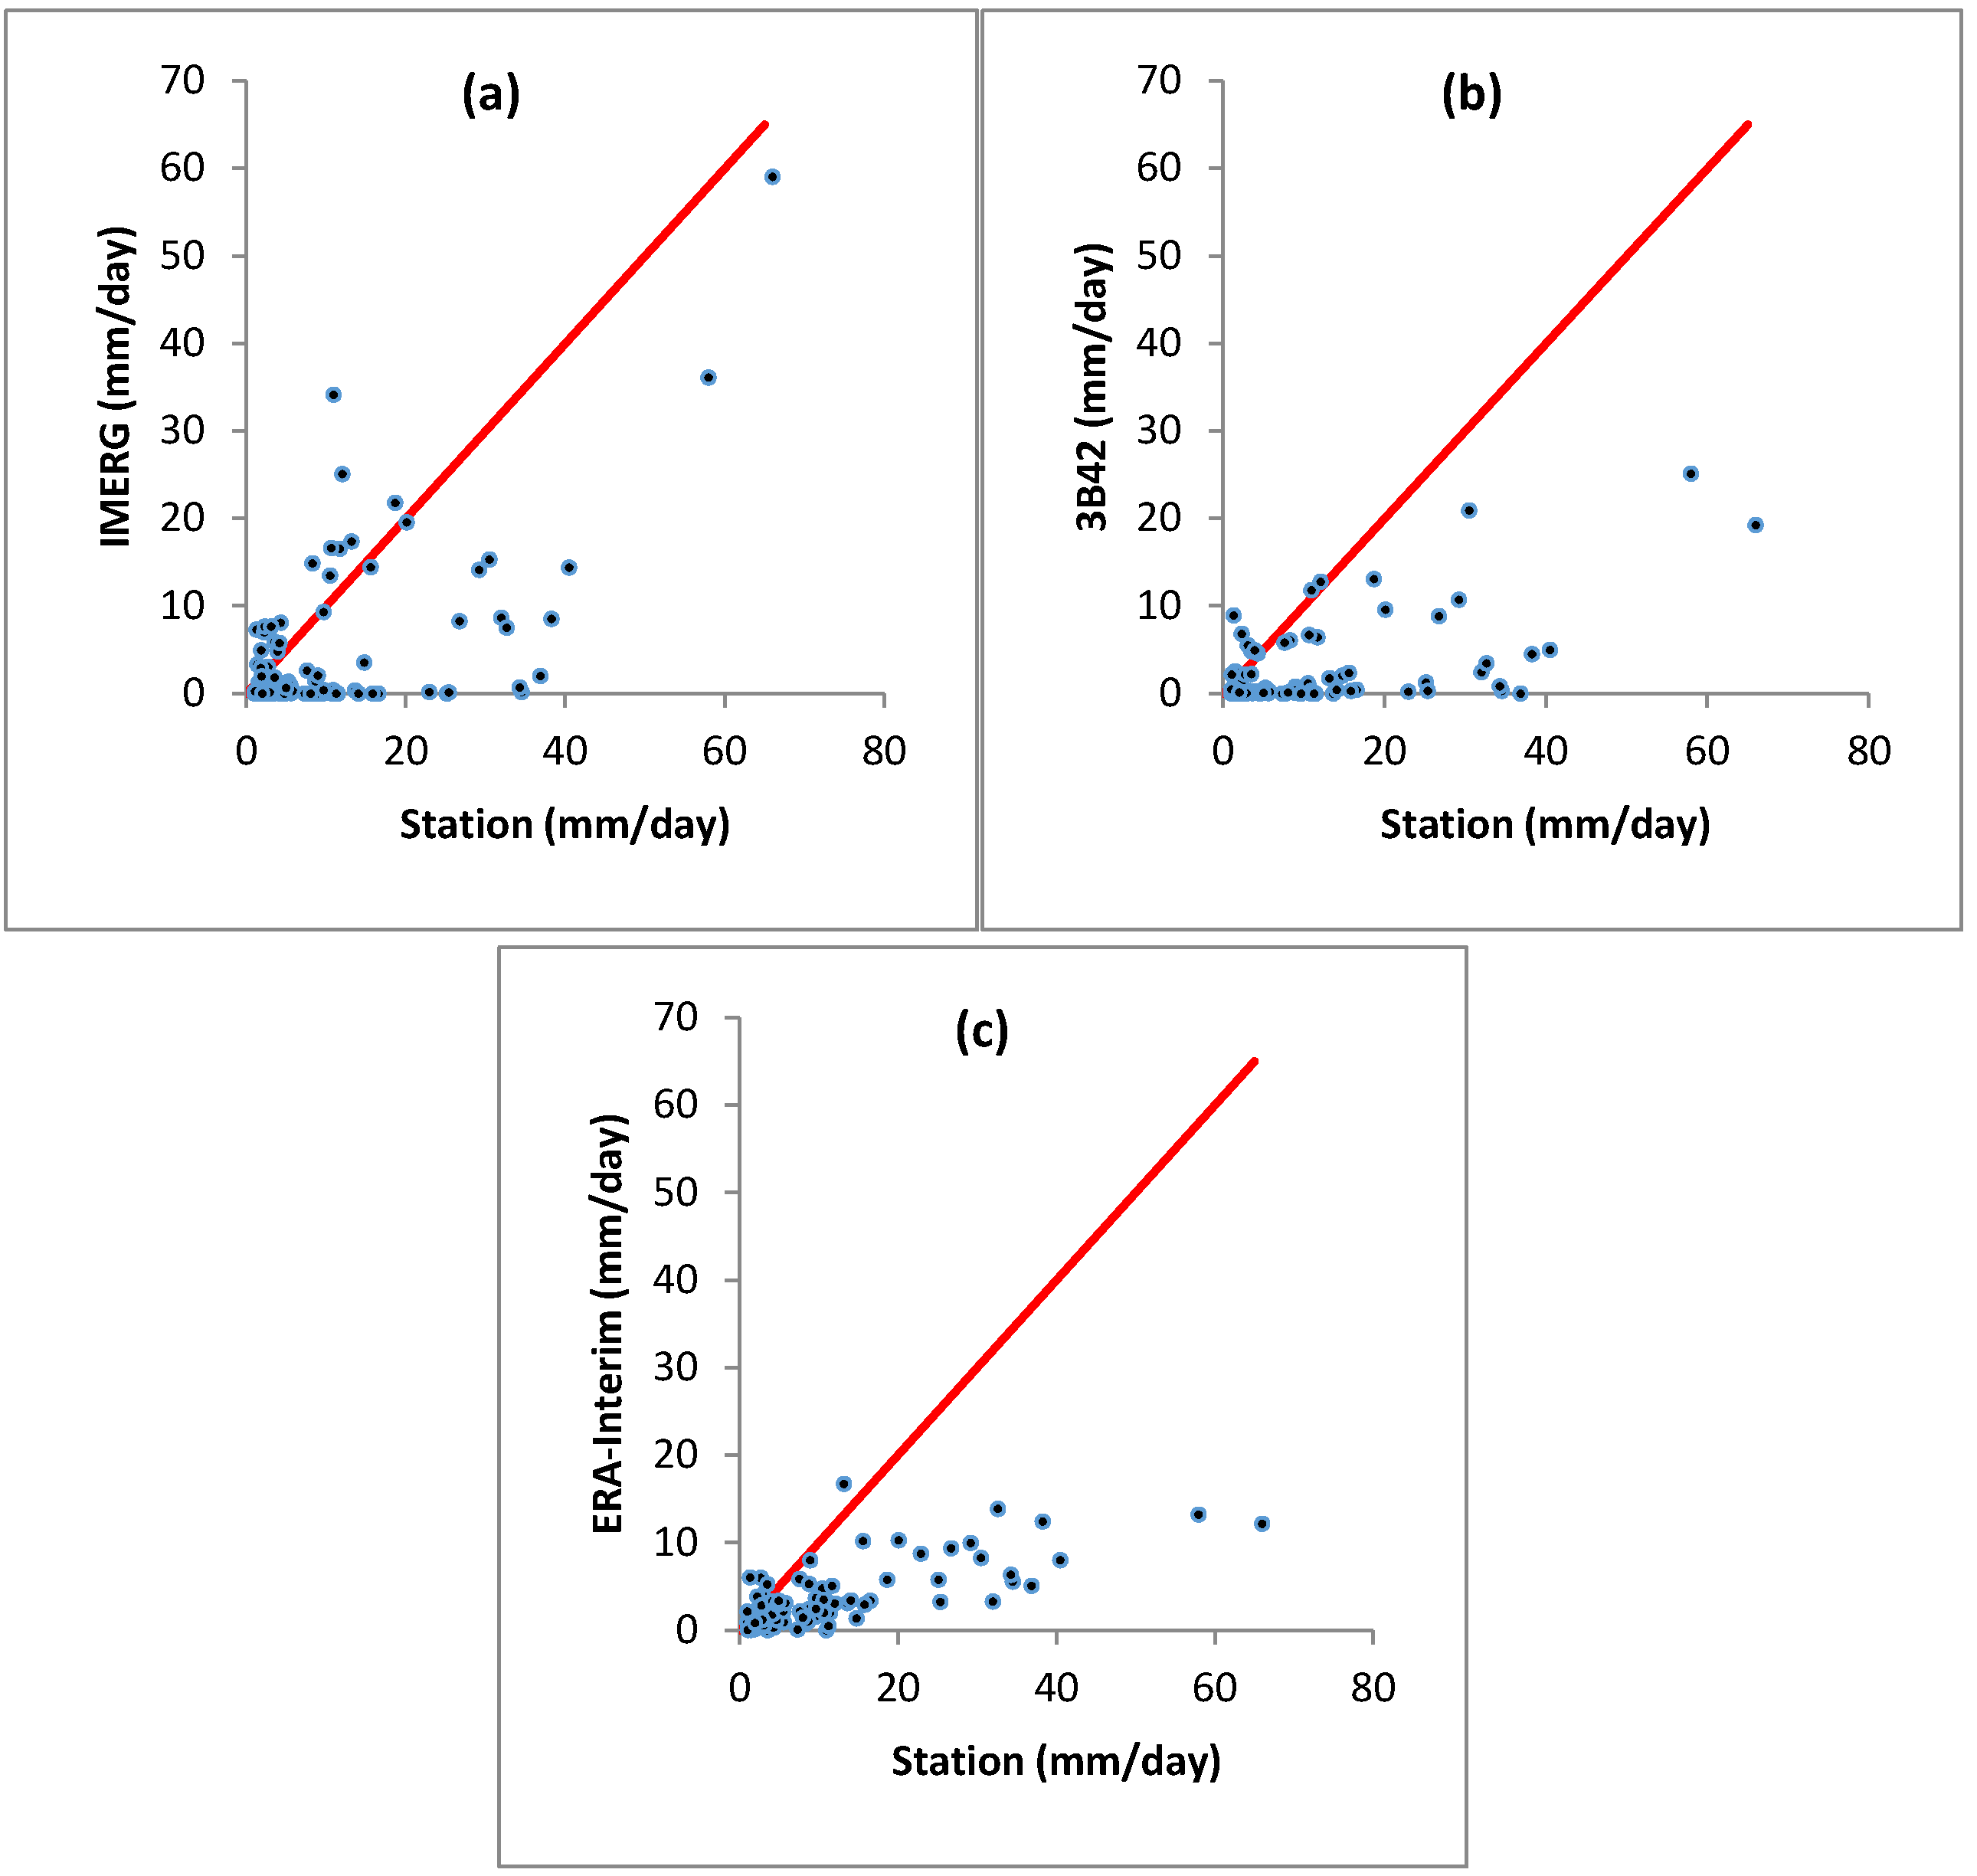
5.1. Daily Evaluation


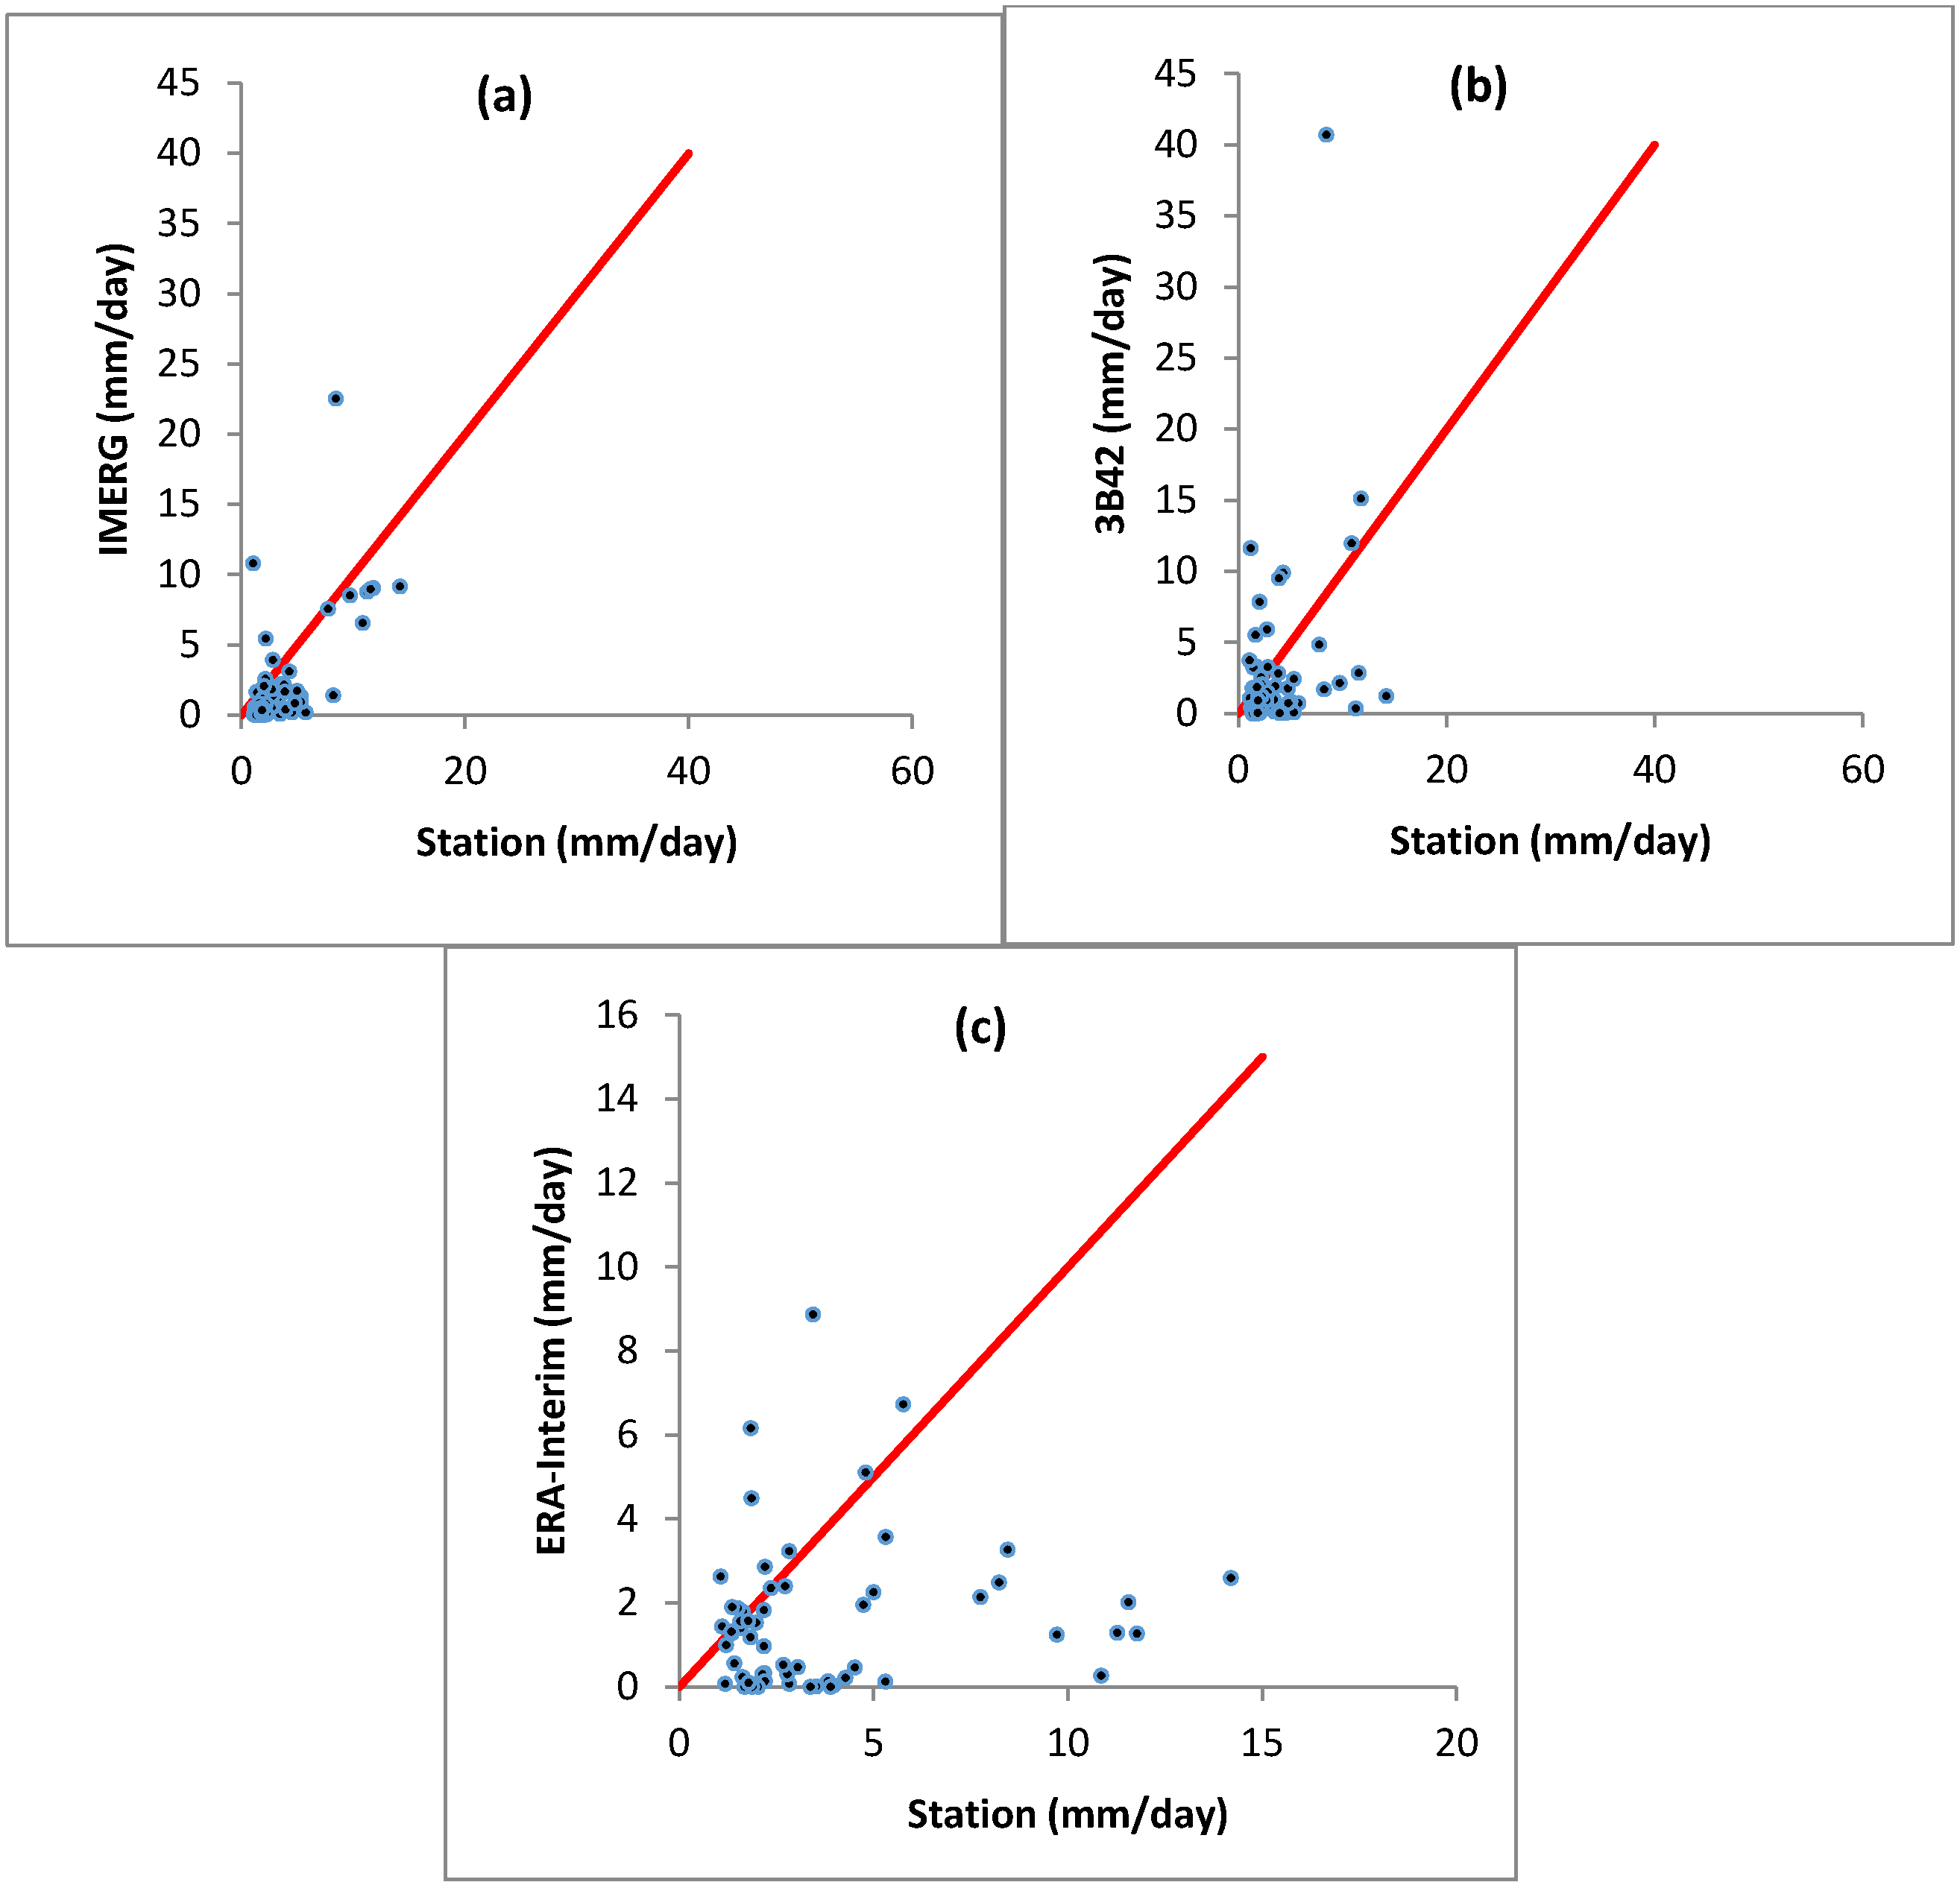
| No. of Events | RMSE (mm) | MAE (mm) | Bias (mm) | Mbias | Rbias | CC | |
|---|---|---|---|---|---|---|---|
| IMERG | 19.41 | 11.59 | −6.41 | 0.62 | −0.37 | 0.40 | |
| 3B42 | 105 | 19.59 | 11.68 | −9.75 | 0.31 | −0.69 | 0.29 |
| ERA-Interim | 17.59 | 9.88 | −9.06 | 0.35 | −0.65 | 0.55 |
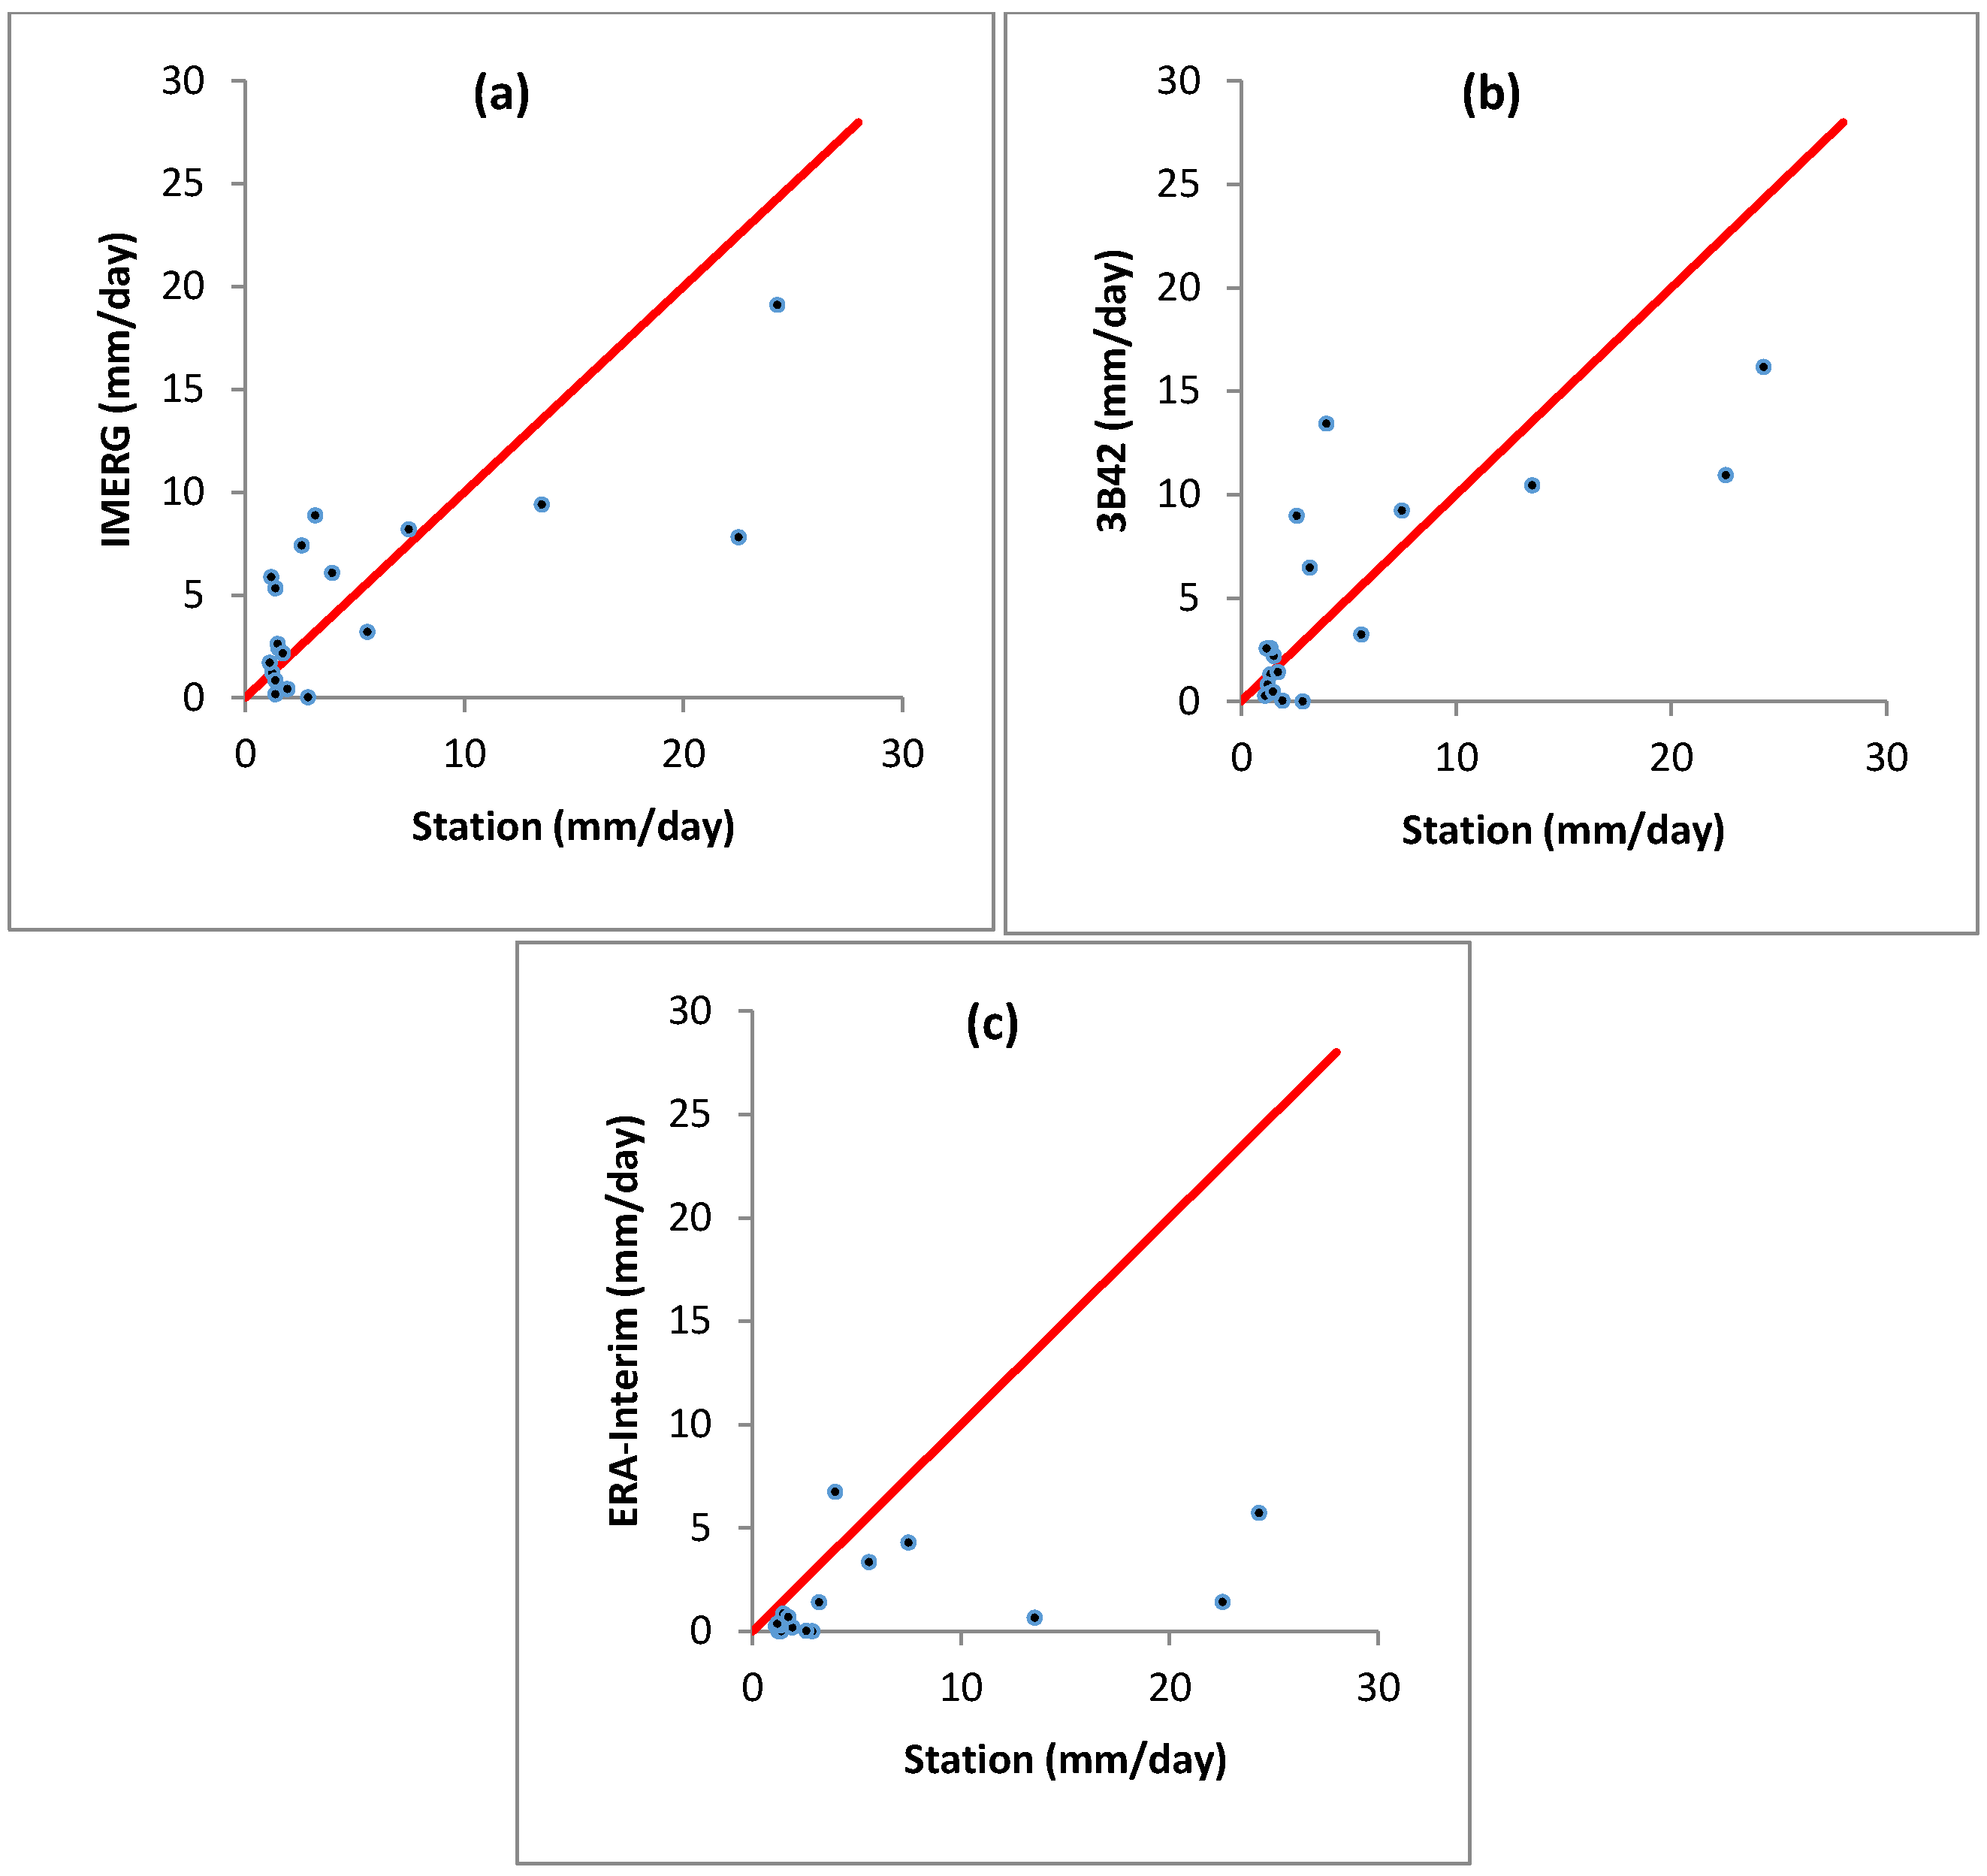
| No. of Events | RMSE (mm) | MAE (mm) | Bias (mm) | Mbias | Rbias | CC | |
|---|---|---|---|---|---|---|---|
| IMERG | 13.7 | 7.92 | −2.52 | 0.90 | −0.10 | 0.51 | |
| 3B42 | 19 | 11.86 | 7.07 | −2.95 | 0.75 | −0.25 | 0.47 |
| ERA-Interim | 14.30 | 8.04 | −7.72 | 0.22 | −0.78 | 0.40 |
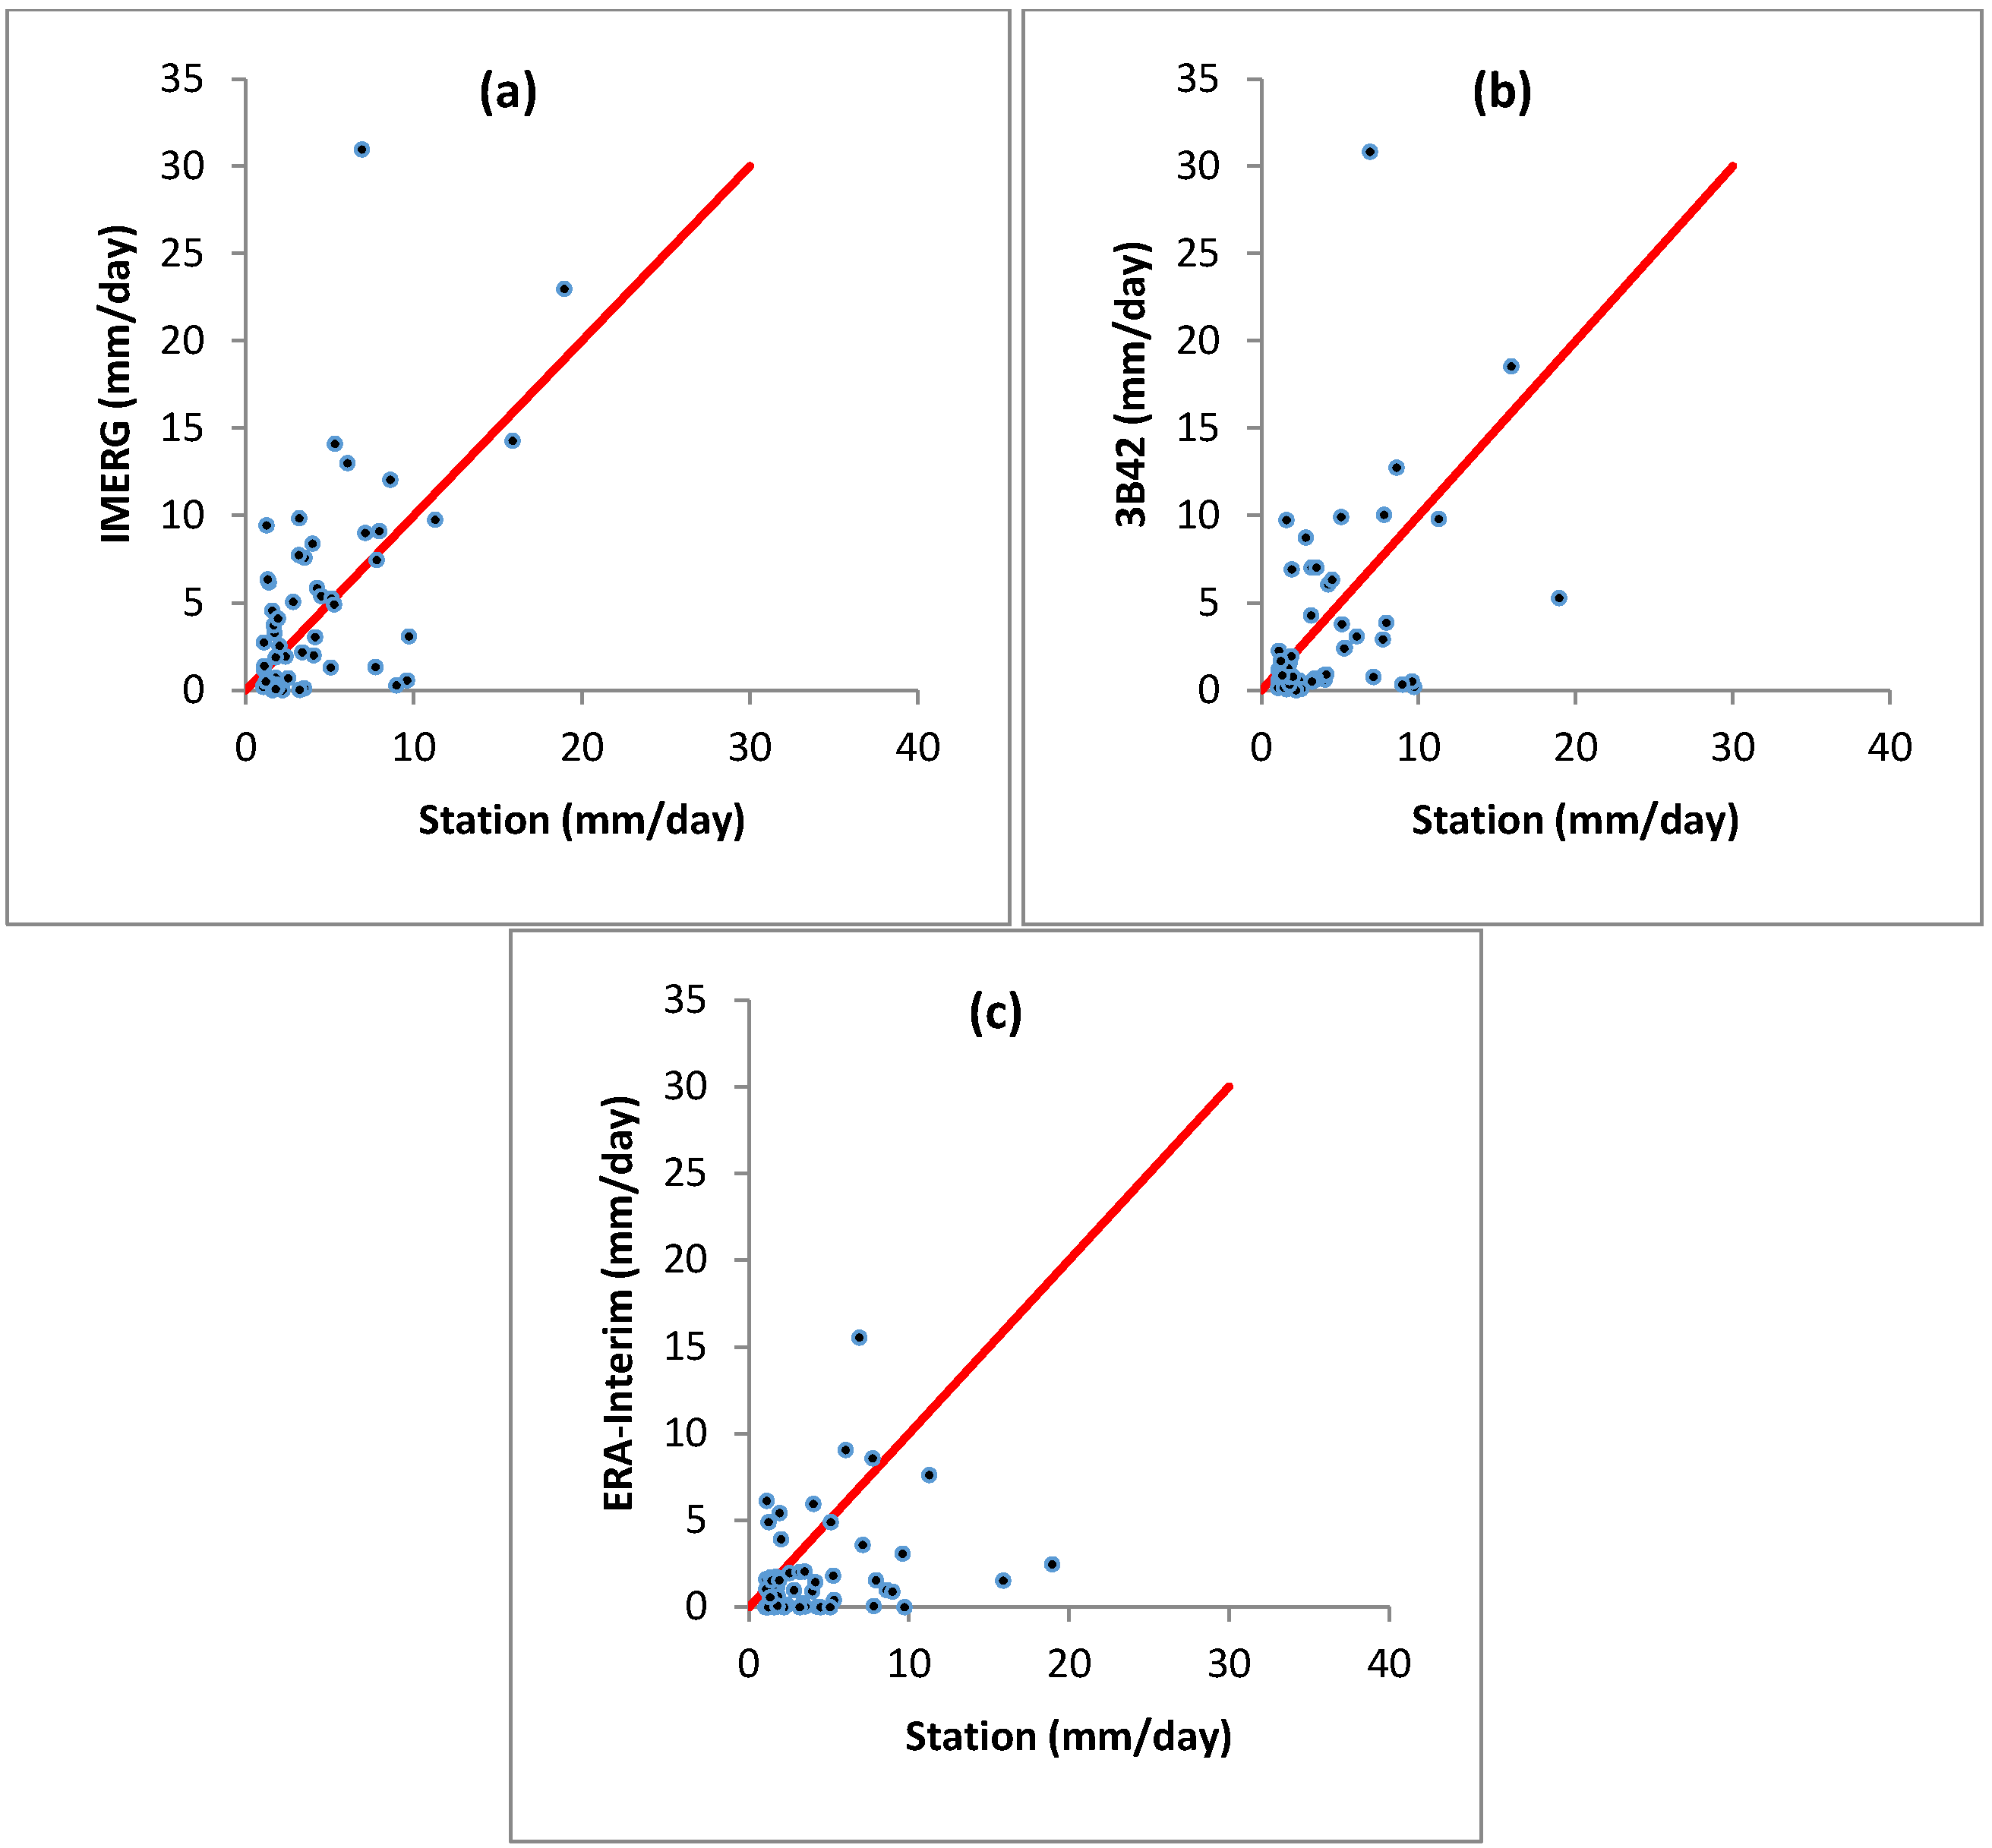
| No. of Events | RMSE (mm) | MAE (mm) | Bias (mm) | Mbias | Rbias | CC | |
|---|---|---|---|---|---|---|---|
| IMERG | 7.10 | 4.91 | −0.72 | 0.88 | −0.12 | 0.52 | |
| 3B42 | 53 | 7.72 | 5.39 | −1.59 | 0.75 | −0.25 | 0.42 |
| ERA-Interim | 7.35 | 4.31 | −3.33 | 0.52 | −0.48 | 0.38 |
| No. of Events | RMSE (mm) | MAE (mm) | Bias (mm) | Mbias | Rbias | CC | |
|---|---|---|---|---|---|---|---|
| IMERG | 6.38 | 4.42 | −1.86 | 0.75 | −0.25 | 0.46 | |
| 3B42 | 59 | 7.64 | 7.74 | −1.47 | 0.78 | −0.22 | 0.27 |
| ERA-Interim | 5.92 | 4.05 | −3.42 | 0.35 | −0.65 | 0.14 |
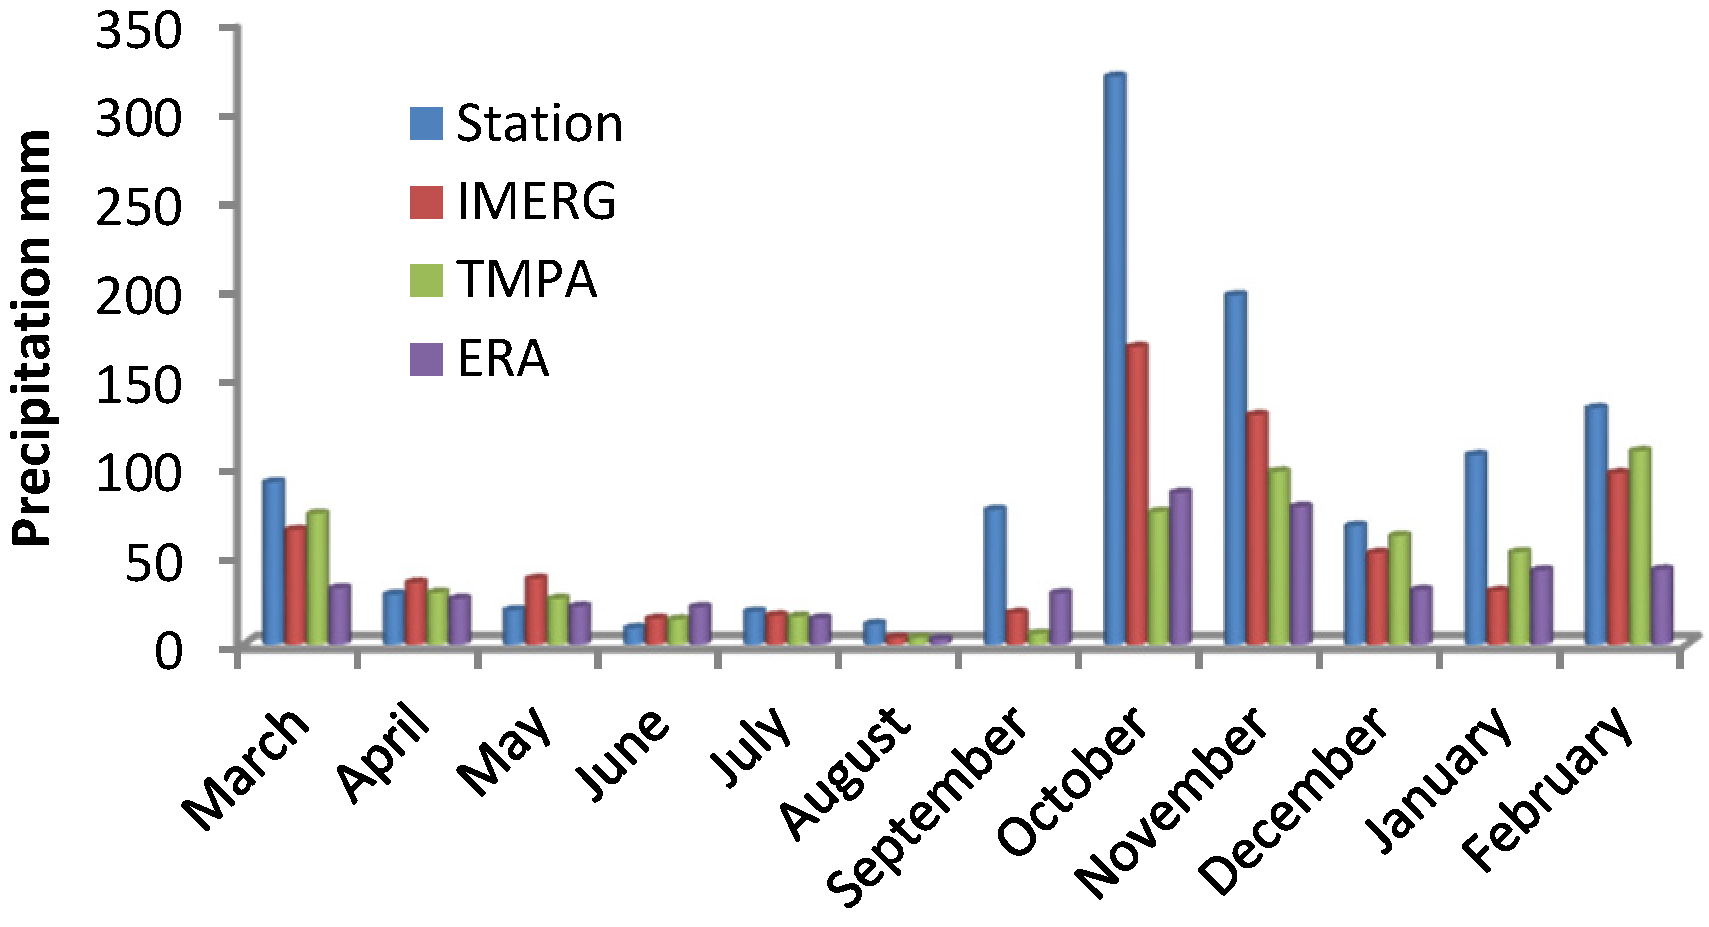
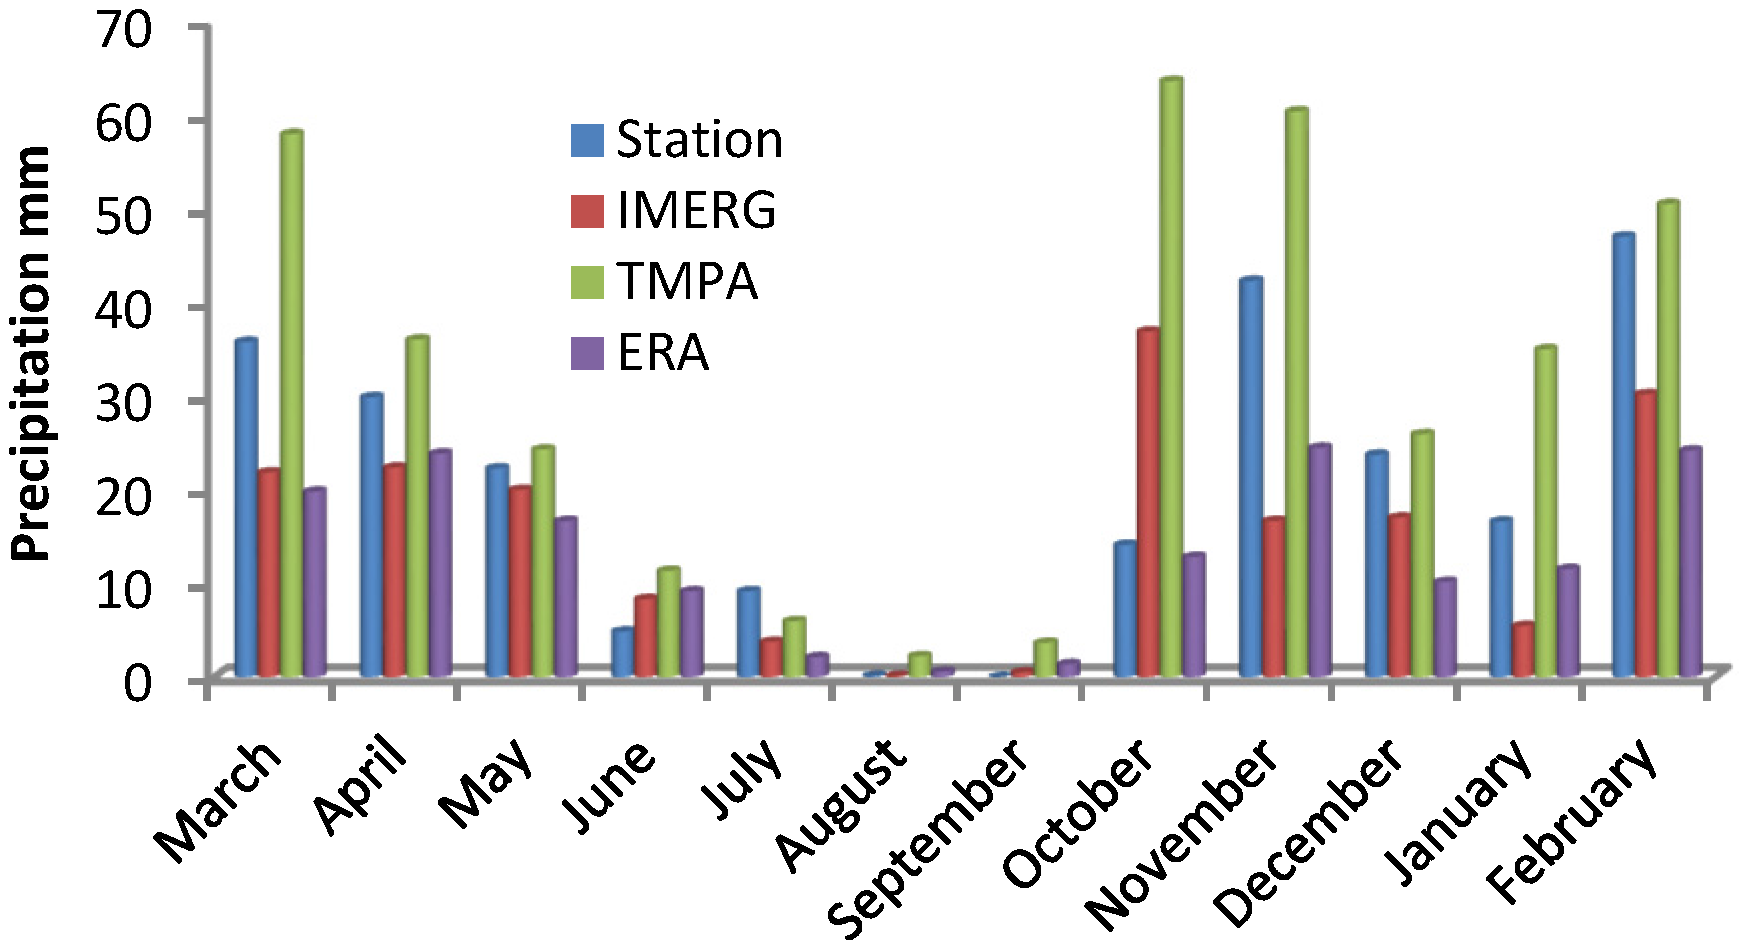
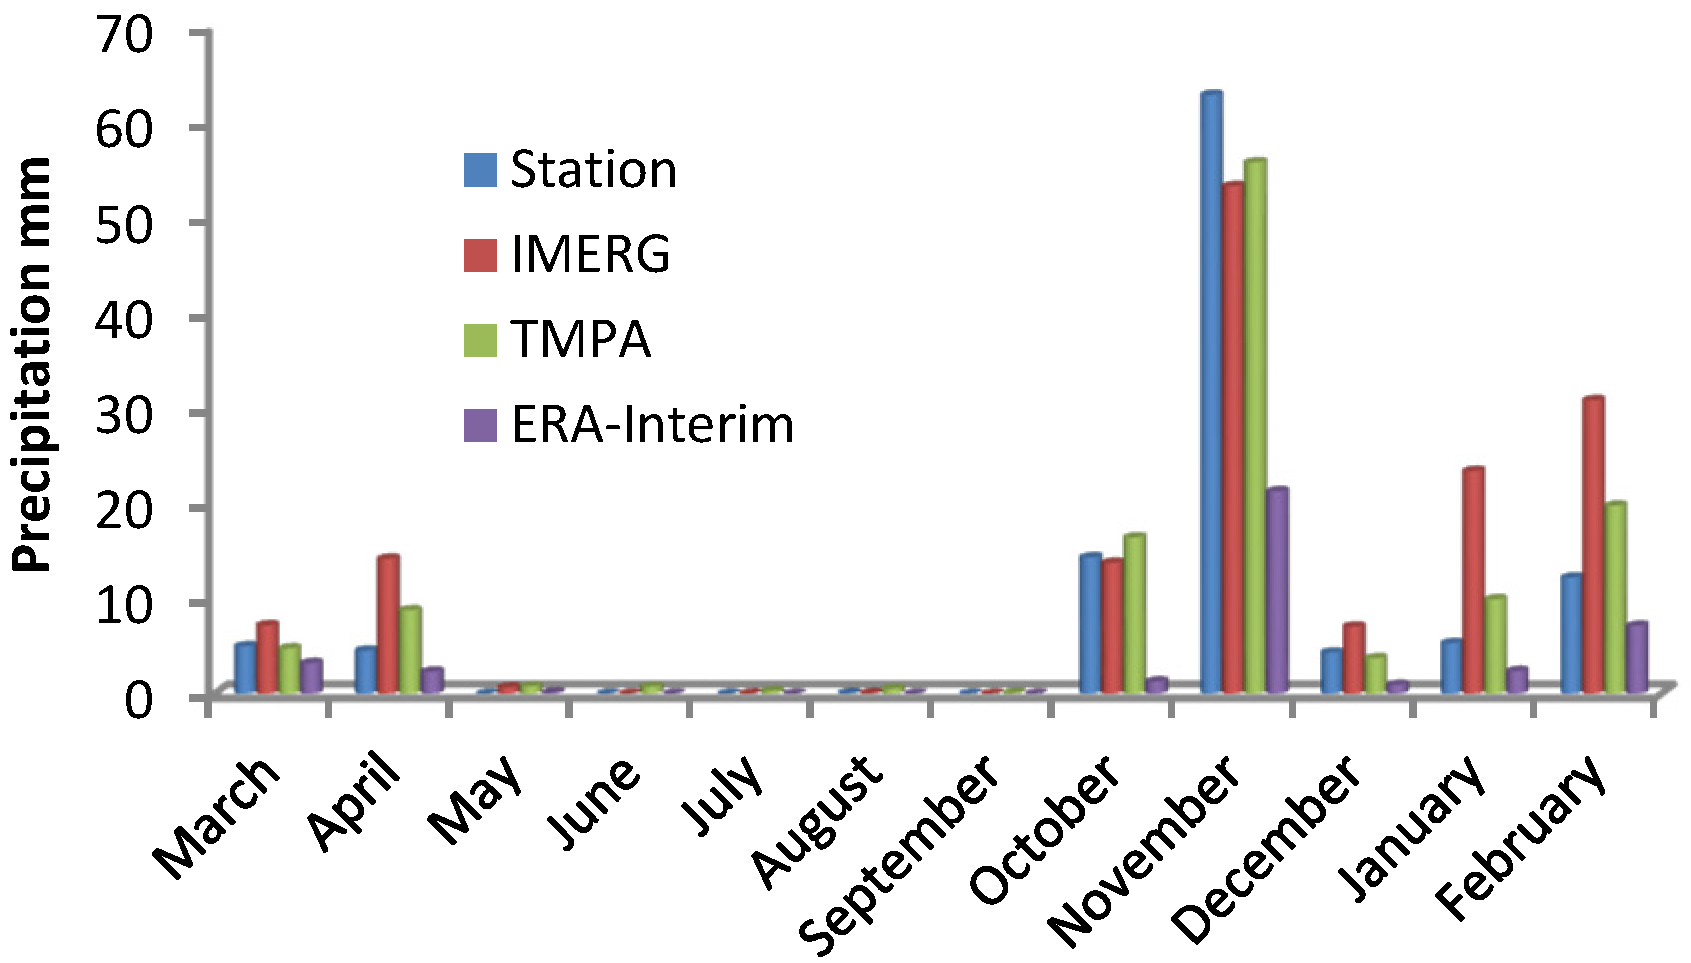
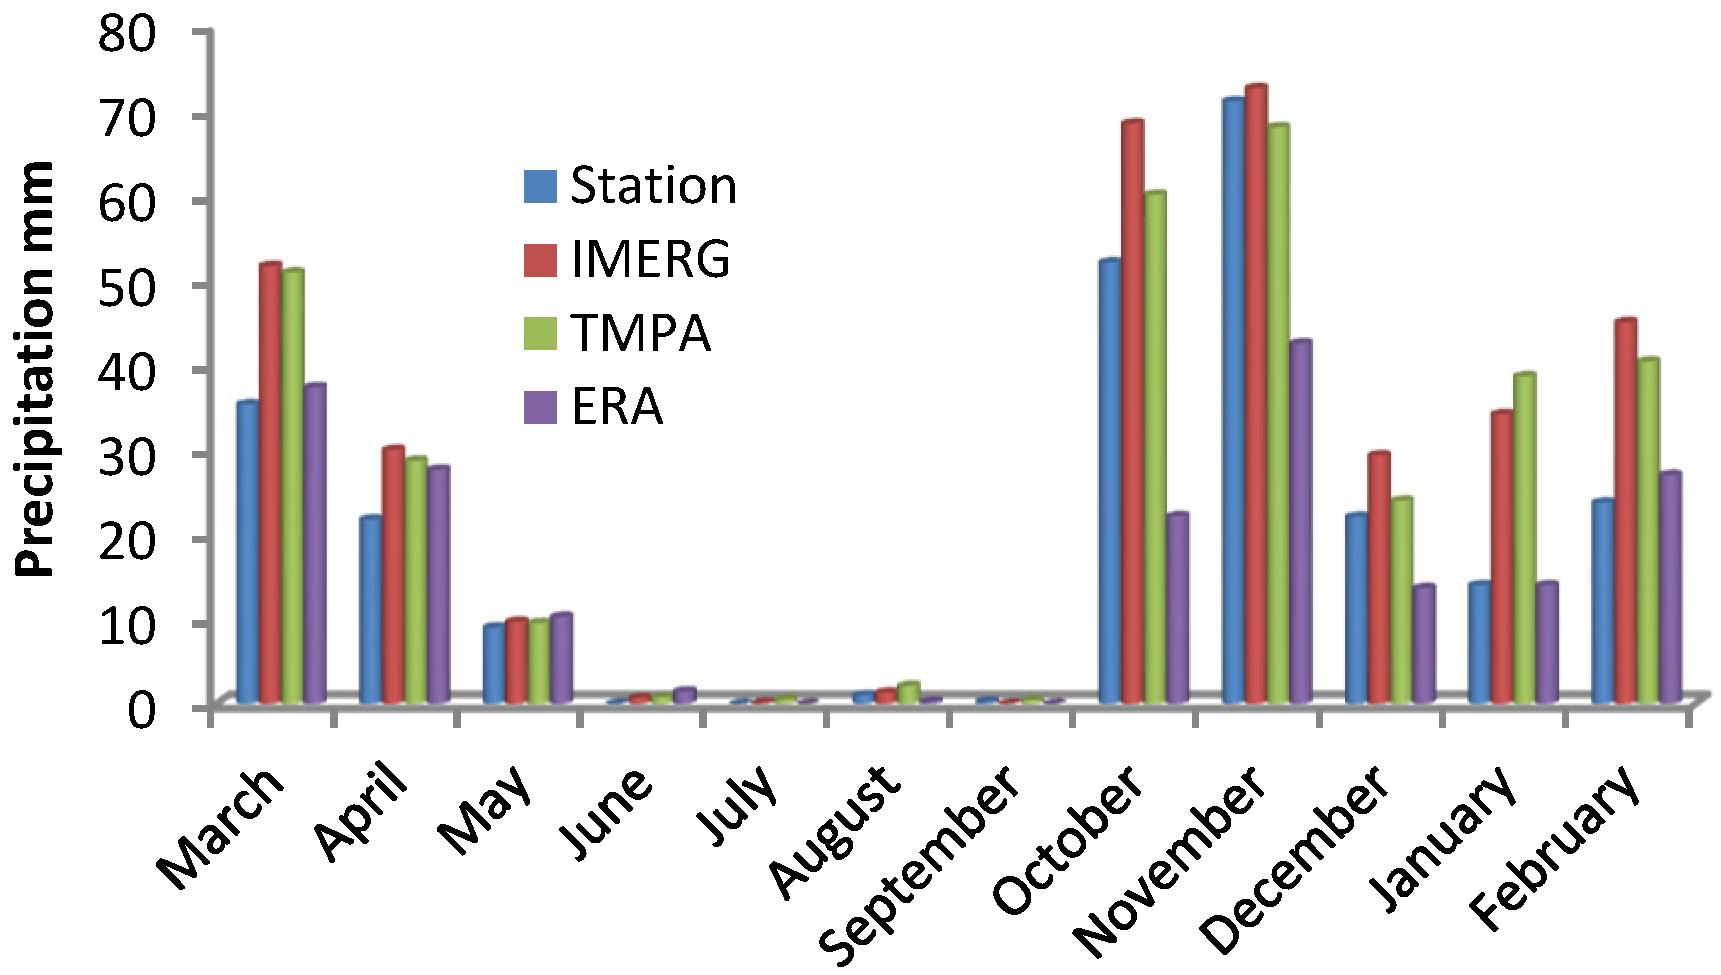
5.2. Monthly Evaluation
| IMERG | TMPA | ERA-Interim | |
|---|---|---|---|
| RMSE (mm) | 81.43 | 102.76 | 95.41 |
| MAE (mm) | 52.75 | 59.00 | 62.18 |
| Bias (mm) | −29.18 | −35.57 | −54.47 |
| Mbias | 0.98 | 0.93 | 0.58 |
| Rbias | −0.02 | −0.07 | −0.42 |
| CC | 0.76 | 0.52 | 0.85 |

| IMERG | 3B42 | ERA-Interim | |
|---|---|---|---|
| RMSE (mm) | 14.36 | 11.88 | 16.50 |
| MAE (mm) | 7.13 | 6.31 | 6.39 |
| Bias (mm) | 3.84 | 1.05 | −5.86 |
| Mbias | 1.49 | 1.21 | 0.39 |
| Rbias | 0.71 | 0.21 | −0.61 |
| CC | 0.82 | 0.89 | 0.95 |
| IMERG | 3B42 | ERA-Interim | |
|---|---|---|---|
| RMSE (mm) | 16.94 | 15.64 | 16.87 |
| MAE (mm) | 11.50 | 10.31 | 10.34 |
| Bias (mm) | 7.70 | 4.56 | −5.67 |
| Mbias | 1.62 | 1.40 | 0.82 |
| Rbias | 0.62 | 0.57 | −0.18 |
| CC | 0.88 | 0.85 | 0.84 |
| IMERG | 3B42 | ERA-Interim | |
|---|---|---|---|
| RMSE (mm) | 19.88 | 20.61 | 14.74 |
| MAE (mm) | 14.08 | 14.55 | 11.08 |
| Bias (mm) | −5.14 | 11.56 | −7.34 |
| Mbias | 1.13 | 2.03 | 0.82 |
| Rbias | 0.13 | 1.03 | −0.18 |
| CC | 0.57 | 0.69 | 0.80 |

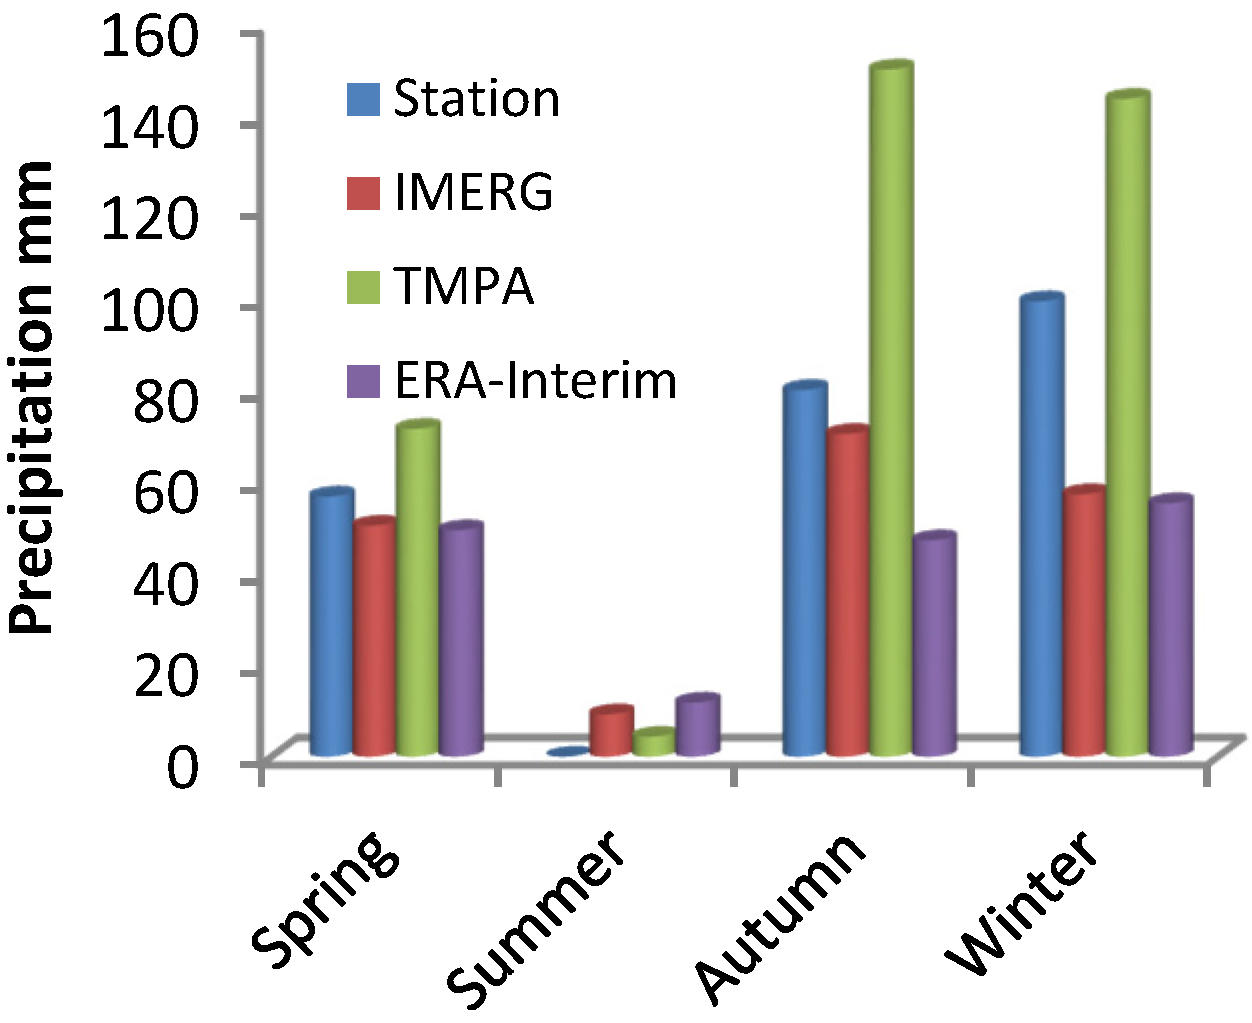
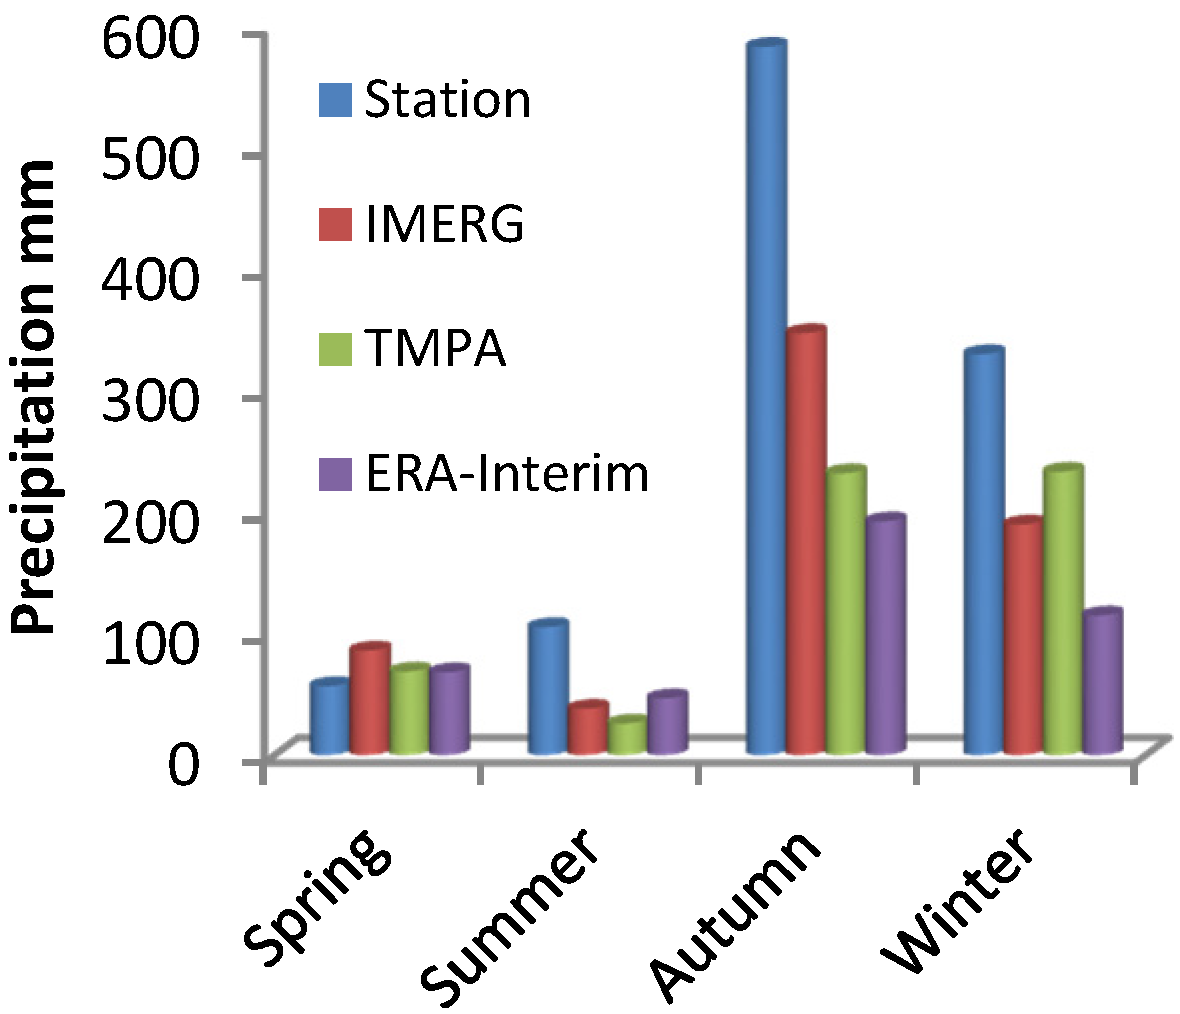
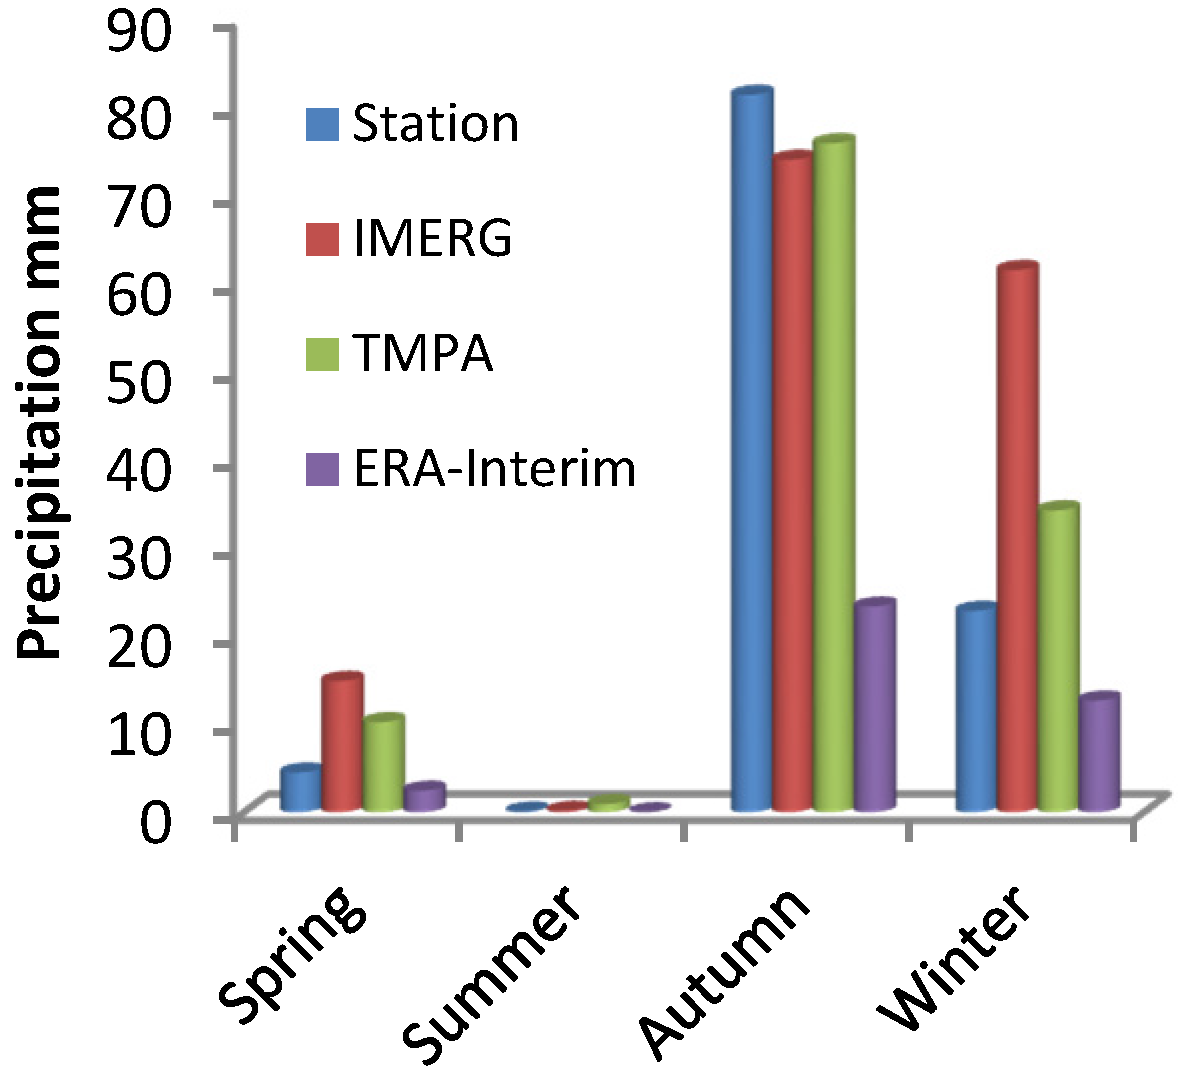
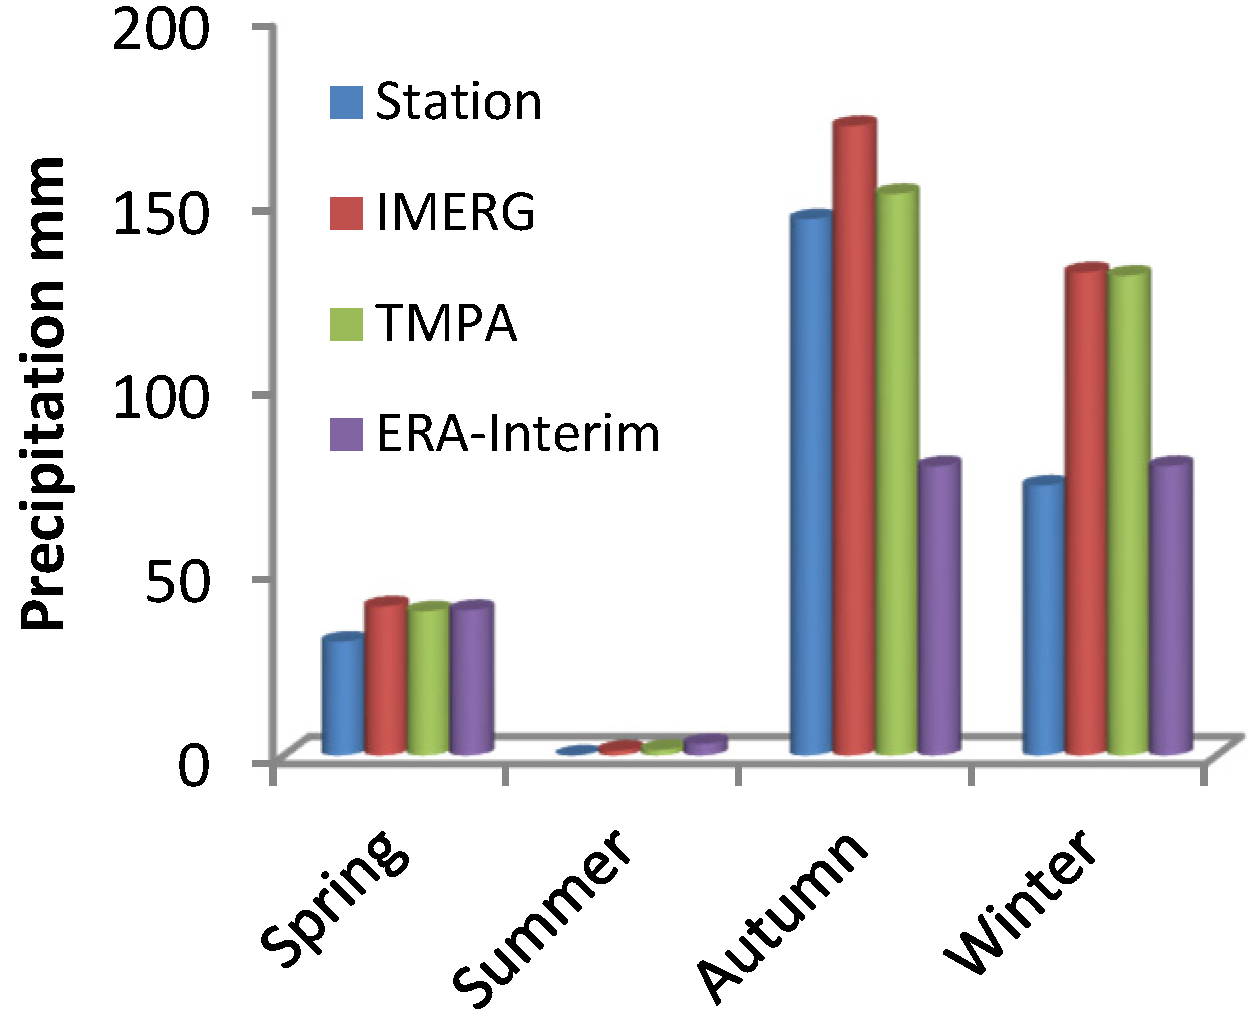
5.3. Seasonal Evaluation
| IMERG | 3B42 | ERA-Interim | |
|---|---|---|---|
| RMSE (mm) | 206.11 | 232.06 | 237.99 |
| MAE (mm) | 162.68 | 157.28 | 179.10 |
| Bias (mm) | −97.88 | −106.72 | −163.03 |
| Mbias | 0.96 | 0.93 | 0.58 |
| Rbias | −0.04 | −0.07 | −0.42 |
| CC | 0.85 | 0.75 | 0.93 |
| IMERG | 3B42 | ERA-Interim | |
|---|---|---|---|
| RMSE (mm) | 30.37 | 17.81 | 30.12 |
| MAE (mm) | 22.74 | 13.58 | 17.99 |
| Bias (mm) | 10.46 | 3.14 | −17.59 |
| Mbias | 1.60 | 1.21 | 0.39 |
| Rbias | 0.60 | 0.21 | −0.61 |
| CC | 0.83 | 0.95 | 0.92 |
| IMERG | 3B42 | ERA-Interim | |
|---|---|---|---|
| RMSE (mm) | 34.73 | 36.36 | 39.43 |
| MAE (mm) | 27.52 | 26.69 | 28.00 |
| Bias (mm) | 17.87 | 18.26 | −17.02 |
| Mbias | 1.45 | 1.56 | 0.82 |
| Rbias | 0.64 | 0.56 | −0.18 |
| CC | 0.95 | 0.92 | 0.88 |
| IMERG | 3B42 | ERA-Interim | |
|---|---|---|---|
| RMSE (mm) | 43.68 | 46.48 | 33.18 |
| MAE (mm) | 34.54 | 35.57 | 27.54 |
| Bias (mm) | −15.42 | 34.67 | −22.01 |
| Mbias | 1.13 | 2.03 | 0.82 |
| Rbias | 0.13 | 1.03 | −0.18 |
| CC | 0.84 | 0.93 | 0.90 |

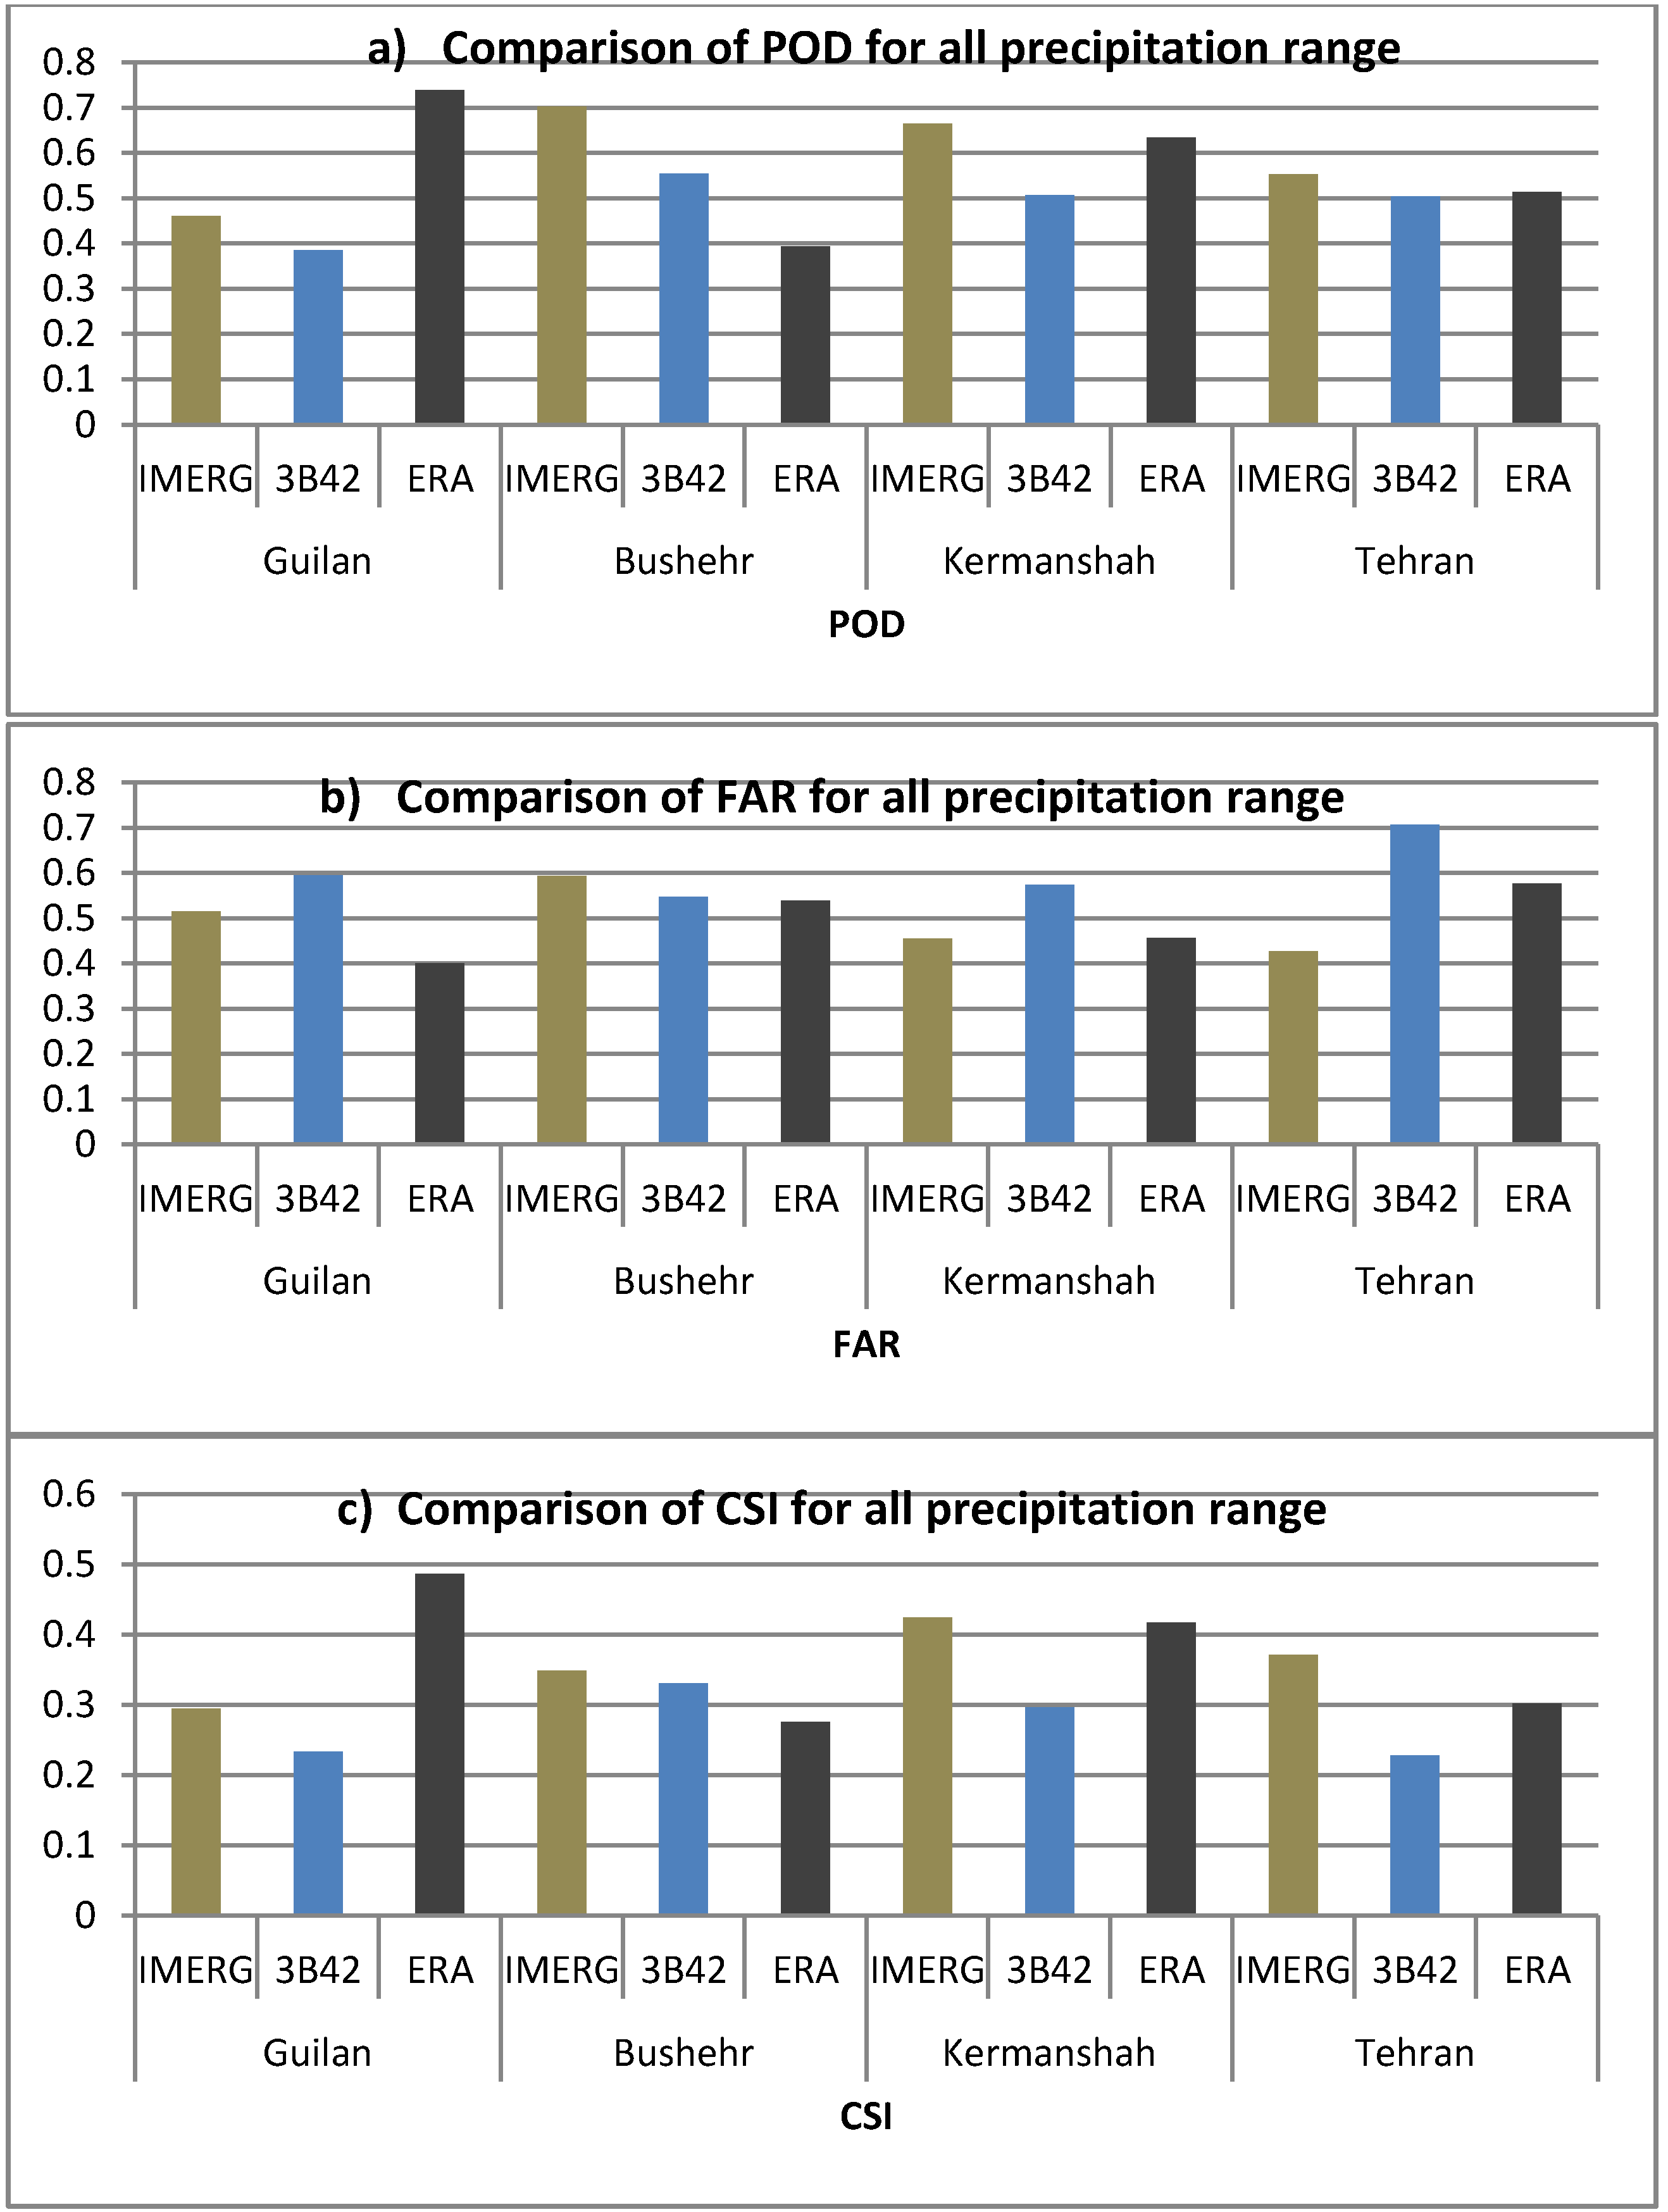
5.4. Evaluation of Dichotomous Estimates/Forecasts
| POD | FAR | CSI | ||||||||
|---|---|---|---|---|---|---|---|---|---|---|
| Number of Daily Events | IMERG | 3B42 | ERA | IMERG | 3B42 | ERA | IMERG | 3B42 | ERA | |
| Guilan (G8) | 105 | 0.46 | 0.39 | 0.74 | 0.52 | 0.59 | 0.40 | 0.29 | 0.23 | 0.49 |
| Bushehr (G4) | 19 | 0.70 | 0.56 | 0.39 | 0.59 | 0.55 | 0.54 | 0.35 | 0.33 | 0.28 |
| Kermanshah (G5) | 53 | 0.66 | 0.51 | 0.63 | 0.45 | 0.57 | 0.46 | 0.42 | 0.30 | 0.42 |
| Tehran (G2) | 59 | 0.55 | 0.50 | 0.51 | 0.43 | 0.71 | 0.58 | 0.37 | 0.23 | 0.30 |

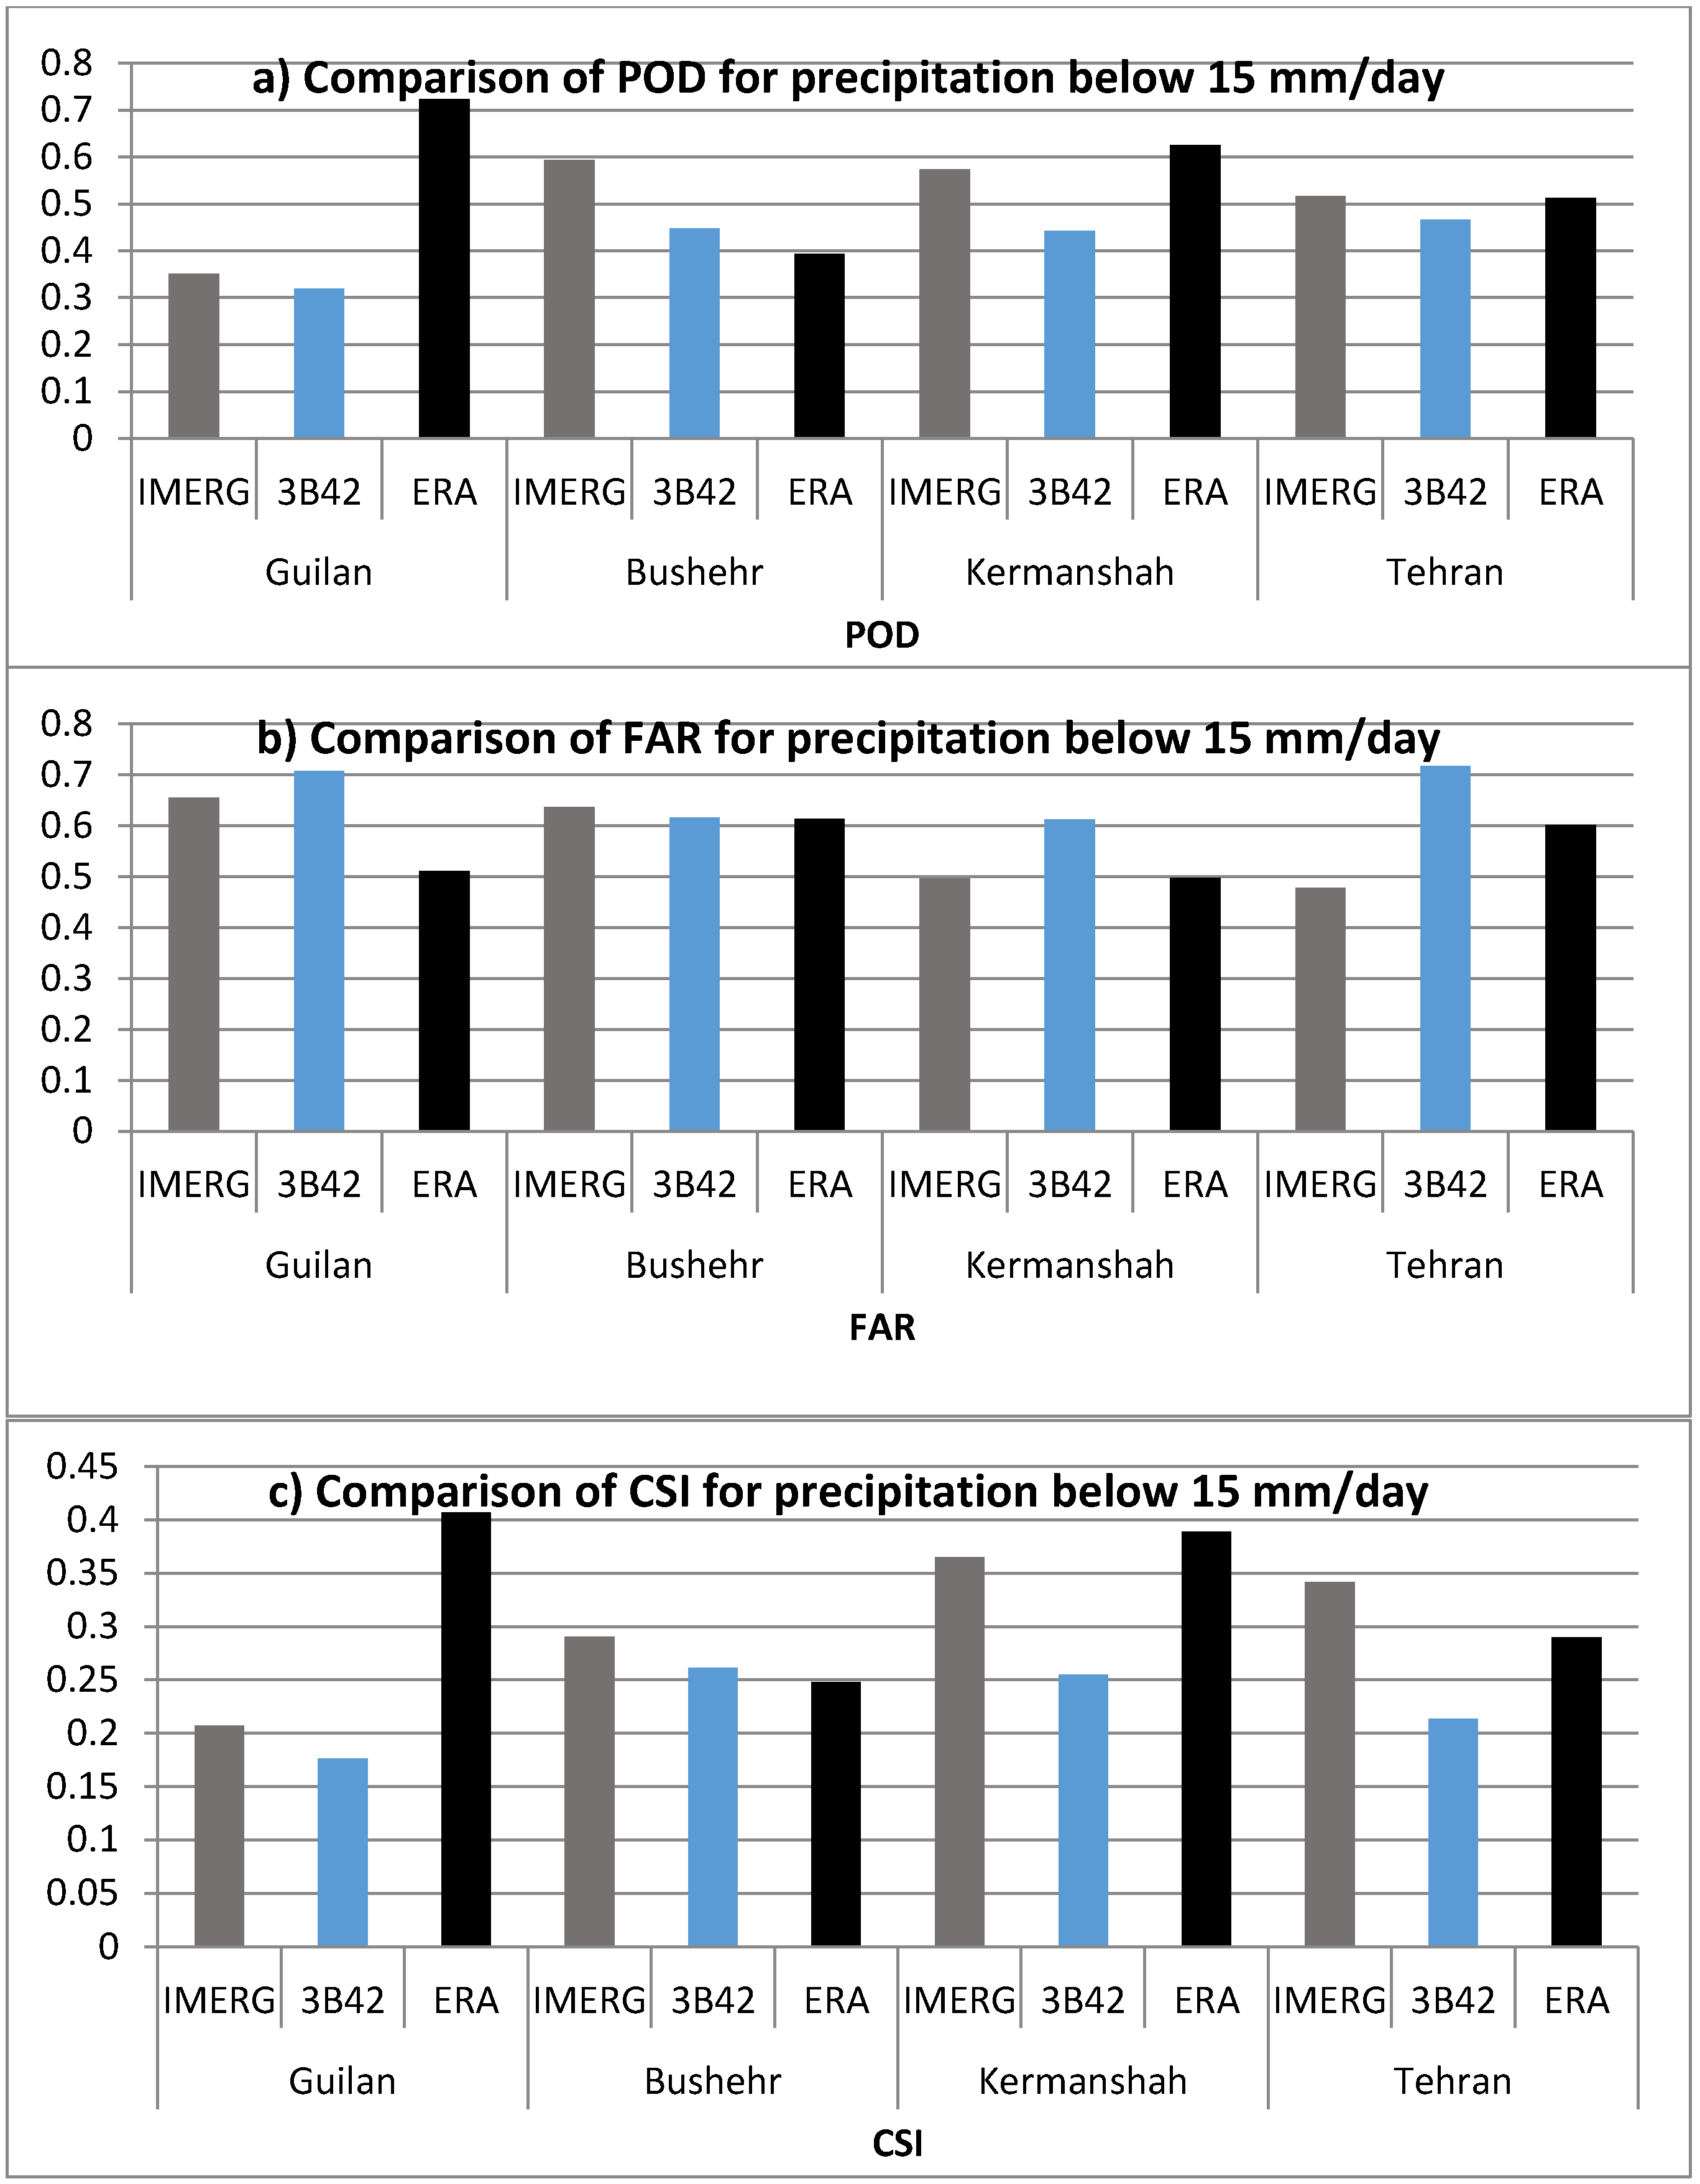
5.4.1. Evaluation of Dichotomous Estimates/Forecasts for Precipitation below 15 mm
| POD | FAR | CSI | ||||||||
|---|---|---|---|---|---|---|---|---|---|---|
| Number of Precipitation Days <15 mm | IMERG | 3B42 | ERA | IMERG | 3B42 | ERA | IMERG | 3B42 | ERA | |
| Guilan (G8) | 85 | 0.35 | 0.32 | 0.72 | 0.65 | 0.71 | 0.51 | 0.21 | 0.18 | 0.41 |
| Bushehr (G4) | 17 | 0.59 | 0.45 | 0.39 | 0.64 | 0.62 | 0.61 | 0.29 | 0.26 | 0.25 |
| Kermanshah (G5) | 51 | 0.57 | 0.44 | 0.63 | 0.50 | 0.61 | 0.50 | 0.37 | 0.25 | 0.39 |
| Tehran (G2) | 57 | 0.52 | 0.47 | 0.51 | 0.48 | 0.72 | 0.60 | 0.34 | 0.21 | 0.29 |
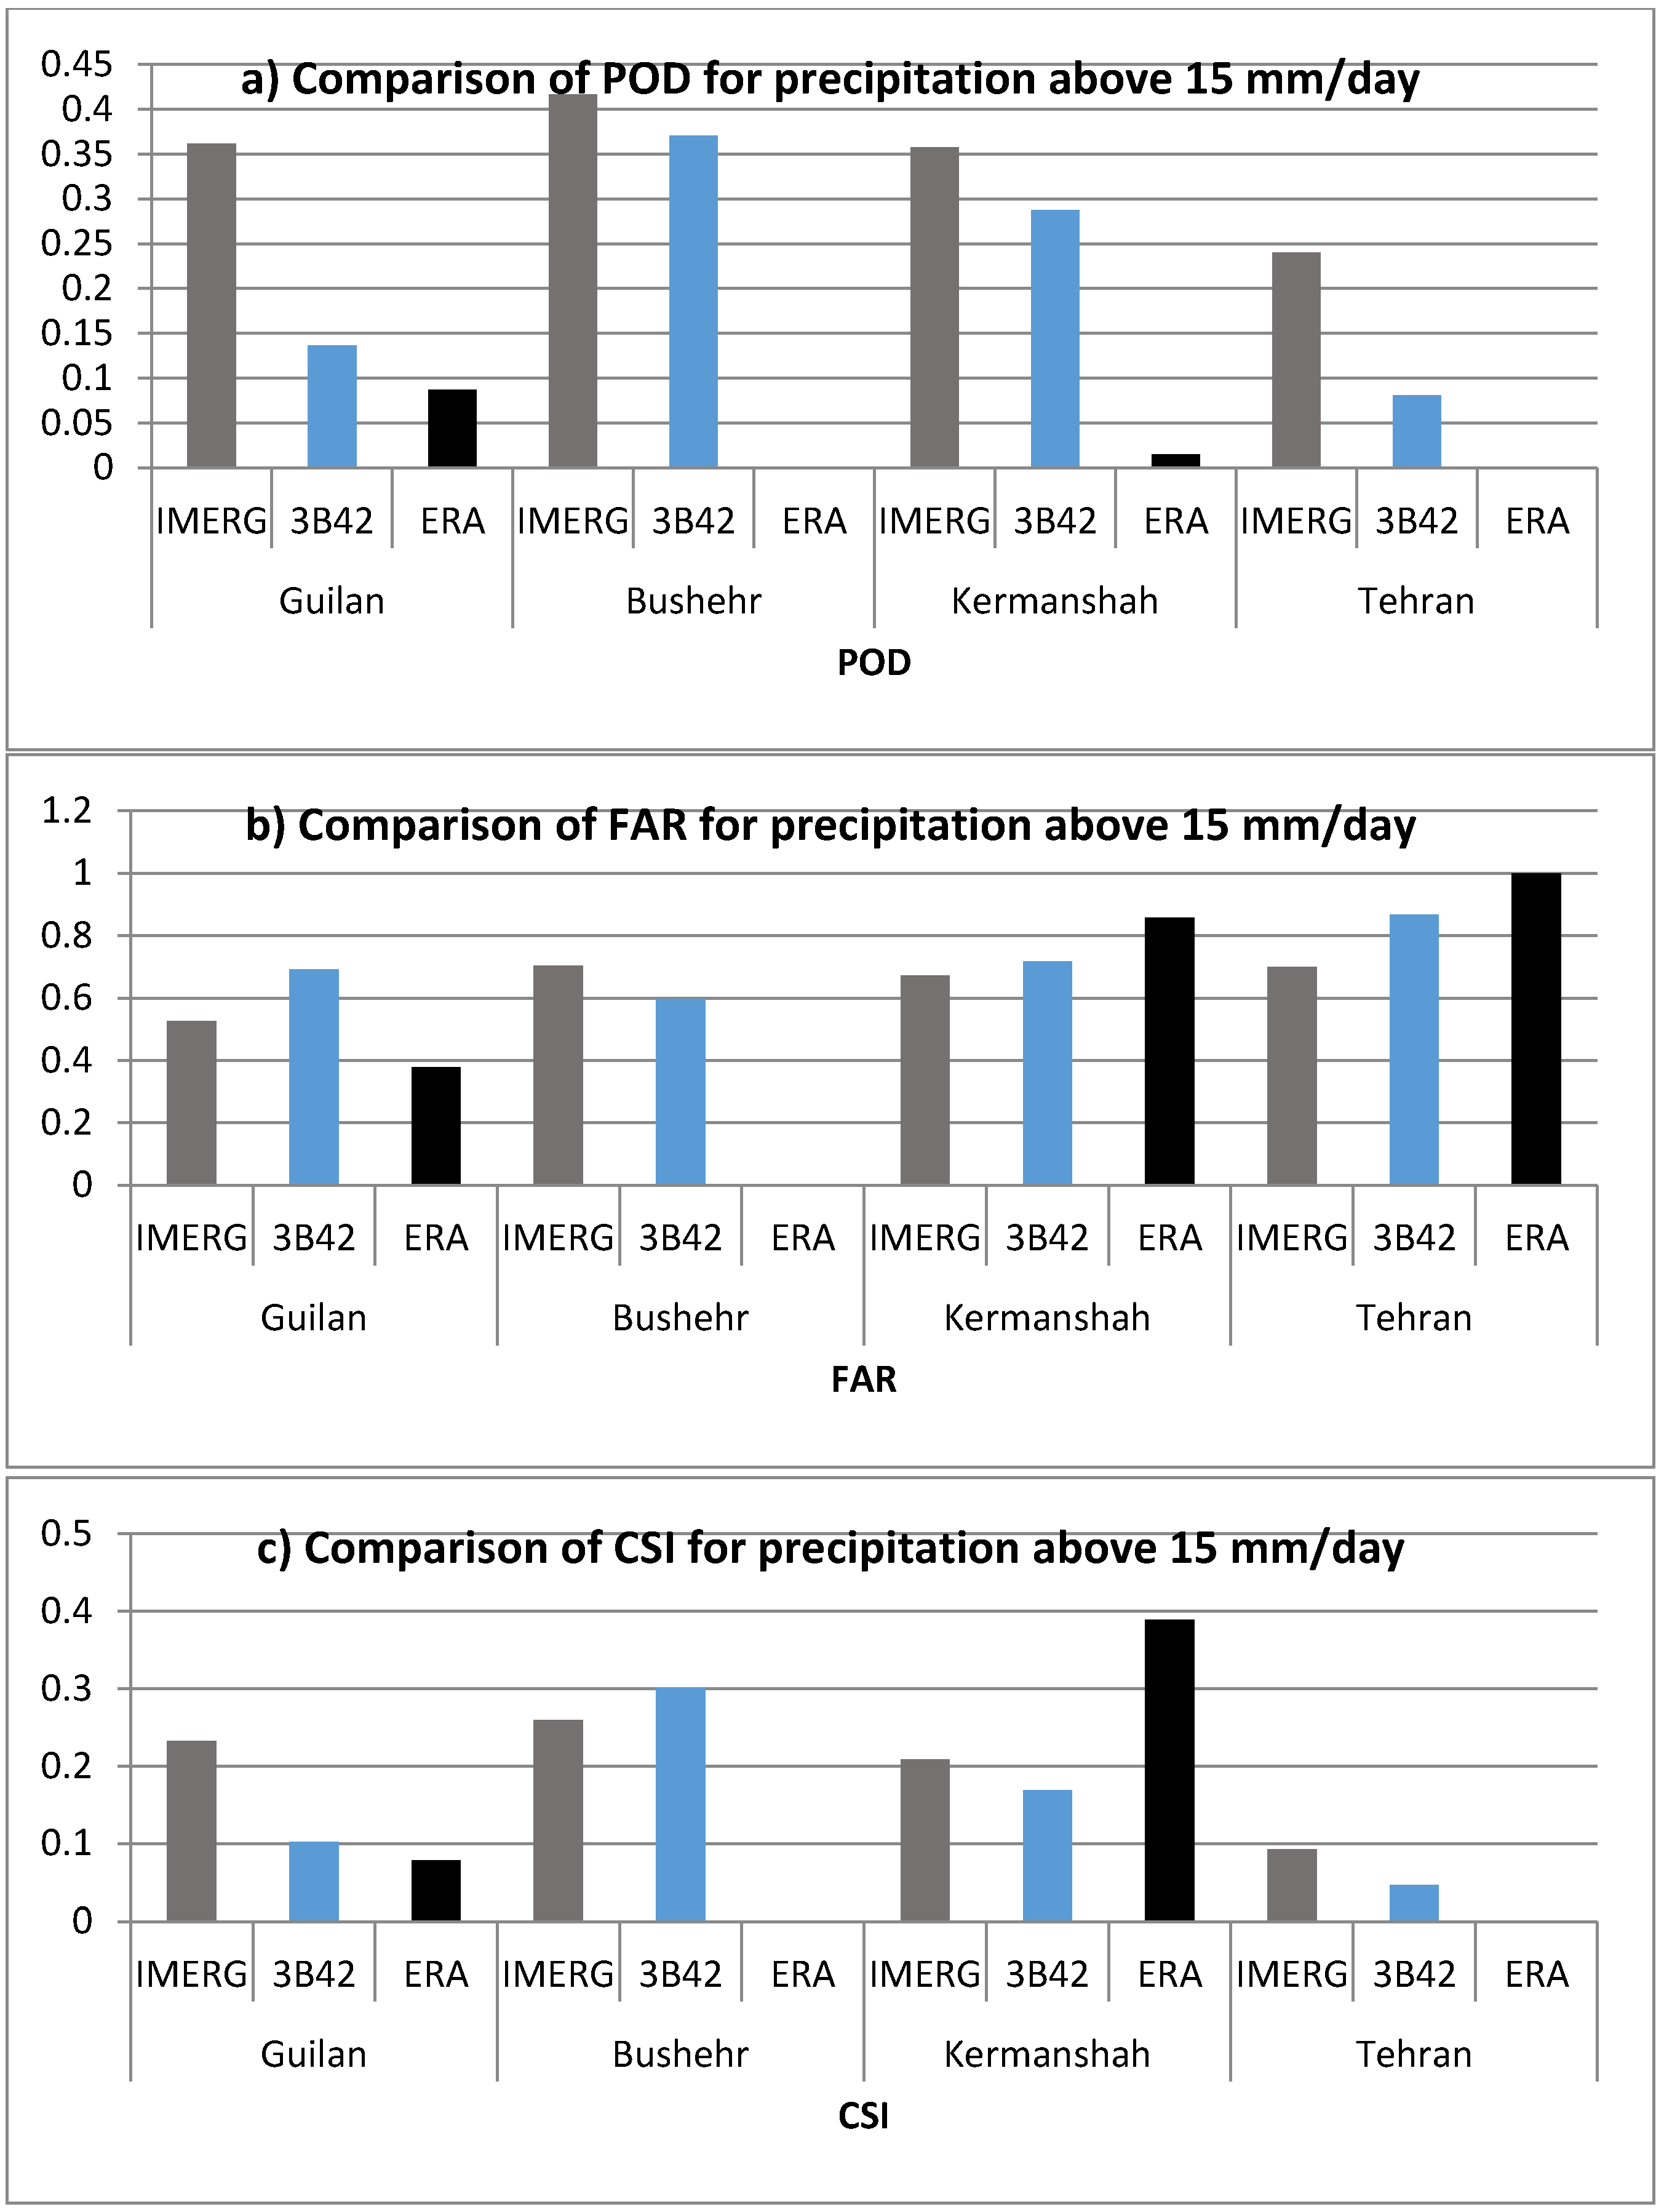
5.4.2. Evaluation of Dichotomous Estimates/Forecasts for Precipitation above 15 mm

| POD | FAR | CSI | ||||||||
|---|---|---|---|---|---|---|---|---|---|---|
| Number of Precipitation Days >15 mm | IMERG | 3B42 | ERA | IMERG | 3B42 | ERA | IMERG | 3B42 | ERA | |
| Guilan (G8) | 20 | 0.36 | 0.14 | 0.09 | 0.53 | 0.69 | 0.38 | 0.23 | 0.10 | 0.08 |
| Bushehr (G4) | 2 | 0.42 | 0.37 | 0.00 | 0.70 | 0.60 | ----- | 0.26 | 0.30 | 0.00 |
| Kermanshah (G5) | 2 | 0.36 | 0.29 | 0.02 | 0.67 | 0.72 | 0.86 | 0.21 | 0.17 | 0.39 |
| Tehran (G2) | 2 | 0.24 | 0.08 | 0.00 | 0.70 | 0.87 | 1.00 | 0.09 | 0.05 | 0.00 |
6. Conclusions
- Located in North of Iran, Guilan region enjoys a humid and subtropical climate. Under this climate condition, ERA-Interim performed reasonably on the basis of POD, FAR, CSI, RMSE and MAE indices on the daily scale. Additionally, the GPM constellation satellites’ product (IMERG) was superior to the TRMM Multi-satellite Precipitation Satellites (TMPA) product (3B42). Moreover, all three satellite/model products underestimated the precipitation in this region, a similar conclusion by Moazzami et al. [13] and Javanmard et al. [11] who tested 3B42 in this region. Such findings may be attributed to local wind and convective precipitation in this region so that satellites could not detect precipitation properly.
- Along the Zagros Mountains in the West of Iran, the Kermanshah region has a hot Mediterranean subtropical climate. All products, including IMERG, TRMM and ERA-Interim, underestimate the precipitation on the daily scale. With respect to contingency table metrics, IMERG outperformed ERA-Interim on the basis of POD, FAR, RMSE, Bias, Mbias, Rbias and CC (correlation coefficient) while ERA-Interim performed best in terms of MAE values on the daily scale. 3B42 outperformed other products on a monthly scale. Moreover, all three products showed rather the same behavior in seasonal scale but IMERG indicates a better CC.
- Just northwest of the Persian Gulf, Bushehr region is subject to warm and subtropical arid climate in low latitudes. In this area, on the daily scale, IMERG was more accurate in terms of Bias, Mbias, Rbias and CC while 3B42 was better in RMSE and MAE. Also, 3B42 outperformed other products on monthly and seasonal scales. On the other hand, IMERG showed reasonable results with a POD of 0.70 that could be due to the dual-frequency sensor based on the GPM which can detect light rain.
- Tehran is located in a semi-arid climate with the towering Alborz Mountains to its North and the central desert to the South. In this region, according to the daily scale precipitation, IMERG outperformed other precipitation products with POD, FAR and CSI.
- ERA-Interim yields weak results of POD, FAR and CSI for precipitation above 15 mm/day over Iran while IMERG is far superior to the other products in all study areas. ERA-Interim in Guilan region shows a significant value of POD for precipitation below 15 mm/day.
- Generally, in Guilan, Kermanshah, Tehran and Bushehr regions, all three products (IMERG, 3B42 and ERA-Interim) underestimate precipitation based on daily scale, which might be due to an inadequate number of gauges which are provided by the Global Precipitation Climatology Centre (GPCC) and used for bias correction in satellite products or/and the inability to measure available water in the air profiles. Moreover, in semi-arid and hot climates, rain drops may evaporate before reaching the ground [40].
- Based on monthly and seasonally scale, in Guilan, all products tend to underestimate while in Bushehr and Kermanshah, IMERG and 3B42, and in Tehran, 3B42 indicated overestimate.
Supplementary Materials
Acknowledgments
Author Contributions
Conflicts of Interest
References
- AghaKouchak, A.; Nasrollahi, N.; Li, J.; Imam, B.; Sorooshian, S. Geometrical characterization of precipitation patterns. J. Hydrometeorol. 2011, 12, 274–285. [Google Scholar] [CrossRef]
- AghaKouchak, A.; Mehran, A.; Norouzi, H.; Behrangi, A. Systematic and random error components in satellite precipitation data sets. Geophys. Res. Lett. 2012, 39. [Google Scholar] [CrossRef]
- Amitai, E.; Llort, X.; Sempere-Torres, D. Comparison of TRMM radar rainfall estimates with NOAA next-generation QPE. J. Meteorol. Soc. Japan 2009, 87A, 109–118. [Google Scholar] [CrossRef]
- De Coning, E. Optimizing satellite-based precipitation estimation for nowcasting of rainfall and flash flood events over the South African domain. Remote Sens. 2013, 5, 5702–5724. [Google Scholar] [CrossRef]
- De Coning, E.; Poolman, E. South African Weather Service operational satellite based precipitation estimation technique: Applications and improvements. Hydrol. Earth Syst. Sci. 2011, 15, 1131–1145. [Google Scholar] [CrossRef]
- Huffman, G.J.; Bolvin, D.T.; Braithwaite, D.; Hsu, K.; Joyce, R. Algorithm Theoretical Basis Document (ATBD) Version 4.5: NASA Global Precipitation Measurement (GPM) Integrated Multi-satellitE Retrievals for GPM (IMERG); NASA: Greenbelt, MD, USA, 2015.
- Huffman, G.J.; Bolvin, D.T.; Nelkin, E.J. Day 1 IMERG Final Run Release Notes; NASA Goddard Earth Sciences Data and Information Services Center: Greenbelt, MD, USA, 2015.
- Dee, D.P.; Uppala, S.M.; Simmons, A.J.; Berrisford, P.; Poli, P.; Kobayashi, S.; Andrae, U.; Balmaseda, M.A.; Balsamo, G.; Bauer, P.; et al. The ERA-Interim reanalysis: Configuration and performance of the data assimilation system. Q. J. R. Meteorol. Soc. 2011, 137, 553–597. [Google Scholar] [CrossRef]
- Ashouri, H.; Hsu, K.-L.; Sorooshian, S.; Braithwaite, D.K.; Knapp, K.R.; Cecil, L.D.; Nelson, B.R.; Prat, O.P. PERSIANN-CDR: Daily precipitation climate data record from multisatellite observations for hydrological and climate studies. Bull. Am. Meteorol. Soc. 2015, 96, 69–83. [Google Scholar] [CrossRef]
- Bao, X.; Zhang, F. Evaluation of NCEP–CFSR, NCEP–NCAR, ERA-Interim, and ERA-40 Reanalysis Datasets against independent sounding observations over the Tibetan Plateau. J. Clim. 2013, 26, 206–214. [Google Scholar] [CrossRef]
- Javanmard, S.; Yatagai, A.; Nodzu, M.I.; BodaghJamali, J.; Kawamoto, H. Comparing high-resolution gridded precipitation data with satellite rainfall estimates of TRMM_3B42 over Iran. Adv. Geosci. 2010, 25, 119–125. [Google Scholar] [CrossRef]
- Moazami, S.; Golian, S.; Kavianpour, M.R.; Hong, Y. Comparison of PERSIANN and V7 TRMM Multi-satellite Precipitation Analysis (TMPA) products with rain gauge data over Iran. Int. J. Remote Sens. 2013, 34, 8156–8171. [Google Scholar] [CrossRef]
- Moazami, S.; Golian, S.; Hong, Y.; Sheng, C.; Kavianpour, M.R. Comprehensive evaluation of four high-resolution satellite precipitation products over diverse climate conditions in Iran. Hydrol. Sci. J. 2015. [Google Scholar] [CrossRef]
- Tobin, K.J.; Bennett, M.E. Adjusting satellite precipitation data to facilitate hydrologic modeling. J. Hydrometeorol. 2010, 11, 966–978. [Google Scholar] [CrossRef]
- Yong, B.; Liu, D.; Gourley, J.J.; Tian, Y.; Huffman, G.J.; Ren, L.; Hong, Y. Global view of real-time TRMM multisatellite precipitation analysis: implications for its successor global precipitation measurement mission. Bull. Am. Meteorol. Soc. 2015, 96, 283–296. [Google Scholar] [CrossRef]
- Bowman, K.P. Comparison of TRMM precipitation retrievals with rain gauge data from ocean buoys. J. Clim. 2005, 18, 178–190. [Google Scholar] [CrossRef]
- Pan, M.; Wood, E.F. Impact of accuracy, spatial availability, and revisit time of satellite-derived surface soil moisture in a multiscale ensemble data assimilation system. IEEE J. Sel. Top. Appl. Earth Obs. Remote Sens. 2010, 3, 49–56. [Google Scholar] [CrossRef]
- Bell, T.L. Comparing satellite rainfall estimates with rain gauge data: Optimal strategies suggested by a spectral model. J. Geophys. Res. 2003, 108. [Google Scholar] [CrossRef]
- New, M.; Hulme, M.; Jones, P. Representing twentieth-century space–time climate variability: Part I: Development of a 1961-90 mean monthly terrestrial climatology. J. Clim. 1999, 12, 829–856. [Google Scholar] [CrossRef]
- Mitchell, T.D.; Jones, P.D. An improved method of constructing a database of monthly climate observations and associated high-resolution grids. Int. J. Climatol. 2005, 25, 693–712. [Google Scholar] [CrossRef]
- Schneider, U.; Ziese, M.; Becker, A.; Meyer-Christoffer, A.; Finger, P. Global Precipitation Analysis Products of the GPCC; Global Precipitation Climatology Centre (GPCC), Deutscher Wetterdienst: Offenbach, Germany, 2015. [Google Scholar]
- Yatagai, A.; Xie, P.; Alpert, P. Development of a daily gridded precipitation data set for the Middle East. Adv. Geosci. 2008, 12, 165–170. [Google Scholar] [CrossRef]
- Yatagai, A.; Arakawa, O.; Kamiguchi, K.; Kawamoto, H.; Nodzu, M.I.; Hamada, A. 44 year daily gridded precipitation dataset for Asia based on a dense network of rain gauges. Sci. Online Lett. Atmos. 2009, 5, 137–140. [Google Scholar] [CrossRef]
- Xie, P.; Chen, M.; Yang, S.; Yatagai, A.; Hayasaka, T.; Fukushima, Y.; Liu, C. A gauge-based analysis of daily precipitation over East Asia. J. Hydrometeorol. 2007, 8, 607–626. [Google Scholar] [CrossRef]
- Renzullo, L.; Chappell, A.; Raupach, T.; Dyce, P.; Li, M.; Shao, Q. An Assessment of Statistically Blended Satellite-Gauge Precipitation Data for Daily Rainfall Analysis in Australia. In Proceedings of the 34th International Symposium on Remote Sensing of Environment (ISRSE), Sydney, Australia, 10–15 April 2011.
- Hazarika, M.K.; Kafle, T.P.; Sharma, R.; Karki, S.; Shrestha, R.M.; Samarkoon, L. Statistical approach to discharge prediction for flood forecasts using TRMM data. In Proceedings of the 5th Annual Mekong Flood Forum, Ho Chi Minh City, Vietnam, 17–18 May 2007.
- Su, F.; Hong, Y.; Lettenmaier, D.P. Evaluation of TRMM Multisatellite Precipitation Analysis (TMPA) and its utility in hydrologic prediction in the La Plata Basin. J. Hydrometeorol. 2008, 9, 622–640. [Google Scholar] [CrossRef]
- Fleming, K.; Awange, J.L.; Kuhn, M.; Featherstone, W.E. Evaluating the TRMM 3B43 monthly precipitation product using gridded raingauge data over Australia. Aust. Meteorol. Oceanogr. J. 2011, 61, 171–184. [Google Scholar]
- Huffman, G.J.; Bolvin, D.T.; Nelkin, E.J.; Wolff, D.B.; Adler, R.F.; Gu, G.; Hong, Y.; Bowman, K.P.; Stocker, E.F. The TRMM Multisatellite Precipitation Analysis (TMPA): Quasi-Global, multiyear, combined-sensor precipitation estimates at fine scales. J. Hydrometeorol. 2007, 8, 38–55. [Google Scholar] [CrossRef]
- Chiodo, G.; Haimberger, L. Interannual changes in mass consistent energy budgets from ERA-Interim and satellite data. J. Geophys. Res. 2010, 115, D2. [Google Scholar] [CrossRef]
- Modarres, R. Regional precipitation climates of Iran. J. Hydrol. (NZ) 2006, 45, 13–27. [Google Scholar]
- Fisher, W.B. The Cambridge History of Iran: Climate; Cambridge University Press: Cambridge, UK, 1968. [Google Scholar]
- NASA. “GPM_3IMERGHH 03”. Available online: http://disc.sci.gsfc.nasa.gov/SSW/ (accessed on 6 June 2015).
- European Centre for Medium-Range Weather Forecasts (ECMWF). “ERA Interim, Daily”. Available online: http://apps.ecmwf.int/datasets/data/interim-full-daily/ (accessed on 1 July 2015).
- Ebert, E.E.; Janowiak, J.E.; Kidd, C. Comparison of near-real-time precipitation estimates from satellite observations and numerical models. Bull. Am. Meteorol. Soc. 2007, 88, 47–64. [Google Scholar] [CrossRef]
- Thornes, J.E.; Stephenson, D.B. How to judge the quality and value of weather forecast products. Meteorol. Appl. 2001, 8, 307–314. [Google Scholar] [CrossRef]
- Wilks, D.S. Statistical Methods in the Atmospheric Sciences; Elsevier: New York, NY, USA, 2006. [Google Scholar]
- Nasrollahi, N. False alarm in satellite precipitation data. In Improving Infrared-Based Precipitation Retrieval Algorithms Using Multi-Spectral Satellite Imagery; Nasrollahi, N., Ed.; Springer International Publishing: Cham, Germany, 2015; pp. 7–12. [Google Scholar]
- Hou, A.Y.; Kakar, R.K.; Neeck, S.; Azarbarzin, A.A.; Kummerow, C.D.; Kojima, M.; Oki, R.; Nakamura, K.; Iguchi, T. The global precipitation measurement mission. Bull. Am. Meteorol. Soc. 2014, 95, 701–722. [Google Scholar] [CrossRef]
- Tesfagiorgis, K.; Mahani, S.E.; Krakauer, N.Y.; Khanbilvardi, R. Bias correction of satellite rainfall estimates using a radar-gauge product—A case study in Oklahoma (USA). Hydrol. Earth Syst. Sci. 2011, 15, 2631–2647. [Google Scholar] [CrossRef]
© 2016 by the authors; licensee MDPI, Basel, Switzerland. This article is an open access article distributed under the terms and conditions of the Creative Commons by Attribution (CC-BY) license (http://creativecommons.org/licenses/by/4.0/).
Share and Cite
Sharifi, E.; Steinacker, R.; Saghafian, B. Assessment of GPM-IMERG and Other Precipitation Products against Gauge Data under Different Topographic and Climatic Conditions in Iran: Preliminary Results. Remote Sens. 2016, 8, 135. https://doi.org/10.3390/rs8020135
Sharifi E, Steinacker R, Saghafian B. Assessment of GPM-IMERG and Other Precipitation Products against Gauge Data under Different Topographic and Climatic Conditions in Iran: Preliminary Results. Remote Sensing. 2016; 8(2):135. https://doi.org/10.3390/rs8020135
Chicago/Turabian StyleSharifi, Ehsan, Reinhold Steinacker, and Bahram Saghafian. 2016. "Assessment of GPM-IMERG and Other Precipitation Products against Gauge Data under Different Topographic and Climatic Conditions in Iran: Preliminary Results" Remote Sensing 8, no. 2: 135. https://doi.org/10.3390/rs8020135
APA StyleSharifi, E., Steinacker, R., & Saghafian, B. (2016). Assessment of GPM-IMERG and Other Precipitation Products against Gauge Data under Different Topographic and Climatic Conditions in Iran: Preliminary Results. Remote Sensing, 8(2), 135. https://doi.org/10.3390/rs8020135