
Vocalization Source Level Distributions and Pulse Compression Gains of Diverse Baleen Whale Species in the Gulf of Maine

Abstract
:
1. Introduction
2. Material and Methods
2.1. Gulf of Maine 2006 Experiment Acoustic Data Collection
2.2. Baleen Whale Vocalization Detection and Classification
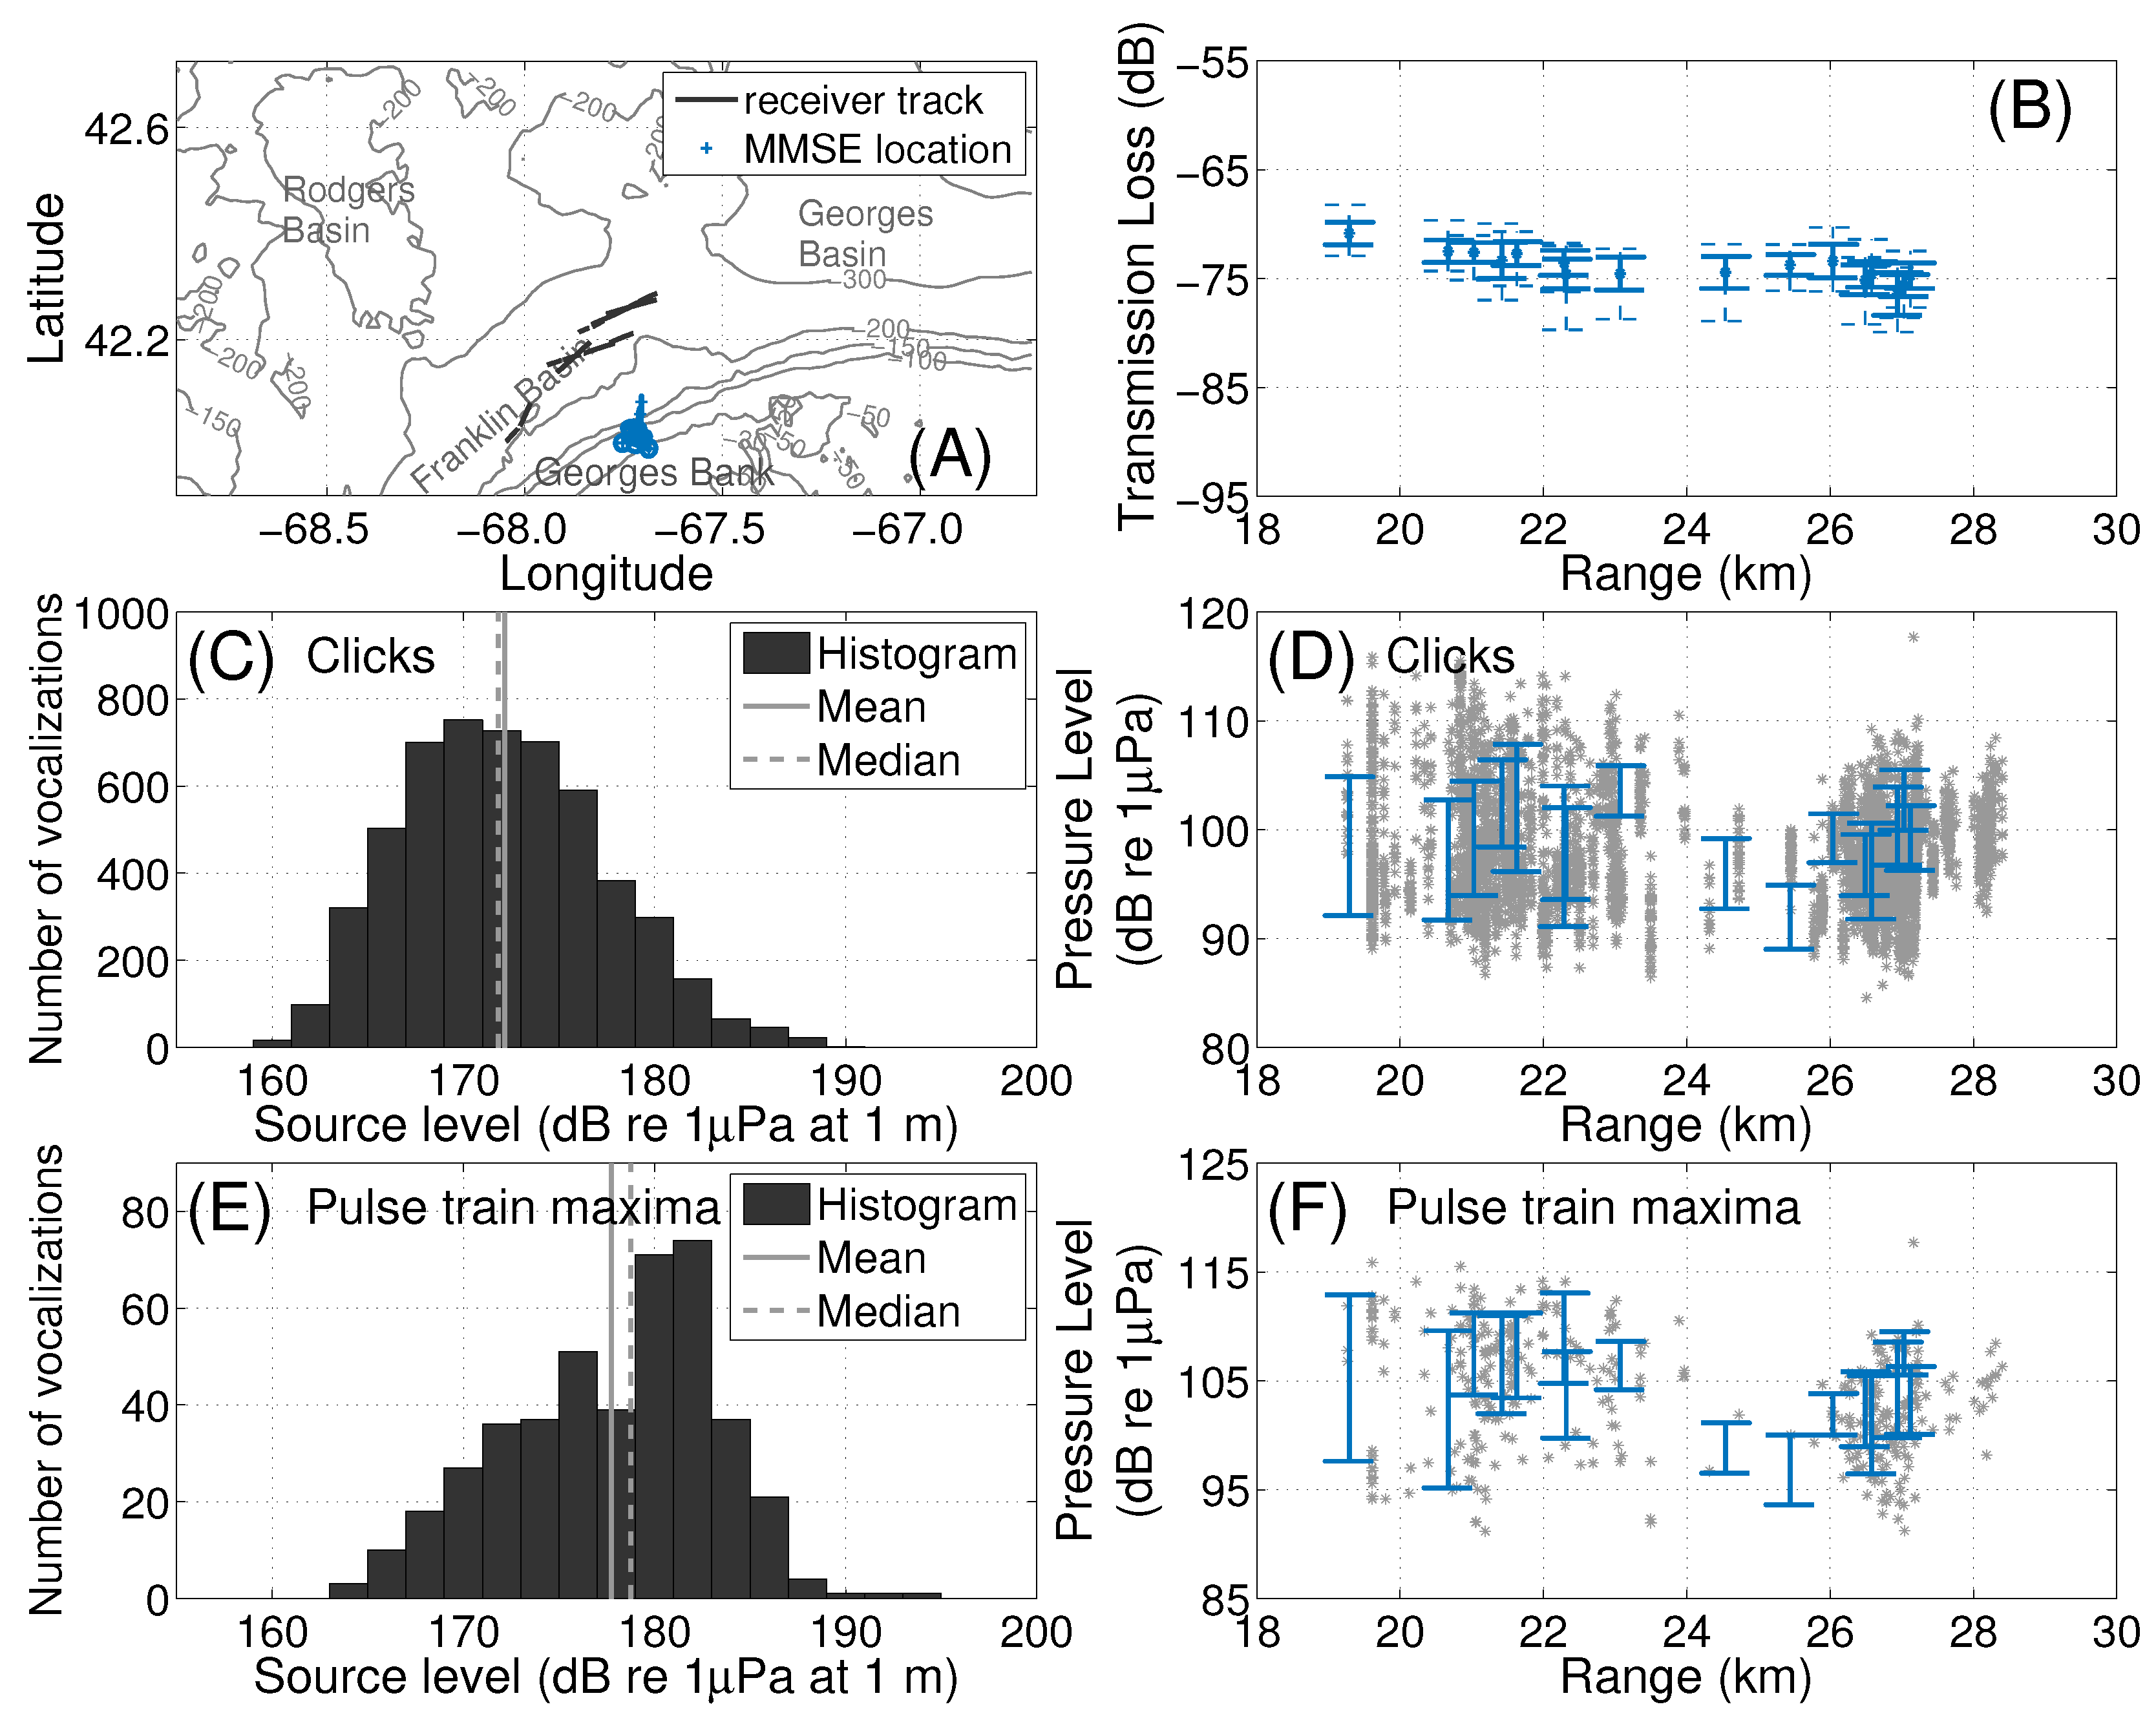
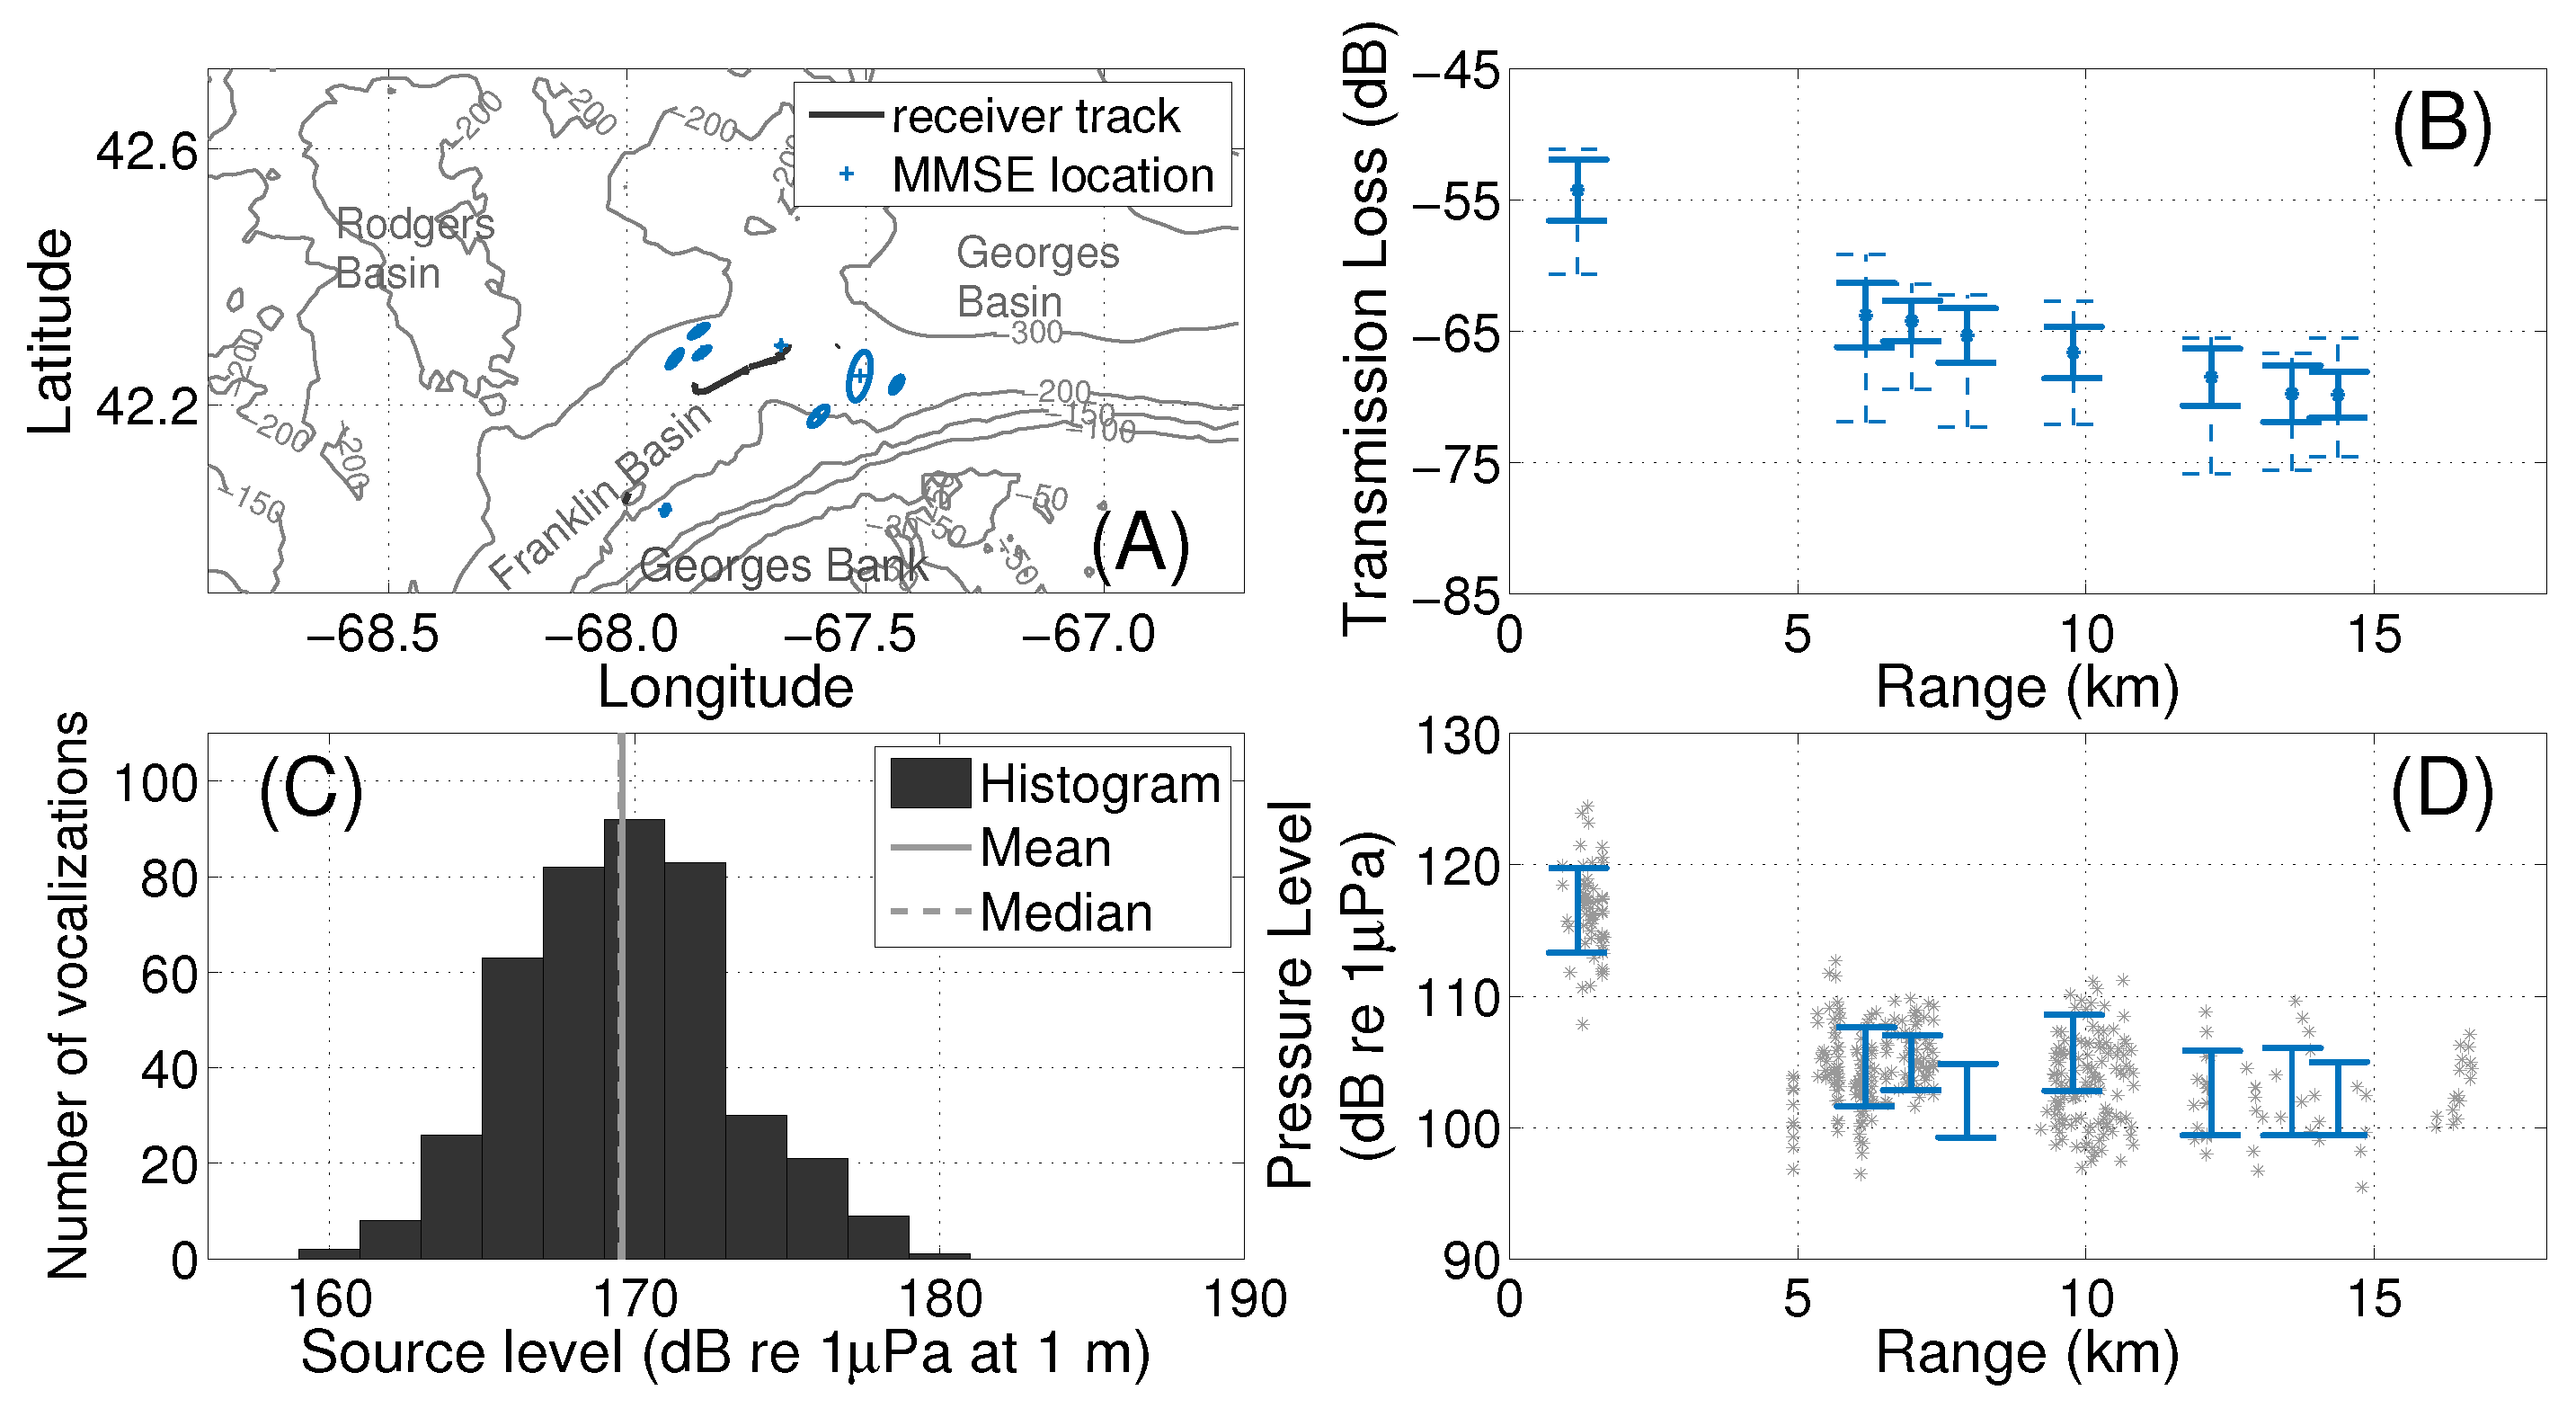
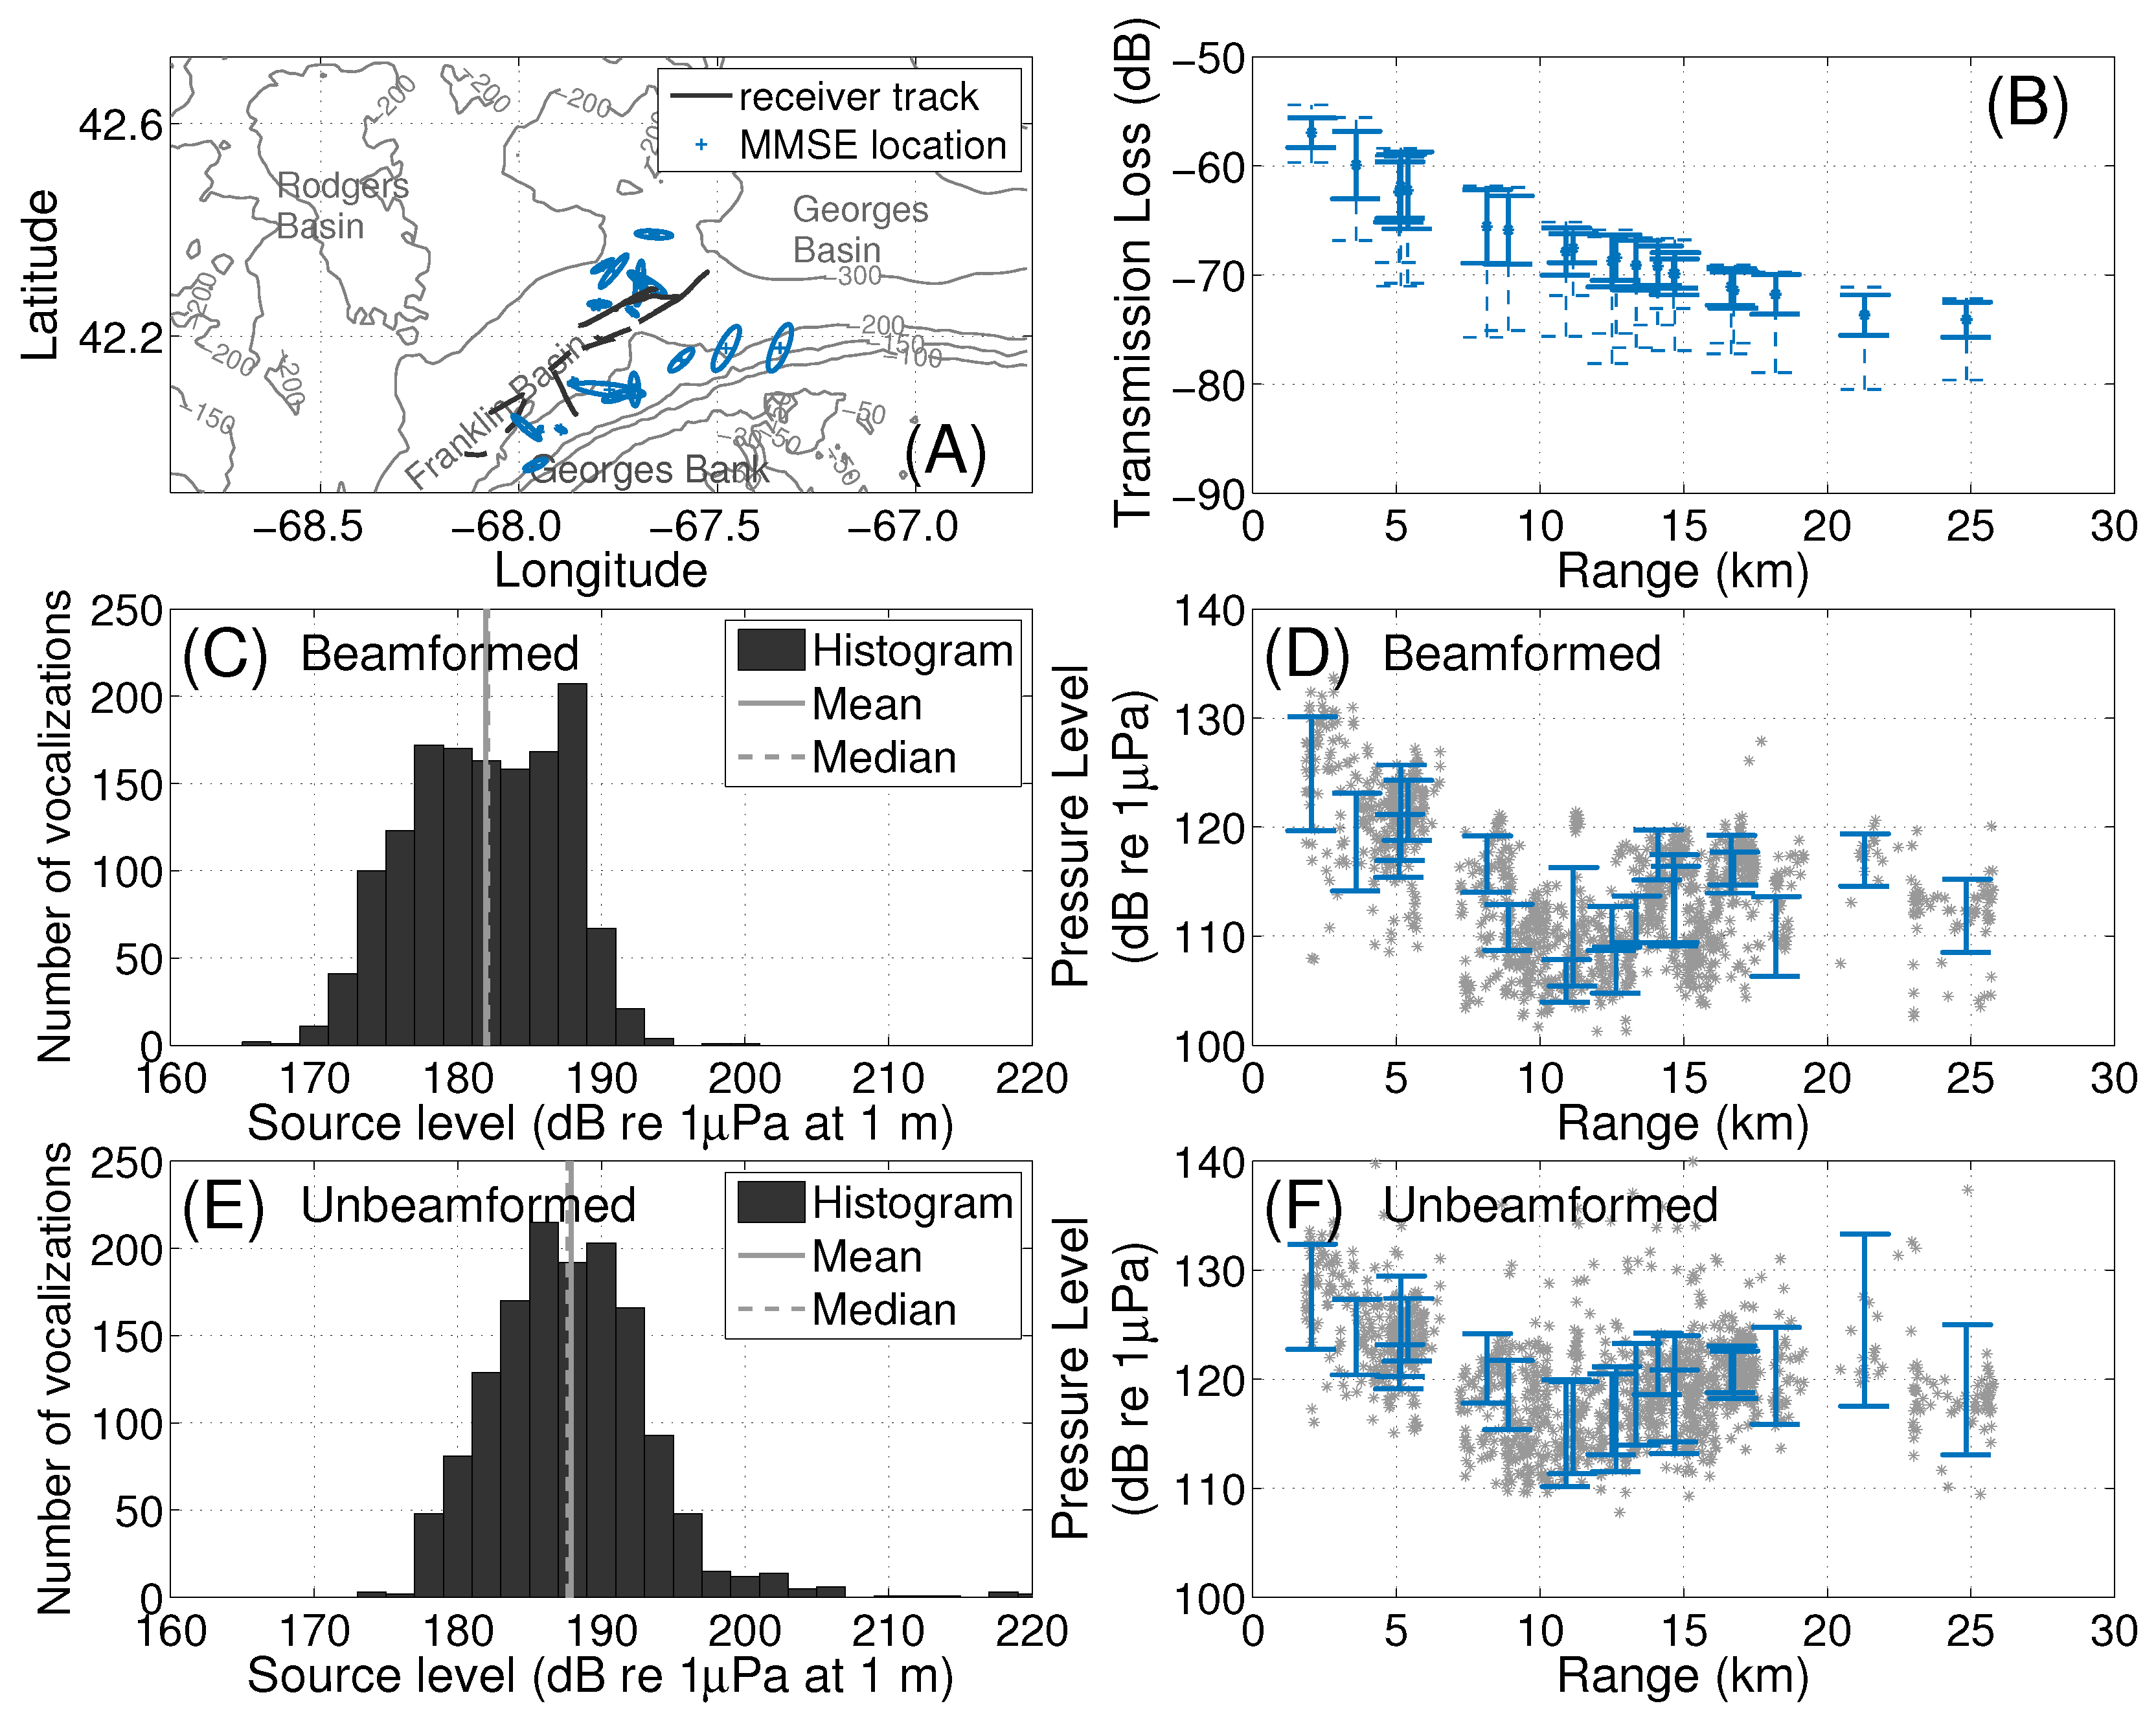
2.3. Localization of Baleen Whale Vocalizations
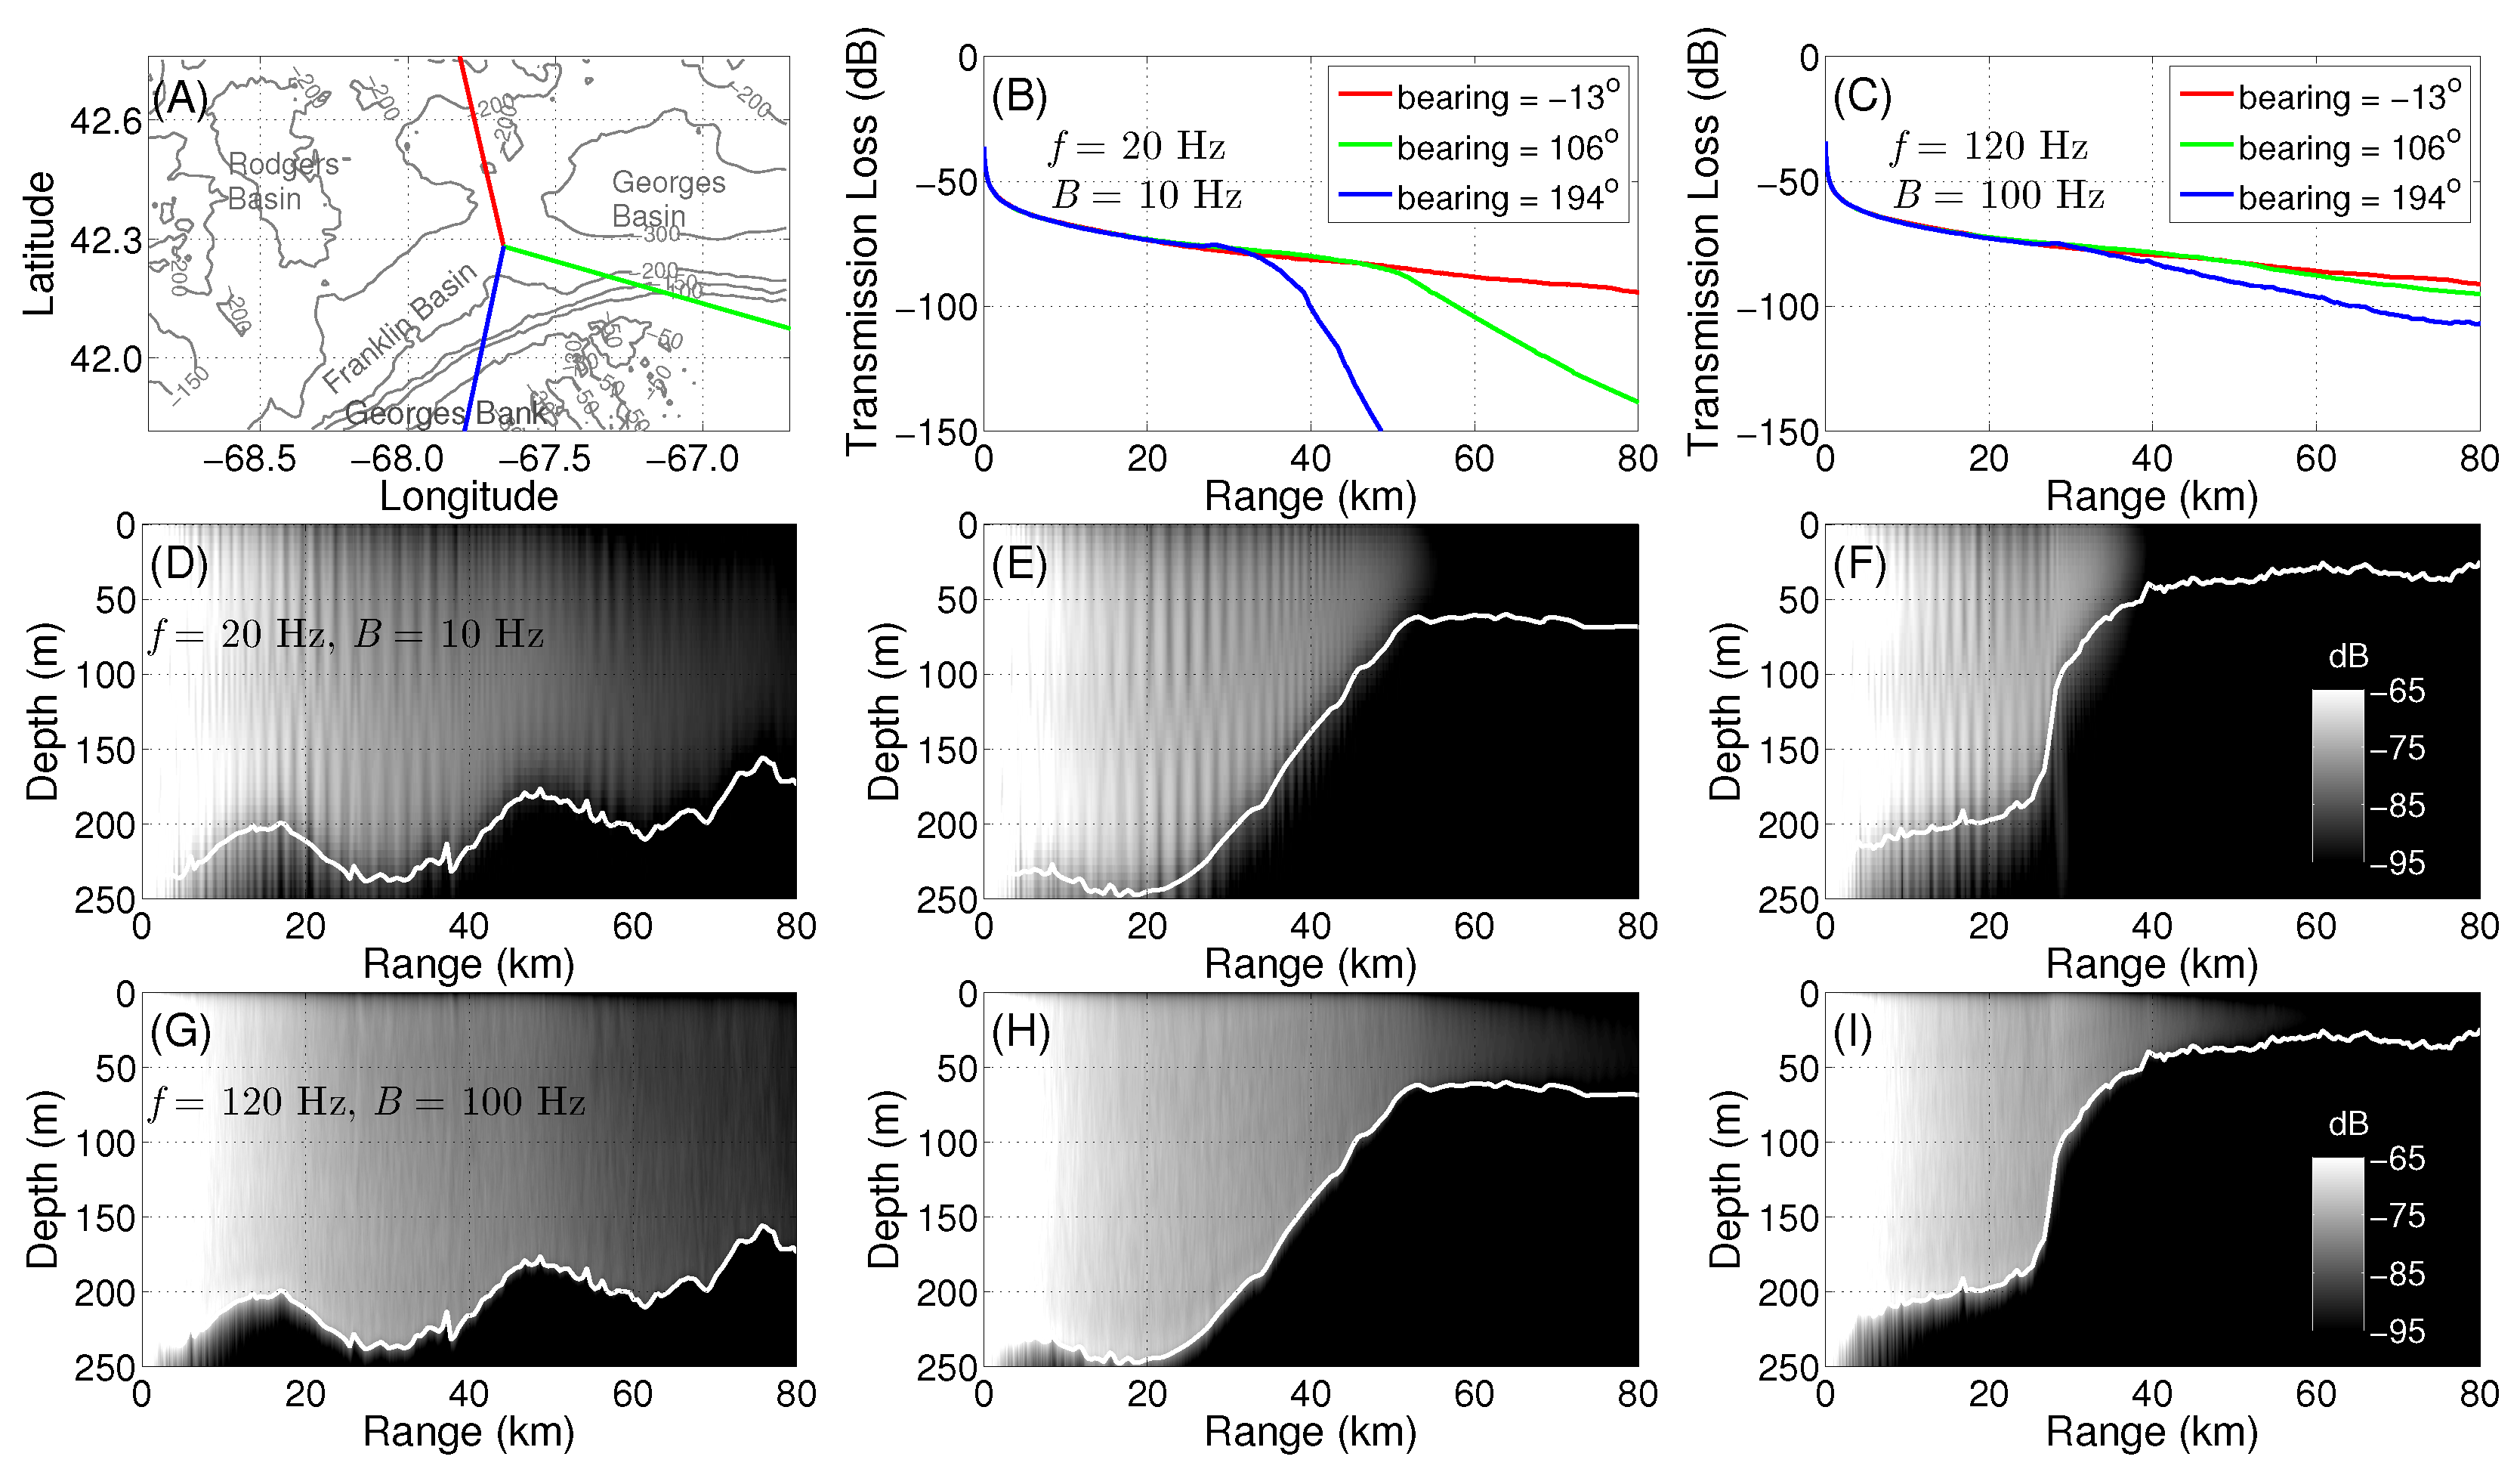
2.4. Broadband Transmission Loss Modeling
2.5. Source Level Estimation
2.6. Pulse Compression Gain Estimation
3. Results
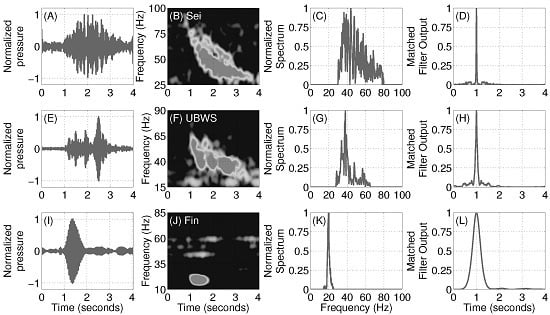
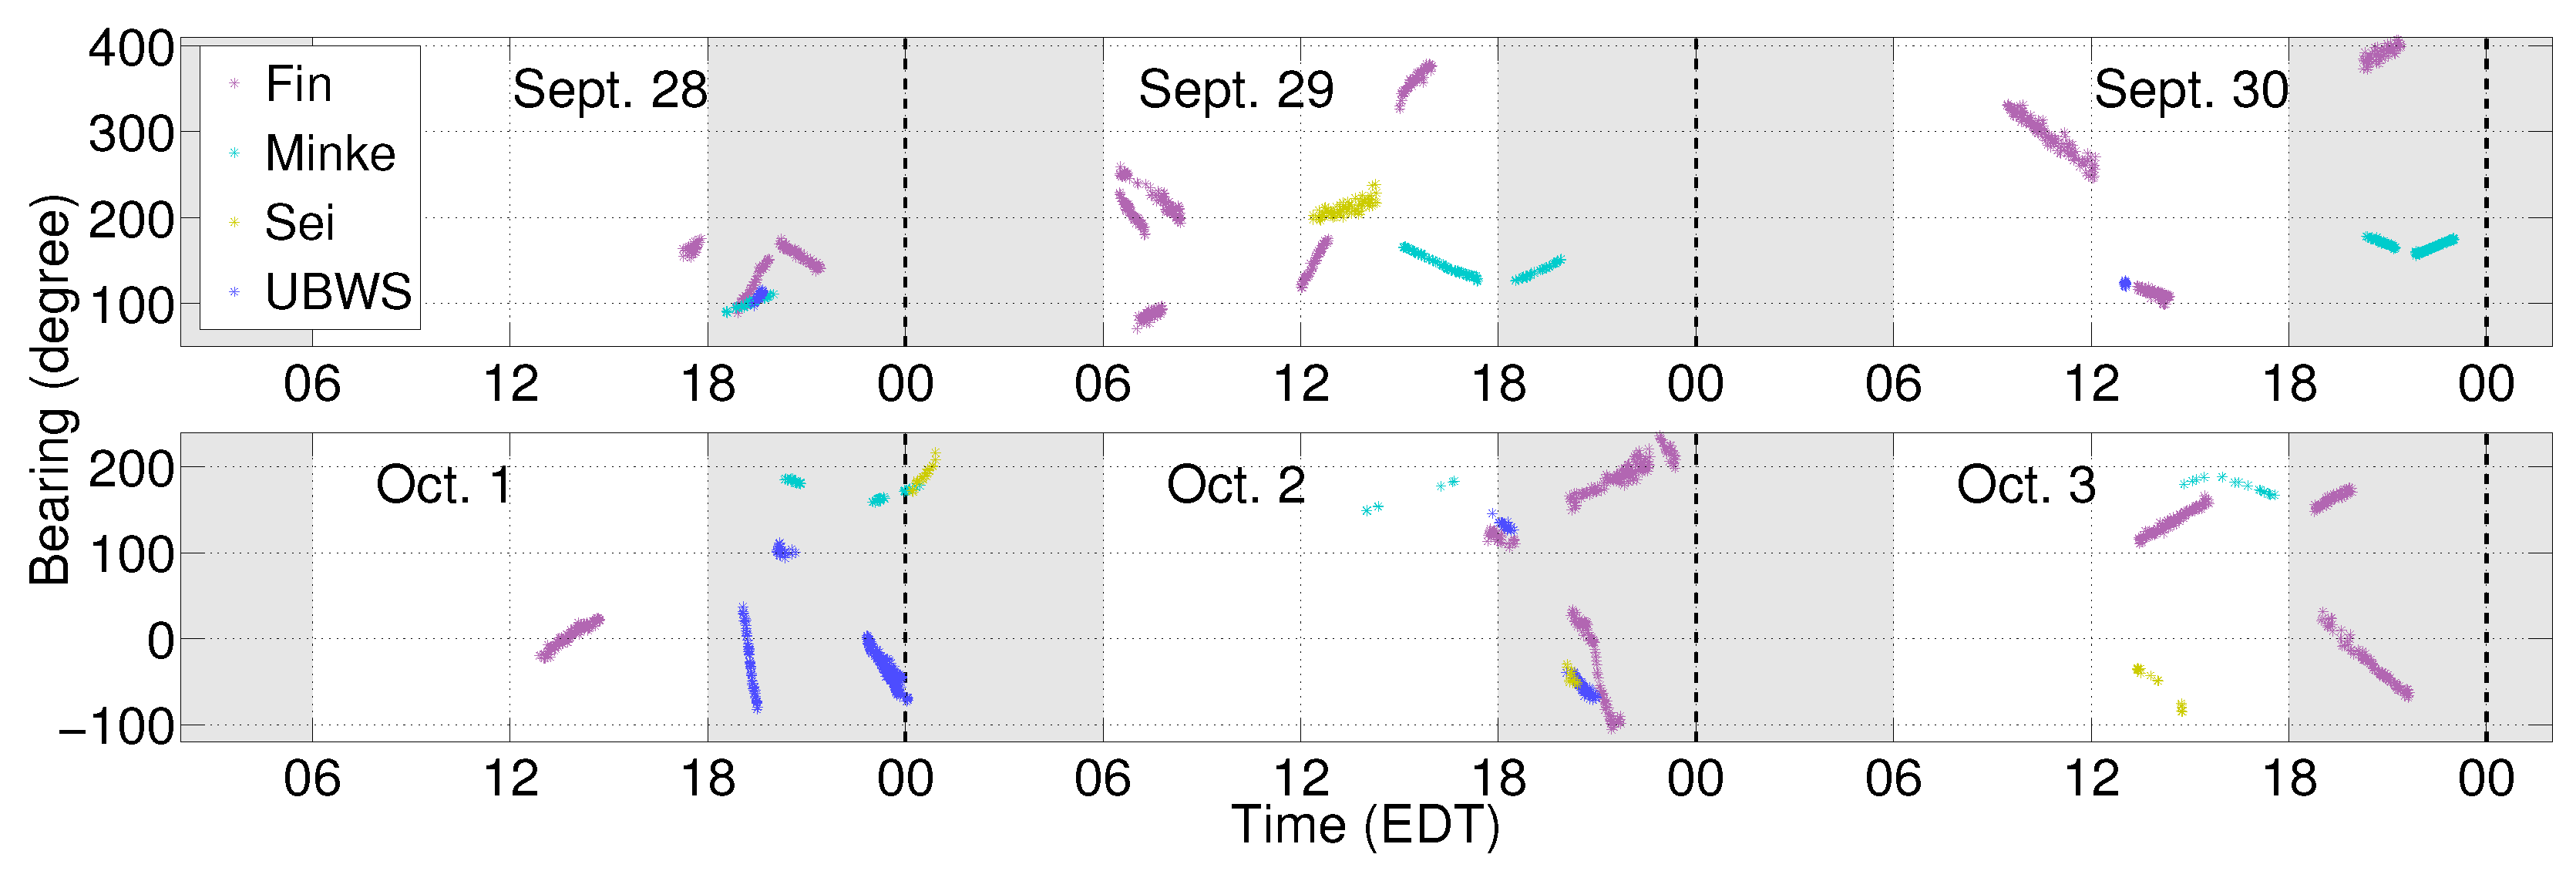
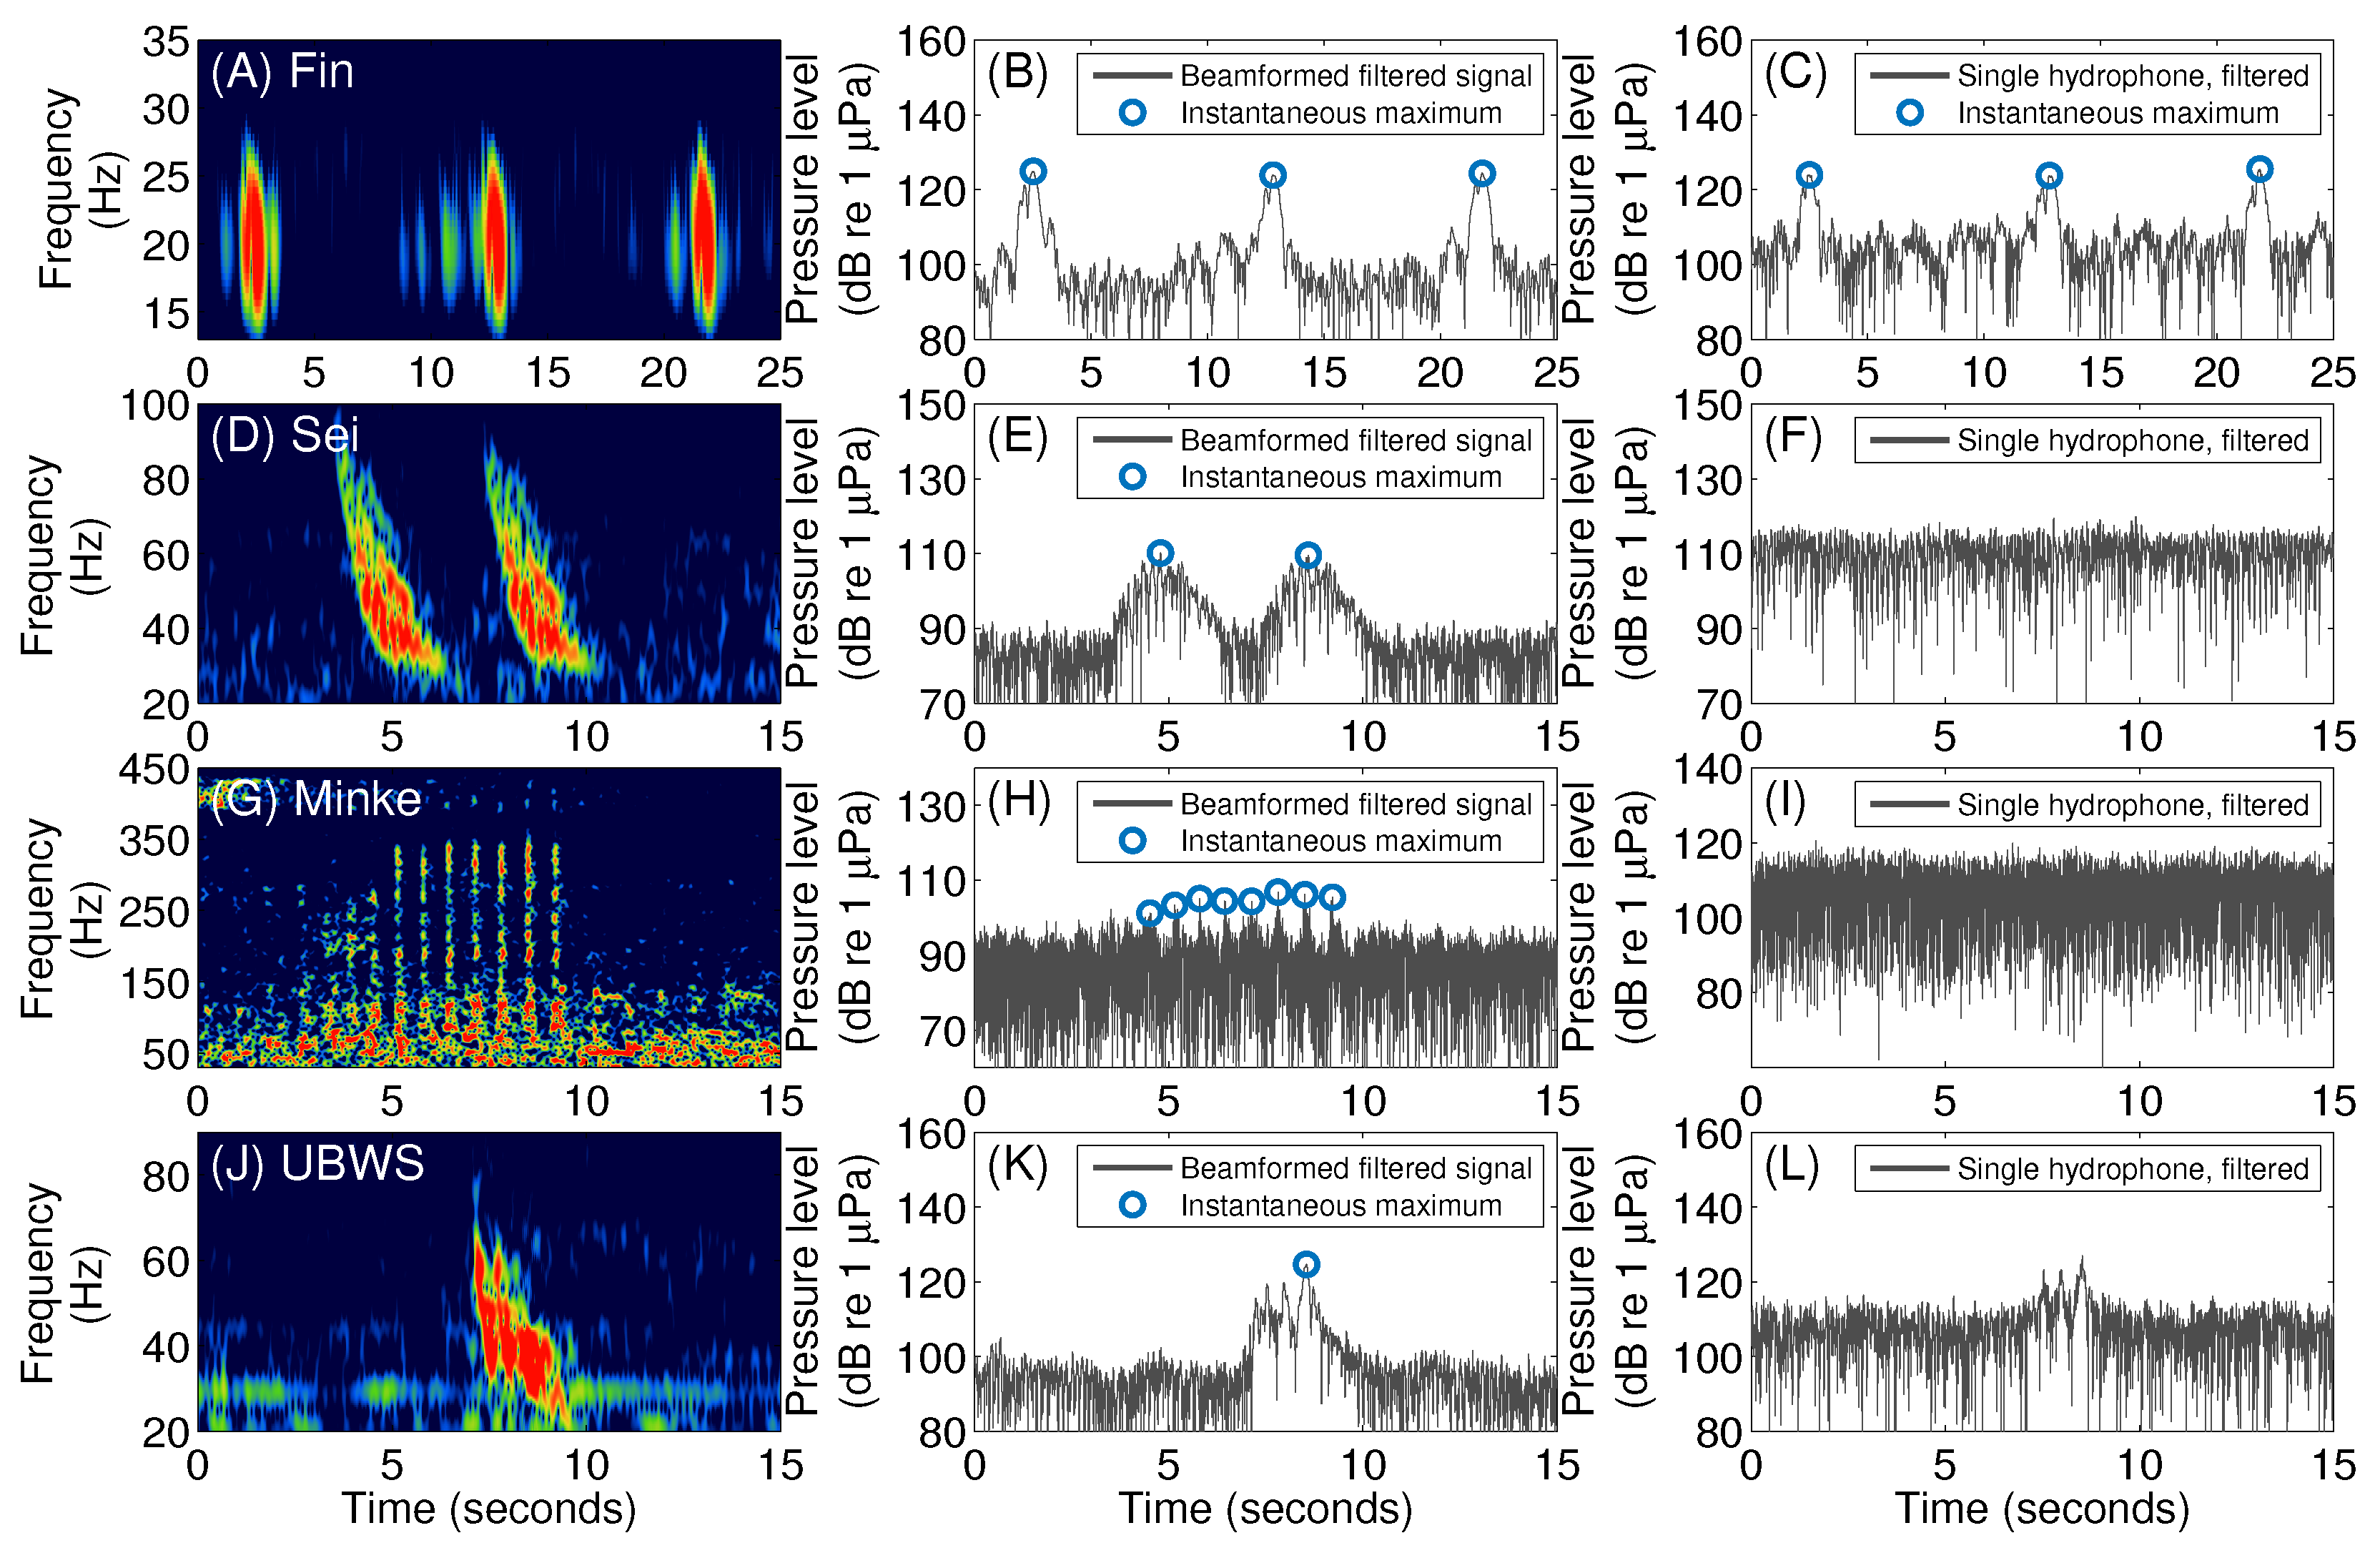
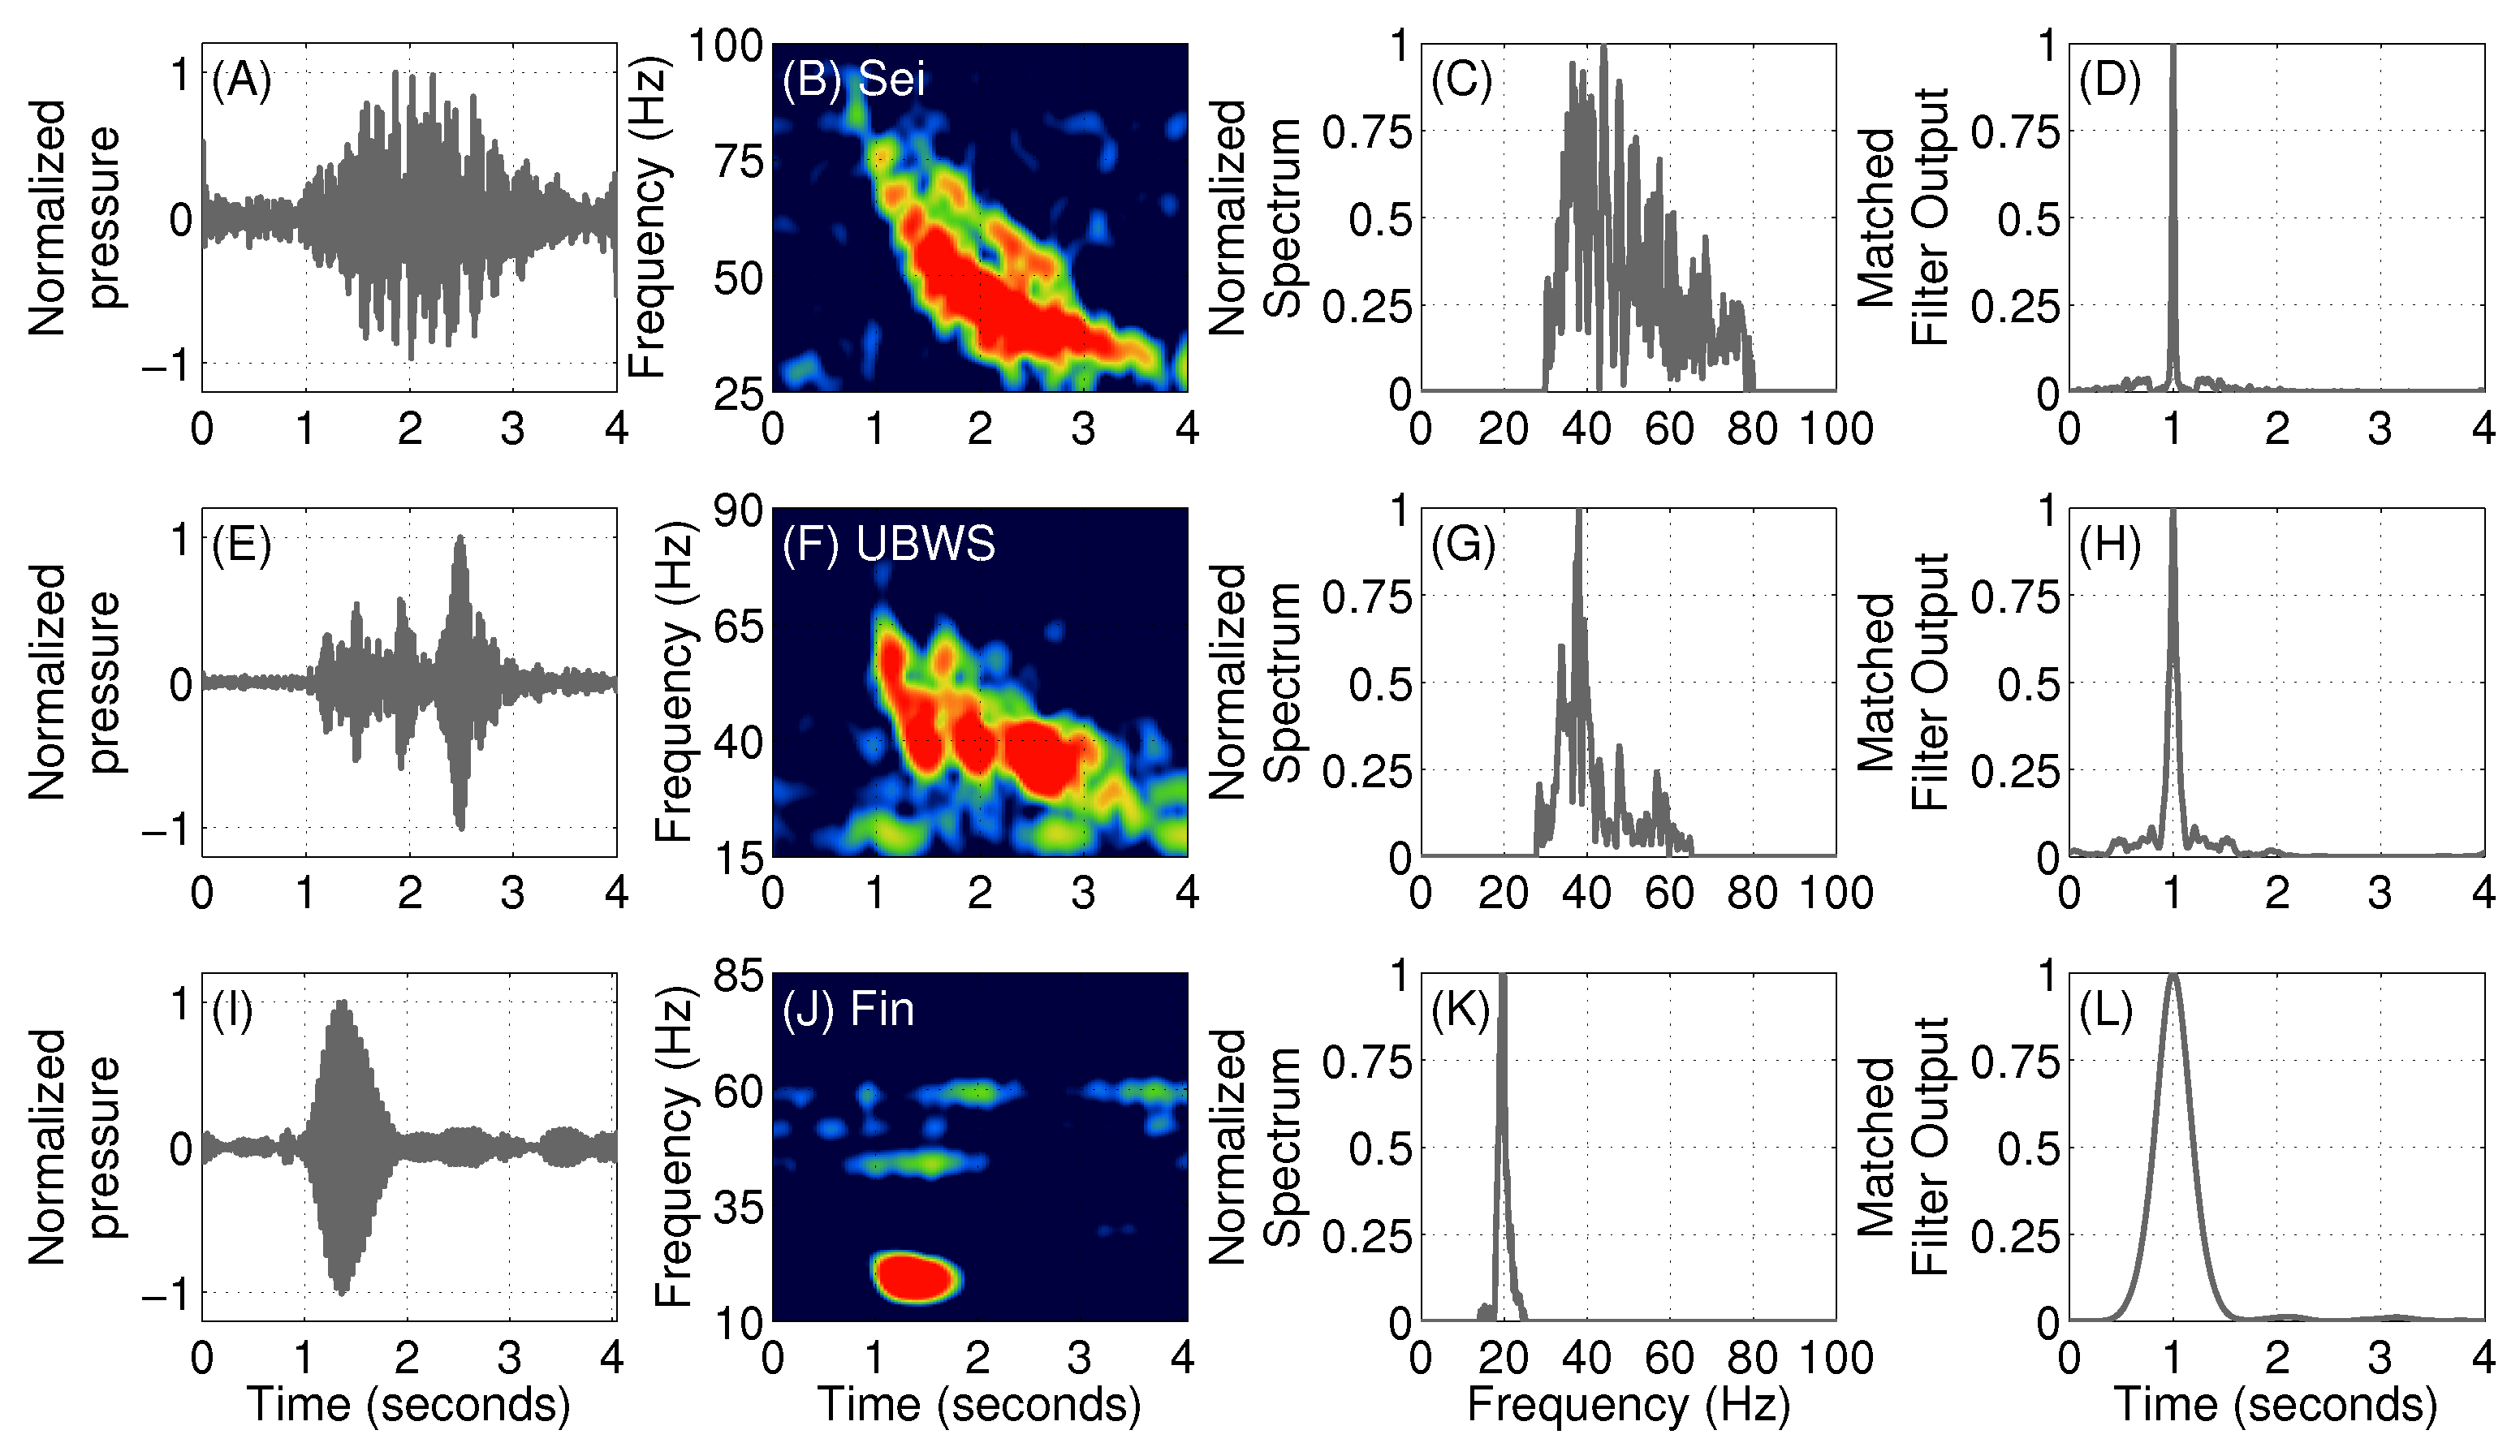
3.1. Fin Whales
3.2. Sei Whales
3.3. Minke Whales
3.4. An Unidentified Baleen Whale Species
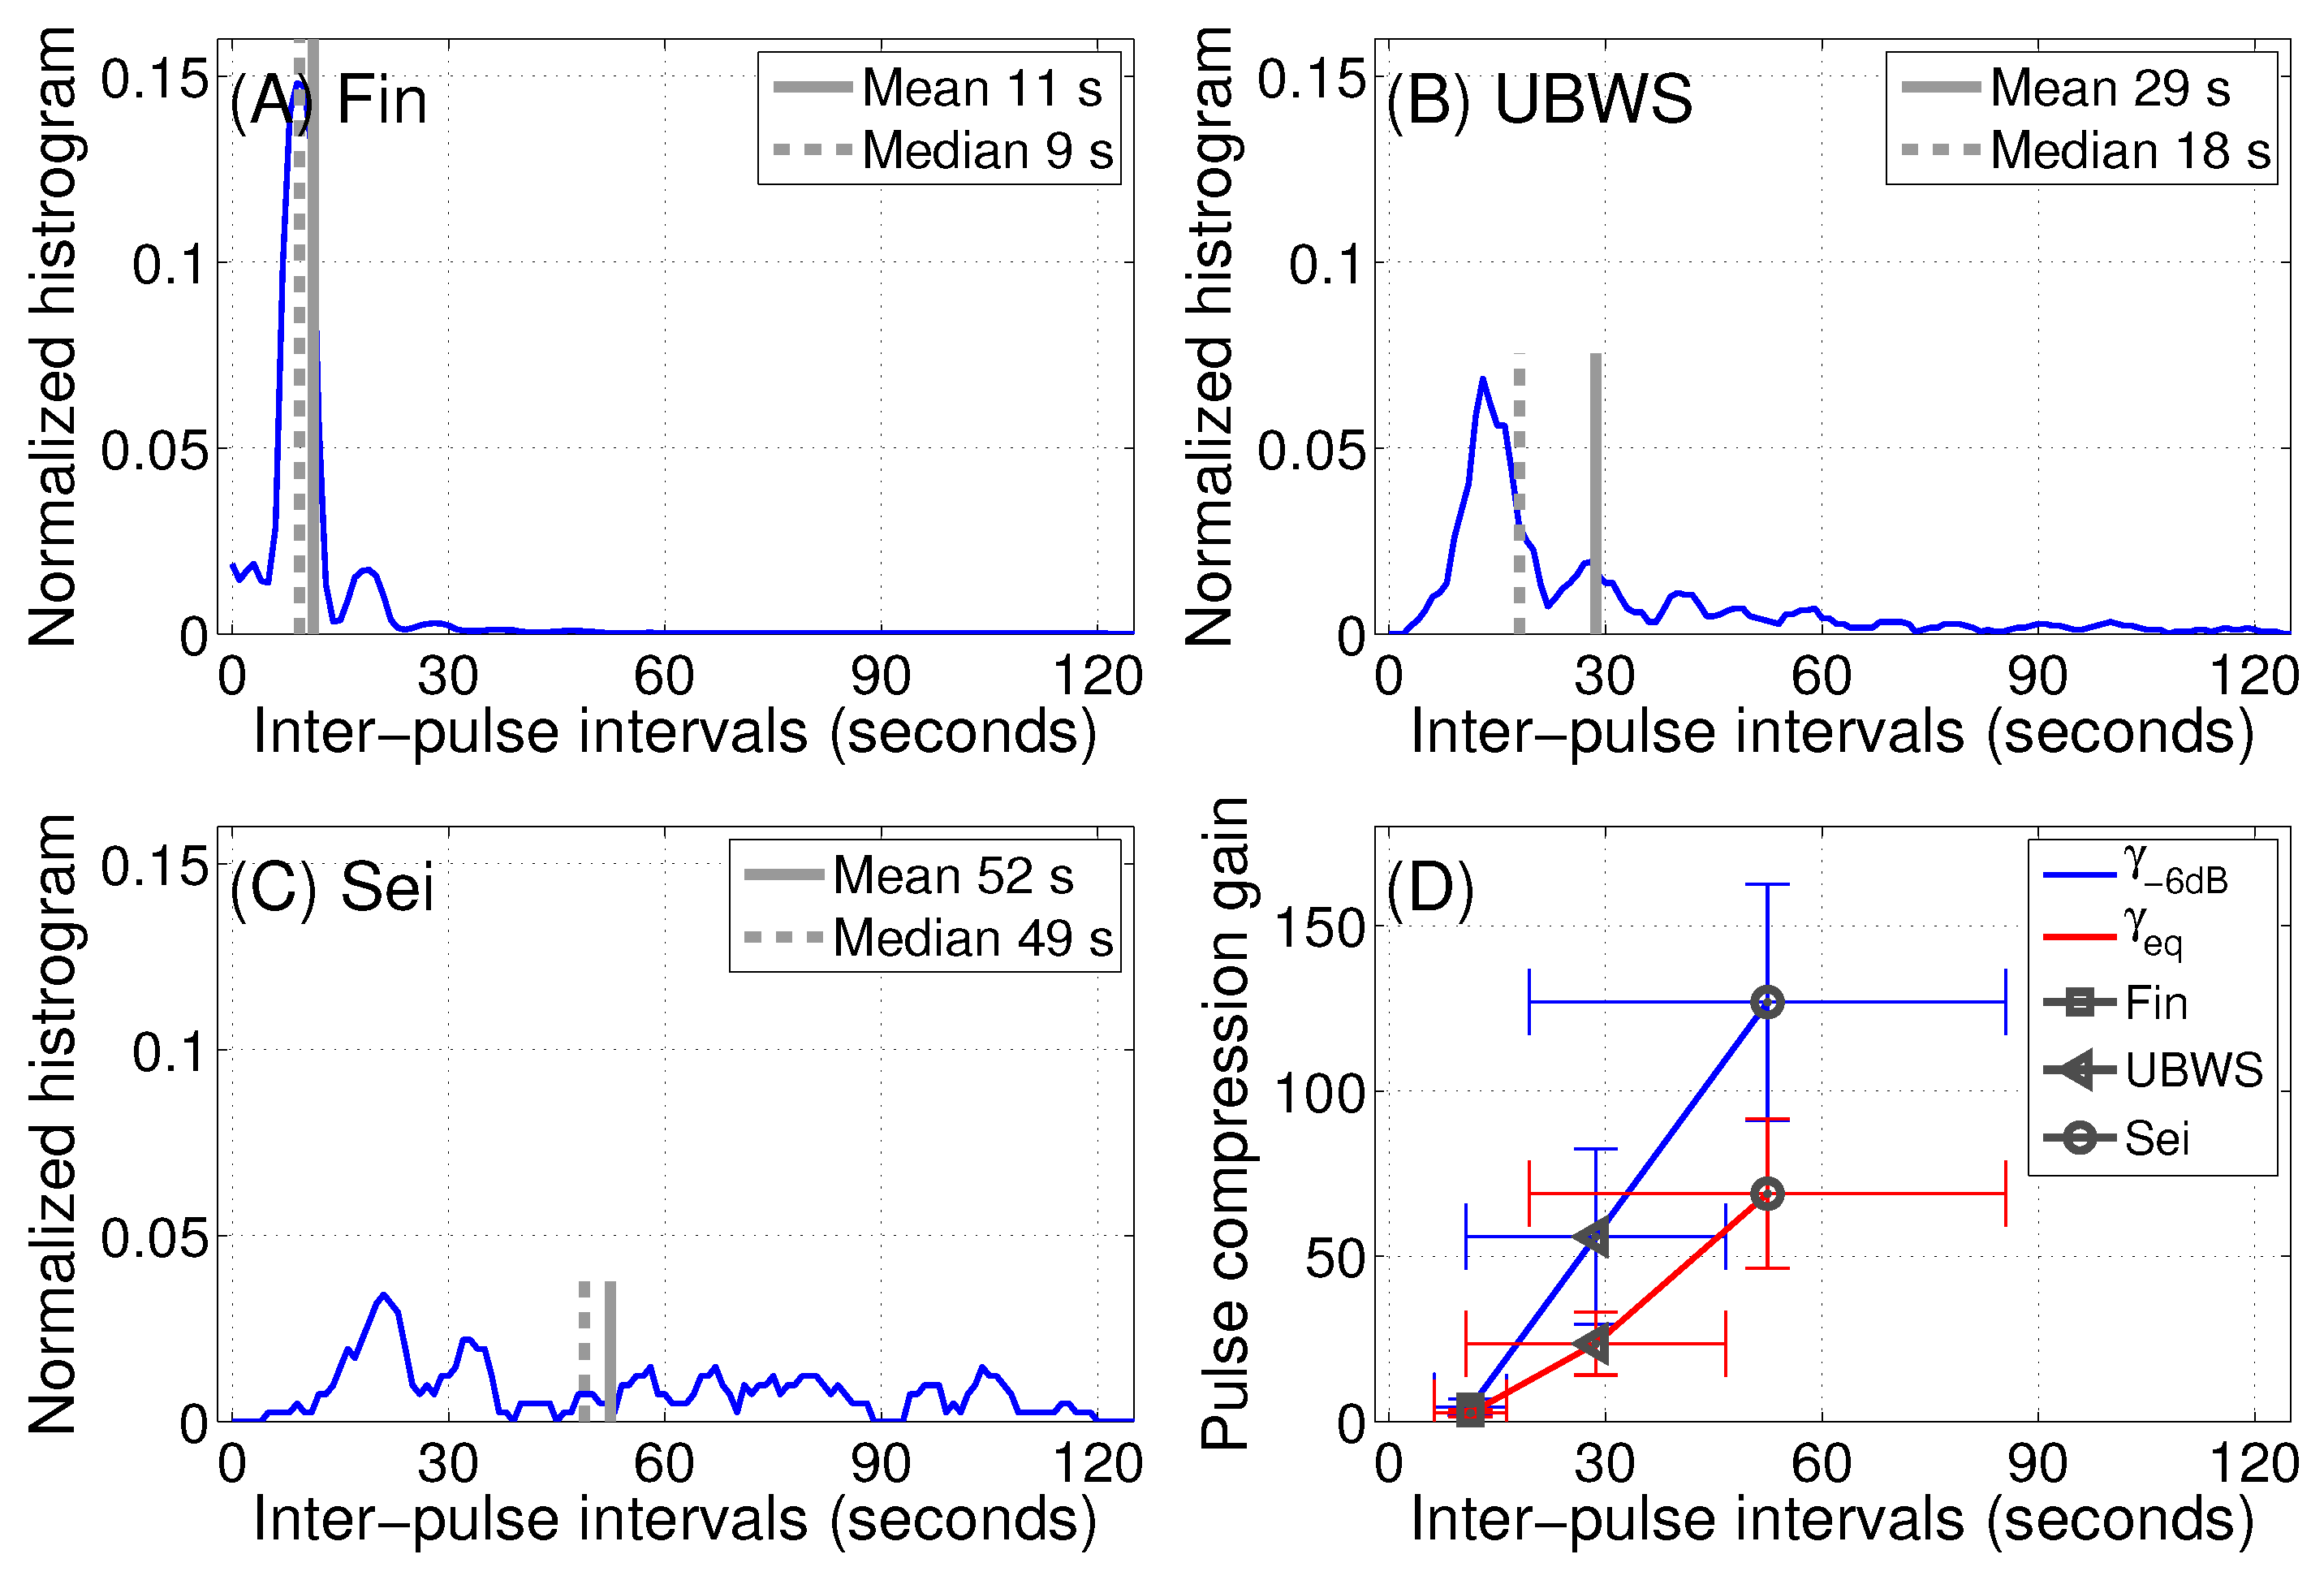
3.5. Pulse Compression Gains of Vocalizations from Baleen Whale Species
4. Discussion
5. Conclusions
Acknowledgments
Author Contributions
Conflicts of Interest
Abbreviations
| SNR | Signal-to-Noise Ratio |
| POAWRS | Passive Ocean Acoustic Waveguide Remote Sensing |
| OAWRS | Ocean Acoustic Waveguide Remote Sensing |
| RAM | Range-dependent Acoustic propagation Model |
| GPS | Global Positioning System |
| XBT | Expendable Bathythermograph |
| CTD | Conductivity-Temperature-Depth |
| PCA | Principle Component Analysis |
| MAT | Moving Array Triangulation |
| MMSE | Minimum Mean Square Error |
| rms | root mean squared |
| PCG | Pulse Compression Gain |
| LFM | Linear Frequency Modulated |
| EDT | Eastern Daylight Time |
| IPI | Inter-Pulse Interval |
| UBWS | Unidentified Baleen Whale Species |
References
- Wang, D.; Garcia, H.; Huang, W.; Tran, D.D.; Jain, A.D.; Yi, D.H.; Gong, Z.; Jech, J.M.; Godø, O.R.; Makris, N.C.; Ratilal, P. Vast assembly of vocal marine mammals from diverse species on fish spawning ground. Nature 2016, 531, 366–370. [Google Scholar] [CrossRef] [PubMed]
- Gong, Z.; Jain, A.D.; Tran, D.D.; Yi, D.H.; Wu, F.; Zorn, A.; Ratilal, P.; Makris, N.C. Ecosystem scale acoustic sensing reveals humpback whale behavior synchronous with herring spawning processes and re-evaluation finds no effect of sonar on humpback song occurrence in the Gulf of Maine in Fall 2006. PLoS ONE 2014, 9, e104733. [Google Scholar] [CrossRef] [PubMed]
- Tran, D.D.; Huang, W.; Bohn, A.C.; Wang, D.; Gong, Z.; Makris, N.C.; Ratilal, P. Using a coherent hydrophone array for observing sperm whale range, classification, and shallow-water dive profiles. J. Acoust. Soc. Am. 2014, 135, 3352–3363. [Google Scholar] [CrossRef] [PubMed]
- Kay, S.M. Fundamentals of Statistical Signal Processing, Vol. II: Detection Theory; Prentice Hall: Upper Saddle River, NJ, USA, 1998. [Google Scholar]
- Watkins, W.A.; Tyack, P.; Moore, K.E.; Bird, J.E. The 20-Hz signals of finback whales (Balaenopteraphysalus). J. Acoust. Soc. Am. 1987, 82, 1901–1912. [Google Scholar] [CrossRef] [PubMed]
- Edds, P.L. Characteristics of finback Balaenoptera physalus vocalizations in the St. Lawrence Estuary. Bioacoustics 1988, 1, 131–149. [Google Scholar] [CrossRef]
- Nieukirk, S.L.; Mellinger, D.K.; Moore, S.E.; Klinck, K.; Dziak, R.P.; Goslin, J. Sounds from airguns and fin whales recorded in the mid-Atlantic Ocean, 1999–2009. J. Acoust. Soc. Am. 2012, 131, 1102–1112. [Google Scholar] [CrossRef] [PubMed]
- Thompson, P.O.; Findley, L.T.; Vidal, O. 20-Hz pulses and other vocalizations of fin whales, Balaenopteraphysalus, in the Gulf of California, Mexico. J. Acoust. Soc. Am. 1992, 92, 3051–3057. [Google Scholar] [CrossRef] [PubMed]
- Rankin, S.; Barlow, J. Vocalizations of the sei whale Balaenoptera borealis off the Hawaiian Islands. Bioacoustics 2007, 16, 137–145. [Google Scholar] [CrossRef]
- Baumgartner, M.F.; Van Parijs, S.M.; Wenzel, F.W.; Tremblay, C.J.; Esch, H.C.; Warde, A.M. Low frequency vocalizations attributed to sei whales (Balaenoptera borealis). J. Acoust. Soc. Am. 2008, 124, 1339–1349. [Google Scholar] [CrossRef] [PubMed]
- Baumgartner, M.F.; Fratantoni, D.M. Diel periodicity in both sei whale vocalization rates and the vertical migration of their copepod prey observed from ocean gliders. Limnol. Oceanogr. 2008, 53, 2197–2209. [Google Scholar] [CrossRef]
- Edds-Walton, P.L. Vocalizations of menke whales Balaenoptera acutorostrata in the St. Lawrence Estuary. Bioacoustics 2000, 11, 31–50. [Google Scholar] [CrossRef]
- Mellinger, D.K.; Carson, C.D.; Clark, C.W. Characteristics of minke whale (Balaenoptera acutorostrata) pulse trains recorded near Puerto Rico. Mar. Mamm. Sci. 2000, 16, 739–756. [Google Scholar] [CrossRef]
- Risch, D.; Clark, C.W.; Dugan, P.J.; Popescu, M.; Siebert, U.; Van Parijs, S.M. Minke whale acoustic behavior and multi-year seasonal and diel vocalization patterns in Massachusetts Bay, USA. Mar. Ecol. Prog. Ser. 2013, 489, 279–295. [Google Scholar] [CrossRef]
- Berchok, C.L.; Bradley, D.L.; Gabrielson, T.B. St. Lawrence blue whale vocalizations revisited: Characterization of calls detected from 1998 to 2001. J. Acoust. Soc. Am. 2006, 120, 2340–2354. [Google Scholar] [CrossRef] [PubMed]
- Gong, Z.; Andrews, M.; Jagannathan, S.; Patel, R.; Jech, J.M.; Makris, N.C.; Ratilal, P. Low-frequency target strength and abundance of shoaling Atlantic herring (Clupea harengus) in the Gulf of Maine during the Ocean Acoustic Waveguide Remote Sensing 2006 Experiment. J. Acoust. Soc. Am. 2010, 127, 104–123. [Google Scholar] [CrossRef] [PubMed]
- Makris, N.C.; Ratilal, P.; Jagannathan, S.; Gong, Z.; Andrews, M.; Bertsatos, I.; Godø, O.R.; Nero, R.W.; Jech, J.M. Critical population density triggers rapid formation of vast oceanic fish shoals. Science 2009, 323, 1734–1737. [Google Scholar] [CrossRef] [PubMed]
- Andrews, M.; Chen, T.; Ratilal, P. Empirical dependence of acoustic transmission scintillation statistics on bandwidth, frequency, and range in New Jersey continental shelf. J. Acoust. Soc. Am. 2009, 125, 111–124. [Google Scholar] [CrossRef] [PubMed]
- Urick, R.J. Principles of Underwater Sound; McGraw-Hill: New York, NY, USA, 1983; pp. 29–65,343–366. [Google Scholar]
- Burdic, W.S. Underwater Acoustic System Analysis; Prentice Hall: Upper Saddle River, NJ, USA, 1984; pp. 322–360. [Google Scholar]
- Jensen, F.B.; Kuperman, W.A.; Porter, M.B.; Schmidt, H. Computational Ocean Acoustics; Springer: Berlin, Germany, 2011; pp. 708–713. [Google Scholar]
- Gong, Z.; Tran, D.D.; Ratilal, P. Comparing passive source localization and tracking approaches with a towed horizontal receiver array in an ocean waveguide. J. Acoust. Soc. Am. 2013, 134, 3705–3720. [Google Scholar] [CrossRef] [PubMed]
- Gong, Z.; Ratilal, P.; Makris, N.C. Simultaneous localization of multiple broadband non-impulsive acoustic sources in an ocean waveguide using the array invariant. J. Acoust. Soc. Am. 2015, 138, 2649–2667. [Google Scholar] [CrossRef] [PubMed]
- Lee, S.; Makris, N.C. The array invariant. J. Acoust. Soc. Am. 2006, 119, 336–351. [Google Scholar] [CrossRef] [PubMed]
- Yi, D.H.; Makris, N.C. Feasibility of Acoustic Remote Sensing of Large Herring Shoals and Seafloor by Baleen Whales. Remote Sens. 2016, 8. [Google Scholar] [CrossRef]
- Buckland, S.T.; Anderson, D.R.; Burnham, K.P.; Laake, J.L.; Borchers, D.L.; Thomas, L. Introduction to Distance Sampling Estimating Abundance of Biological Populations; Oxford University Press: Oxford, UK, 2001. [Google Scholar]
- Küsel, E.T.; Mellinger, D.K.; Thomas, L.; Marques, T.A.; Moretti, D.; Ward, J. Cetacean population density estimation from single fixed sensors using passive acoustics. J. Acoust. Soc. Am. 2011, 129, 3610–3622. [Google Scholar] [CrossRef] [PubMed]
- Martin, S.W.; Marques, T.A.; Thomas, L.; Morrissey, R.P.; Jarvis, S.; DiMarzio, N.; Moretti, D.; Mellinger, D.K. Estimating minke whale (Balaenoptera acutorostrata) boing sound density using passive acoustic sensors. Mar. Mammal Sci. 2013, 29, 142–158. [Google Scholar] [CrossRef]
- Marques, T.A.; Munger, L.; Thomas, L.; Wiggins, S.; Hildebrand, J.A. Estimating North Pacific right whale Eubalaena japonica density using passive acoustic cue counting. Endanger. Species Res. 2011, 13, 163–172. [Google Scholar] [CrossRef]
- Marques, T.A.; Thomas, L.; Martin, S.W.; Mellinger, D.K.; Ward, J.A.; Moretti, D.J.; Harris, D.; Tyack, P.L. Estimating animal population density using passive acoustics. Biol. Rev. 2013, 88, 287–309. [Google Scholar] [CrossRef] [PubMed]
- Croll, D.A.; Clark, C.W.; Calambokidis, J.; Ellison, W.T.; Tershy, B.R. Effect of anthropogenic low-frequency noise on the foraging ecology of Balaenoptera whales. Anim. Conserv. 2001, 4, 13–27. [Google Scholar] [CrossRef]
- Nowacek, D.P.; Thorne, L.H.; Johnston, D.W.; Tyack, P.L. Responses of cetaceans to anthropogenic noise. Mammal Rev. 2007, 37, 81–115. [Google Scholar] [CrossRef]
- Širović, A.; Hildebrand, J.A.; Wiggins, S.M. Blue and fin whale call source levels and propagation range in the Southern Ocean. J. Acoust. Soc. Am. 2007, 122, 1208–1215. [Google Scholar] [CrossRef] [PubMed]
- Weirathmueller, M.J.; Wilcock, W.S.D.; Soule, D.C. Source levels of fin whale 20 Hz pulses measured in the Northeast Pacific Ocean. J. Acoust. Soc. Am. 2013, 133, 741–749. [Google Scholar] [CrossRef] [PubMed]
- Newhall, A.E.; Lin, Y.T.; Lynch, J.F.; Baumgartner, M.F.; Gawarkiewicz, G.G. Long distance passive localization of vocalizing sei whales using an acoustic normal mode approach. J. Acoust. Soc. Am. 2012, 131, 1814–1825. [Google Scholar] [CrossRef] [PubMed]
- Gedamke, J.; Costa, D.P.; Dunstan, A. Localization and visual verification of a complex minke whale vocalization. J. Acoust. Soc. Am. 2001, 109, 3038–3047. [Google Scholar] [CrossRef] [PubMed]
- Risch, D.; Siebert, U.; Van Parijs, S.M. Individual calling behaviour and movements of North Atlantic minke whales (Balaenoptera acutorostrata). Behaviour 2014, 151, 1335–1360. [Google Scholar] [CrossRef]
- Cummings, W.C.; Thompson, P.O. Underwater sounds from the blue whale, Balaenoptera musculus. J. Acoust. Soc. Am. 1971, 50, 1193–1198. [Google Scholar] [CrossRef]
- Wiggins, S.M.; Oleson, E.M.; McDonald, M.A.; Hildebrand, J.A. Blue whale (Balaenoptera musculus) diel call patterns offshore of Southern California. Aquat. Mamm. 2005, 31, 161–168. [Google Scholar] [CrossRef]
- Oleson, E.M.; Calambokidis, J.; Burgess, W.C.; McDonald, M.A.; LeDuc, C.A.; Hildebrand, J.A. Behavioral context of call production by eastern North Pacific blue whales. MEPS 2007, 330, 269–284. [Google Scholar] [CrossRef]
- Tran, D.D.; Andrews, M.; Ratilal, P. Probability distribution for energy of saturated broadband ocean acoustic transmission: Results from Gulf of Maine 2006 experiment. J. Acoust. Soc. Am. 2012, 132, 3659–3672. [Google Scholar] [CrossRef] [PubMed]
- Collins, M.D. A split-step Padé solution for the parabolic equation method. J. Acoust. Soc. Am. 1993, 93, 1736–1742. [Google Scholar] [CrossRef]
- Skolnik, M.I. Introduction to Radar Systems; Electrical Engineering Series; McGraw Hill: New York, NY, USA, 2001. [Google Scholar]
- Kroszczynski, J.J. Pulse compression by means of linear-period modulation. Proc. IEEE 1969, 57, 1260–1266. [Google Scholar] [CrossRef]
- Stafford, K.M.; Fox, C.G.; Clark, D.S. Long-range acoustic detection and localization of blue whale calls in the northeast Pacific Ocean. J. Acoust. Soc. Am. 1998, 104, 3616–3625. [Google Scholar] [CrossRef] [PubMed]
- Mellinger, D.K.; Clark, C.W. Recognizing transient low-frequency whale sounds by spectrogram correlation. J. Acoust. Soc. Am. 2000, 107, 3518–3529. [Google Scholar] [CrossRef] [PubMed]
- Mellinger, D.K.; Clark, C.W. Methods for automatic detection of mysticete sounds. Mar. Freshw. Behav. Physiol. 1997, 29, 163–181. [Google Scholar] [CrossRef]
- Flore, S.; Adam, O.; Motsch, J.F.; Guinet, C. Definition of the Antarctic and pygmy blue whale call templates. Application to fast automatic detection. Can. Acoust. 2008, 36, 93–103. [Google Scholar]
- Haedrich, R.L. Bigelow and Schroeder’s Fishes of the Gulf of Maine. Copeia 2003, 2003, 422–423. [Google Scholar] [CrossRef]
- Jain, A.D.; Ignisca, A.; Yi, D.H.; Ratilal, P.; Makris, N.C. Feasibility of ocean acoustic waveguide remote sensing (OAWRS) of Atlantic cod with seafloor scattering limitations. Remote Sens. 2013, 6, 180–208. [Google Scholar] [CrossRef]
- Nelson, G.A.; Ross, M.R. Biology and population changes of northern sand lance (Ammodytes dubius) from the Gulf of Maine to the Middle Atlantic Bight. J. Northwest Atl. Fish. Sci. 1991, 11, 11–27. [Google Scholar] [CrossRef]
- Overholtz, W.J.; Link, J.S. Consumption impacts by marine mammals, fish, and seabirds on the Gulf of Maine–Georges Bank Atlantic herring (Clupea harengus) complex during the years 1977–2002. ICES J. Mar. Sci. 2007, 64, 83–96. [Google Scholar] [CrossRef]
- Overholtz, W.J.; Jacobson, L.D.; Melvin, G.D.; Cieri, M.; Power, M.; Libby, D.; Clark, K. Stock assessment of the Gulf of Maine–Georges Bank Atlantic herring complex, 2003. Northeast Fish. Sci. Cent. Ref. Doc. 2004, 4, 1–290. [Google Scholar]
- Melvin, G.D.; Stephenson, R.L. The dynamics of a recovering fish stock: Georges Bank herring. ICES J. Mar. Sci. 2007, 64, 69–82. [Google Scholar]
- Read, A.J.; Brownstein, C.R. Considering other consumers: Fisheries, predators, and Atlantic herring in the Gulf of Maine. Conserv. Ecol. 2003, 7, 2. [Google Scholar]
- Jech, J.M.; Stroman, F. Aggregative patterns of pre-spawning Atlantic herring on Georges Bank from 1999–2010. Aquat. Living Resour. 2012, 25, 1–14. [Google Scholar] [CrossRef]
- Klaer, N. CIE Reviewer’s Independent Report. In Proceedings of the 54th Northeast Regional Stock Assessment Workshop, Woods Hole, MA, USA, 5–9 June 2012.
- Overholtz, W. The Gulf of Maine–Georges Bank Atlantic herring (Clupea harengus): Spatial pattern analysis of the collapse and recovery of a large marine fish complex. Fish. Res. 2002, 57, 237–254. [Google Scholar] [CrossRef]
- Jagannathan, S.; Küsel, E.T.; Ratilal, P.; Makris, N.C. Scattering from extended targets in range-dependent fluctuating ocean-waveguides with clutter from theory and experiments. J. Acoust. Soc. Am. 2012, 132, 680–693. [Google Scholar] [CrossRef] [PubMed]
- Jagannathan, S.; Bertsatos, I.; Symonds, D.; Chen, T.; Nia, H.T.; Jain, A.D.; Andrews, M.; Gong, Z.; Nero, R.; Ngor, L.; et al. Ocean acoustic waveguide remote sensing (OAWRS) of marine ecosystems. Mar. Ecol. Progr. Ser. 2009, 395, 137–160. [Google Scholar] [CrossRef]
- Center, N.F.S. Atlantic herring stock assessment for 2012. In Prooceedings of the 54th Northeast Regional Stock Assessment Workshop (54th SAW), Woods Hole, MA, USA, 5–9 June 2012.
- Jech, J.M.; Price, V.; Chavez-Rosales, S.; Michaels, W. Atlantic herring (Clupea harengus) demographics in the Gulf of Maine from 1998 to 2012. J. Northwest Atl. Fish. Sci. 2015, 47, 57–74. [Google Scholar] [CrossRef]
- Becker, K.; Preston, J. The ONR five octave research array (FORA) at Penn State. Proc. IEEE 2003, 5, 2607–2610. [Google Scholar]
- Andrews, M.; Gong, Z.; Ratilal, P. High resolution population density imaging of random scatterers with the matched filtered scattered field variance. J. Acoust. Soc. Am. 2009, 126, 1057–1068. [Google Scholar] [CrossRef] [PubMed]
- Shapiro, A.D.; Wang, C. A versatile pitch tracking algorithm: From human speech to killer whale vocalizations. J. Acoust. Soc. Am. 2009, 126, 451–459. [Google Scholar] [CrossRef] [PubMed]
- Wang, C.; Seneff, S. Robust pitch tracking for prosodic modeling in telephone speech. In Proceedings of the 2000 IEEE International Conference on Acoustics, Speech, and Signal Processing, Piscataway, NJ, USA, 5–9 June 2000; Volume 3, pp. 1343–1346.
- Jolliffe, I. Principal Component Analysis, 2nd ed.; Wiley Online Library: New York, NY, USA, 2002; pp. 11–31. [Google Scholar]
- Kanungo, T.; Mount, D.M.; Netanyahu, N.S.; Piatko, C.D.; Silverman, R.; Wu, A.Y. An efficient k-means clustering algorithm: Analysis and implementation. IEEE Trans. Pattern Anal. Mach. Intell. 2002, 24, 881–892. [Google Scholar] [CrossRef]
- Ratilal, P.; Lai, Y.; Symonds, D.T.; Ruhlmann, L.A.; Preston, J.R.; Scheer, E.K.; Garr, M.T.; Holland, C.W.; Goff, J.A.; Makris, N.C. Long range acoustic imaging of the continental shelf environment: The Acoustic Clutter Reconnaissance Experiment 2001. J. Acoust. Soc. Am. 2005, 117, 1977–1998. [Google Scholar] [CrossRef] [PubMed]
- Andrews, M.; Gong, Z.; Ratilal, P. Effects of multiple scattering, attenuation and dispersion in waveguide sensing of fish. J. Acoust. Soc. Am. 2011, 130, 1253–1271. [Google Scholar] [CrossRef] [PubMed]
- Kinsler, L.E.; Frey, A.R.; Coppens, A.B.; Sanders, J.V. Fundamentals of Acoustics, 4th ed.; Wiley-VCH: New York, NY, USA, 1999. [Google Scholar]
- Madsen, P.T.; Wahlberg, M. Recording and quantification of ultrasonic echolocation clicks from free-ranging toothed whales. Deep Sea Res. Part I 2007, 54, 1421–1444. [Google Scholar] [CrossRef]
- Goodman, J.W. Statistical Optics; John Wiley & Sons: Hoboken, NJ, USA, 2015. [Google Scholar]
- Makris, N.C. The effect of saturated transmission scintillation on ocean acoustic intensity measurements. J. Acoust. Soc. Am. 1996, 100, 769–783. [Google Scholar] [CrossRef]
- McDonald, M.A.; Hildebrand, J.A.; Webb, S.C. Blue and fin whales observed on a seafloor array in the Northeast Pacific. J. Acoust. Soc. Am. 1995, 98, 712–721. [Google Scholar] [CrossRef] [PubMed]
- Croll, D.A.; Clark, C.W.; Acevedo, A.; Tershy, B.; Flores, S.; Gedamke, J.; Urban, J. Bioacoustics: Only male fin whales sing loud songs. Nature 2002, 417. [Google Scholar] [CrossRef] [PubMed]
- Oppenheim, A.V.; Schafer, R.W. Discrete-Time Signal Processing; Pearson Higher Education: New York, NY, USA, 2010. [Google Scholar]
- Galinde, A.; Donabed, N.; Andrews, M.; Lee, S.; Makris, N.C.; Ratilal, P. Range-dependent waveguide scattering model calibrated for bottom reverberation in a continental shelf environment. J. Acoust. Soc. Am. 2008, 123, 1270–1281. [Google Scholar] [CrossRef] [PubMed]
- Northrop, J.; Cummings, W.C.; Thompson, P.O. 20-Hz Signals Observed in the Central Pacific. J. Acoust. Soc. Am. 1968, 43, 383–384. [Google Scholar] [CrossRef]
- Charif, R.A.; Mellinger, D.K.; Dunsmore, K.J.; Fristrup, K.M.; Clark, C.W. Estimated source levels of fin whale (Balaenoptera physalus) vocalizations: Adjustments for surface interference. Mar. Mamm. Sci. 2002, 18, 81–98. [Google Scholar] [CrossRef]
- Battista, T.; Clark, R.; Pittman, S. An Ecological Characterization of the Stellwagen Bank National Marine Sanctuary Region: Oceanographic, Biogeographic, and Contaminants Assessment; Center for Coastal Monitoring and Assessment (CCMA), NOAA/NOS/NCCOS: Silver Spring, MD, USA, 2006. [Google Scholar]
- Payne, P.M.; Selzer, L.A.; Knowlton, A.R. Distribution and Density of Cetaceans, Marine Turtles, And Seabirds in the Shelf Waters of the Northeastern United States, June 1980-December 1983, Based on Shipboard Observations; Manomet Bird Observatory: Cumberland, ME, USA, 1984. [Google Scholar]
- Stimpert, A.K.; Wiley, D.N.; Au, W.W.; Johnson, M.P.; Arsenault, R. ‘Megapclicks’: Acoustic click trains and buzzes produced during night-time foraging of humpback whales (Megaptera novaeangliae). Biol. Lett. 2007, 3, 467–470. [Google Scholar] [CrossRef] [PubMed]
- Ellison, W.T.; Clark, C.W.; Bishop, G.C. Potential use of surface reverberation by bowhead whales, Balaena mysticetus, in under-ice navigation: Preliminary considerations. Rep. Int. Whal. Comm. 1987, 37, 329–332. [Google Scholar]


| Fin | UBWS | Sei | Tukey-Windowed LFM | |
|---|---|---|---|---|
| τ (s) | ||||
| B (Hz) | ||||
| (ms) | 24 | |||
| (ms) | 20 | |||
© 2016 by the authors; licensee MDPI, Basel, Switzerland. This article is an open access article distributed under the terms and conditions of the Creative Commons Attribution (CC-BY) license (http://creativecommons.org/licenses/by/4.0/).
Share and Cite
Wang, D.; Huang, W.; Garcia, H.; Ratilal, P. Vocalization Source Level Distributions and Pulse Compression Gains of Diverse Baleen Whale Species in the Gulf of Maine. Remote Sens. 2016, 8, 881. https://doi.org/10.3390/rs8110881
Wang D, Huang W, Garcia H, Ratilal P. Vocalization Source Level Distributions and Pulse Compression Gains of Diverse Baleen Whale Species in the Gulf of Maine. Remote Sensing. 2016; 8(11):881. https://doi.org/10.3390/rs8110881
Chicago/Turabian StyleWang, Delin, Wei Huang, Heriberto Garcia, and Purnima Ratilal. 2016. "Vocalization Source Level Distributions and Pulse Compression Gains of Diverse Baleen Whale Species in the Gulf of Maine" Remote Sensing 8, no. 11: 881. https://doi.org/10.3390/rs8110881
APA StyleWang, D., Huang, W., Garcia, H., & Ratilal, P. (2016). Vocalization Source Level Distributions and Pulse Compression Gains of Diverse Baleen Whale Species in the Gulf of Maine. Remote Sensing, 8(11), 881. https://doi.org/10.3390/rs8110881