
Urban Land Cover Change Modelling Using Time-Series Satellite Images: A Case Study of Urban Growth in Five Cities of Saudi Arabia


Abstract
:
1. Introduction
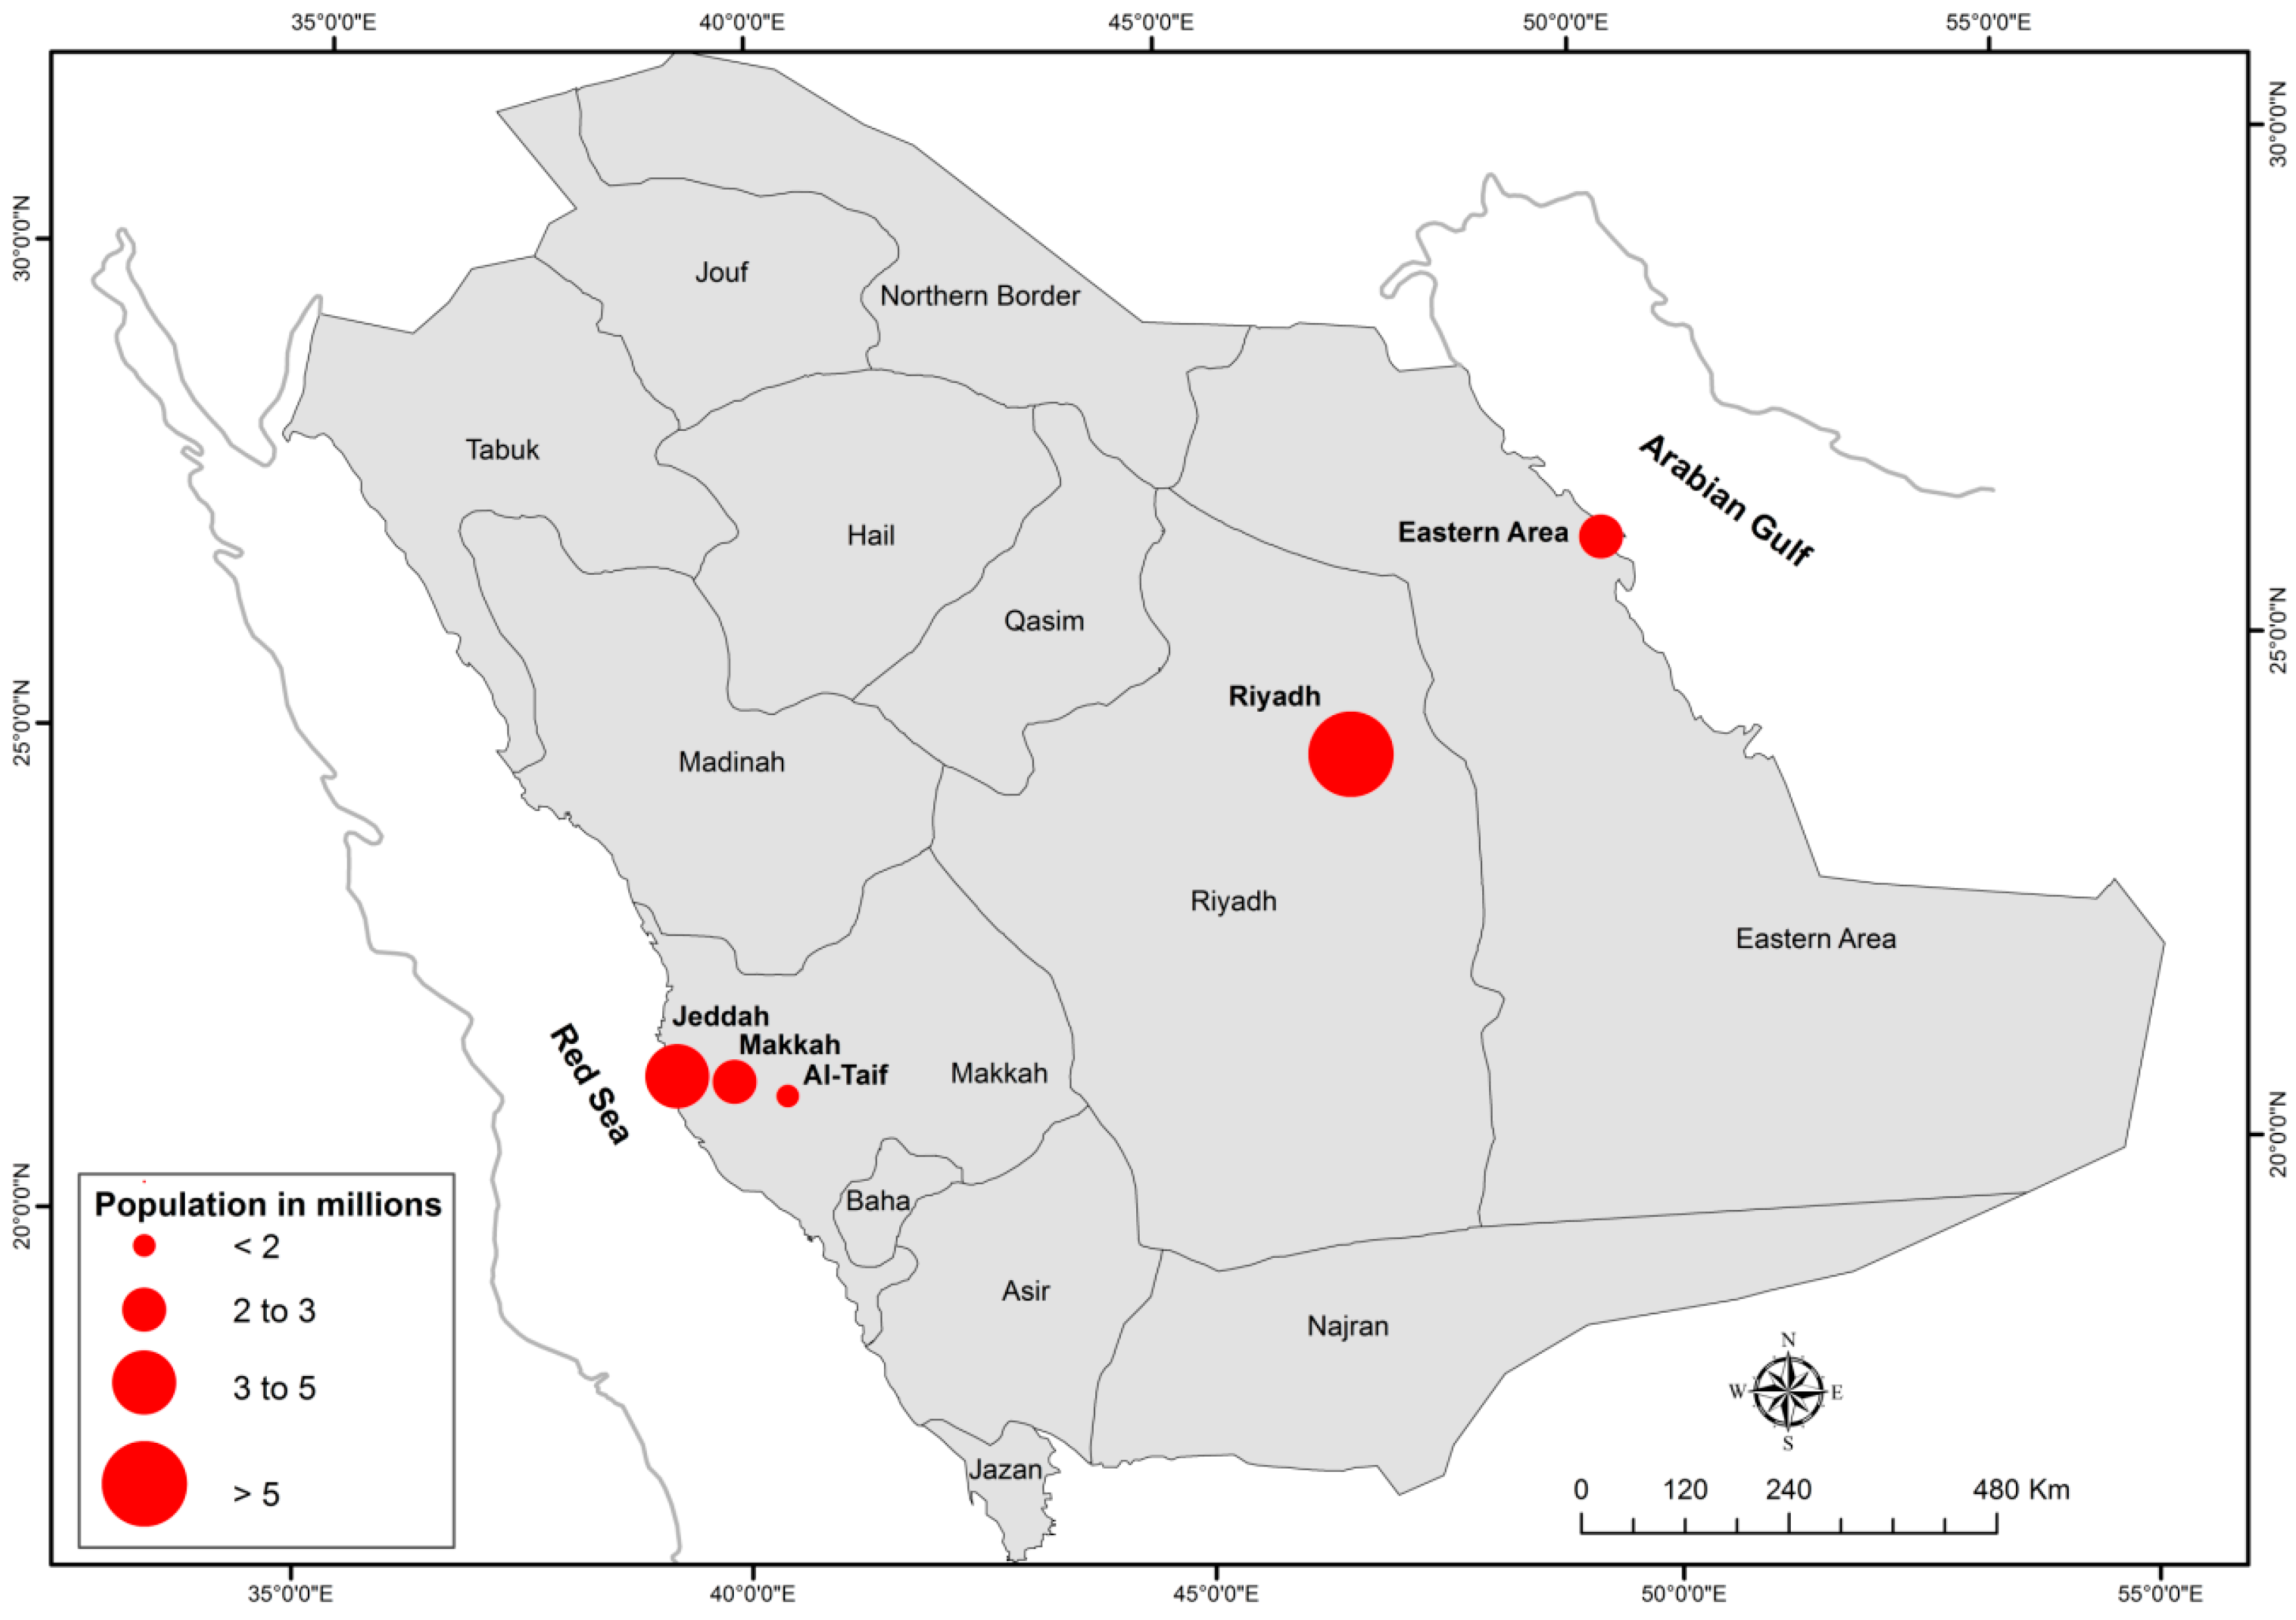
2. Study Areas
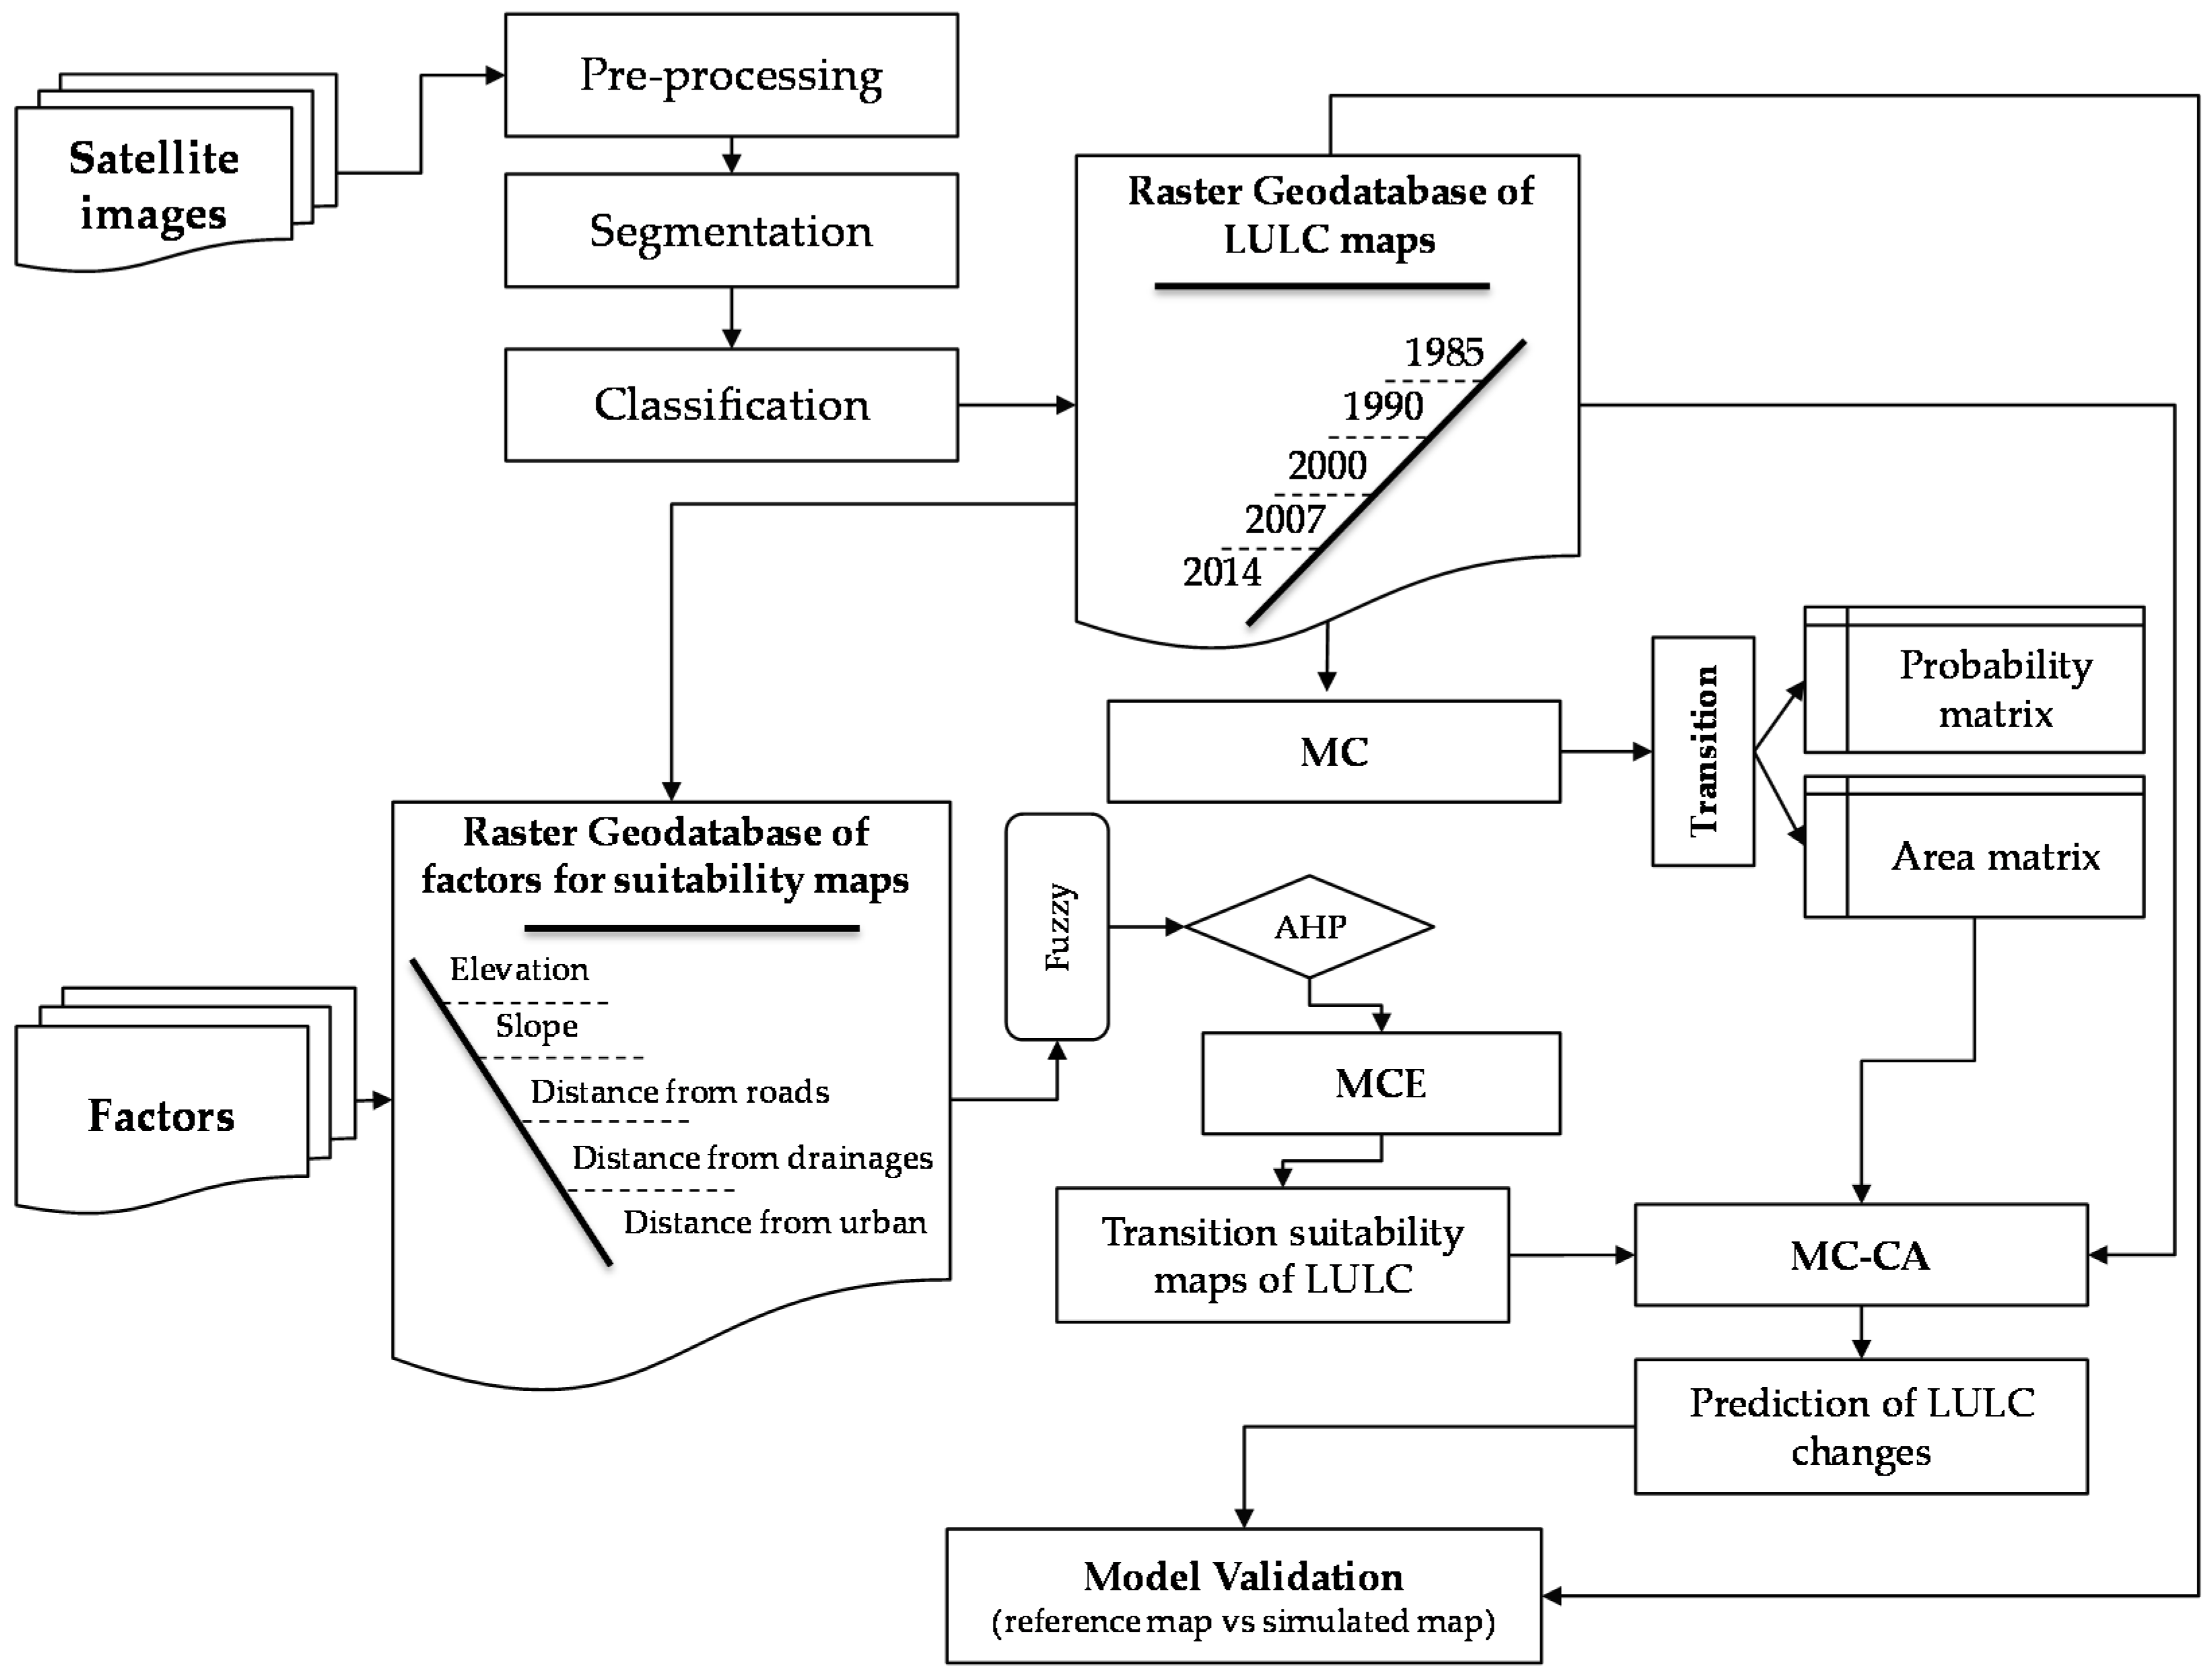
3. Data and Methods
3.1. Data and Pre-Processing
3.2. Image Segmentation and Classification
3.3. Accuracy Assessment
3.4. LULC Change Modelling
3.4.1. MC Model
3.4.2. Integrating MC and CA Models
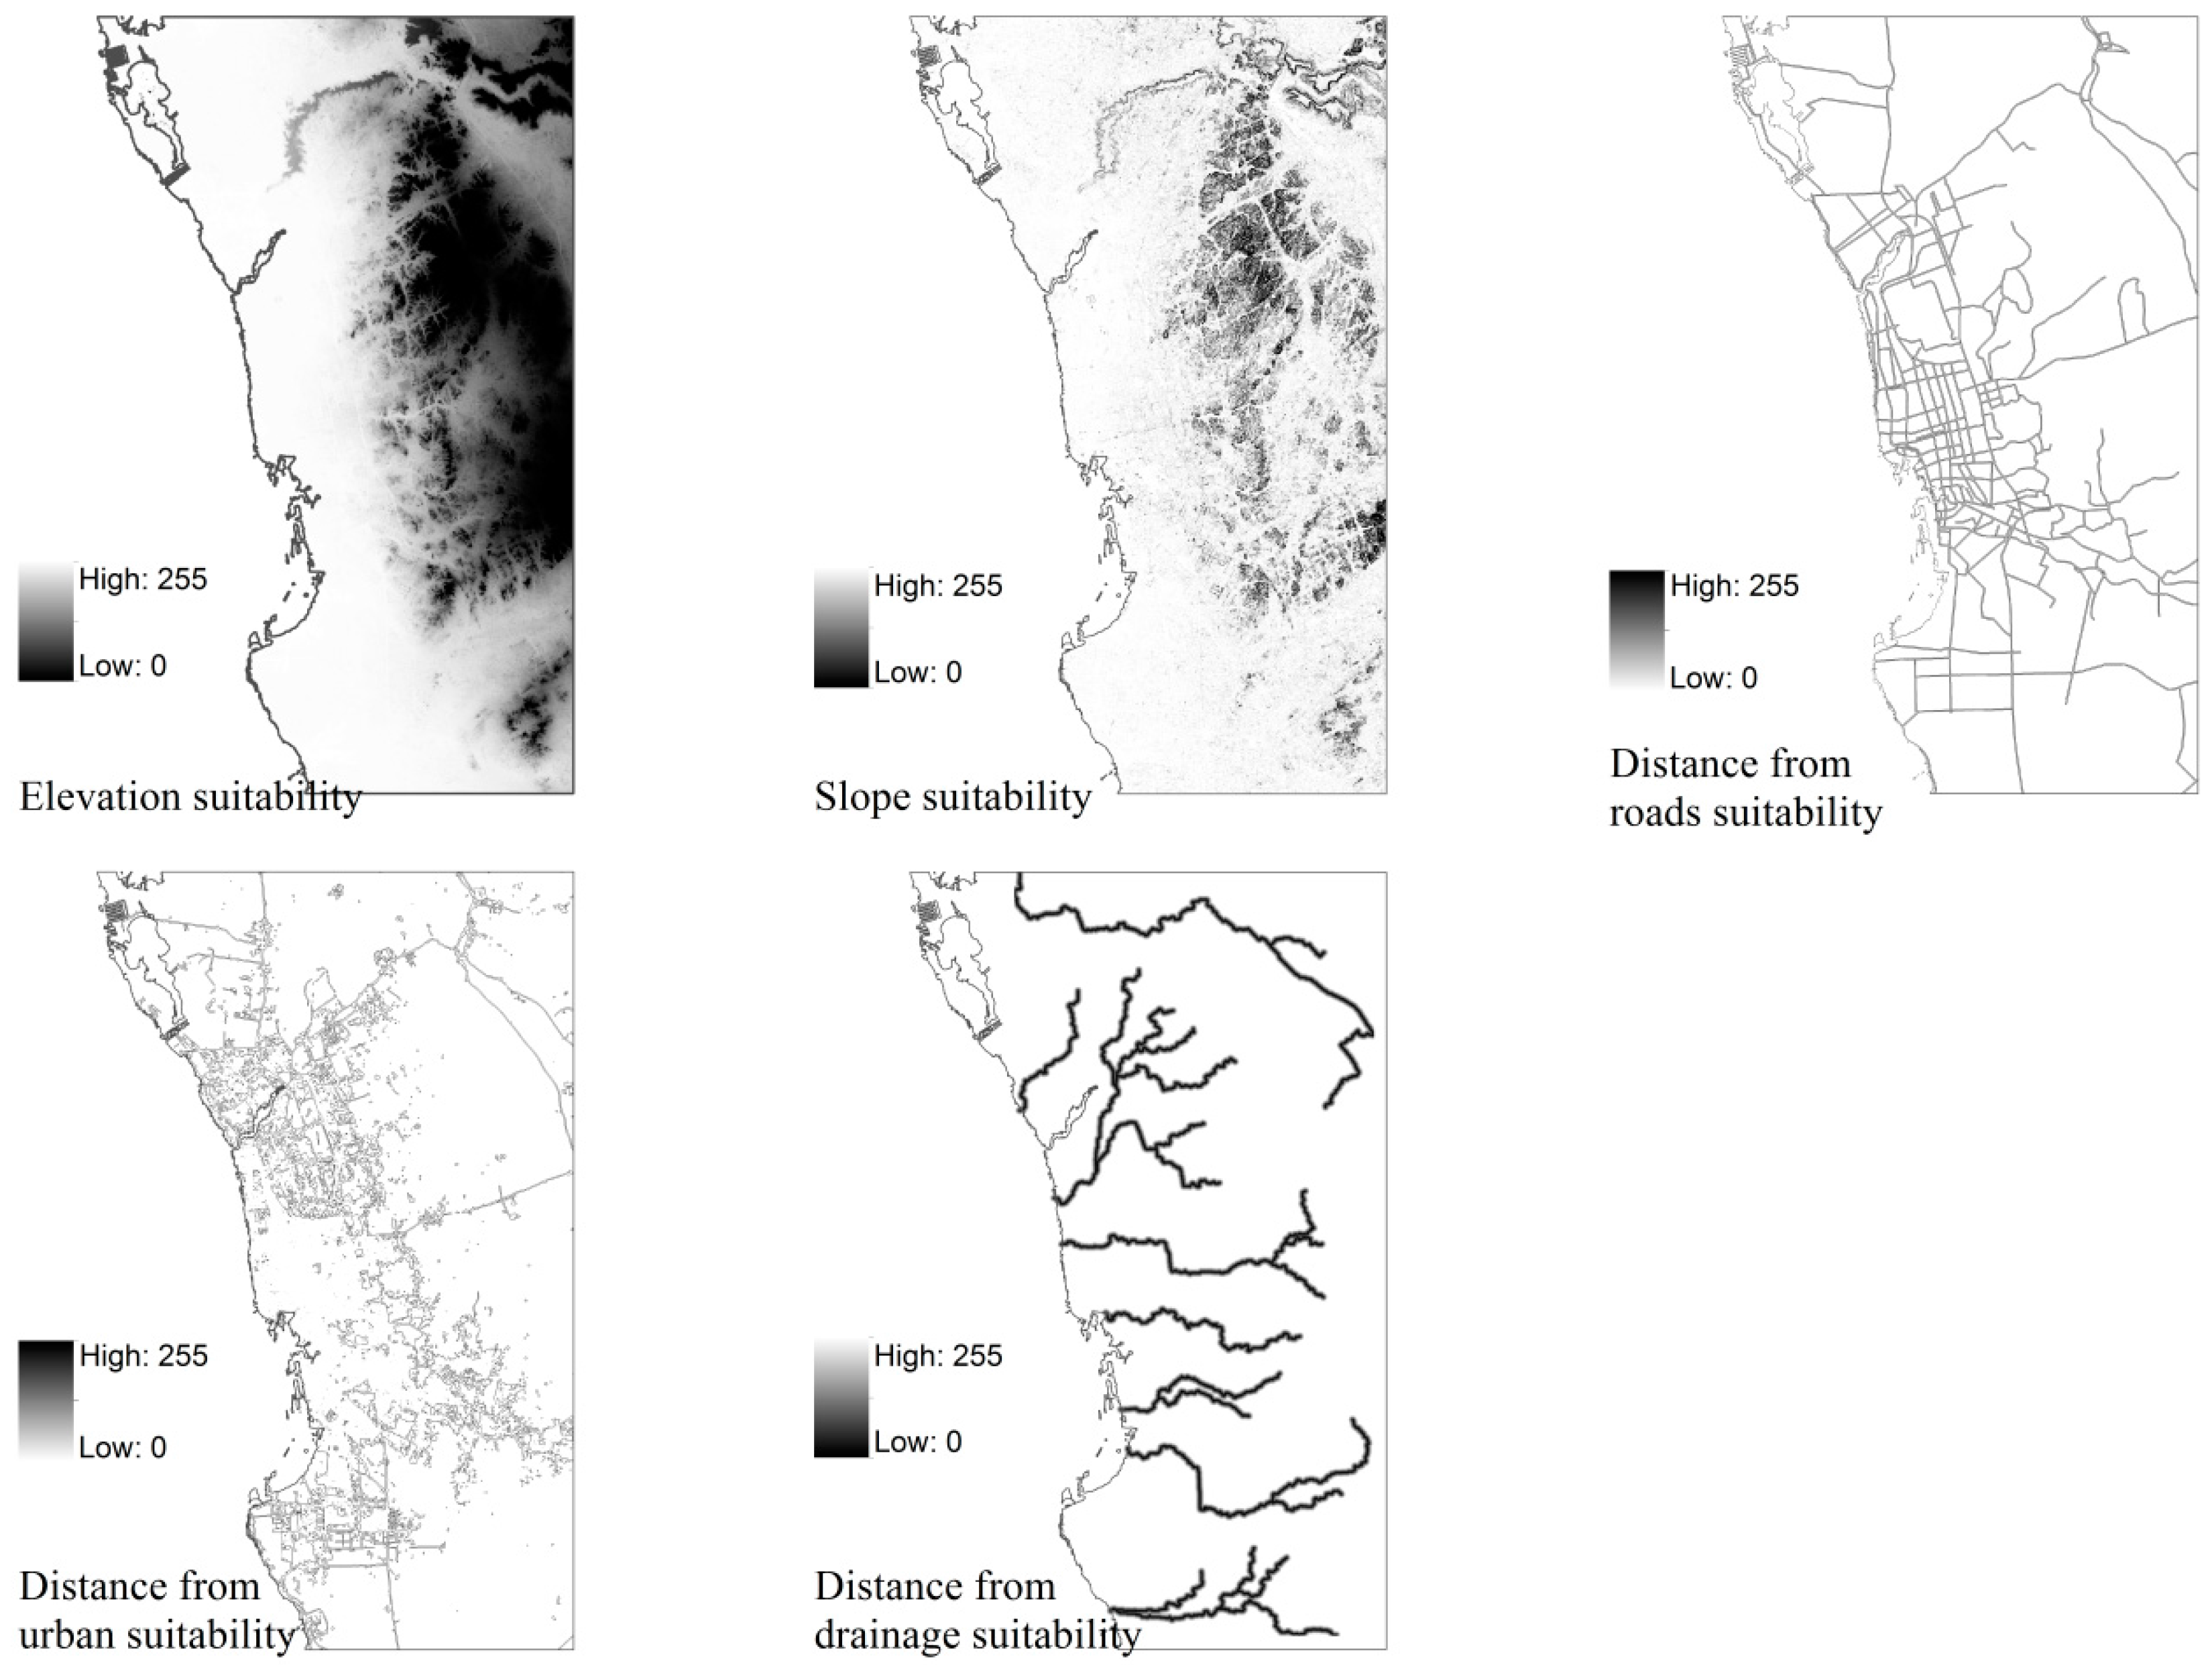
3.4.3. Transition Suitability Maps
3.4.4. Model Validation
4. Results
4.1. Accuracy Assessment of LULC Classifications
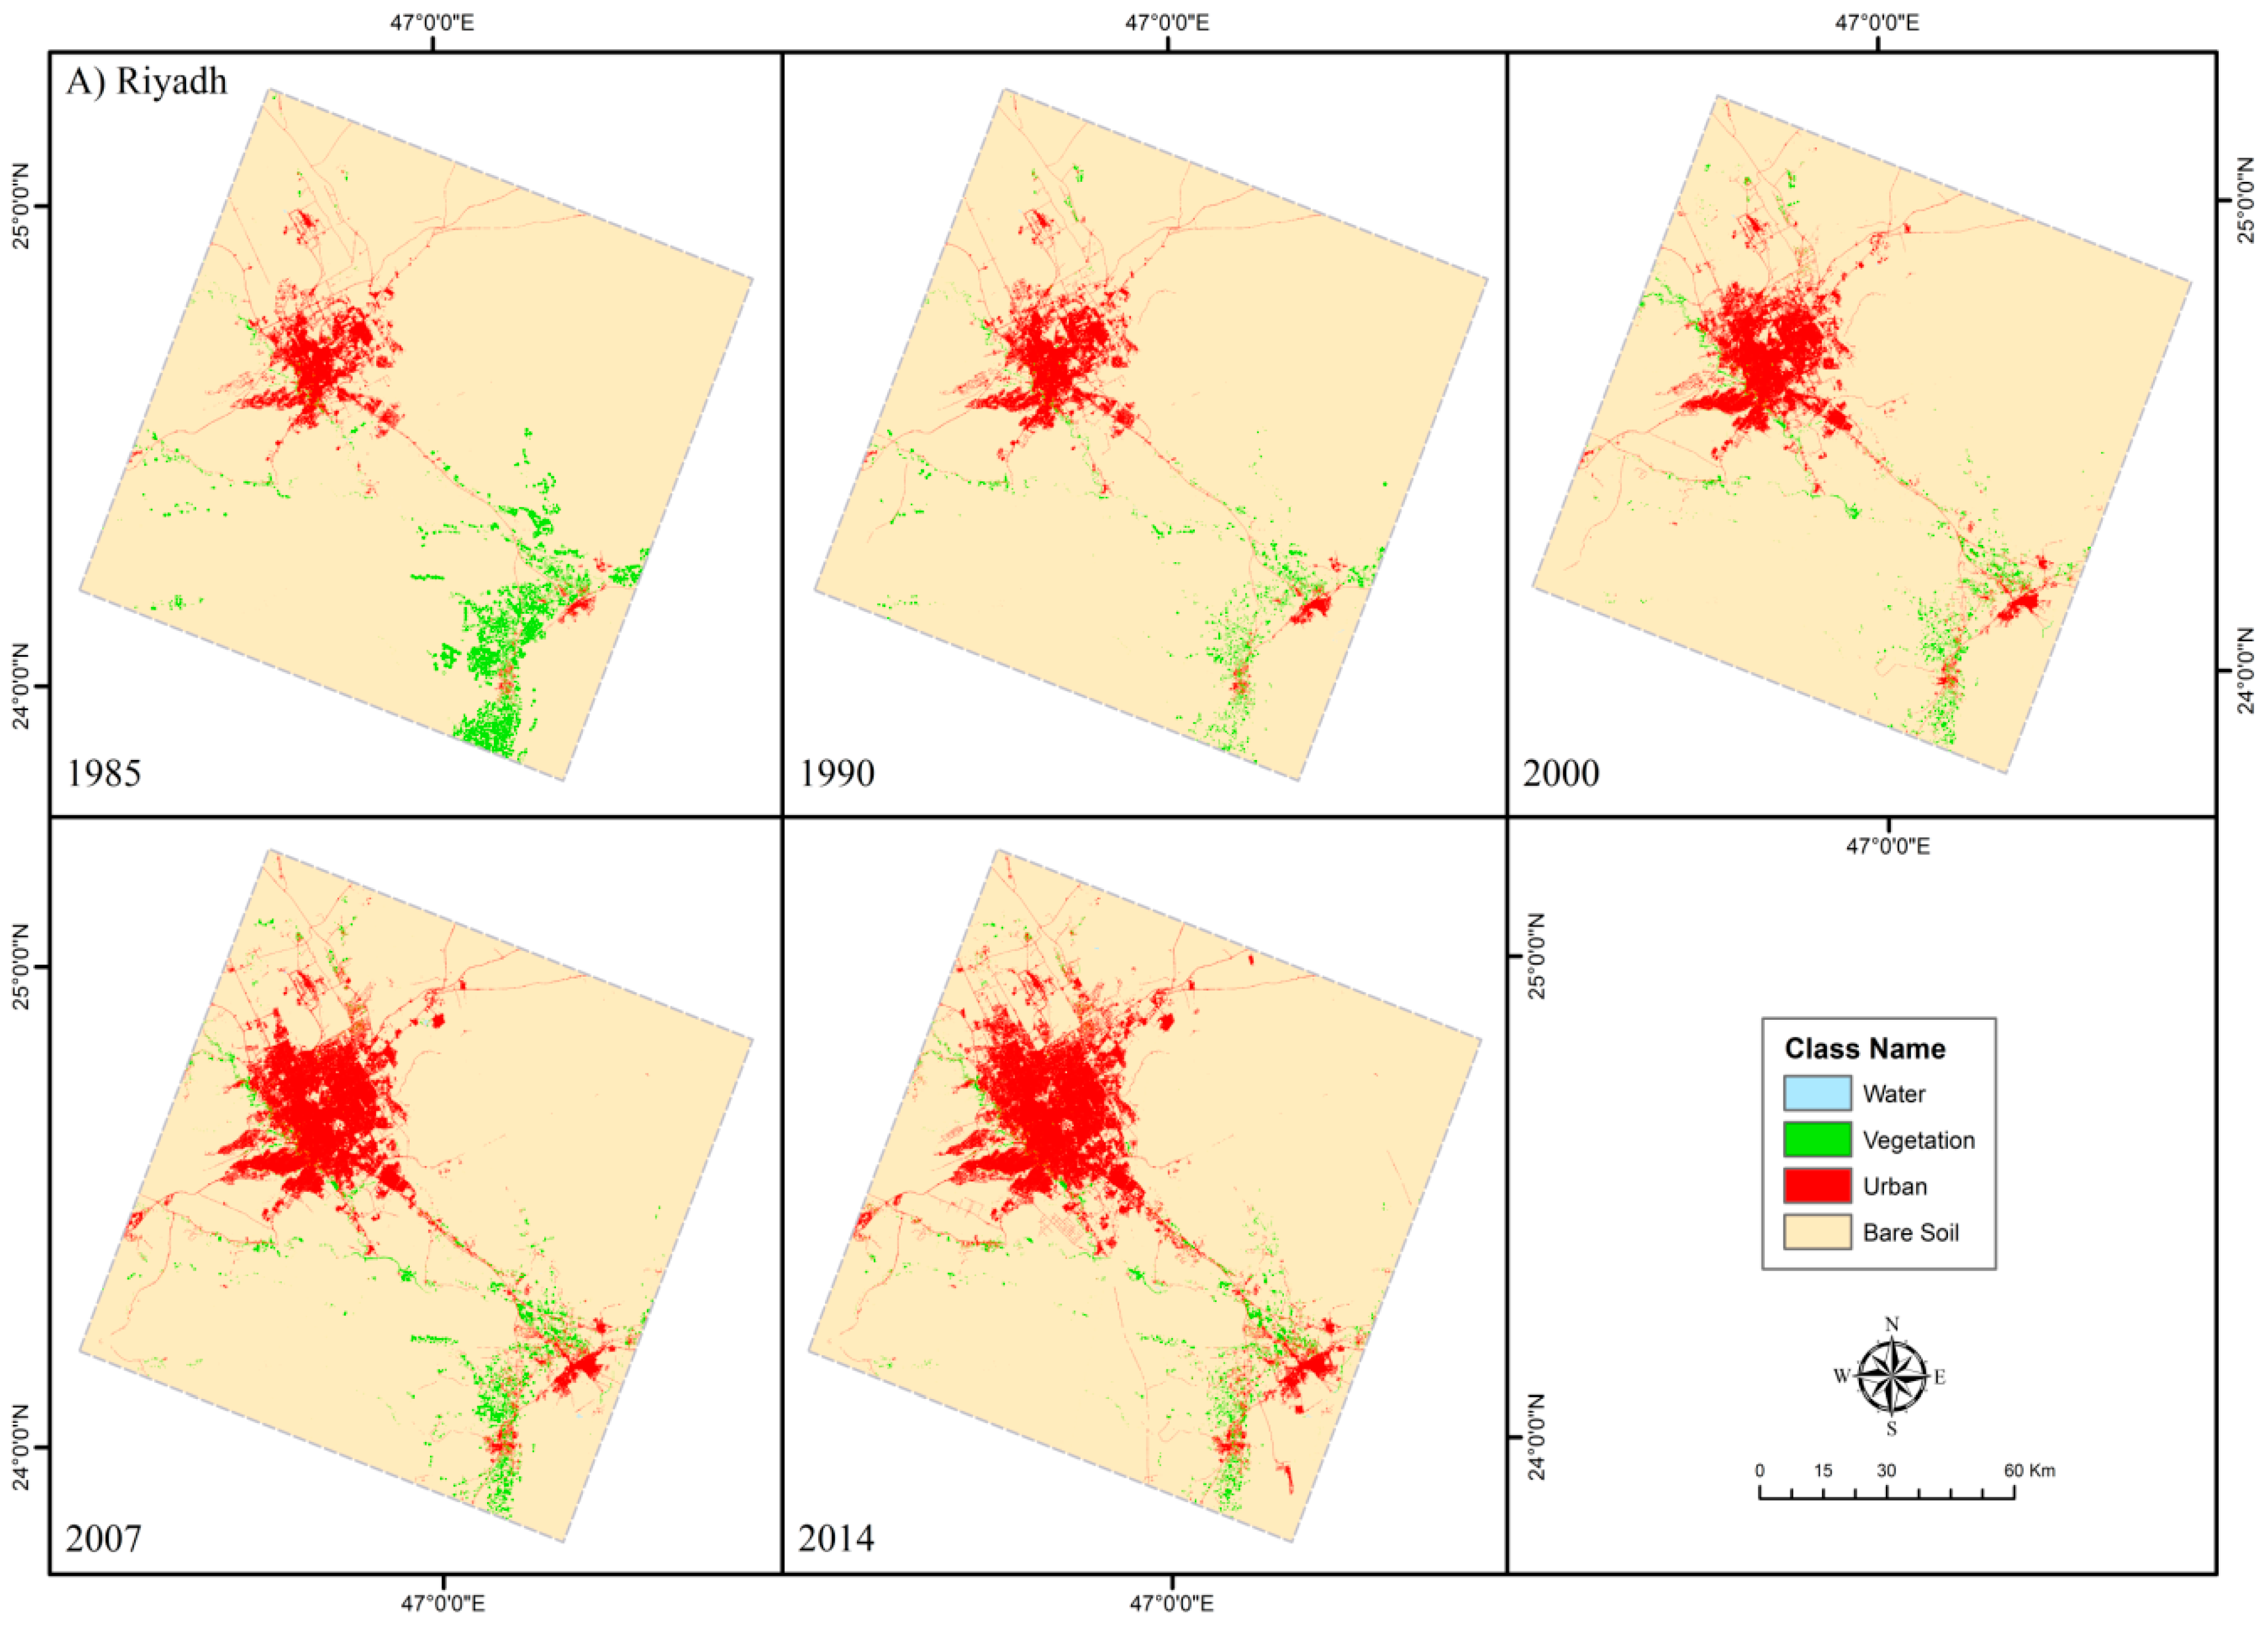
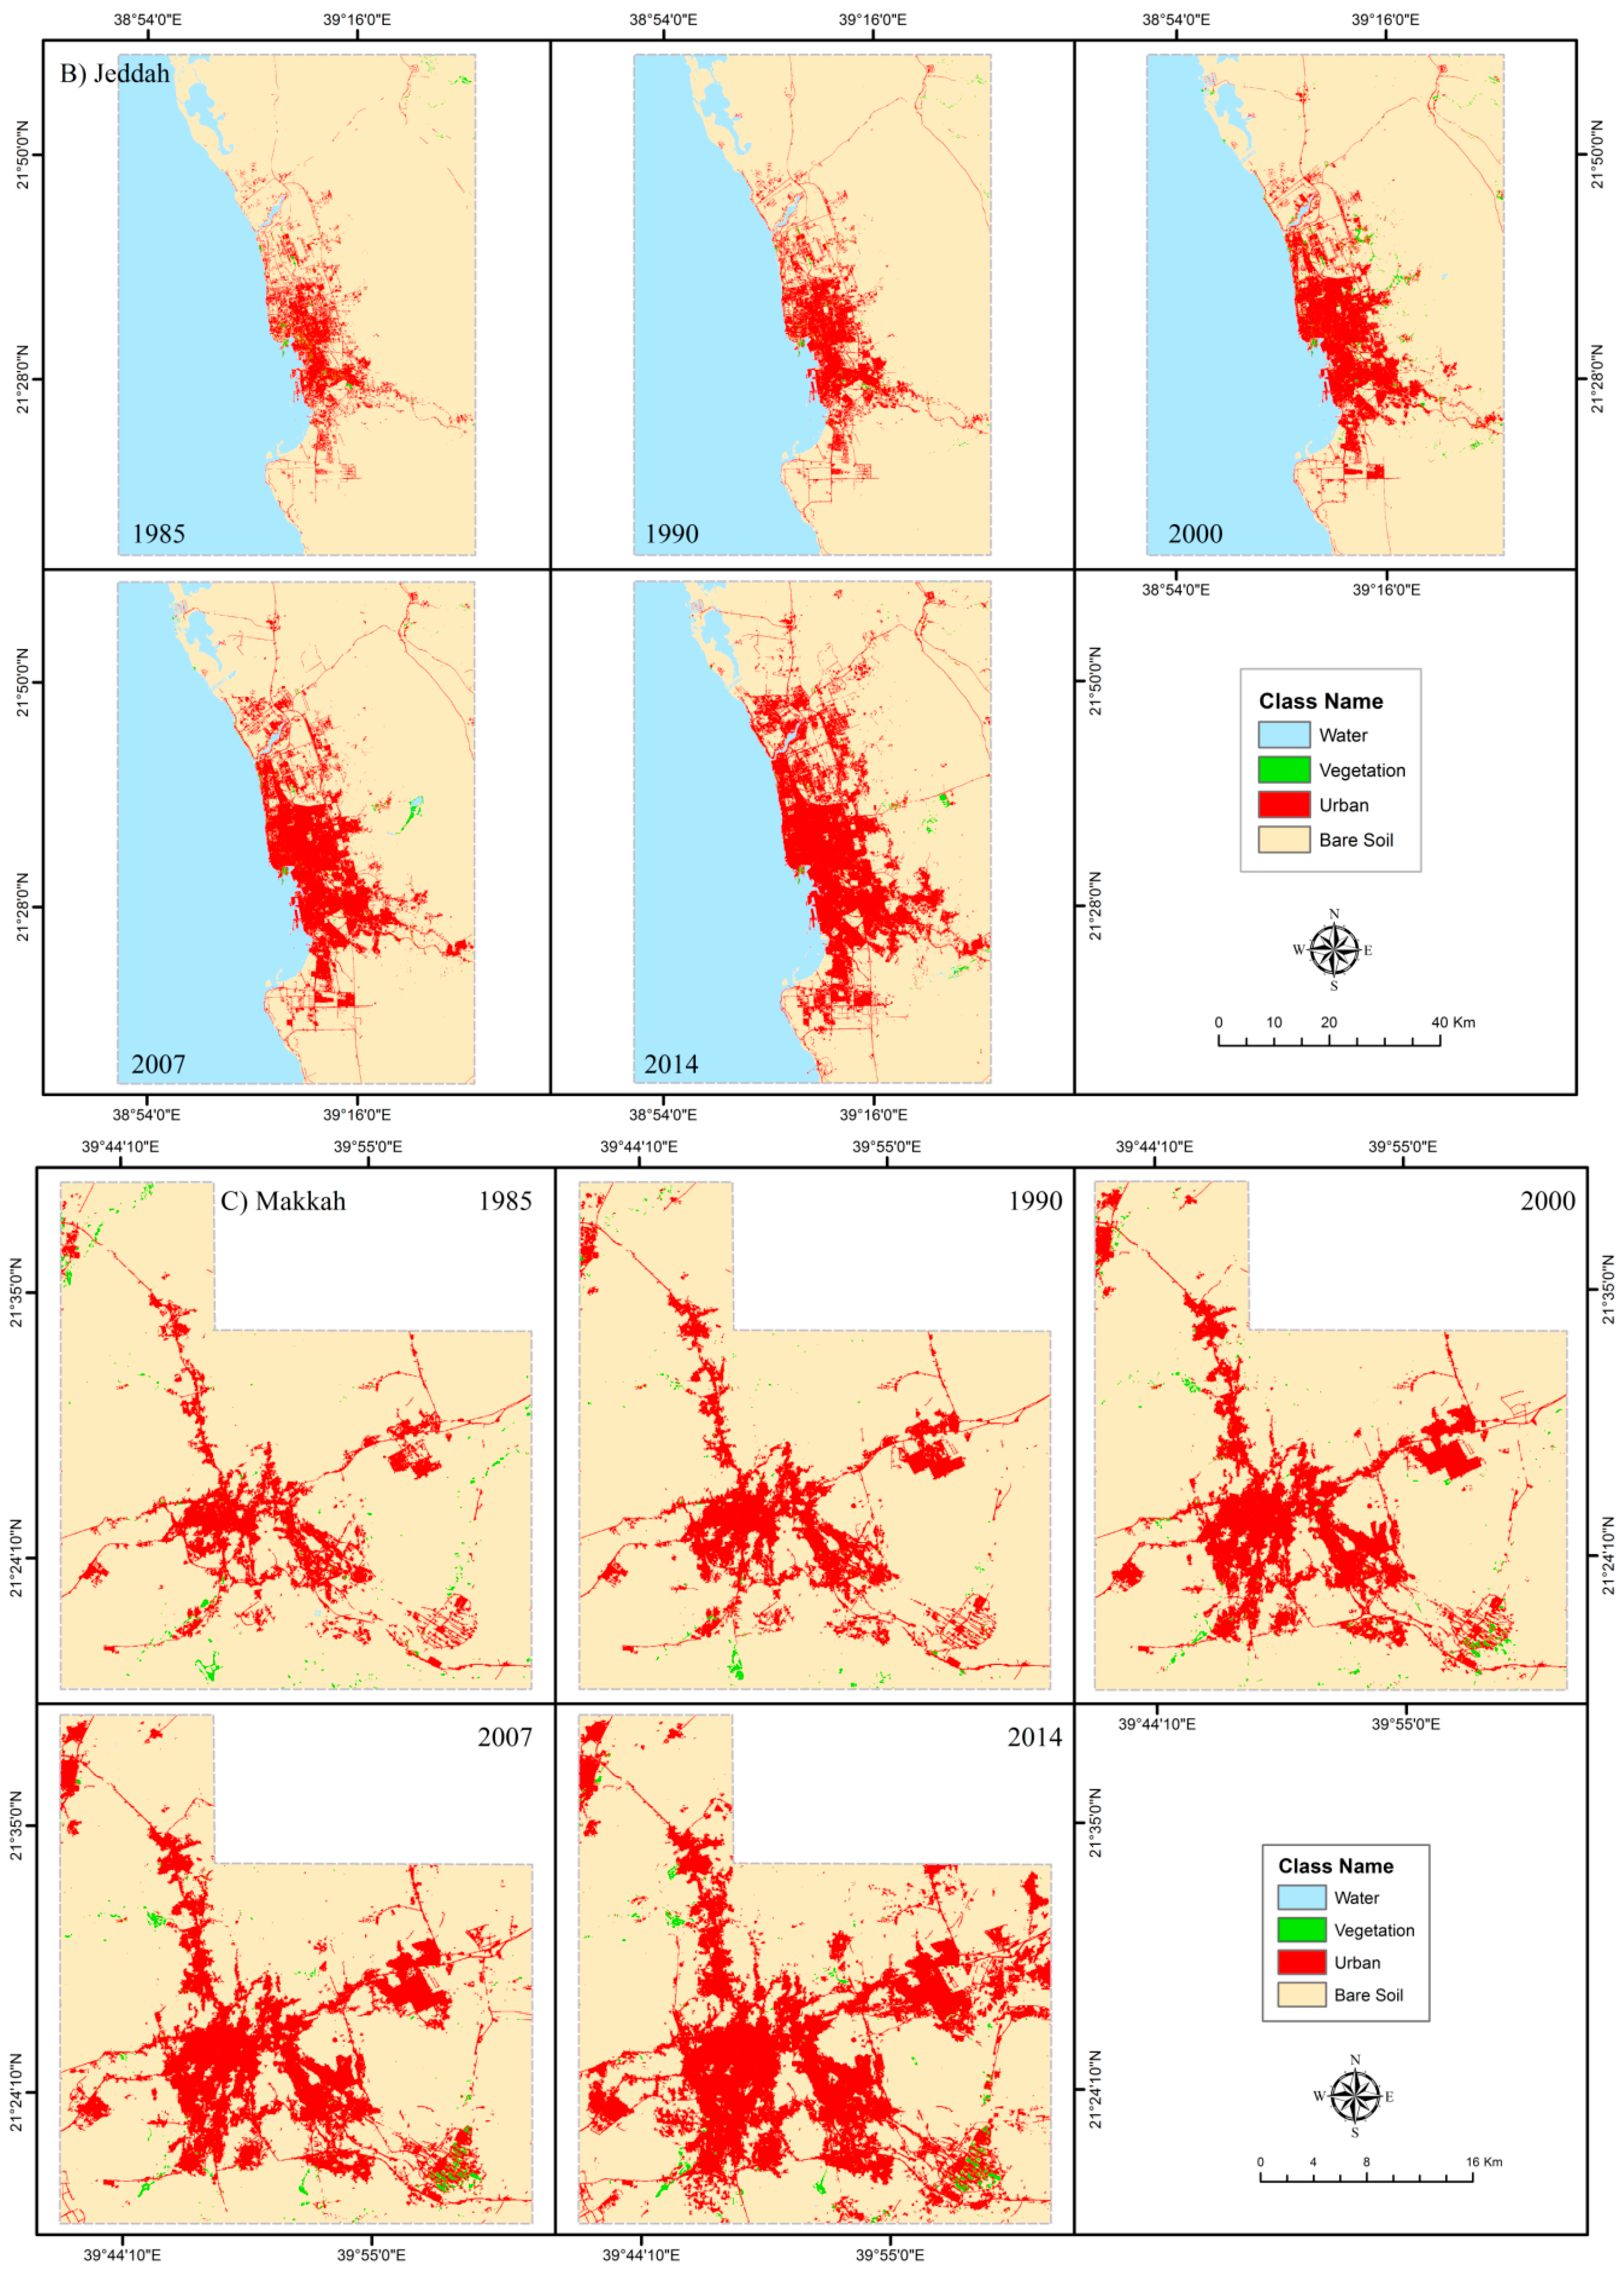
4.2. LULC Changes (1985 to 2014)
4.3. Transition Matrices
4.4. Model Validation
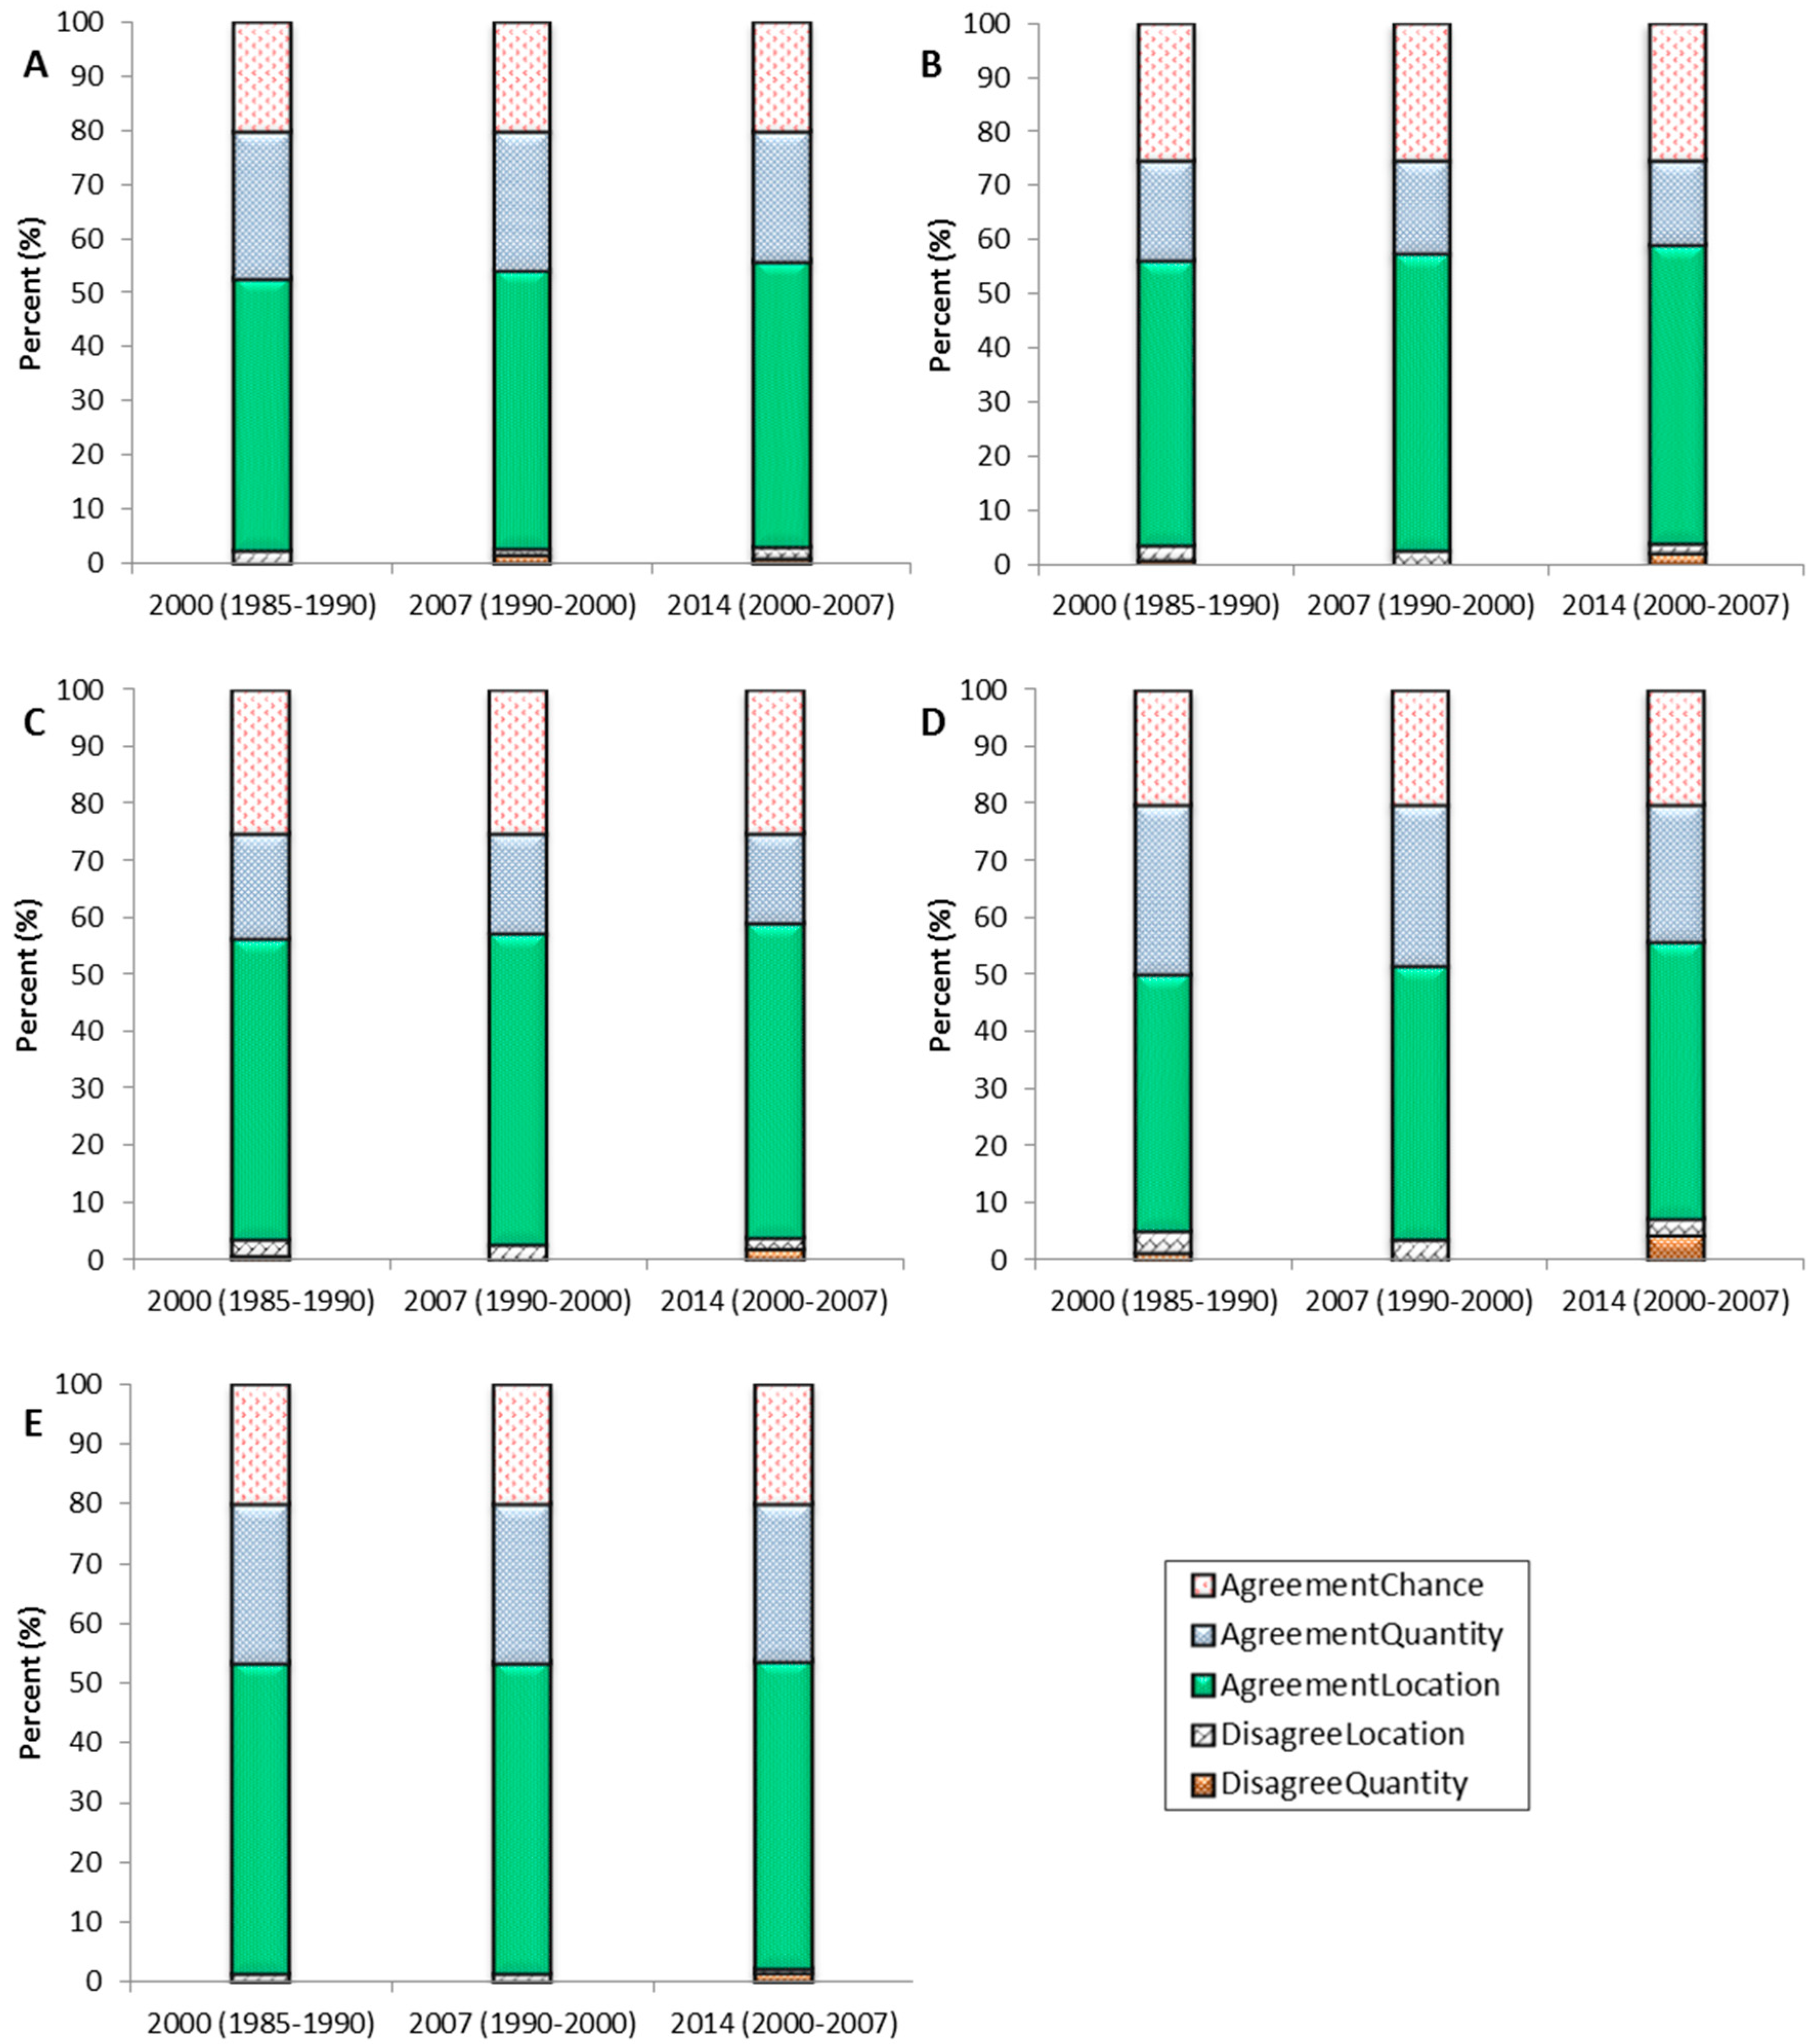
4.4.1. Agreement and Disagreement Components
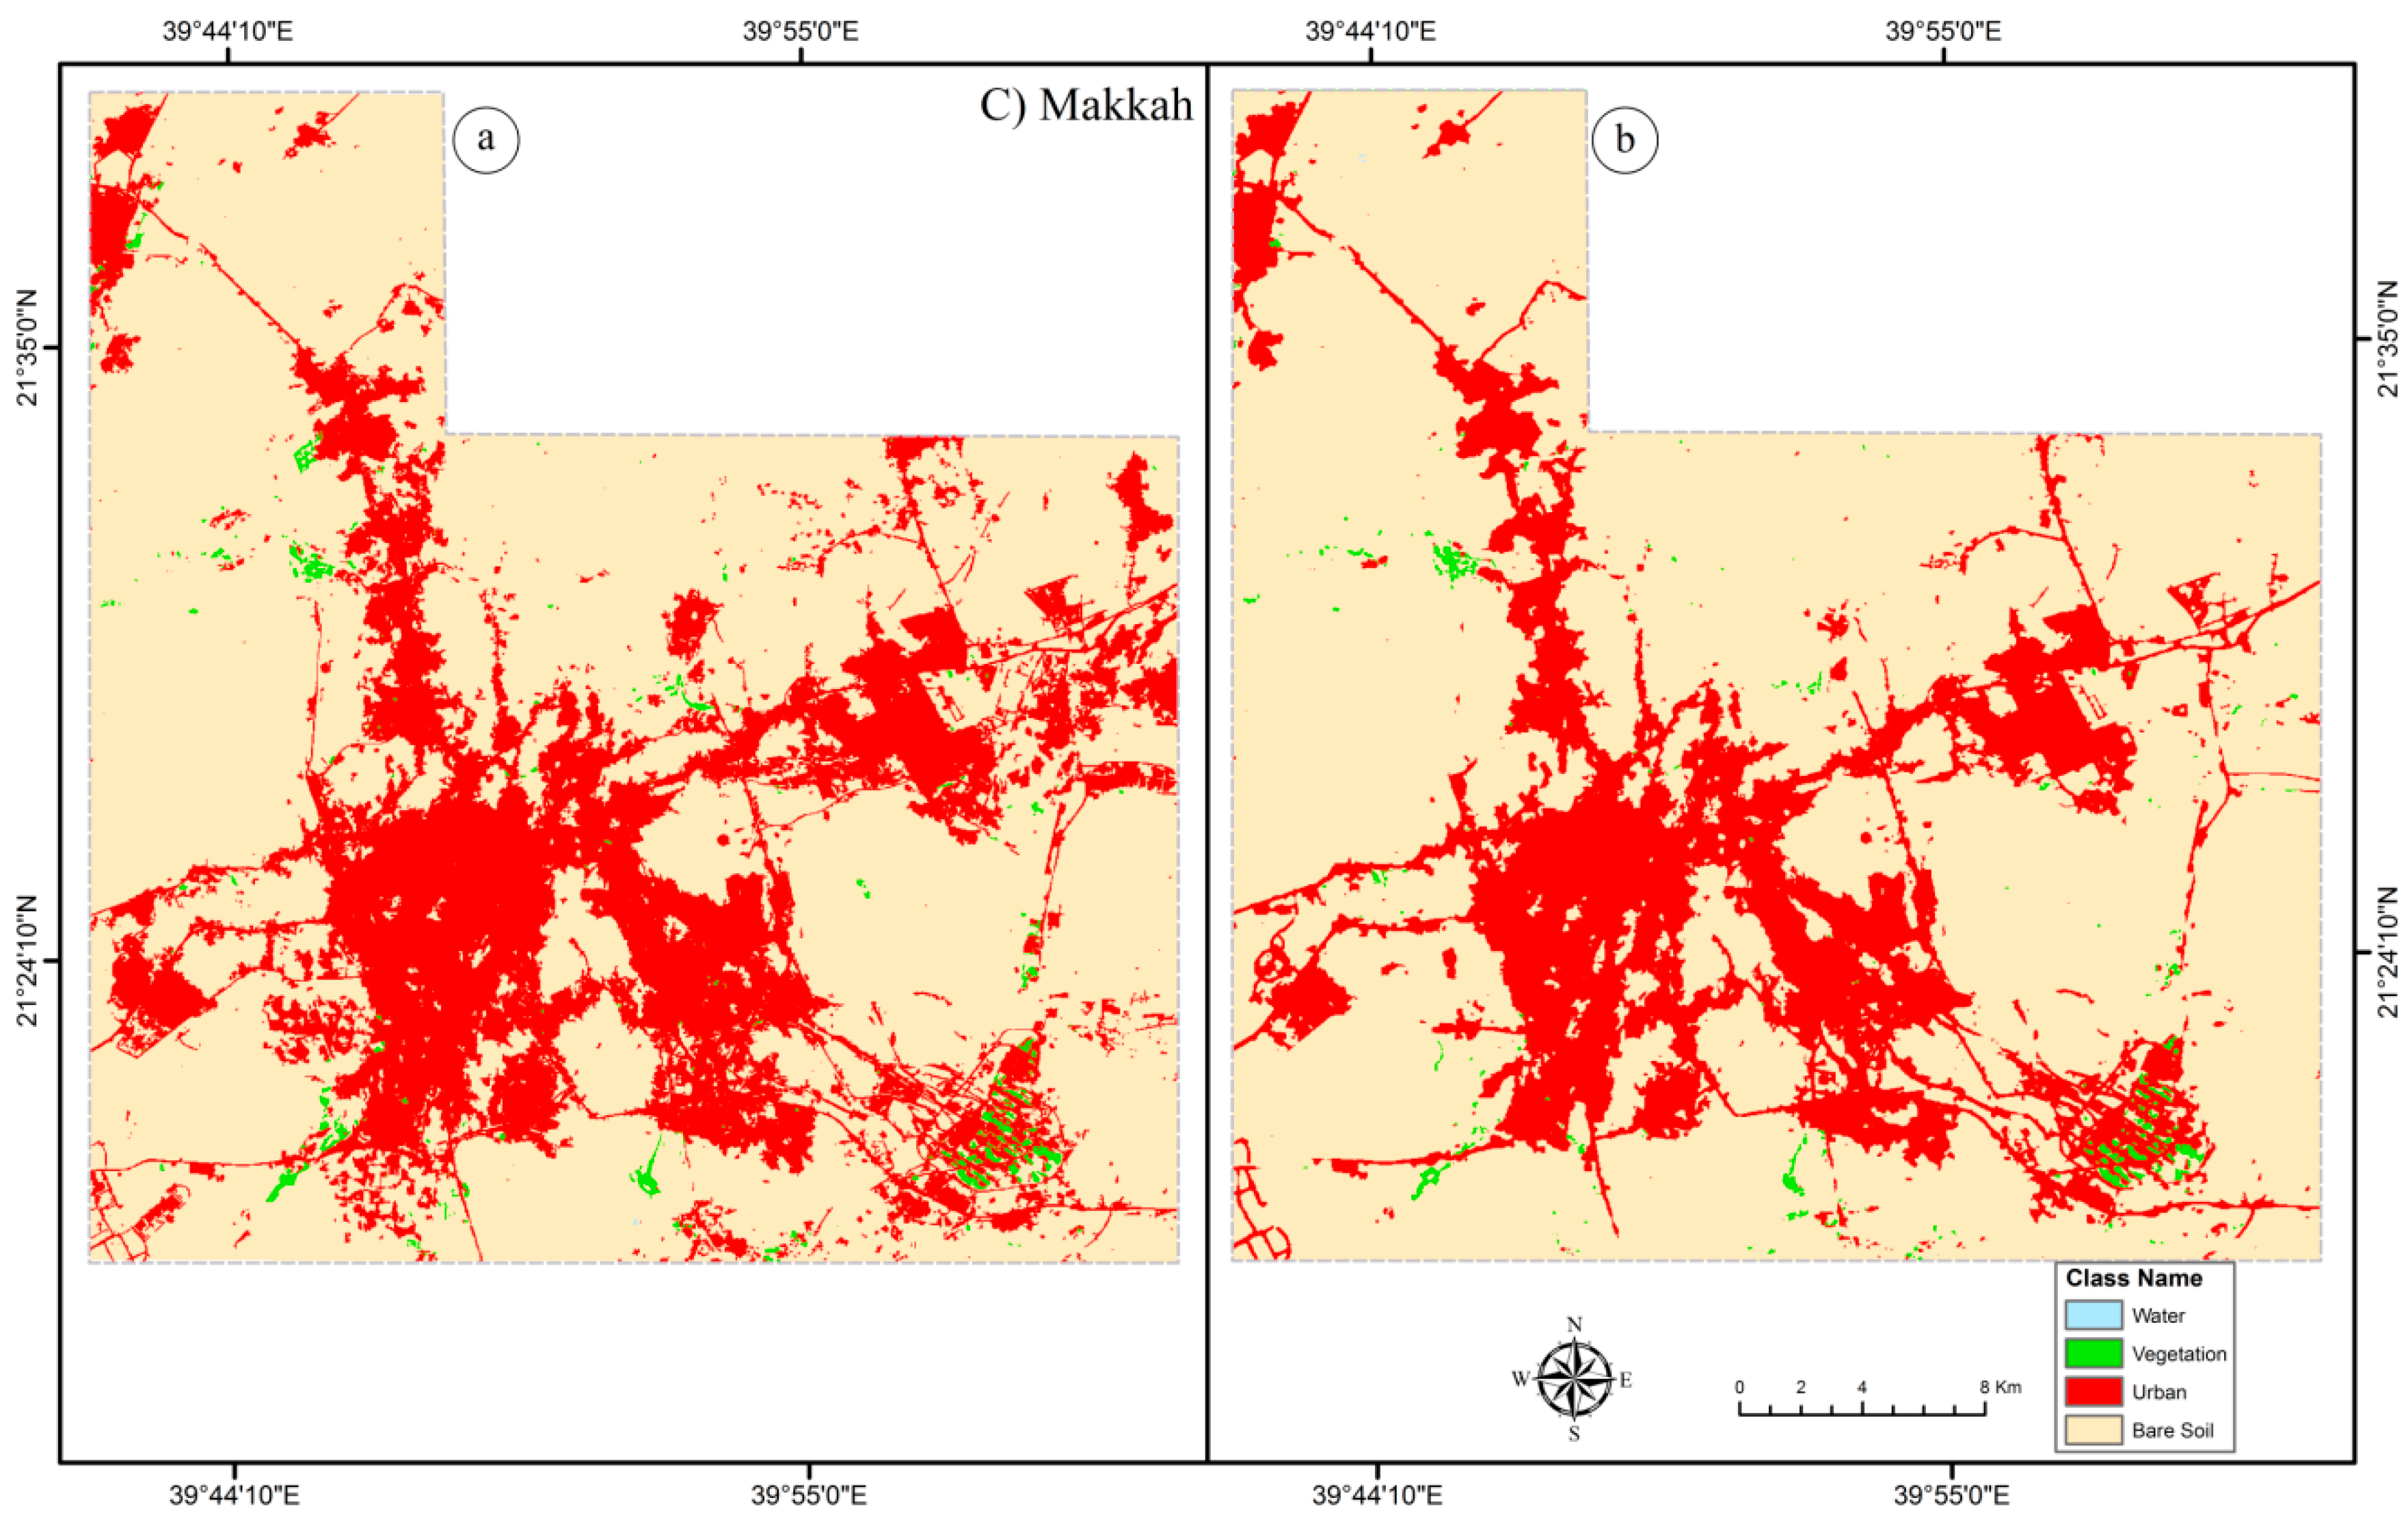
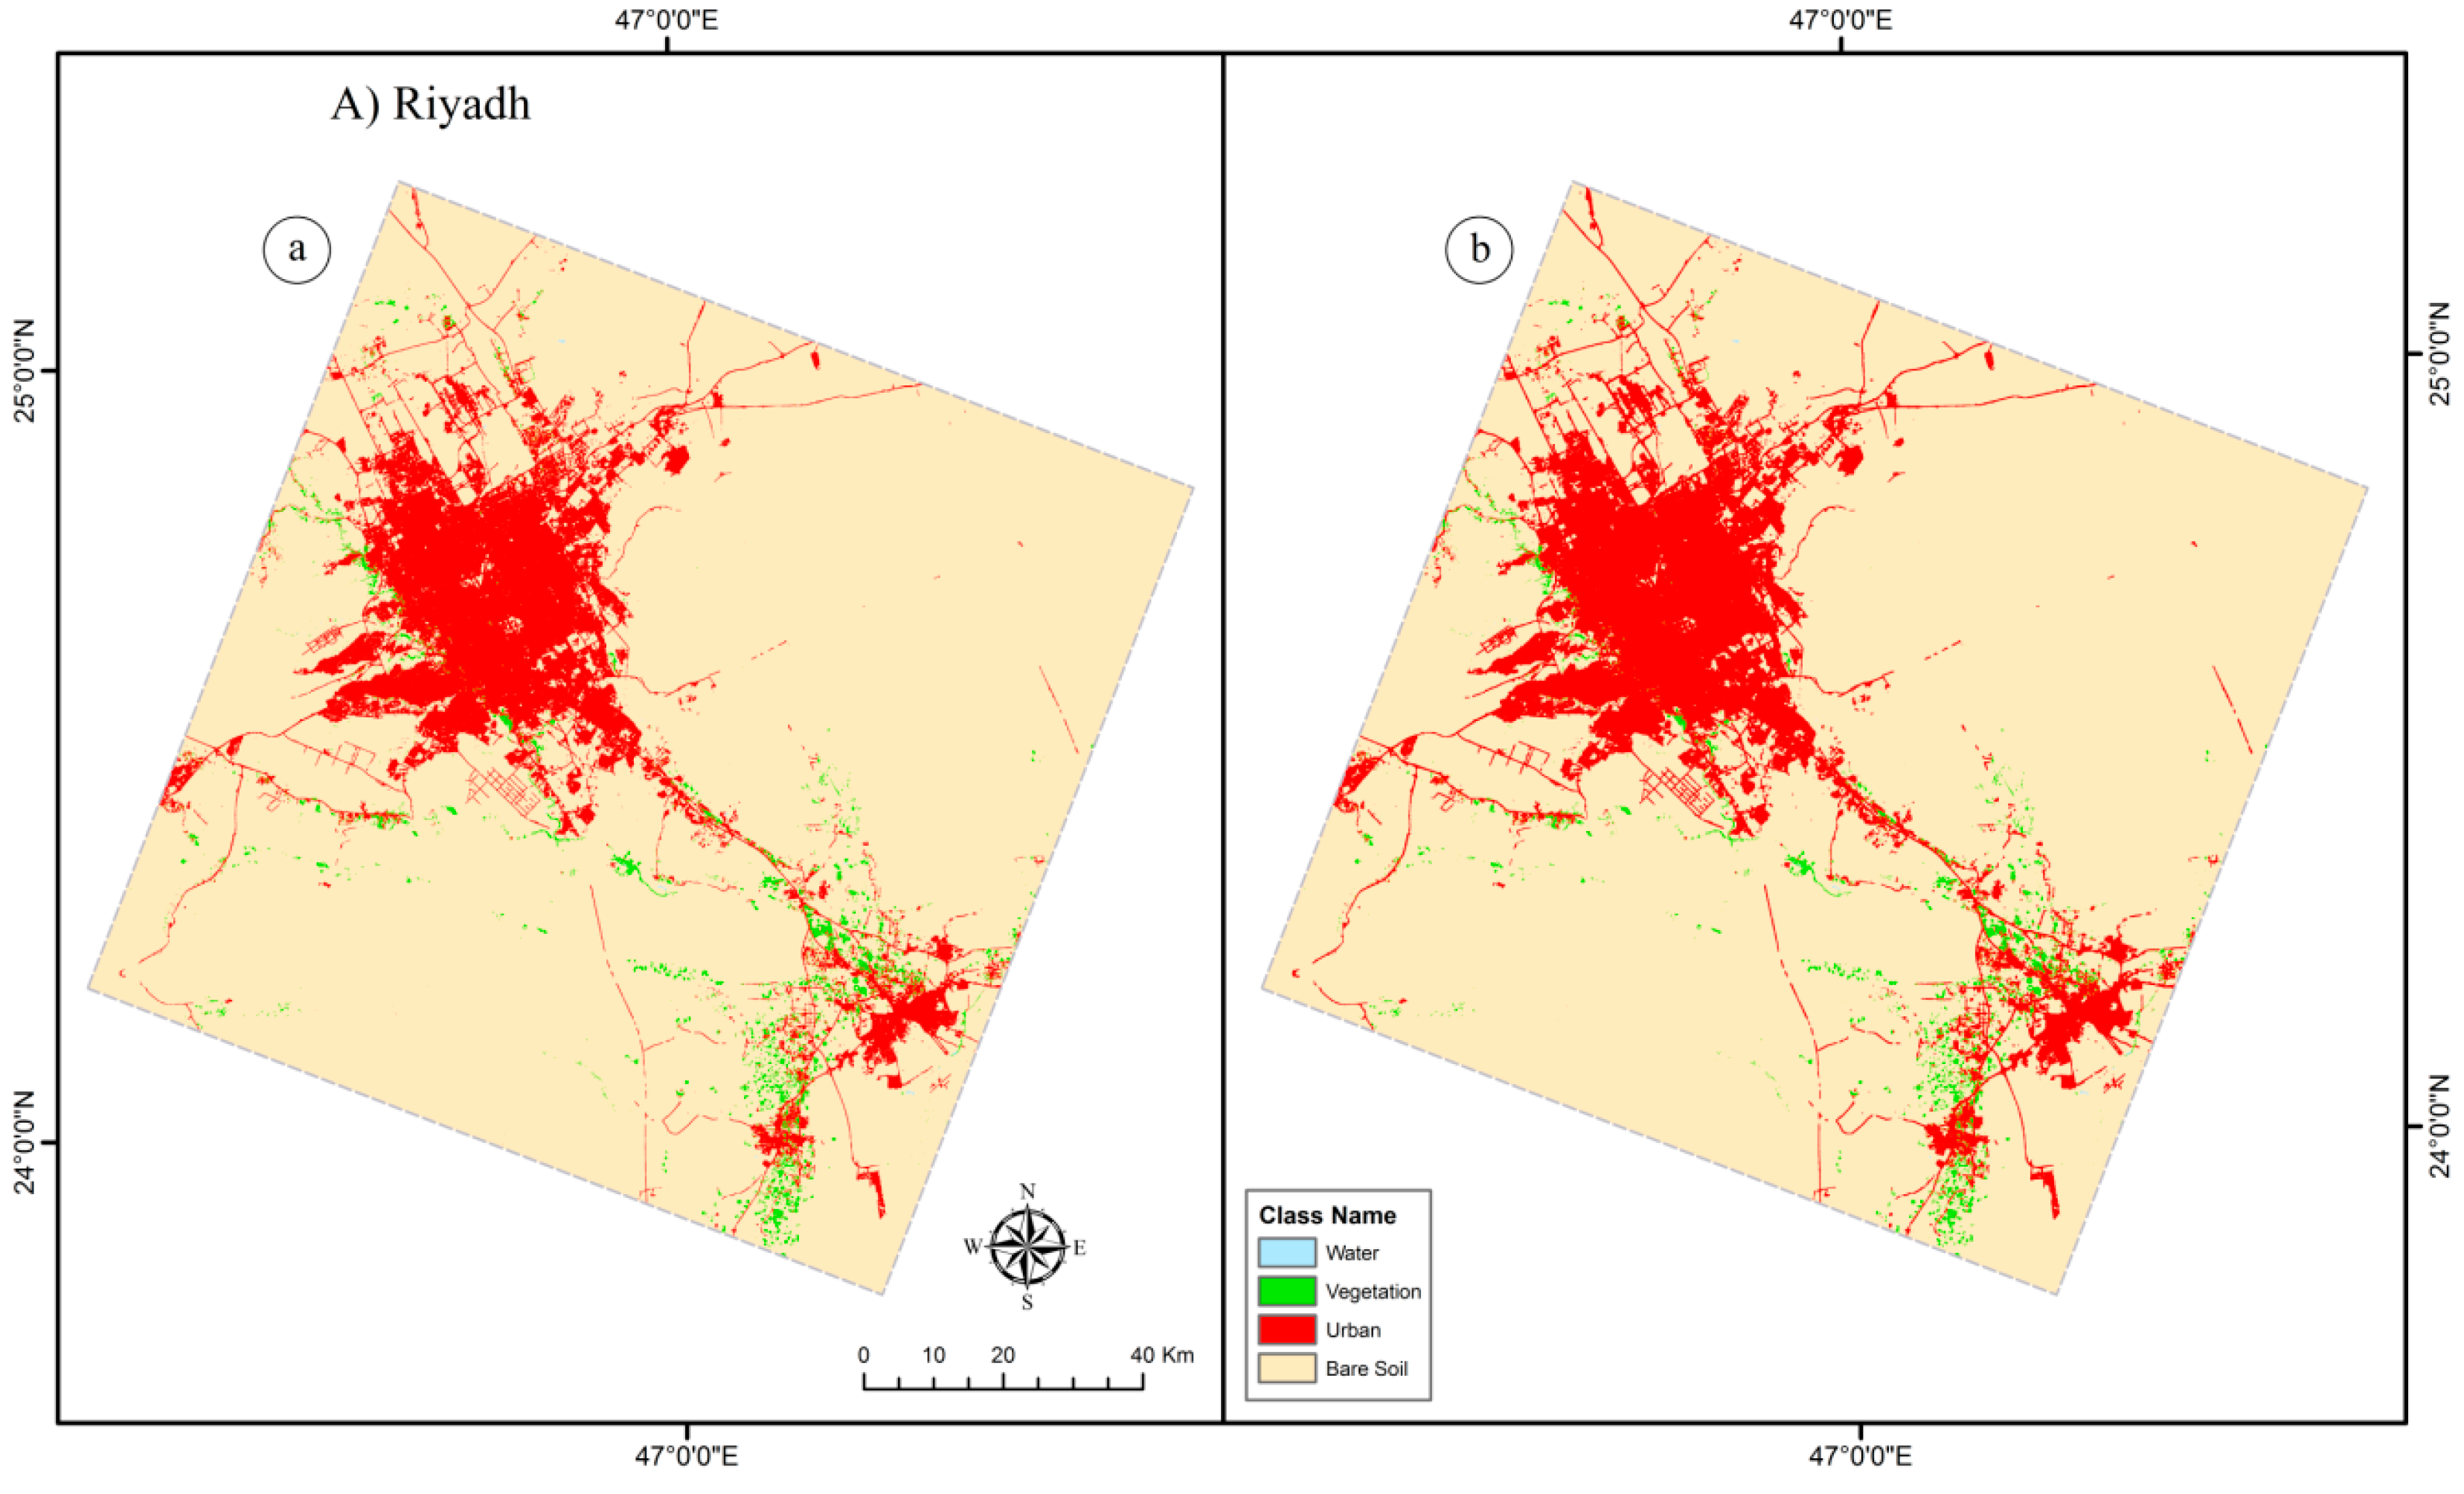
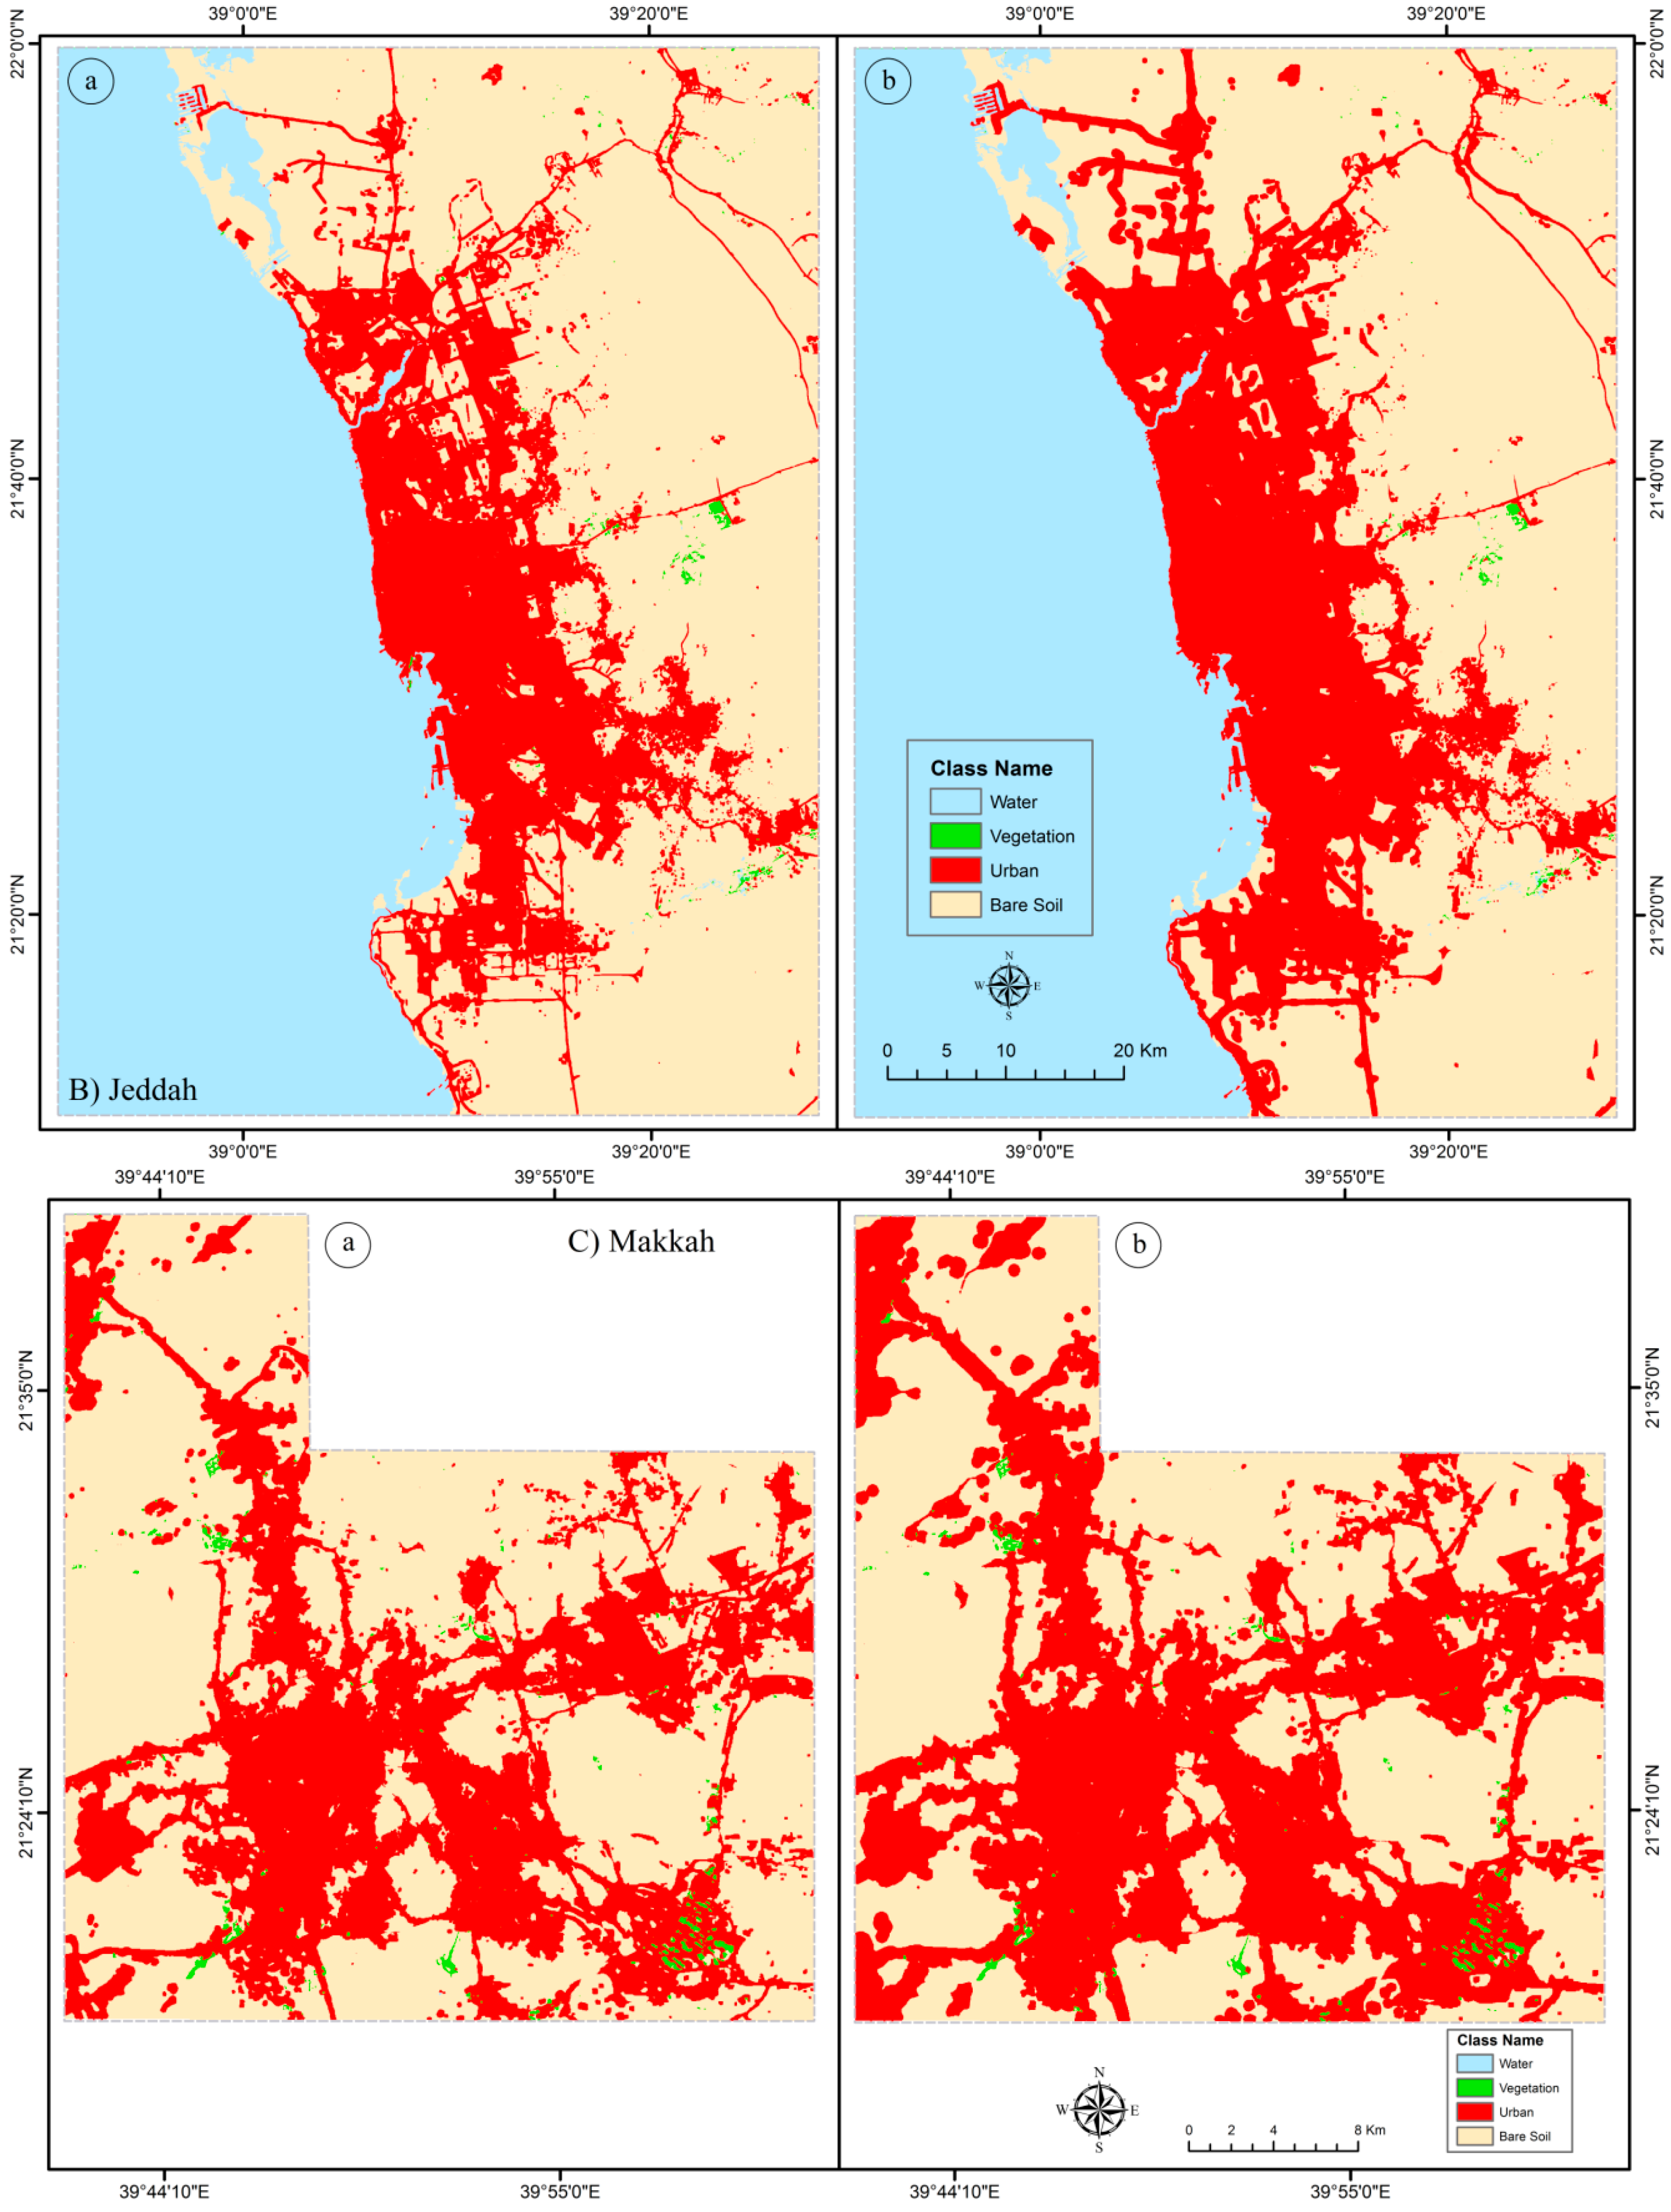
4.4.2. Spatial Comparison between the Actual LULC Classification and the Simulation Map
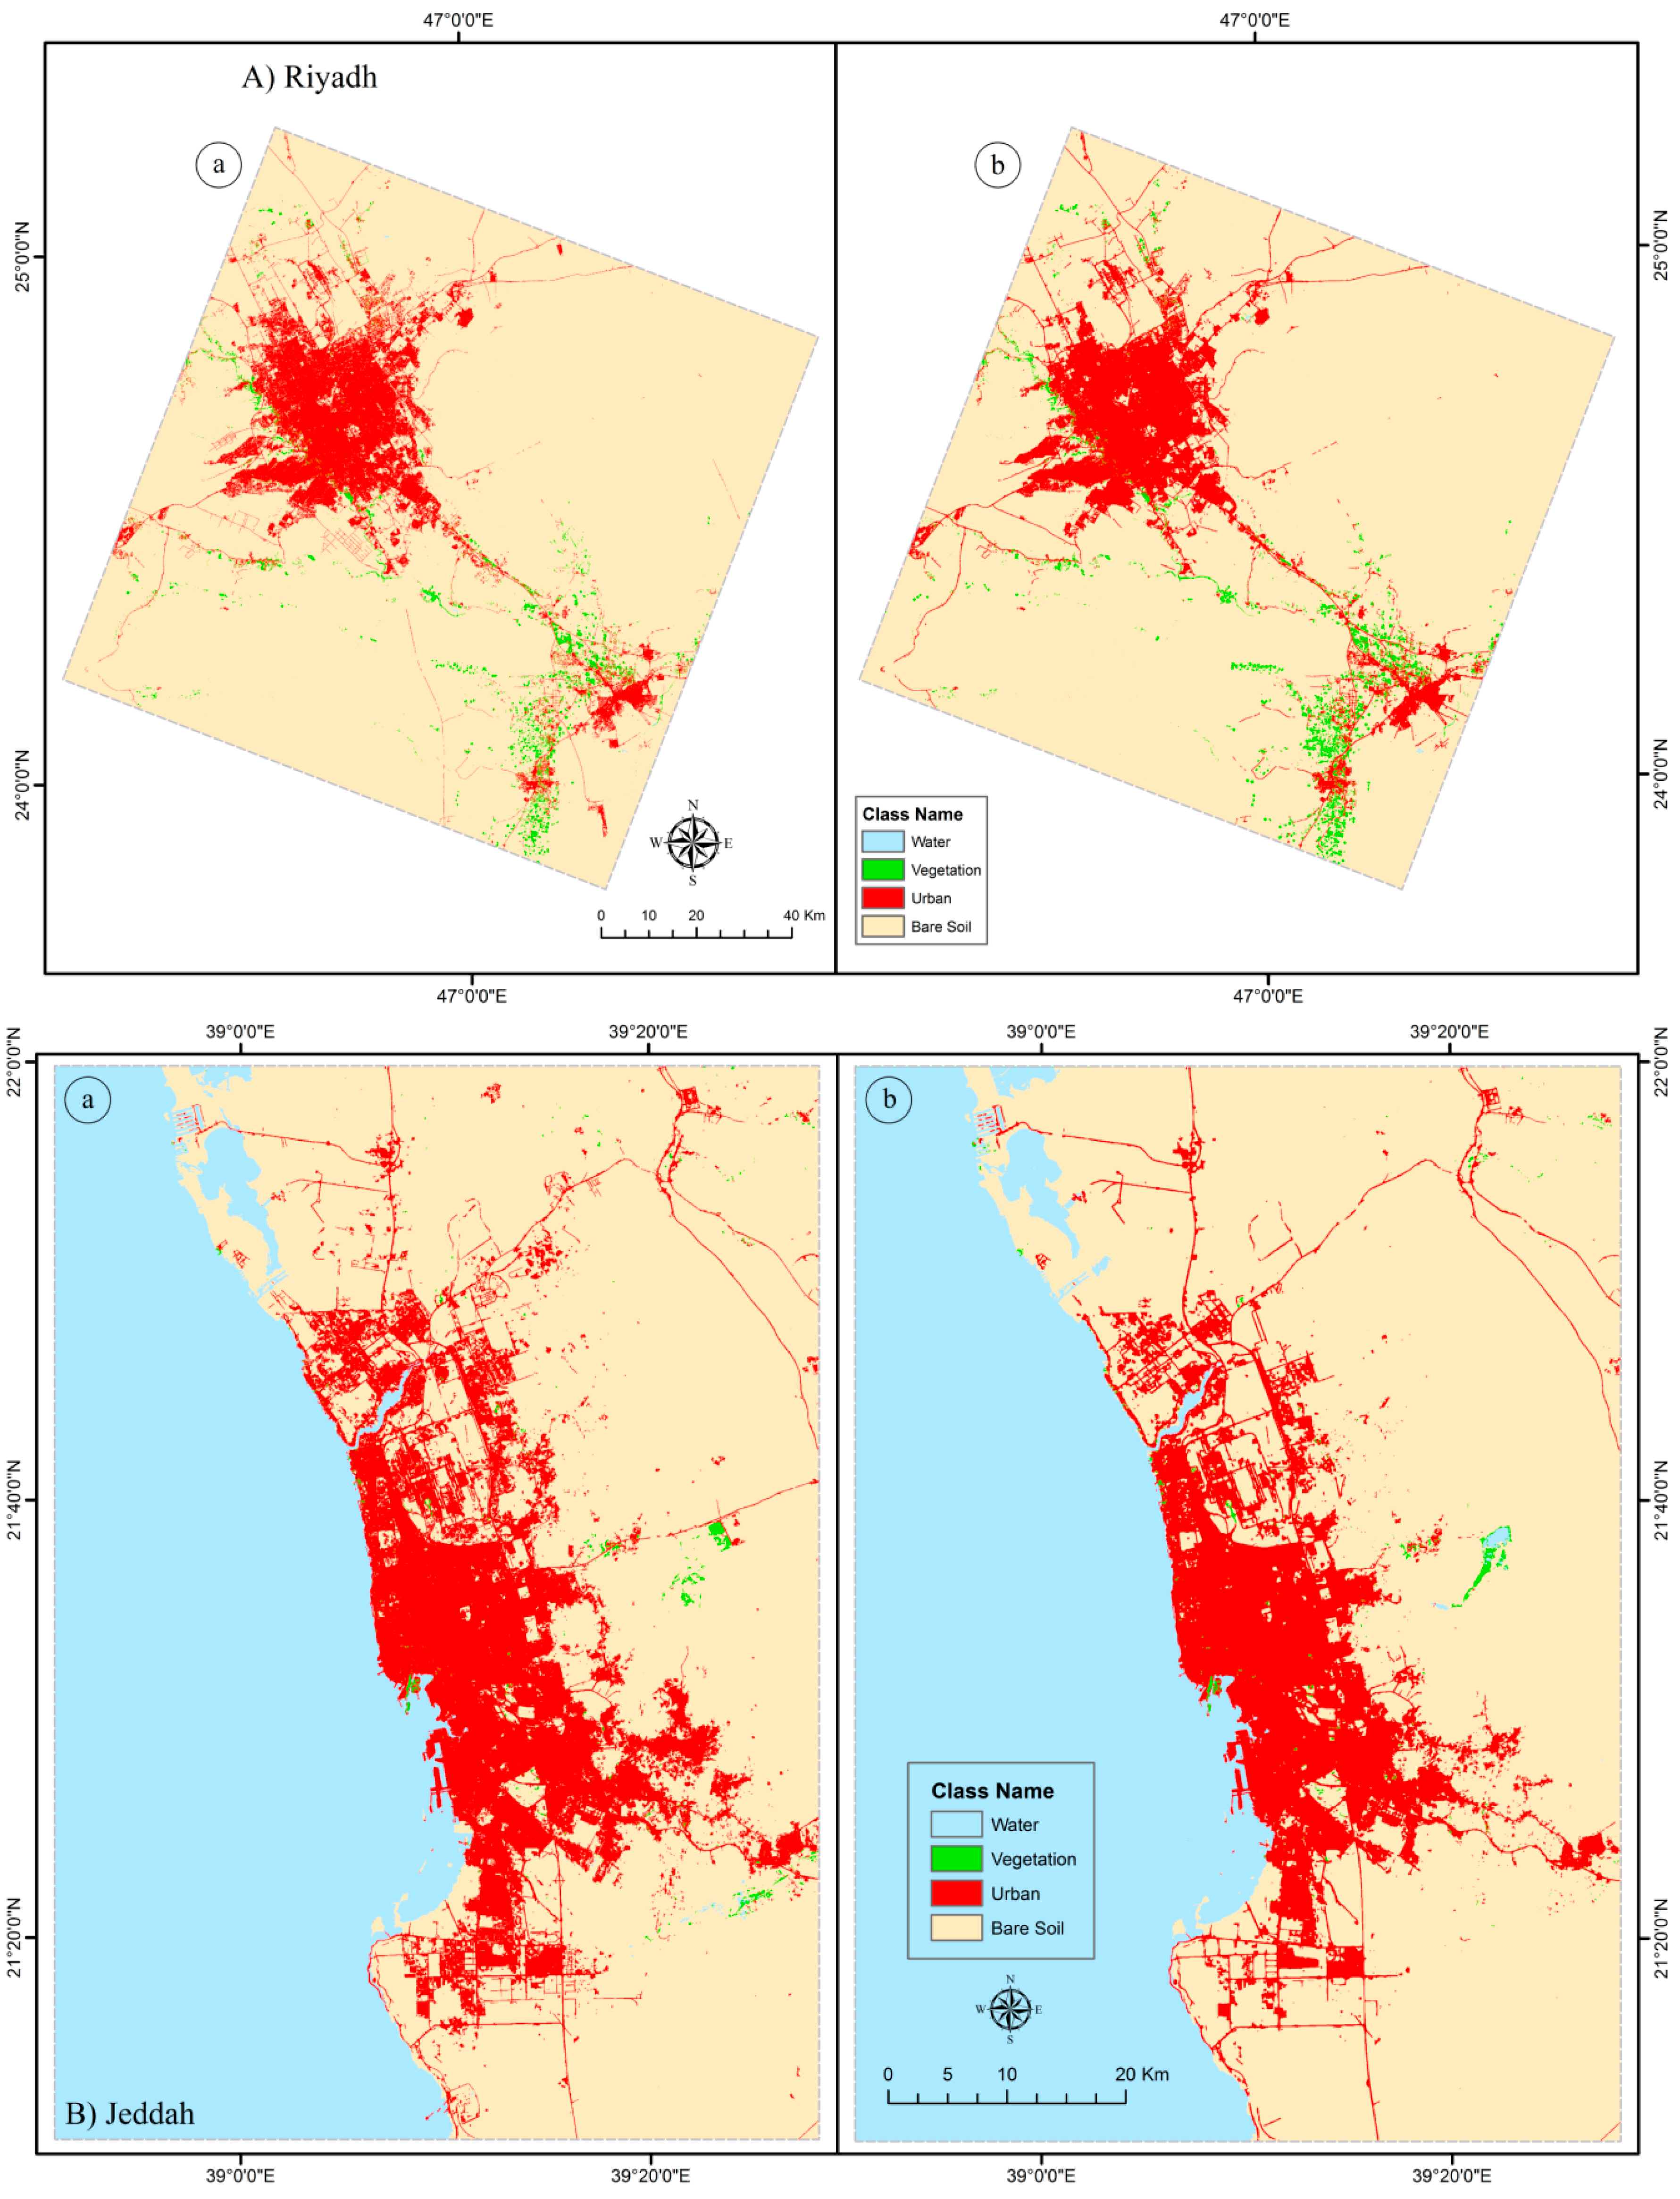
4.5. Simulating the 2024 and 2034 Land-Cover Changes
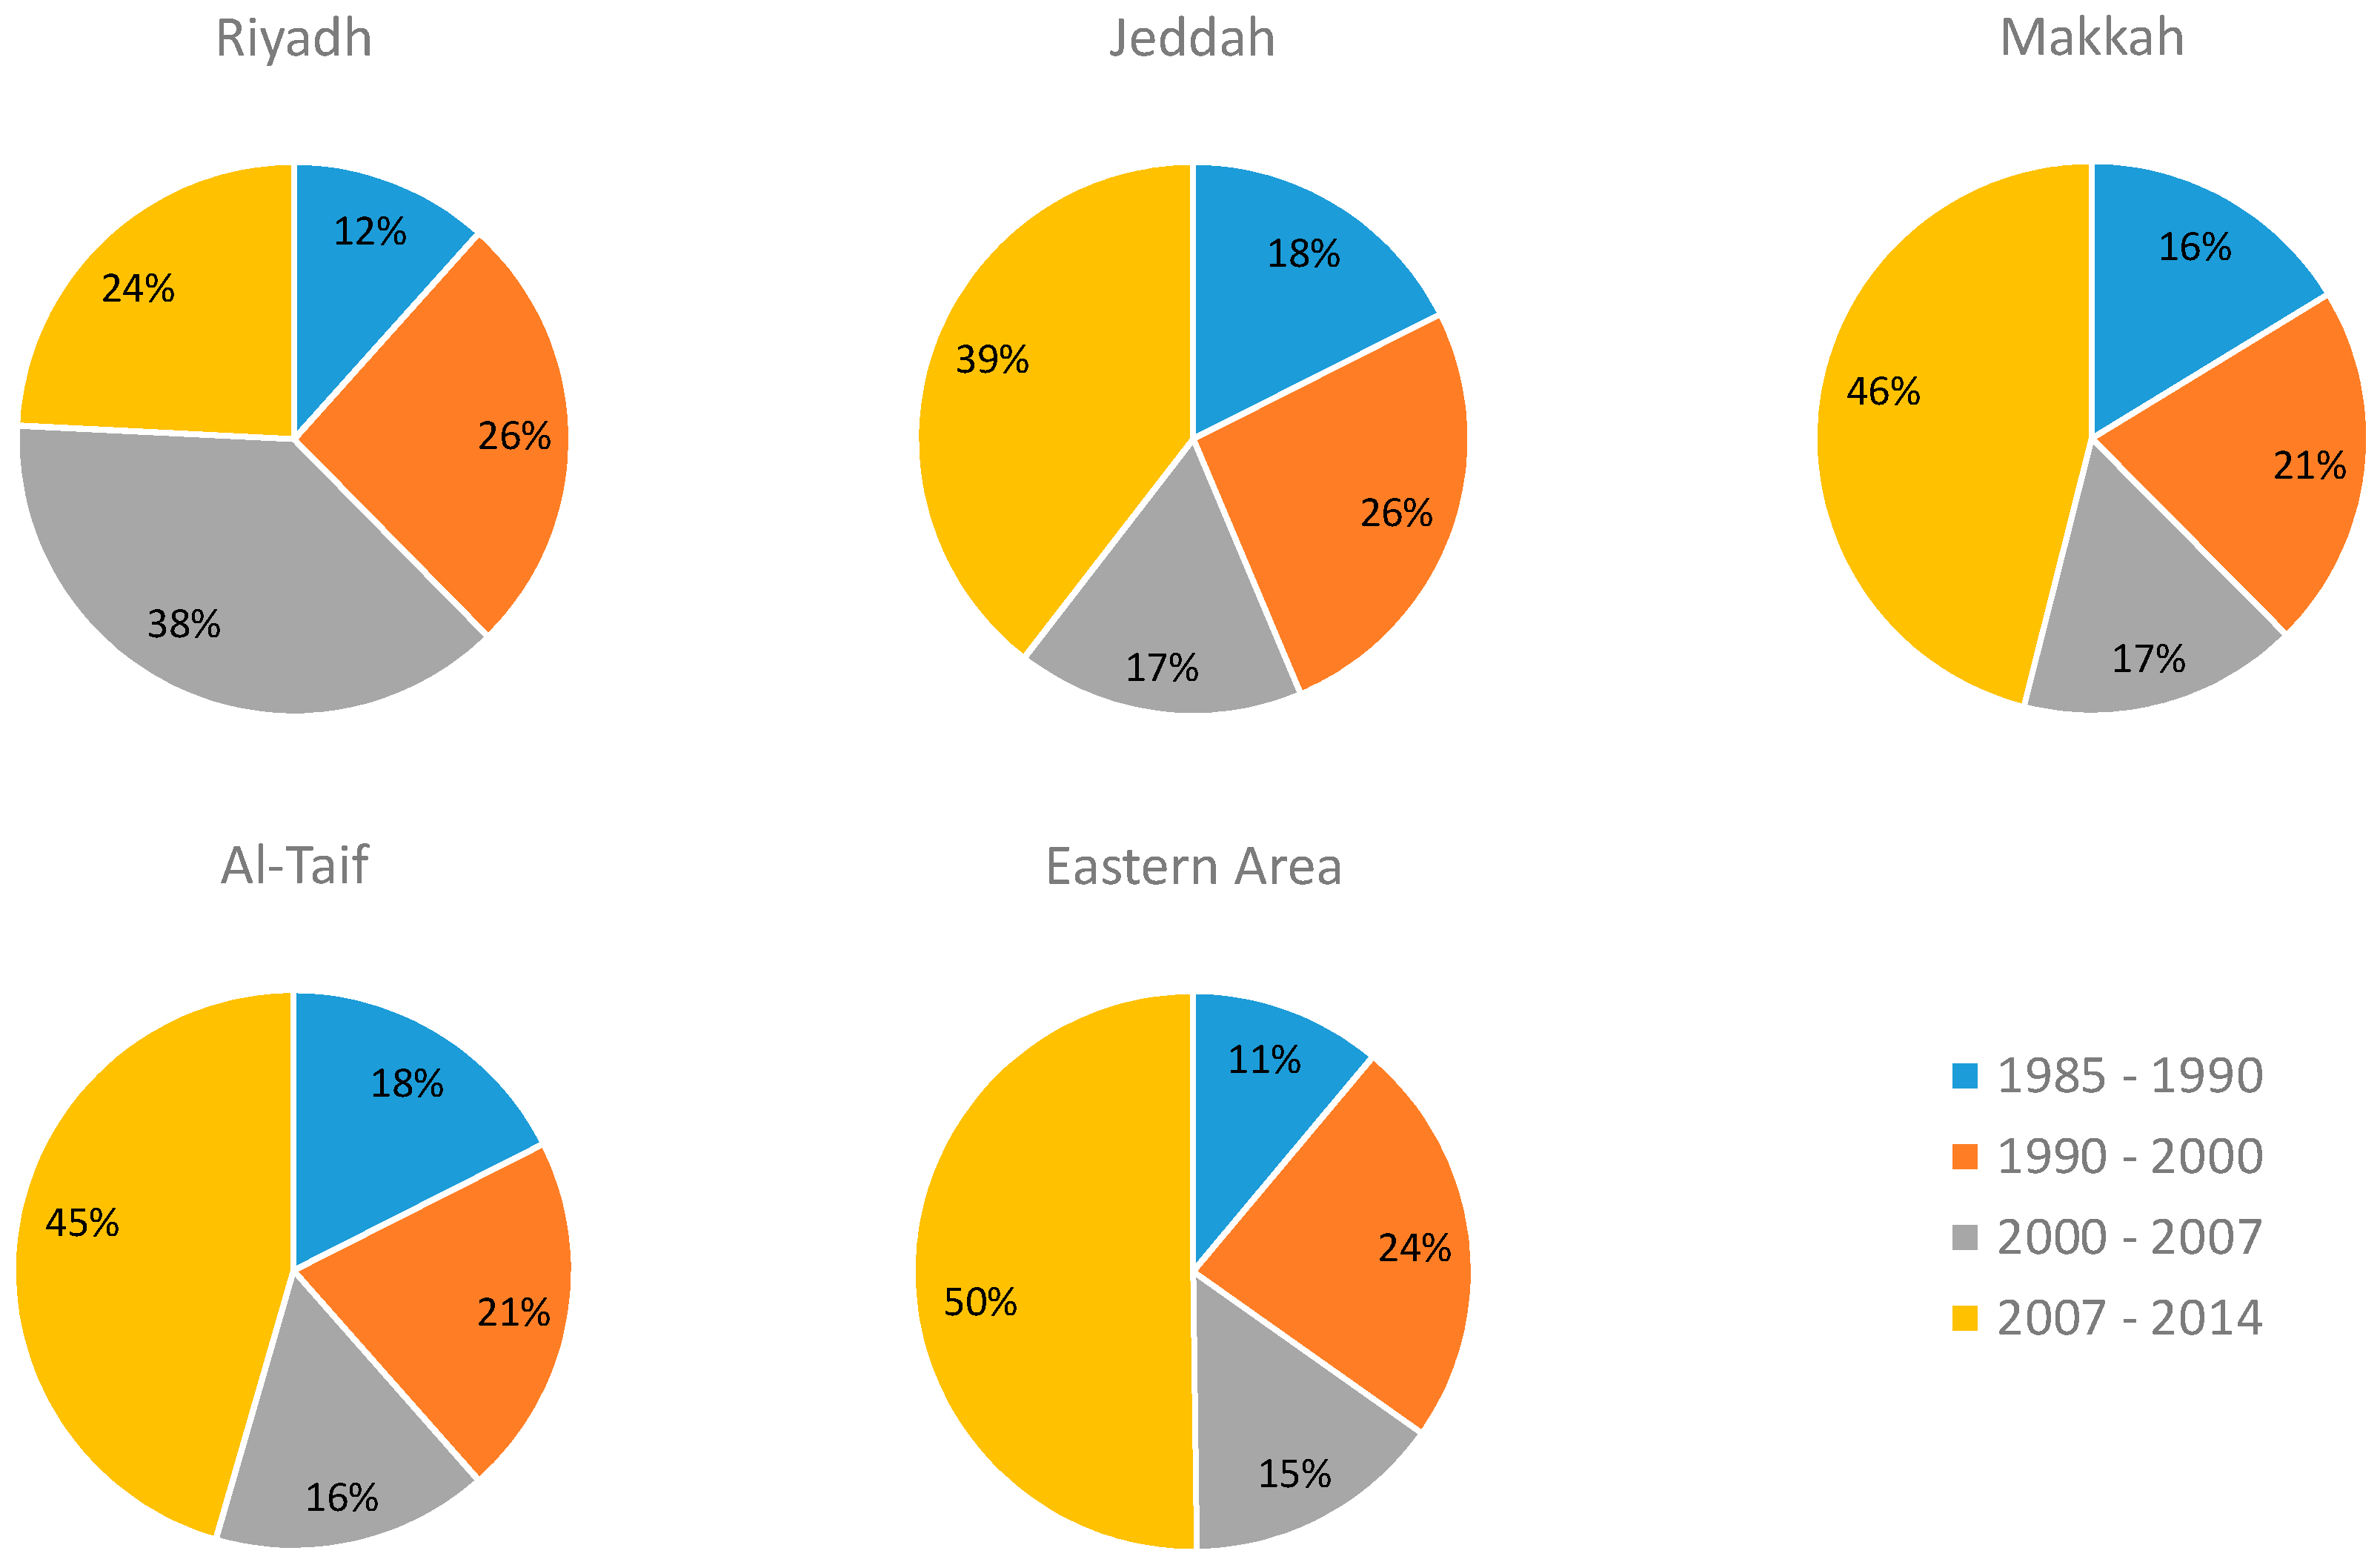
4.6. Urban LULC Quantification
5. Discussion
6. Conclusions
Author Contributions
Conflicts of Interest
References
- Alberti, M. The effects of urban patterns on ecosystem function. Int. Reg. Sci. Rev. 2005, 28, 168–192. [Google Scholar] [CrossRef]
- Guan, D.; Li, H.; Inohae, T.; Su, W.; Nagaie, T.; Hokao, K. Modeling urban land use change by the integration of cellular automaton and Markov model. Ecol. Model. 2011, 222, 3761–3772. [Google Scholar] [CrossRef]
- United Nations. World Urbanization Prospects: The 2011 Revision. United Nations, Department of Economic and Social Affairs; Population Division; United Nations: New York, NY, USA, 2012. [Google Scholar]
- Grimm, N.B.; Faeth, S.H.; Golubiewski, N.E.; Redman, C.L.; Wu, J.; Bai, X.; Briggs, J.M. Global change and the ecology of cities. Science 2008, 319, 756–760. [Google Scholar] [CrossRef] [PubMed]
- Scheffers, B.R.; Paszkowski, C.A. The effects of urbanization on North American amphibian species: Identifying new directions for urban conservation. Urban Ecosyst. 2012, 15, 133–147. [Google Scholar] [CrossRef]
- Guderyahn, L.B.; Smithers, A.P.; Mims, M.C. Assessing habitat requirements of pond-breeding amphibians in a highly urbanized landscape: Implications for management. Urban Ecosyst. 2016. [Google Scholar] [CrossRef]
- Zang, S.; Wu, C.; Liu, H.; Na, X. Impact of urbanization on natural ecosystem service values: A comparative study. Environ. Monit. Assess. 2011, 179, 575–588. [Google Scholar] [CrossRef] [PubMed]
- Rogan, J.; Chen, D. Remote sensing technology for mapping and monitoring land-cover and land-use change. Prog. Plan. 2004, 61, 301–325. [Google Scholar] [CrossRef]
- Gómez, C.; White, J.C.; Wulder, M.A. Optical remotely sensed time series data for land cover classification: A review. ISPRS J. Photogramm. Remote Sens. 2016, 116, 55–72. [Google Scholar] [CrossRef]
- Chan, J.C.; Chan, K.; Yeh, A.G. Detecting the nature of change in an urban environment: A comparison of machine learning algorithms. Photogramm. Eng. Remote Sens. 2001, 67, 213–226. [Google Scholar]
- Schneider, A. Monitoring land cover change in urban and peri-urban areas using dense time stacks of Landsat satellite data and a data mining approach. Remote Sens. Environ. 2012, 124, 689–704. [Google Scholar] [CrossRef]
- Bhatta, B. Analysis of urban growth pattern using remote sensing and GIS: A case study of Kolkata, India. Int. J. Remote Sens. 2009, 30, 4733–4746. [Google Scholar] [CrossRef]
- Tv, R.; Aithal, B.H.; Sanna, D.D. Insights to urban dynamics through landscape spatial pattern analysis. Int. J. Appl. Earth Obs. Geoinf. 2012, 18, 329–343. [Google Scholar] [CrossRef]
- Song, X.; Sexton, J.O.; Huang, C.; Channan, S.; Townshend, J.R. Characterizing the magnitude, timing and duration of urban growth from time series of Landsat-based estimates of impervious cover. Remote Sens. Environ. 2016, 175, 1–13. [Google Scholar] [CrossRef]
- Rahman, M. Detection of land use/land cover changes and urban sprawl in Al-Khobar, Saudi Arabia: An analysis of multi-temporal remote sensing data. ISPRS Int. J. Geo-Inf. 2016, 5, 15. [Google Scholar] [CrossRef]
- Pellikka, P.; Alshaikh, A.Y. Remote sensing of the decrease of juniper woodlands in the mountains of southwestern Saudi Arabia—Reasons and consequences. Arab. J. Geosci. 2016, 9, 1–12. [Google Scholar] [CrossRef]
- Sohl, T.; Sleeter, B. Role of remote sensing for land-use and land-cover change modeling. In Remote Sensing of Land Use and Land Cover; CRC Press: Boca Raton, FL, USA, 2012; pp. 225–240. [Google Scholar]
- Singh, A. Review article digital change detection techniques using remotely-sensed data. Int. J. Remote Sens. 1989, 10, 989–1003. [Google Scholar] [CrossRef]
- Lu, D.; Mausel, P.; Brondízio, E.; Moran, E. Change detection techniques. Int. J. Remote Sens. 2004, 25, 2365–2401. [Google Scholar] [CrossRef]
- Alqurashi, A.F.; Kumar, L. Investigating the use of remote sensing and GIS techniques to detect land use and land cover change: A review. Adv. Remote Sens. 2013, 2, 193–204. [Google Scholar] [CrossRef]
- Blaschke, T. Object based image analysis for remote sensing. ISPRS J. Photogramm. Remote Sens. 2010, 65, 2–16. [Google Scholar] [CrossRef]
- Myint, S.W.; Gober, P.; Brazel, A.; Grossman-Clarke, S.; Weng, Q. Per-pixel vs. Object-based classification of urban land cover extraction using high spatial resolution imagery. Remote Sens. Environ. 2011, 115, 1145–1161. [Google Scholar] [CrossRef]
- Yu, W.; Zhou, W.; Qian, Y.; Yan, J. A new approach for land cover classification and change analysis: Integrating backdating and an object-based method. Remote Sens. Environ. 2016, 177, 37–47. [Google Scholar] [CrossRef]
- Hansen, M.C.; Loveland, T.R. A review of large area monitoring of land cover change using Landsat data. Remote Sens. Environ. 2012, 122, 66–74. [Google Scholar] [CrossRef]
- Hussain, M.; Chen, D.; Cheng, A.; Wei, H.; Stanley, D. Change detection from remotely sensed images: From pixel-based to object-based approaches. ISPRS J. Photogramm. Remote Sens. 2013, 80, 91–106. [Google Scholar] [CrossRef]
- Taubenböck, H.; Esch, T.; Felbier, A.; Wiesner, M.; Roth, A.; Dech, S. Monitoring urbanization in mega cities from space. Remote Sens. Environ. 2012, 117, 162–176. [Google Scholar] [CrossRef]
- Platt, R.V.; Ogra, M.V.; Badola, R.; Hussain, S.A. Conservation-induced resettlement as a driver of land cover change in India: An object-based trend analysis. Appl. Geogr. 2016, 69, 75–86. [Google Scholar] [CrossRef]
- Mas, J.; Kolb, M.; Paegelow, M.; Camacho Olmedo, M.T.; Houet, T. Inductive pattern-based land use/cover change models: A comparison of four software packages. Environ. Model. Softw. 2014, 51, 94–111. [Google Scholar] [CrossRef]
- Ahmed, B.; Kamruzzaman, M.; Zhu, X.; Rahman, M.; Choi, K. Simulating land cover changes and their impacts on land surface temperature in Dhaka, Bangladesh. Remote Sens. 2013, 5, 5969–5998. [Google Scholar] [CrossRef]
- Liao, J.; Tang, L.; Shao, G.; Su, X.; Chen, D.; Xu, T. Incorporation of extended neighborhood mechanisms and its impact on urban land-use cellular automata simulations. Environ. Model. Softw. 2016, 75, 163–175. [Google Scholar] [CrossRef]
- Wu, F. Calibration of stochastic cellular automata: The application to rural-urban land conversions. Int. J. Geogr. Inf. Sci. 2002, 16, 795–818. [Google Scholar] [CrossRef]
- Hu, Z.; Lo, C.P. Modeling urban growth in Atlanta using logistic regression. Comput. Environ. Urban Syst. 2007, 31, 667–688. [Google Scholar] [CrossRef]
- Gong, J.; Liu, Y.; Xia, B.; Zhao, G. Urban ecological security assessment and forecasting, based on a cellular automata model: A case study of Guangzhou, China. Ecol. Model. 2009, 220, 3612–3620. [Google Scholar] [CrossRef]
- Luo, J.; Wei, Y.H.D. Modeling spatial variations of urban growth patterns in Chinese cities: The case of Nanjing. Landsc. Urban Plan. 2009, 91, 51–64. [Google Scholar] [CrossRef]
- Myint, S.W.; Jain, J.; Lukinbeal, C.; Lara-Valencia, F. Simulating urban growth on the US-Mexico border: Nogales, Arizona, and Nogales, Sonora. Can. J. Remote Sens. 2010, 36, 166–184. [Google Scholar] [CrossRef]
- Aljoufie, M.; Zuidgeest, M.; Brussel, M.; van Vliet, J.; van Maarseveen, M. A cellular automata-based land use and transport interaction model applied to Jeddah, Saudi Arabia. Landsc. Urban Plan. 2013, 112, 89–99. [Google Scholar] [CrossRef]
- Shafizadeh M., H.; Helbich, M. Spatiotemporal variability of urban growth factors: A global and local perspective on the megacity of Mumbai. Int. J. Appl. Earth Obs. Geoinf. 2015, 35, 187–198. [Google Scholar] [CrossRef]
- Alqurashi, A.F.; Kumar, L.; Al-Ghamdi, K.A. Spatiotemporal modeling of urban growth predictions based on driving force factors in five Saudi Arabian cities. ISPRS Int. J. Geo-Inf. 2016, 5, 139. [Google Scholar] [CrossRef]
- Ahmed, B.; Ahmed, R. Modeling urban land cover growth dynamics using multi‑temporal satellite images: A case study of Dhaka, Bangladesh. ISPRS Int. J. Geo-Inf. 2012, 1, 3–31. [Google Scholar] [CrossRef]
- Shafizadeh M., H.; Helbich, M. Spatiotemporal urbanization processes in the megacity of Mumbai, India: A Markov chains-cellular automata urban growth model. Appl. Geogr. 2013, 40, 140–149. [Google Scholar] [CrossRef]
- Ozturk, D. Urban growth simulation of Atakum (Samsun, Turkey) using cellular automata-Markov chain and multi-layer perceptron-markov chain models. Remote Sens. 2015, 7, 5918–5950. [Google Scholar] [CrossRef]
- Weng, Q. Land use change analysis in the Zhujiang Delta of China using satellite remote rensing, GIS and stochastic modelling. J. Environ. Manag. 2002, 64, 273–284. [Google Scholar] [CrossRef]
- Sinha, P.; Kumar, L. Markov land cover change modeling using pairs of time-series satellite images. Photogramm. Eng. Remote Sens. 2013, 79, 1037–1051. [Google Scholar] [CrossRef]
- Lo, C.; Yang, X. Drivers of land-use/land-cover changes and dynamic modeling for the Atlanta, Georgia metropolitan area. Photogramm. Eng. Remote Sens. 2002, 68, 1073–1082. [Google Scholar]
- White, R.; Engelen, G. Cellular automata as the basis of integrated dynamic regional modelling. Environ. Plan. B Plan. Des. 1997, 24, 235–246. [Google Scholar] [CrossRef]
- He, C.; Okada, N.; Zhang, Q.; Shi, P.; Li, J. Modelling dynamic urban expansion processes incorporating a potential model with cellular automata. Landsc. Urban Plan. 2008, 86, 79–91. [Google Scholar] [CrossRef]
- Alqurashi, A.F.; Kumar, L. Land use and land cover change detection in the Saudi Arabian desert cities of Makkah and Al-Taif using satellite data. Adv. Remote Sens. 2014, 3, 106–119. [Google Scholar] [CrossRef]
- Al-Ahmadi, K.; See, L.; Heppenstall, A.; Hogg, J. Calibration of a fuzzy cellular automata model of urban dynamics in Saudi Arabia. Ecol. Complex. 2009, 6, 80–101. [Google Scholar] [CrossRef]
- Aljoufie, M. Toward integrated land use and transport planning in fast-growing cities: The case of Jeddah, Saudi Arabia. Habitat Int. 2014, 41, 205–215. [Google Scholar] [CrossRef]
- Baatz, M.; Schäpe, A. Multiresolution segmentation: An optimization approach for high quality multi-scale image segmentation. Angew. Geogr. Inf. 2000, 58, 12–23. [Google Scholar]
- Mathieu, R.; Aryal, J.; Chong, A. Object-based classification of IKONOS imagery for mapping large-scale vegetation communities in urban areas. Sensors 2007, 7, 2860–2880. [Google Scholar] [CrossRef]
- Pu, R.; Landry, S.; Yu, Q. Object-based urban detailed land cover classification with high spatial resolution IKONOS imagery. Int. J. Remote Sens. 2011, 32, 3285–3308. [Google Scholar] [CrossRef]
- Zhou, W.; Troy, A. An object-oriented approach for analysing and characterizing urban landscape at the parcel level. Int. J. Remote Sens. 2008, 29, 3119–3135. [Google Scholar] [CrossRef]
- Zhou, W.; Troy, A.; Grove, M. Object-based land cover classification and change analysis in the Baltimore metropolitan area using multitemporal high resolution remote sensing data. Sensors 2008, 8, 1613–1636. [Google Scholar] [CrossRef]
- Foody, G.M. Thematic map comparison: Evaluating the statistical significance of differences in classification accuracy. Photogramm. Eng. Remote Sens. 2004, 70, 627–633. [Google Scholar] [CrossRef]
- Foody, G.M. Harshness in image classification accuracy assessment. Int. J. Remote Sens. 2008, 29, 3137–3158. [Google Scholar] [CrossRef]
- Sinha, P.; Kumar, L. Independent two-step thresholding of binary images in inter-annual land cover change/no-change identification. ISPRS J. Photogramm. Remote Sens. 2013, 81, 31–43. [Google Scholar] [CrossRef]
- Sinha, P.; Kumar, L.; Reid, N. Rank-based methods for selection of landscape metrics for land cover pattern change detection. Remote Sens. 2016, 8. [Google Scholar] [CrossRef]
- López, E.; Bocco, G.; Mendoza, M.; Duhau, E. Predicting land-cover and land-use change in the urban fringe: A case in Morelia city, Mexico. Landsc. Urban Plan. 2001, 55, 271–285. [Google Scholar] [CrossRef]
- Eastman, J.R. Idrisi Andes Guide to GIS and Image Processing; Clark University: Worcester, UK, 2006. [Google Scholar]
- United States Geological Survey (USGS), SRTM Data. Avaliable online: http://earthexplorer.usgs.gov/ (accessed on 16 May 2016).
- Mirza, M.; Dawod, G.; Al-Ghamdi, K. Accuracy and relevance of digital elevation models for geomatics applications-a case study of Makkah municipality, Saudi Arabia. Int. J. Geomat. Geosci. 2011, 1, 803–812. [Google Scholar]
- Eastman, J.R. Multi-criteria evaluation and GIS. Geogr. Inf. Syst. 1999, 1, 493–502. [Google Scholar]
- Pontius, R.G. Quantification error versus location error in comparison of categorical maps. Photogramm. Eng. Remote Sens. 2000, 66, 1011–1016. [Google Scholar]
- Pontius, R.G. Statistical methods to partition effects of quantity and location during comparison of categorical maps at multiple resolutions. Photogramm. Eng. Remote Sens. 2002, 68, 1041–1050. [Google Scholar]
- Pontius, R.G.; Millones, M. Death to Kappa: Birth of quantity disagreement and allocation disagreement for accuracy assessment. Int. J. Remote Sens. 2011, 32, 4407–4429. [Google Scholar] [CrossRef]
- Pontius, R.G.; Suedmeyer, B. Components of agreement between categorical maps at multiple resolutions. Remote Sens. GIS Accuracy Assess. 2004, 233–251. [Google Scholar] [CrossRef]
- Selim, M.E. Environmental security in the Arab World. In Facing Global Environmental Change: Environmental, Human, Energy, Food, Health and Water Security Concepts; Brauch, H.G., Spring, Ú.O., Grin, J., Mesjasz, C., Kameri-Mbote, P., Behera, N.C., Chourou, B., Krummenacher, H., Eds.; Springer: Berlin/Heidelberg, Germany, 2009; pp. 843–853. [Google Scholar]
- Rahman, M.; Aldosary, A.; Nahiduzzaman, K.; Reza, I. Vulnerability of flash flooding in Riyadh, Saudi Arabia. Natl. Hazards 2016, 1–24. [Google Scholar] [CrossRef]
- Alamri, Y. Rains and floods in Saudi Arabia. Crying of the sky or of the people? Saudi Med. J. 2011, 32, 311–313. [Google Scholar] [PubMed]
- Dewan, A.; Yamaguchi, Y. Land use and land cover change in greater Dhaka, Bangladesh: Using remote sensing to promote sustainable urbanization. Appl. Geogr. 2009, 29, 390–401. [Google Scholar] [CrossRef]
- Saudi-Arabia-Vision-2030. Vision 2030, the Kingdom of Saudi Arabia; The Council of Economic and Development Affairs: Riyadh, Saudi Arabia, 2016. [Google Scholar]
- McDonald, J.F. Fundamentals of Urban Economics; Prentice Hall: Upper Saddle River, NJ, USA, 1997. [Google Scholar]
- Fang, S.; Wente, S.; Gertner, Z.G.; Wang, G.; Anderson, A. Uncertainty analysis of predicted disturbance from off-road vehicular traffic in complex landscapes at fort hood. Environ. Manag. 2002, 30, 199–208. [Google Scholar] [CrossRef] [PubMed]
- Carmel, Y.; Dean, D.J. Performance of a spatio-temporal error model for raster datasets under complex error patterns. Int. J. Remote Sens. 2004, 25, 5283–5296. [Google Scholar] [CrossRef]


| City | Population (M) | Importance |
|---|---|---|
| Riyadh | 6.7 | Capital city |
| Jeddah | 4 | Commercial hub nationally |
| Makkah | 2 | Pilgrimage and holy places |
| Al-Taif | 1.1 | Tourism sector |
| Eastern Area | 2.8 | Oil production industry |
| City | Sensor | Path/Row | Date |
|---|---|---|---|
| Eastern Area | TM | 164/41-42 | (15 June 1985), (31 July 1990) |
| ETM+ | (6 July 2000), (6 July 2007) | ||
| OLI | (2 August 2014) | ||
| Riyadh | TM | 165-166/43 | (13–20 January 1985), (14–15 August 1990), (18–25 August 2000) |
| ETM+ | (29–20 July 2007) | ||
| OLI | (9–16 August 2014) | ||
| Makkah & Al-Taif | TM | 169/45 | (30 March 1985), (27 August 1990) |
| ETM+ | (6 August 2000), (5 August 2007) | ||
| OLI | (5 August 2014) | ||
| Jeddah | TM | 170/45 | (9 June 1985), (11 September 1990) |
| ETM+ | (1 November 2000), (17 August 2007) | ||
| OLI | (29 September 2014) |
| Class | Definition |
|---|---|
| Water | Seas, lakes, dames and stream surfaces |
| Vegetation | Natural vegetation, crop fields and green spaces |
| Bare Soil | Sand desert, bare rocky and mountains |
| Urban | Built-up lands, human-constructed elements and transportation |
| Image | Overall Accuracy | Kappa Coefficient | ||||||||
|---|---|---|---|---|---|---|---|---|---|---|
| 1985 | 1990 | 2000 | 2007 | 2014 | 1985 | 1990 | 2000 | 2007 | 2014 | |
| Riyadh | 87.5 | 94.5 | 90.8 | 88.9 | 92.8 | 0.82 | 0.92 | 0.87 | 0.85 | 0.90 |
| Jeddah | 92.4 | 90.1 | 85.6 | 86.2 | 94.9 | 0.88 | 0.83 | 0.75 | 0.77 | 0.92 |
| Makkah | 87.2 | 85.9 | 87.4 | 86.7 | 83.8 | 0.77 | 0.80 | 0.82 | 0.81 | 0.73 |
| Al-Taif | 89.1 | 89.6 | 88.9 | 84.5 | 81.9 | 0.81 | 0.84 | 0.83 | 0.77 | 0.73 |
| Eastern Area | 96.2 | 92.3 | 88.6 | 89.2 | 89.3 | 0.94 | 0.87 | 0.82 | 0.84 | 0.83 |
| Riyadh | Jeddah | Makkah | Al-Taif | Eastern Area | ||||||||||||||||||||||||||
|---|---|---|---|---|---|---|---|---|---|---|---|---|---|---|---|---|---|---|---|---|---|---|---|---|---|---|---|---|---|---|
| 1990 | 1990 | 1990 | 1990 | 1990 | ||||||||||||||||||||||||||
| LULC | W | VC | BS | UA | LULC | W | VC | BS | UA | LULC | W | VC | BS | UA | LULC | W | VC | BS | UA | LULC | W | VC | BS | UA | ||||||
| 1985 | W | 0.29 | 0.04 | 0.66 | 0.01 | 1985 | W | 1.00 | 0.00 | 0.00 | 0.00 | 1985 | W | 0.00 | 0.01 | 0.74 | 0.25 | 1985 | W | 0.16 | 0.46 | 0.36 | 0.02 | 1985 | W | 0.99 | 0.00 | 0.01 | 0.00 | |
| VC | 0.00 | 0.06 | 0.93 | 0.01 | VC | 0.01 | 0.16 | 0.42 | 0.40 | VC | 0.00 | 0.07 | 0.86 | 0.07 | VC | 0.00 | 0.25 | 0.68 | 0.07 | VC | 0.01 | 0.58 | 0.30 | 0.11 | ||||||
| BS | 0.00 | 0.01 | 0.98 | 0.02 | BS | 0.01 | 0.00 | 0.94 | 0.05 | BS | 0.00 | 0.00 | 0.94 | 0.06 | BS | 0.00 | 0.01 | 0.93 | 0.06 | BS | 0.05 | 0.01 | 0.91 | 0.04 | ||||||
| UA | 0.00 | 0.00 | 0.00 | 1.00 | UA | 0.00 | 0.00 | 0.00 | 1.00 | UA | 0.00 | 0.00 | 0.00 | 1.00 | UA | 0.00 | 0.00 | 0.00 | 1.00 | UA | 0.00 | 0.00 | 0.00 | 1.00 | ||||||
| 2000 | 2000 | 2000 | 2000 | 2000 | ||||||||||||||||||||||||||
| LULC | W | VC | BS | UA | LULC | W | VC | BS | UA | LULC | W | VC | BS | UA | LULC | W | VC | BS | UA | LULC | W | VC | BS | UA | ||||||
| 1990 | W | 0.55 | 0.30 | 0.13 | 0.02 | 1990 | W | 0.99 | 0.00 | 0.01 | 0.00 | 1990 | W | 0.00 | 0.00 | 0.00 | 1.00 | 1990 | W | 0.20 | 0.17 | 0.57 | 0.06 | 1990 | W | 0.99 | 0.00 | 0.01 | 0.00 | |
| VC | 0.00 | 0.46 | 0.52 | 0.02 | VC | 0.01 | 0.68 | 0.16 | 0.15 | VC | 0.00 | 0.39 | 0.53 | 0.07 | VC | 0.00 | 0.72 | 0.23 | 0.04 | VC | 0.00 | 0.63 | 0.27 | 0.11 | ||||||
| BS | 0.00 | 0.01 | 0.98 | 0.01 | BS | 0.00 | 0.01 | 0.96 | 0.03 | BS | 0.00 | 0.01 | 0.97 | 0.03 | BS | 0.00 | 0.01 | 0.97 | 0.03 | BS | 0.00 | 0.00 | 0.97 | 0.03 | ||||||
| UA | 0.00 | 0.00 | 0.00 | 1.00 | UA | 0.00 | 0.00 | 0.00 | 1.00 | UA | 0.00 | 0.00 | 0.00 | 1.00 | UA | 0.00 | 0.00 | 0.00 | 1.00 | UA | 0.00 | 0.00 | 0.00 | 1.00 | ||||||
| 2007 | 2007 | 2007 | 2007 | 2007 | ||||||||||||||||||||||||||
| LULC | W | VC | BS | UA | LULC | W | VC | BS | UA | LULC | W | VC | BS | UA | LULC | W | VC | BS | UA | LULC | W | VC | BS | UA | ||||||
| 2000 | W | 0.48 | 0.11 | 0.37 | 0.05 | 2000 | W | 1.00 | 0.00 | 0.00 | 0.00 | 2000 | W | 0.00 | 0.00 | 1.00 | 0.00 | 2000 | W | 0.00 | 0.07 | 0.93 | 0.00 | 2000 | W | 0.99 | 0.00 | 0.00 | 0.00 | |
| VC | 0.00 | 0.58 | 0.39 | 0.03 | VC | 0.00 | 0.24 | 0.62 | 0.14 | VC | 0.00 | 0.43 | 0.44 | 0.14 | VC | 0.00 | 0.47 | 0.49 | 0.04 | VC | 0.00 | 0.61 | 0.29 | 0.09 | ||||||
| BS | 0.00 | 0.01 | 0.96 | 0.03 | BS | 0.00 | 0.00 | 0.97 | 0.03 | BS | 0.00 | 0.00 | 0.96 | 0.03 | BS | 0.00 | 0.01 | 0.96 | 0.03 | BS | 0.01 | 0.01 | 0.95 | 0.03 | ||||||
| UA | 0.00 | 0.00 | 0.00 | 1.00 | UA | 0.00 | 0.00 | 0.00 | 1.00 | UA | 0.00 | 0.00 | 0.00 | 1.00 | UA | 0.00 | 0.00 | 0.00 | 1.00 | UA | 0.00 | 0.00 | 0.00 | 1.00 | ||||||
| 2014 | 2014 | 2014 | 2014 | 2014 | ||||||||||||||||||||||||||
| LULC | W | VC | BS | UA | LULC | W | VC | BS | UA | LULC | W | VC | BS | UA | LULC | W | VC | BS | UA | LULC | W | VC | BS | UA | ||||||
| 2007 | W | 0.24 | 0.01 | 0.62 | 0.14 | 2007 | W | 0.99 | 0.00 | 0.01 | 0.00 | 2007 | W | 0.00 | 0.00 | 0.61 | 0.39 | 2007 | W | 0.00 | 0.00 | 0.32 | 0.68 | 2007 | W | 0.99 | 0.00 | 0.01 | 0.01 | |
| VC | 0.00 | 0.32 | 0.62 | 0.06 | VC | 0.03 | 0.11 | 0.57 | 0.30 | VC | 0.00 | 0.46 | 0.45 | 0.09 | VC | 0.00 | 0.60 | 0.26 | 0.13 | VC | 0.03 | 0.38 | 0.12 | 0.47 | ||||||
| BS | 0.00 | 0.01 | 0.97 | 0.02 | BS | 0.00 | 0.00 | 0.90 | 0.09 | BS | 0.00 | 0.01 | 0.86 | 0.14 | BS | 0.00 | 0.02 | 0.86 | 0.12 | BS | 0.01 | 0.01 | 0.85 | 0.13 | ||||||
| UA | 0.00 | 0.00 | 0.00 | 1.00 | UA | 0.00 | 0.00 | 0.00 | 1.00 | UA | 0.00 | 0.00 | 0.00 | 1.00 | UA | 0.00 | 0.00 | 0.00 | 1.00 | UA | 0.00 | 0.00 | 0.00 | 1.00 | ||||||
| 2024 | 2024 | 2024 | 2024 | 2024 | ||||||||||||||||||||||||||
| LULC | W | VC | BS | UA | LULC | W | VC | BS | UA | LULC | W | VC | BS | UA | LULC | W | VC | BS | UA | LULC | W | VC | BS | UA | ||||||
| 2014 | W | 0.86 | 0.00 | 0.00 | 0.14 | 2014 | W | 1.00 | 0.00 | 0.00 | 0.00 | 2014 | W | 0.60 | 0.00 | 0.00 | 0.40 | 2014 | W | 0.32 | 0.00 | 0.00 | 0.68 | 2014 | W | 0.99 | 0.00 | 0.00 | 0.01 | |
| VC | 0.00 | 0.94 | 0.00 | 0.06 | VC | 0.00 | 0.70 | 0.00 | 0.30 | VC | 0.00 | 0.91 | 0.00 | 0.09 | VC | 0.00 | 0.87 | 0.00 | 0.13 | VC | 0.00 | 0.53 | 0.00 | 0.47 | ||||||
| BS | 0.00 | 0.00 | 0.98 | 0.02 | BS | 0.00 | 0.00 | 0.91 | 0.09 | BS | 0.00 | 0.00 | 0.86 | 0.14 | BS | 0.00 | 0.00 | 0.88 | 0.12 | BS | 0.00 | 0.00 | 0.92 | 0.08 | ||||||
| UA | 0.00 | 0.00 | 0.00 | 1.00 | UA | 0.00 | 0.00 | 0.00 | 1.00 | UA | 0.00 | 0.00 | 0.00 | 1.00 | UA | 0.00 | 0.00 | 0.00 | 1.00 | UA | 0.00 | 0.00 | 0.00 | 1.00 | ||||||
| Year | Riyadh | Jeddah | Makkah | Al-Taif | Eastern Area | |||||
|---|---|---|---|---|---|---|---|---|---|---|
| Area (ha) | (%) | Area (ha) | (%) | Area (ha) | (%) | Area (ha) | (%) | Area (ha) | (%) | |
| 1985 | 50,604.0 | 22.9 | 23,321.9 | 37.8 | 10184.9 | 30.1 | 5173.3 | 54.7 | 33,234.4 | 27.7 |
| 1990 | 62,174.3 | 41.6 | 32,132.4 | 40.8 | 13,252.9 | 30.3 | 8003.3 | 42.3 | 42,444.7 | 46.3 |
| 2000 | 88,041.8 | 43.1 | 45,242.7 | 18.6 | 17,264.5 | 17.8 | 11,390.3 | 22.6 | 62,106.6 | 20.0 |
| 2007 | 125,958.3 | 19.1 | 53,677.3 | 37.0 | 20,345.7 | 42.6 | 13,969.5 | 52.6 | 74,543.3 | 55.9 |
| 2014 | 150,050.0 | 22.3 | 73,526.2 | 35.7 | 29,020.7 | 37.7 | 21,320.0 | 44.3 | 116,203.9 | 28.7 |
| 2024 | 183,503.9 | 17.8 | 99,761.0 | 23.9 | 39,963.5 | 23.6 | 30,755.7 | 26.9 | 149,542.8 | 16.1 |
| 2034 | 216,110.9 | 123,583.5 | 49,393.7 | 39,026.0 | 173,605.5 | |||||
© 2016 by the authors; licensee MDPI, Basel, Switzerland. This article is an open access article distributed under the terms and conditions of the Creative Commons Attribution (CC-BY) license (http://creativecommons.org/licenses/by/4.0/).
Share and Cite
Alqurashi, A.F.; Kumar, L.; Sinha, P. Urban Land Cover Change Modelling Using Time-Series Satellite Images: A Case Study of Urban Growth in Five Cities of Saudi Arabia. Remote Sens. 2016, 8, 838. https://doi.org/10.3390/rs8100838
Alqurashi AF, Kumar L, Sinha P. Urban Land Cover Change Modelling Using Time-Series Satellite Images: A Case Study of Urban Growth in Five Cities of Saudi Arabia. Remote Sensing. 2016; 8(10):838. https://doi.org/10.3390/rs8100838
Chicago/Turabian StyleAlqurashi, Abdullah F., Lalit Kumar, and Priyakant Sinha. 2016. "Urban Land Cover Change Modelling Using Time-Series Satellite Images: A Case Study of Urban Growth in Five Cities of Saudi Arabia" Remote Sensing 8, no. 10: 838. https://doi.org/10.3390/rs8100838
APA StyleAlqurashi, A. F., Kumar, L., & Sinha, P. (2016). Urban Land Cover Change Modelling Using Time-Series Satellite Images: A Case Study of Urban Growth in Five Cities of Saudi Arabia. Remote Sensing, 8(10), 838. https://doi.org/10.3390/rs8100838