1. Introduction
The MODerate-resolution Imaging Spectroradiometer (MODIS) instruments on board the Terra and Aqua spacecrafts have successfully completed more than 16 and 14 years of on-orbit flight, respectively [
1,
2]. MODIS is a cross-track whiskbroom scanning radiometer, which has a 360 degree rotating double-sided scan mirror, with several onboard calibrators (OBCs). Each MODIS instrument remotely collects information in 36 spectral bands, among which 14 are thermal emissive bands (TEBs) covering the spectral region from about 3.7 µm to 14.4 µm [
3]. The calibration for a MODIS TEB applies a quadratic approximation to relate the at-sensor-aperture radiance and the background-subtracted instrument response. The calibration coefficients, of the quadratic form, are calibrated on-orbit using an onboard black body (BB), one of the OBCs [
4]. Among the TEBs, the four long-wave infrared (LWIR) photovoltaic (PV) bands, bands 27–30 (6.72–9.73 μm), are located on the LWIR focal plane assembly (FPA), which is one of the four FPAs [
3]. These bands are primarily used in measuring water vapor distribution, volcanic cloud components, the cloud properties, stratospheric and tropospheric ozone concentrations, among others.
Recent investigations into the four LWIR PV bands in Terra MODIS by Sun et al. [
5,
6,
7,
8,
9,
10,
11] have discovered severe contamination due to crosstalk of signals among themselves, and that the crosstalk contamination has become more severe in recent years. Central to the discovery of the crosstalk effect is a linear model originally developed to test the existence of the effect prior to any confirmation of the existence of the effect [
5,
6]. A correction algorithm to characterize and mitigate the crosstalk effect also has been developed and implemented [
5,
6,
7,
8,
9,
10,
11]. It is now understood that the crosstalk effect induces unexpected sudden jumps, rapid changes, and strong detector differences in the calibration coefficients derived from the BB calibration. The effect also induces strong striping artifacts and ghost images in the Earth view (EV) products and causes large long-term drifts in the EV brightness temperature (BT). A 6 K downward, 4 K downward, 1.5 K upward, and 2 K upward long-term drift in the EV BT have been determined for bands 27, 28, 29, and 30, respectively [
7,
8,
9,
10]. The crosstalk correction also has been applied to the quarterly BB warm-up–cool-down (WUCD) and the routine scan-based BB calibration as well as the MODIS Level-1B (L1B) EV retrievals for the four LWIR PV bands [
11]. It is shown that the crosstalk correction can successfully remove the anomalous features in the calibration coefficients and restore the accuracy of both the WUCD and the routine BB calibration. In addition, the crosstalk correction can significantly diminish the striping and the ghost images in the EV retrievals and greatly reduce the long-term radiometric drifts, leading to a very stable lifetime trend and rectified MODIS L1B products. Overall, the extensive investigations of the crosstalk effect in Terra MODIS LWIR PV bands have established the linear model and the correction algorithm to be accurate over the entire dynamic range, and are applicable to all levels from instrument calibration to L1B retrieval. In fact, the best-mitigated result requires applying the crosstalk correction to all levels.
The Aqua MODIS LWIR PV bands have also been observed for many years to have anomalous features in the calibration coefficients derived from the BB calibration even though they are relatively smaller compared to those observed in the corresponding Terra MODIS bands [
12,
13]. As similar behaviors observed in Terra MODIS LWIR PV bands have already been identified to be induced by the crosstalk effect, this work examines Aqua MODIS for the existence of its crosstalk contamination as well. Since Aqua MODIS similarly follows an approximate monthly roll maneuver to observe the Moon [
14] in the same way as Terra MODIS, the lunar imagery analysis used to detect crosstalk signal in Terra MODIS [
5,
6] can be identically applied. In this paper, we will clearly show, from the lunar imagery analysis, that non-negligible crosstalk effect exists among the four Aqua LWIR PV bands and that the crosstalk contamination level changes with time. In addition, the effect has become more severe in recent few years. The crosstalk coefficients for these four bands will also be derived. The result will show that the crosstalk effect is significant enough to warrant a serious consideration for the mitigation of the impact in the four Aqua LWIR PV bands.
The rest of the paper is organized as follows. In
Section 2, the crosstalk effect signals and their changes with time for Aqua MODIS LWIR PV bands are demonstrated using lunar images. In
Section 3, the crosstalk correction methodology and the crosstalk characterization algorithm are briefly reviewed. In
Section 4, the crosstalk coefficients are derived from the scheduled lunar observations and the results are discussed. The crosstalk coefficients for each of the LWIR PV bands are compared to those for the corresponding Terra MODIS LWIR PV band. The crosstalk impacts on the four Aqua MODIS LWIR PV bands are estimated.
Section 5 is a brief summary of this analysis.
2. Crosstalk Effect
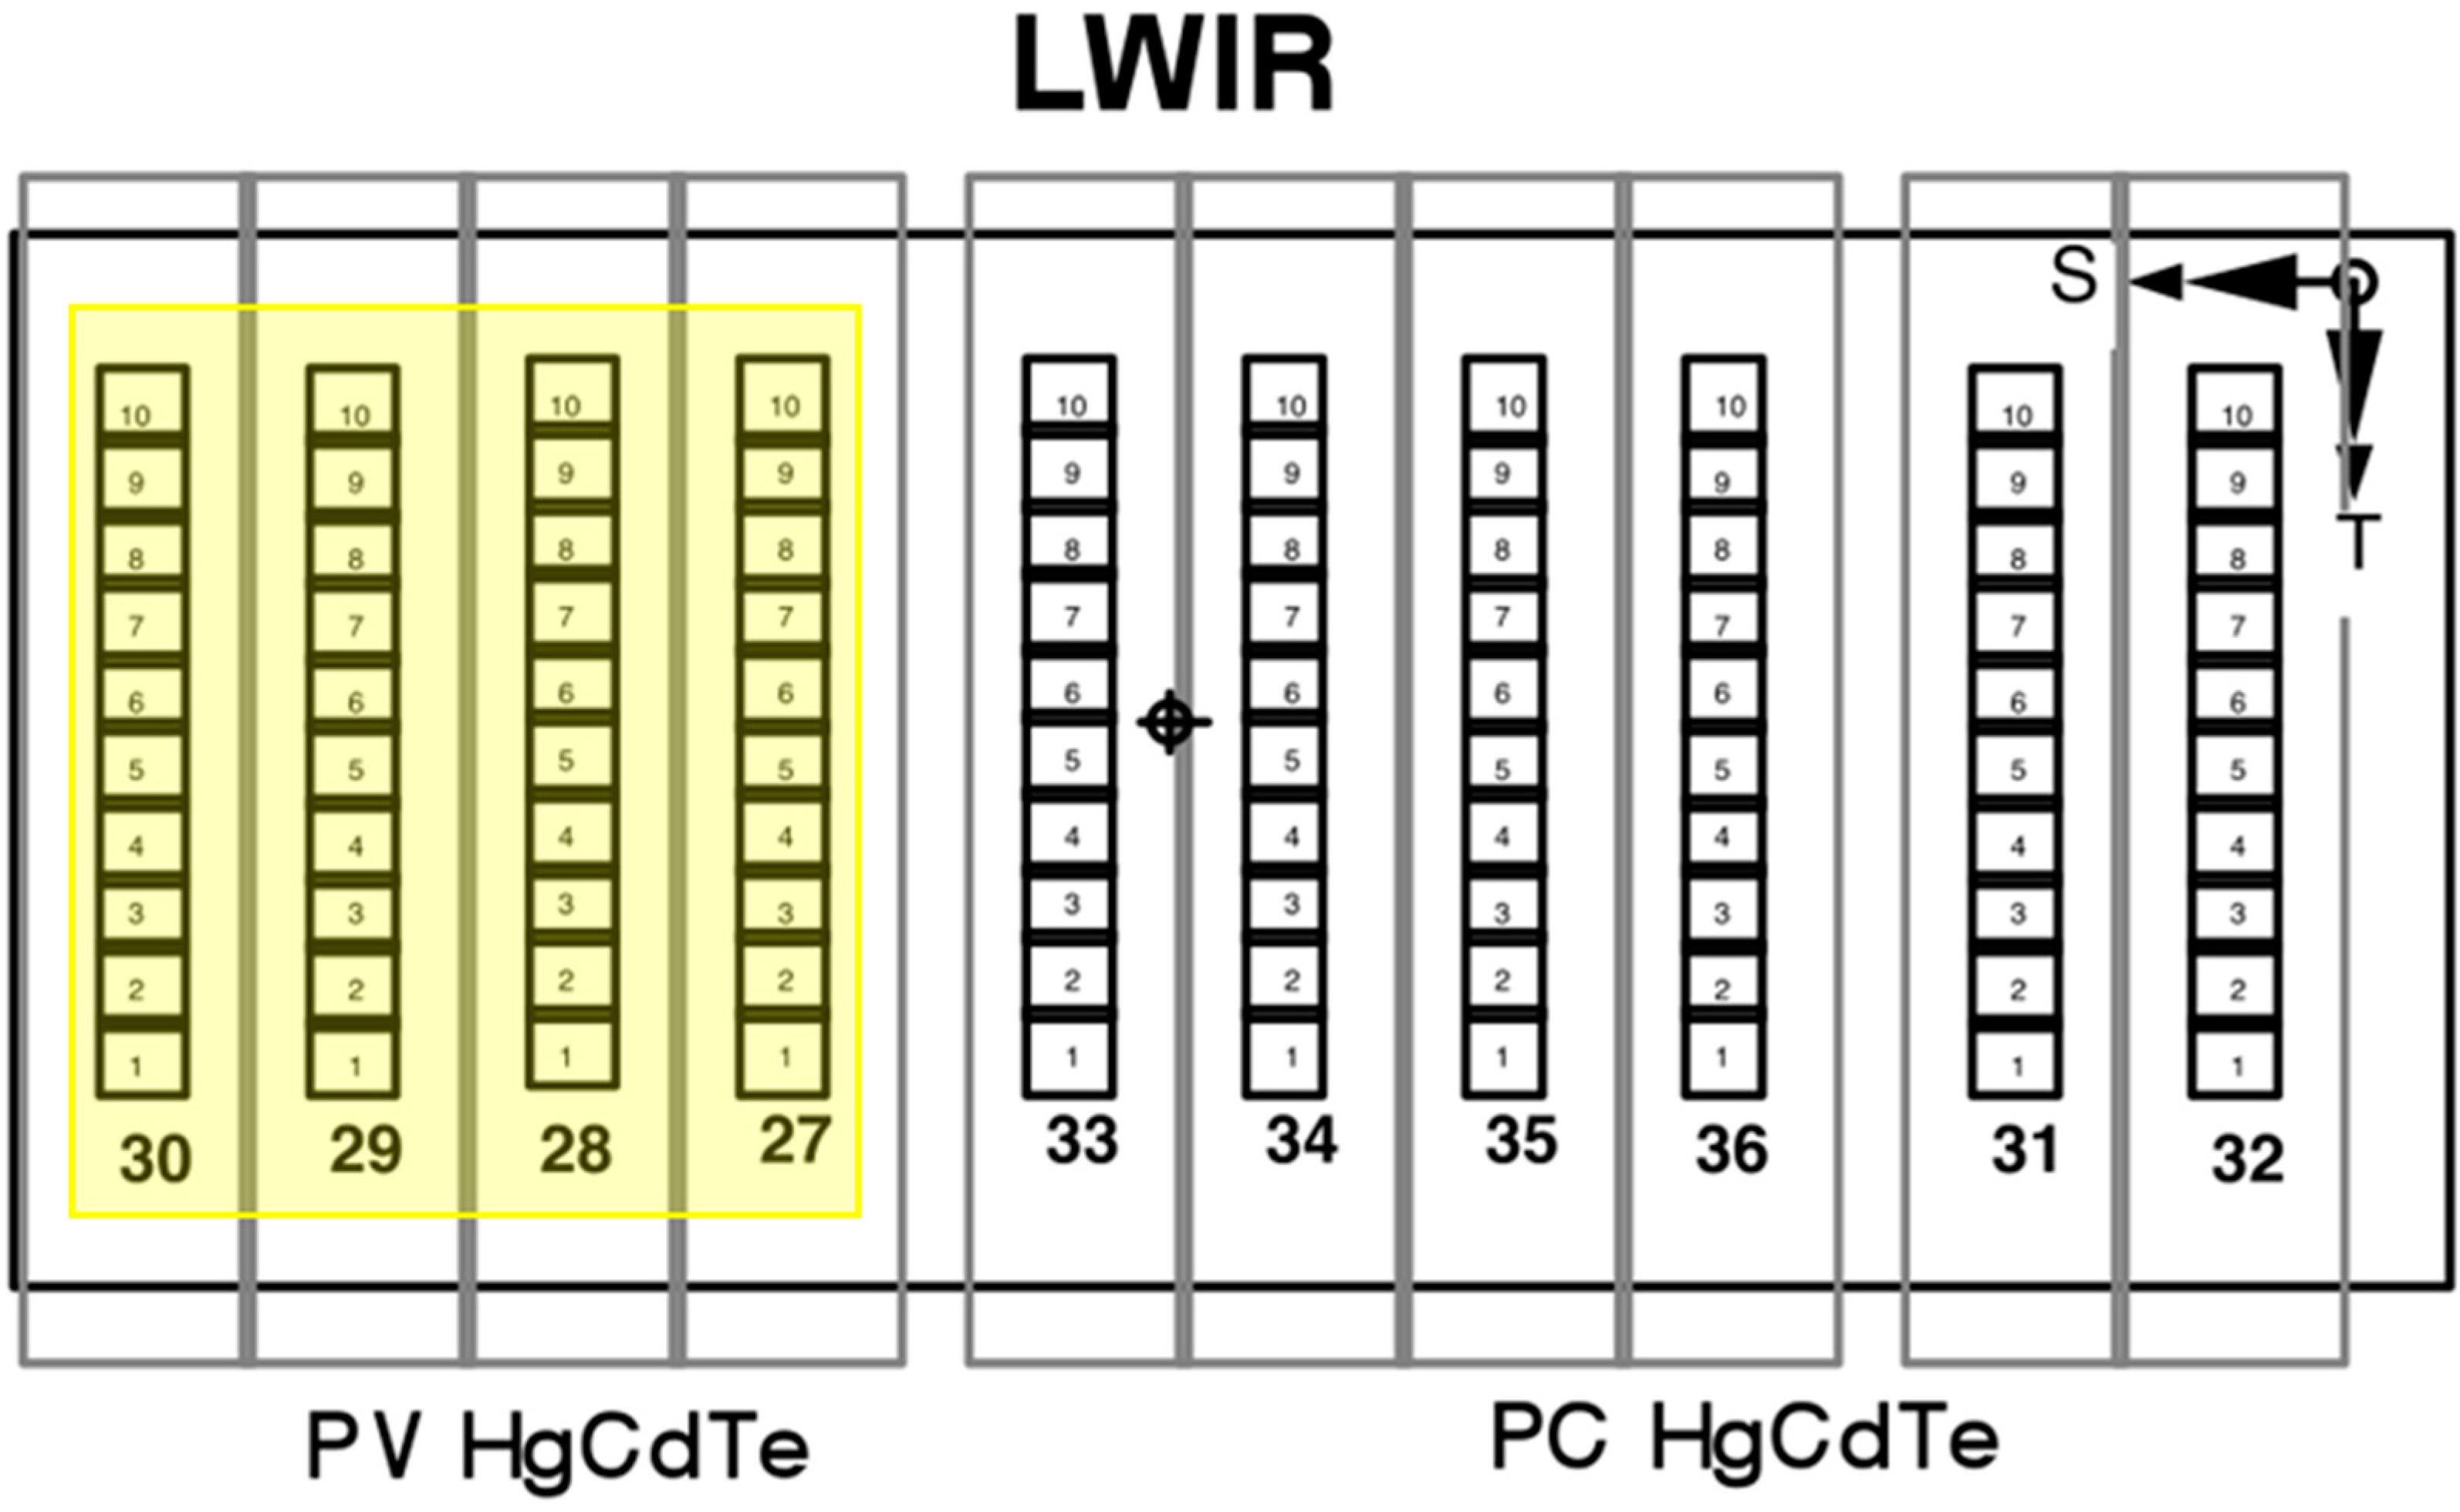
Electronic crosstalk in a remote sensor is a phenomenon causing electronic signals to be induced into a particular band from the detectors of neighboring bands on the same FPA at different times. The four MODIS LWIR PV bands, bands 27–30, are separately located on the LWIR FPA, and this is shown in
Figure 1. As previously mentioned, among the artifacts brought out by the crosstalk signals are “ghost images” in the imagery of the receiving band. This is due to the signal coming from the sending band that is at a different location on the same FPA. The appearance of “ghost images” is a unique and typical property of the electronic crosstalk that can be used to identify the crosstalk effect. Especially in a clear scene with sharp edges, a ghost image can be distinctive and pronounced. The Moon in particular has been shown to be an excellent natural point-like target to exhibit this effect and has a similar radiance level as the Earth’s surface, therefore, within the response range of the instrument, it enables an effective analysis [
14,
15,
16,
17]. From the regularly scheduled lunar observations, crosstalk effect in Aqua MODIS can be identified and its change over time can be quantified.
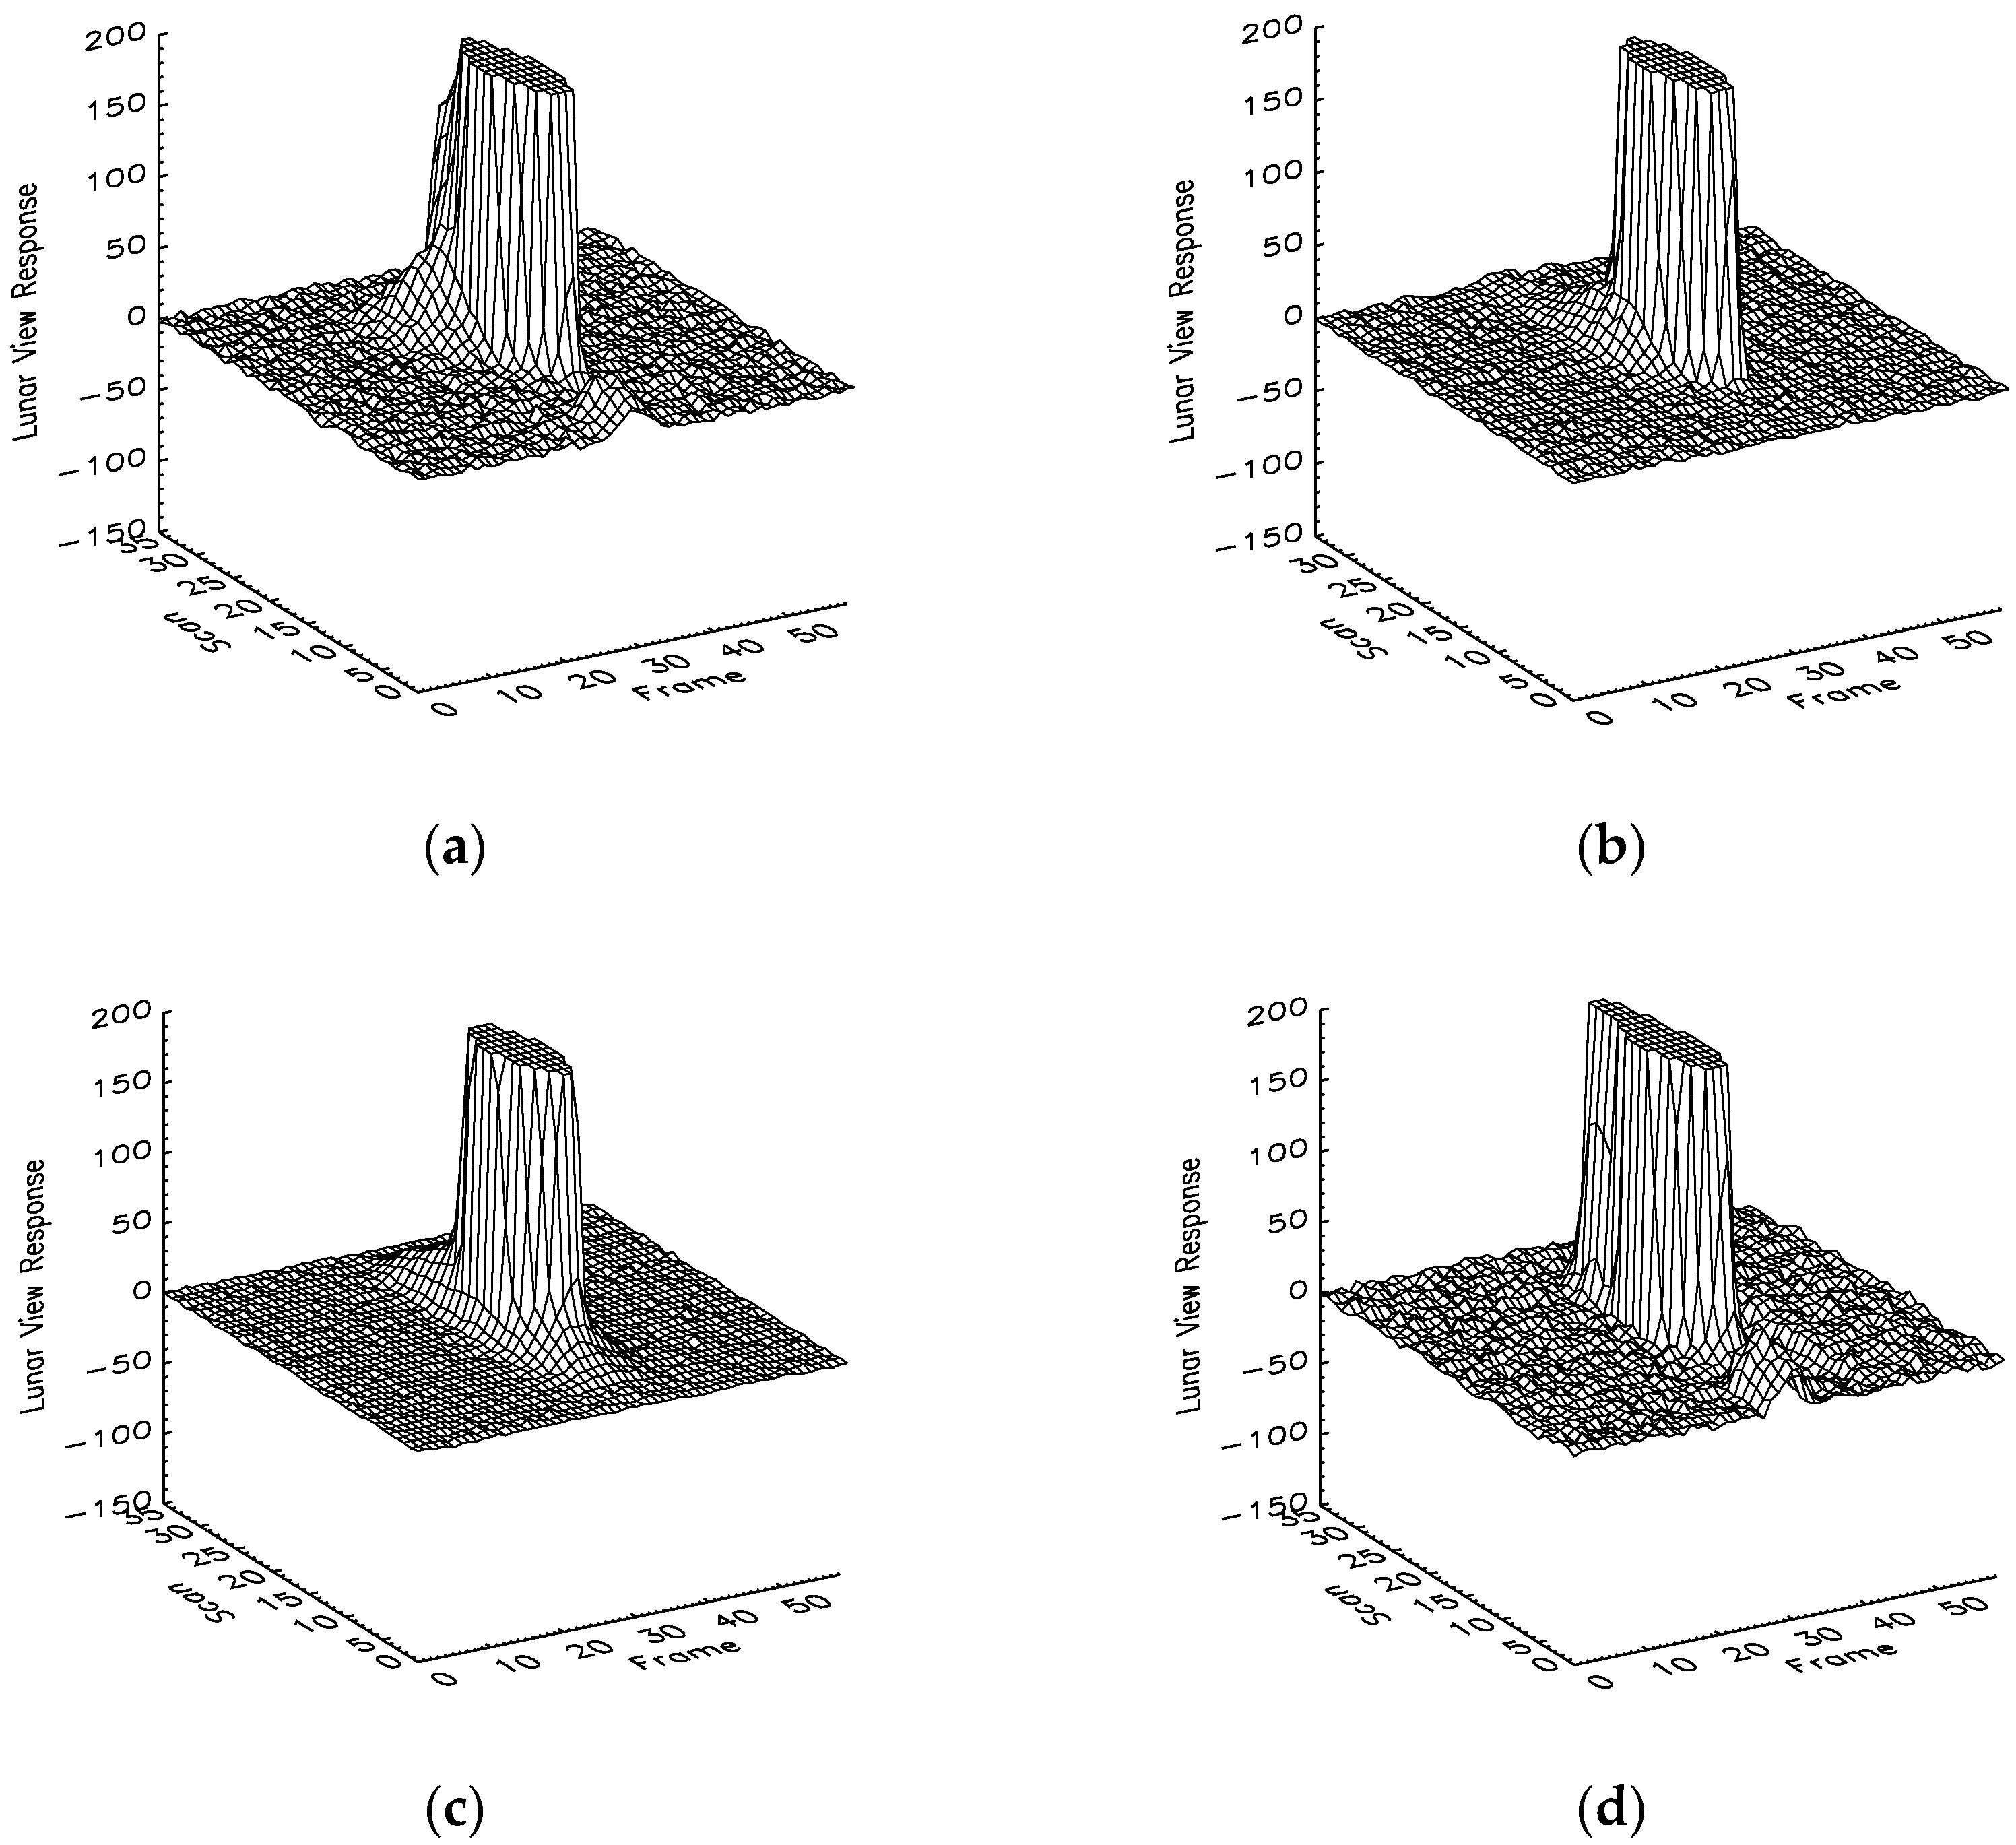
Figure 2 and
Figure 3 show the three-dimensional images of the integrated lunar observations for band 27 detector 3, band 28 detector 10, band 29 detector 6, and band 30 detector 3, as observed on 19 July 2002 and 11 March 2014, respectively. The z-axis labels the magnitude of the background-subtracted lunar signal observed through the space view (SV) that is recorded in the EV data sector through a sector rotation during lunar observation operation [
14]. The x-axis labels the along-scan direction (frames). Since the lunar size for each of the 1 km bands is about 7 × 7 pixels, the center 7 frames in the lunar images are the lunar signals of the detectors and the remaining frames will correspond to the signals from the neighboring bands. The y-axis labels the along-track direction (scans). The elongation effect in the lunar images shown in
Figure 2 and
Figure 3 is due to the oversampling effect [
14], because each pixel in the along-track direction corresponds to multiple scans. The oversampling factor and the elongation effect are event-dependent. For example, the oversampling factors are 1.89 and 3.11 for the lunar observations on 19 July 2002 and 11 March 2014, respectively. Expectedly, the elongation effect in the lunar images of
Figure 3 is larger than those of
Figure 2. In order to clearly discern the crosstalk signal, the lunar responses are truncated to 200 digital number (dn) counts. The maximum lunar view responses for these bands are as high as 4000 dn. In fact, all four bands are saturated when they view the central area of the lunar surface. The portion of the signals shaped like a cylinder with magnitude 150 dn and above in each of the lunar images represents the moon surface. In an ideal case, without the crosstalk contamination, no signal will be present in the neighboring frames. Any additional response in the neighboring frames therefore corresponds to the crosstalk signal from the neighboring bands, that is, the sending bands or the interfering bands.
In
Figure 2 and
Figure 3, hills and valleys can be seen near the central tall cylinders that represent the lunar response in the lunar images. The hills correspond to the crosstalk contamination signals with positive contributions to the instrument signals, while the valleys are those with negative contributions.
Figure 2a demonstrates that Aqua band 27 detector 3 had crosstalk contamination on 19 July 2002, and the crosstalk contamination has a positive contribution to the detector signal, indicated by the hills around the central cylinder. Since Aqua MODIS was launched on 4 May 2002 and its nadir door was opened on 24 June 2002, this shows that the crosstalk effect in Aqua band 27 was already in existence at the very beginning of the mission.
Figure 3a is the lunar image observed by the same detector on 11 March 2014. Besides the mound at the left-back side of the lunar image, a clear deep valley on left-front side is seen, indicating a negative contribution from the crosstalk effect. This shows that the crosstalk effect may have positive and negative contamination signals at different parts of the image. As will be explained later, Aqua band 27 has crosstalk contamination from all other three LWIR PV bands as the sending bands, and the contribution per sending band can be either positive or negative. By comparing
Figure 2a and
Figure 3a, it is seen that the crosstalk effect to the band changes with time, which is similarly observed in the Terra LWIR PV bands. The same pattern of the crosstalk effect change can be seen from
Figure 2b,c and
Figure 3b,c for bands 28 and 29. In
Figure 2d, the valley besides the hill is seen in the lunar image observed by band 30 detector 3 on 19 July 2002, showing also that negative contributions from the crosstalk effect to the detector already started early in the mission.
Figure 3d shows that negative contributions to the detector became larger on 11 March 2014, indicating that for band 30 the crosstalk effect changes with time.
3. Crosstalk Correction Algorithm
Since the details of the circuitry in the electronic system for the FPA are not available, it is hardly possible to derive the relationship between the crosstalk contamination signal and the sending band signal starting from first principles of electromagnetic theory. Even if the information is available, it is still difficult to describe the phenomenon directly since the crosstalk effect has been shown to change with time by the finding in this work as well as in our previous investigations [
5,
6,
7,
8,
9,
10,
11]. Nevertheless, it is both possible and essential to establish a relationship describing the crosstalk phenomena and subsequently prescribing its correction. As a first-order approximation, Sun et al. [
5,
6,
15,
16,
17] use a linear relationship
where
Br,
Dr,
Bs, and
Ds represent the receiving band, receiving detector, sending band, and sending detector, respectively;
F is the pixel number along scan—which is also called frame, as mentioned previously—of band
Br; Δ
Frs is the frame shift between the receiving band
Br and the sending band
Bs when viewing the same target due to location differences on the FPA as shown in
Figure 1, and the actual values of the frame shifts among the MODIS LWIR PV bands are listed in
Table 1;
c(Br,Dr,Bs,Ds) is the crosstalk coefficient for the crosstalk from band
Bs detector
Ds to band
Br detector
Dr;
is the measured background-subtracted instrument response of band
Bs detector
Ds at frame
F + Δ
Frs; and
is the crosstalk signal from the sending bands to the receiving detector of the receiving band. The instrument response with the removal of the crosstalk contamination can be written as [
5,
6,
15,
16,
17]
In addition to being applicable to TEBs, Equations (1) and (2) also work for reflective solar bands (RSB) [
15,
16,
17]. To remove the crosstalk contamination in the receiving bands, Equations (1) and (2) need to be applied to solar diffuser (SD) calibration for the RSBs [
15,
16,
17] and BB calibration for the TEBs [
5,
6,
15], respectively, to correct the crosstalk effect in the calibration calculation and in the L1B code, which is used to retrieve the EV radiances.
Equations (1) and (2) have been applied to correct the crosstalk effect in Terra short-wave infrared (SWIR) bands [
15] and the near-infrared (NIR) band 2 (865 nm) [
16,
17]. Additionally, the patterns of the artificial dots and the anomalous repeating dark and bright spots that were observed in the imagery of Terra band 2 have been successfully removed [
16,
17]. However, in practice, the implementation is highly computationally intensive, resulting in tremendous difficulty for the application of the correction in actual L1B EV retrievals. For a TEB, Equation (1) can further be approximated as [
5,
6]
where the brackets indicate the average over the 10 detectors of the sending band
Bs and
C(Br,Dr,Bs) is the effective crosstalk coefficient from the sending band
Bs to the receiving band
Br detector
Dr. In comparison to the implementation based on Equation (1), the computational demand using Equation (3) is reduced by a factor of
ND, which is the number of detectors in a sending band. For MODIS,
ND is 10, and thus this is a 10-fold reduction in computational time or power. The Earth surface scene temperature usually does not change significantly over the scale of 10 km and, thus, Equation (3) can be applied in MODIS TEBs for the purpose of catching the crosstalk signals. Sun et al. [
5,
6,
7,
8,
9,
10,
11] have successfully applied Equations (2) and (3) to Terra LWIR PV bands to remove the crosstalk contamination in these bands. Since the computational demand is reduced by an order of magnitude using Equation (3) compared to Equation (1), the implementation of the crosstalk correction in operational L1B EV retrievals thus becomes possible to be done within a reasonable time frame. Most importantly, these previous efforts firmly established the correctness of the linear relationship between the crosstalk contribution of a sending band and the signal of the sending bands describing the crosstalk effect. Then, the key to the successful removal of the crosstalk contamination (in both the calibration coefficients and EV retrievals) is to accurately derive the crosstalk coefficients in either Equation (1) or (3). This is achieved via lunar-image analysis, as mentioned previously.
4. Crosstalk Coefficients
Aqua MODIS is scheduled to view the Moon approximately every month. From these lunar observations, the crosstalk coefficients for the four Aqua LWIR PV bands can be derived via the established methodology [
5,
6]. As mentioned previously, a lunar image without crosstalk contamination appears as a clear cylinder; in fact, due to the oversampling effect, it appears as an oval cylinder [
14]. The crosstalk contamination induces the anomalous hills and the valleys at the edges of the lunar images as shown in
Figure 2 and
Figure 3. From these unexpected features at the edge of the lunar images, the crosstalk coefficients can be derived [
5,
6]. In this work, we focus on the sending-band detector-averaged crosstalk coefficients derived from the lunar observations. The derived coefficients are also compared with those for the Terra LWIR PV bands.
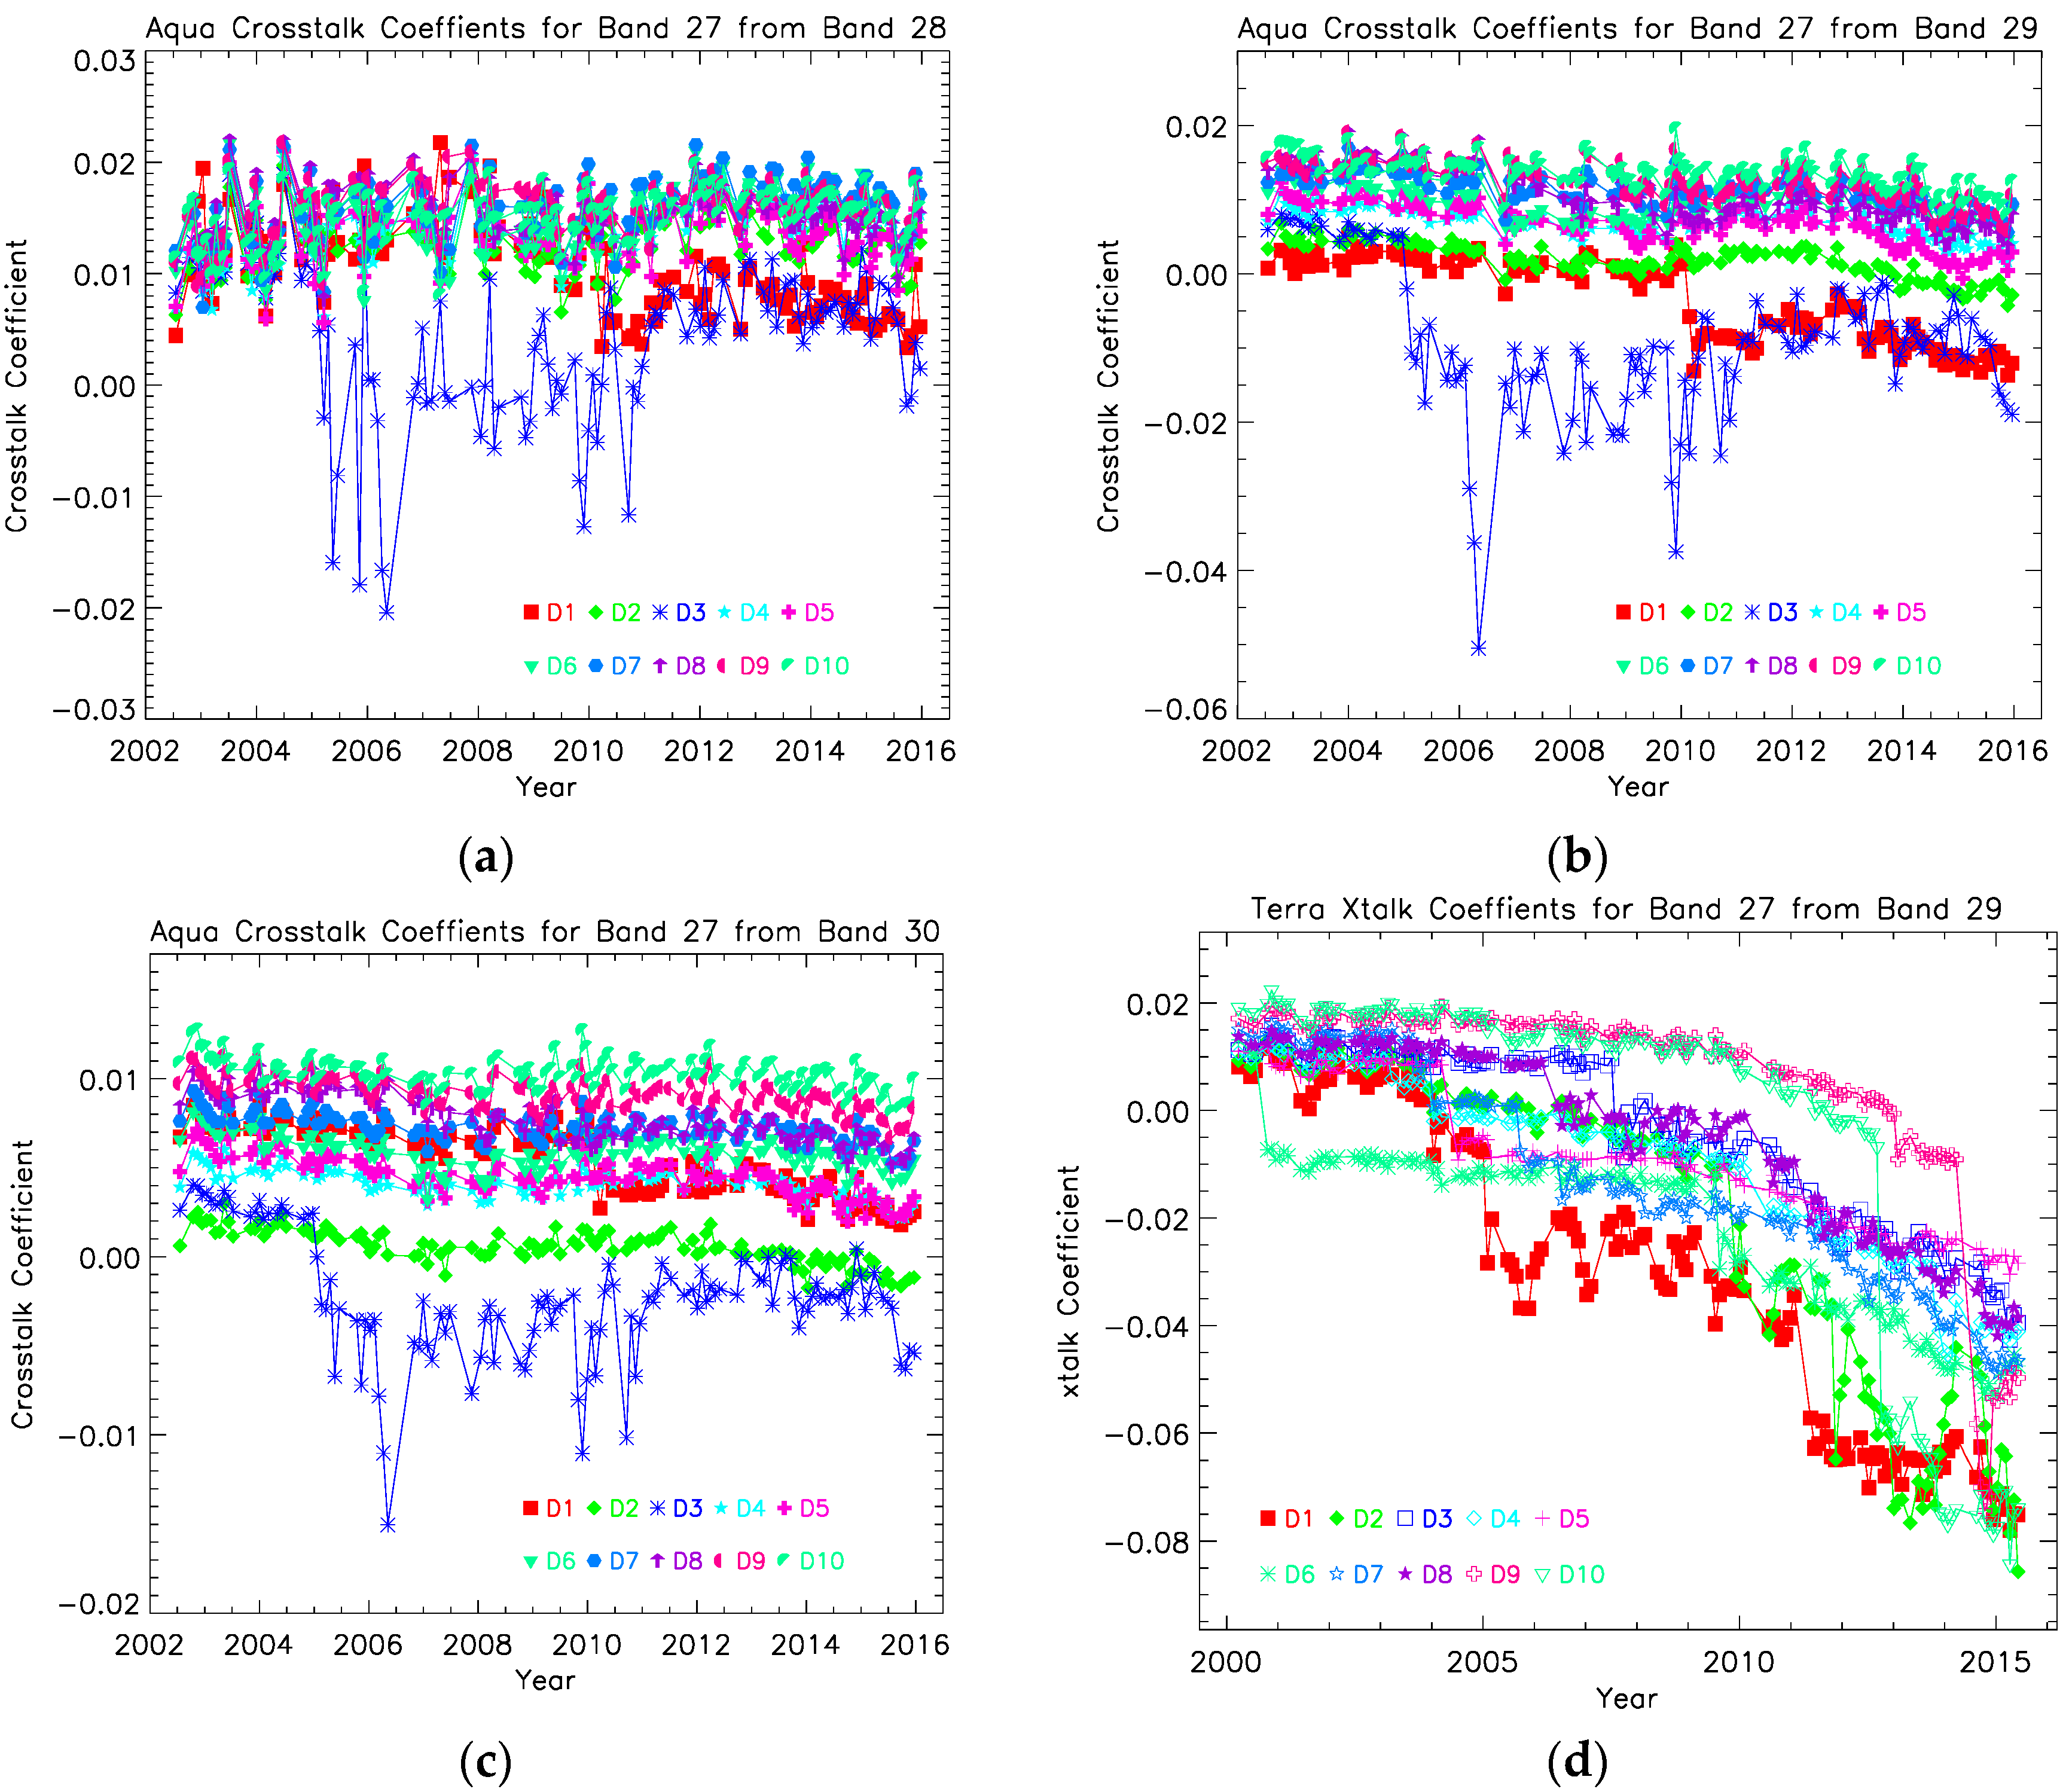
Figure 4a–c gives the lifetime trending of the crosstalk coefficients for all detectors of Aqua band 27, with each plot showing the result for one of the sending bands. It can be seen that the crosstalk effect exists from the very beginning of the mission for all detectors and that the effect comes from all other three PV bands, i.e., bands 28–30. The crosstalk coefficients are all positive, resulting in positive contributions to the signals of band 27 in the early mission. This is consistent with the result shown in
Figure 2a, and the coefficients remain positive for the entire mission for most of the detectors. However, sudden changes are observed for detectors 1 at around the beginning of 2010 and for detector 3 at around the middle of 2004. The sudden changes of the crosstalk effect will definitely induce sudden jumps in the calibration coefficients and discontinuities in L1B EV retrievals. In fact, the sudden changes in the Aqua MODIS band 27 linear calibration coefficients of the two detectors at the aforementioned times are known to exist [
12,
13], thus this finding clarifies the cause. To compare the band 27 crosstalk effect between Aqua and Terra,
Figure 4d shows the crosstalk coefficients for Terra band 27 with the sending band 29 [
5,
6,
7]. Comparison of
Figure 4b,c shows that the crosstalk effect in Aqua band 27 is much smaller than that in Terra band 27. Nevertheless, the crosstalk effect in Aqua band 27 is not negligible and should be corrected, considering the persistence of the sudden jumps in the crosstalk coefficients and in the linear calibration coefficients. It is also worth noting that the band 27 crosstalk coefficients are about the same level early in the mission for both Aqua and Terra, which can be seen from
Figure 4b,d. Since the Terra MODIS band 27 BT of an ocean site around equator in Pacific Ocean as well as at the desert site Libya 1 has been shown to be about 2 K higher due to the crosstalk effect early in the mission [
7], Aqua MODIS band 27 BT at these two sites is also expected to be 2 K higher due to similar contamination level.
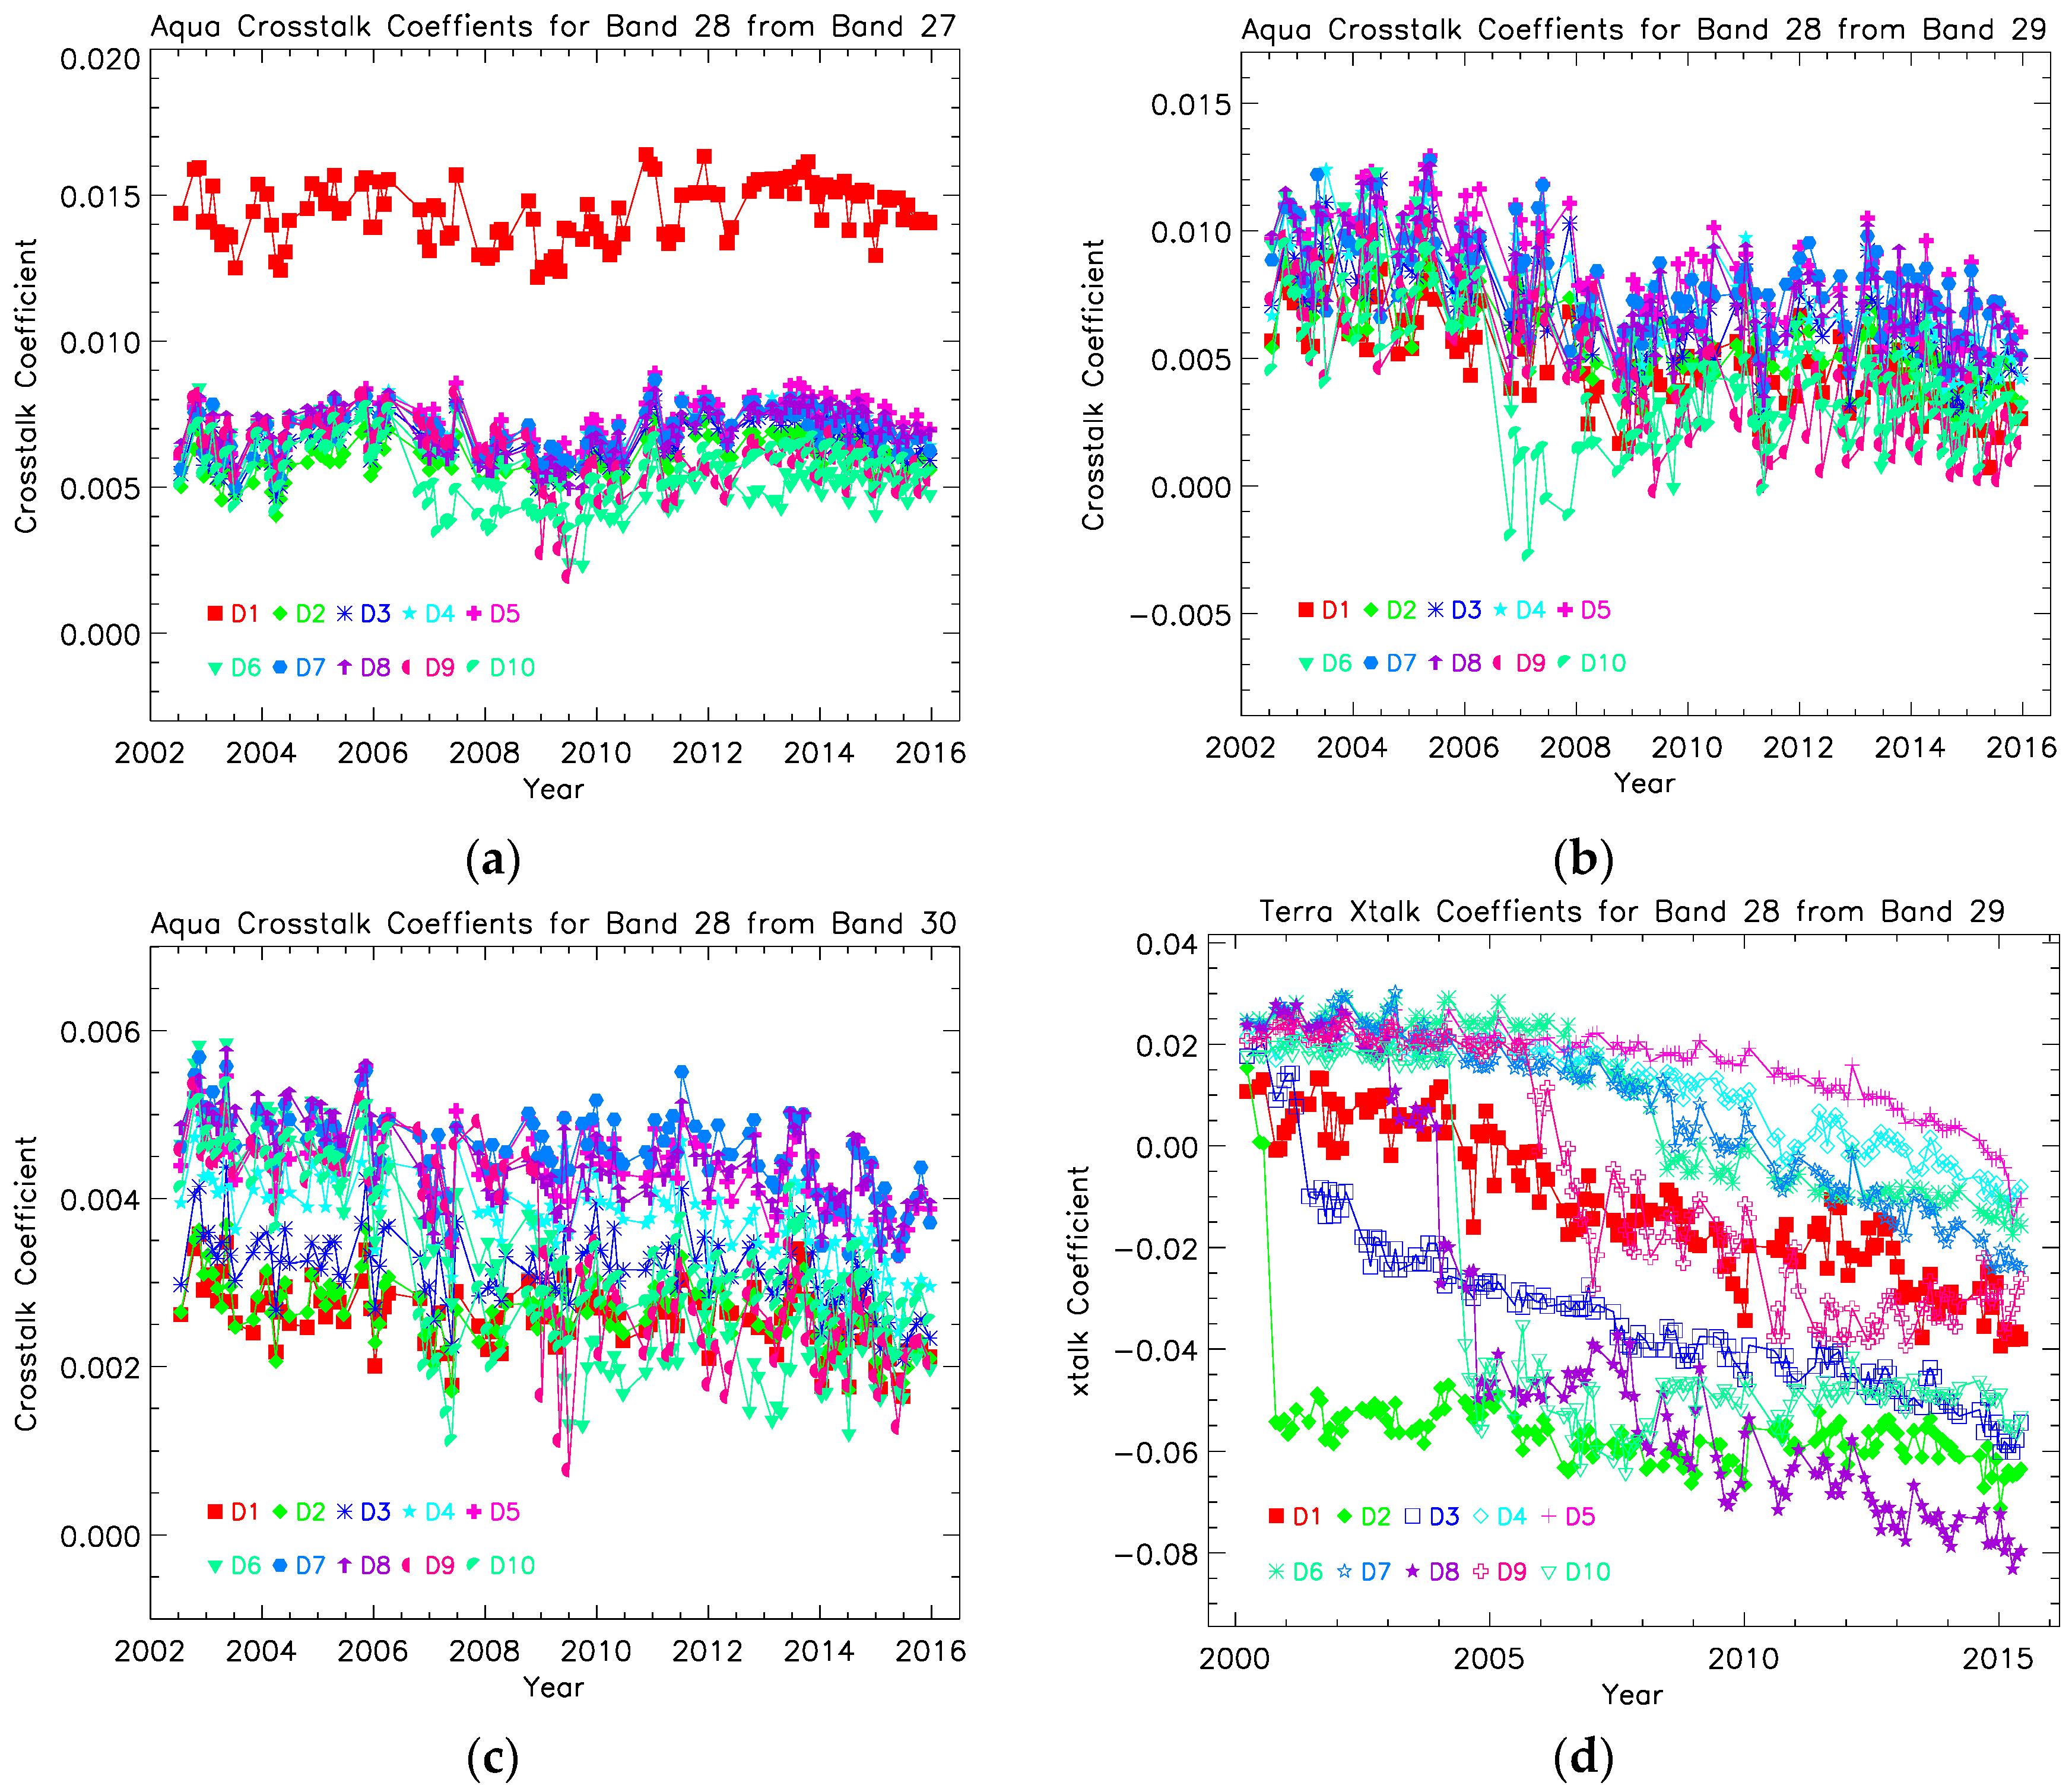
Figure 5a–c shows the crosstalk coefficients for all detectors of Aqua band 28. As is the case with band 27, the crosstalk effect exists from the beginning of the mission. For most of detectors, the coefficients change slowly with time. For detectors 9 and 10, sudden jumps in 2007 and 2009 are observed, and they match the sudden changes observed in the linear calibration coefficients of the two detectors derived from the BB calibration [
12,
13]. From
Figure 5a, it is seen that Aqua band 28 detector 1 has a larger crosstalk effect compared to other detectors in the band. For comparison,
Figure 5d gives the crosstalk coefficients for Terra band 28 with sending band 29 [
8]. Comparison of
Figure 5b,d shows that the crosstalk effect in Aqua band 28 also is much smaller than that in Terra band 28.
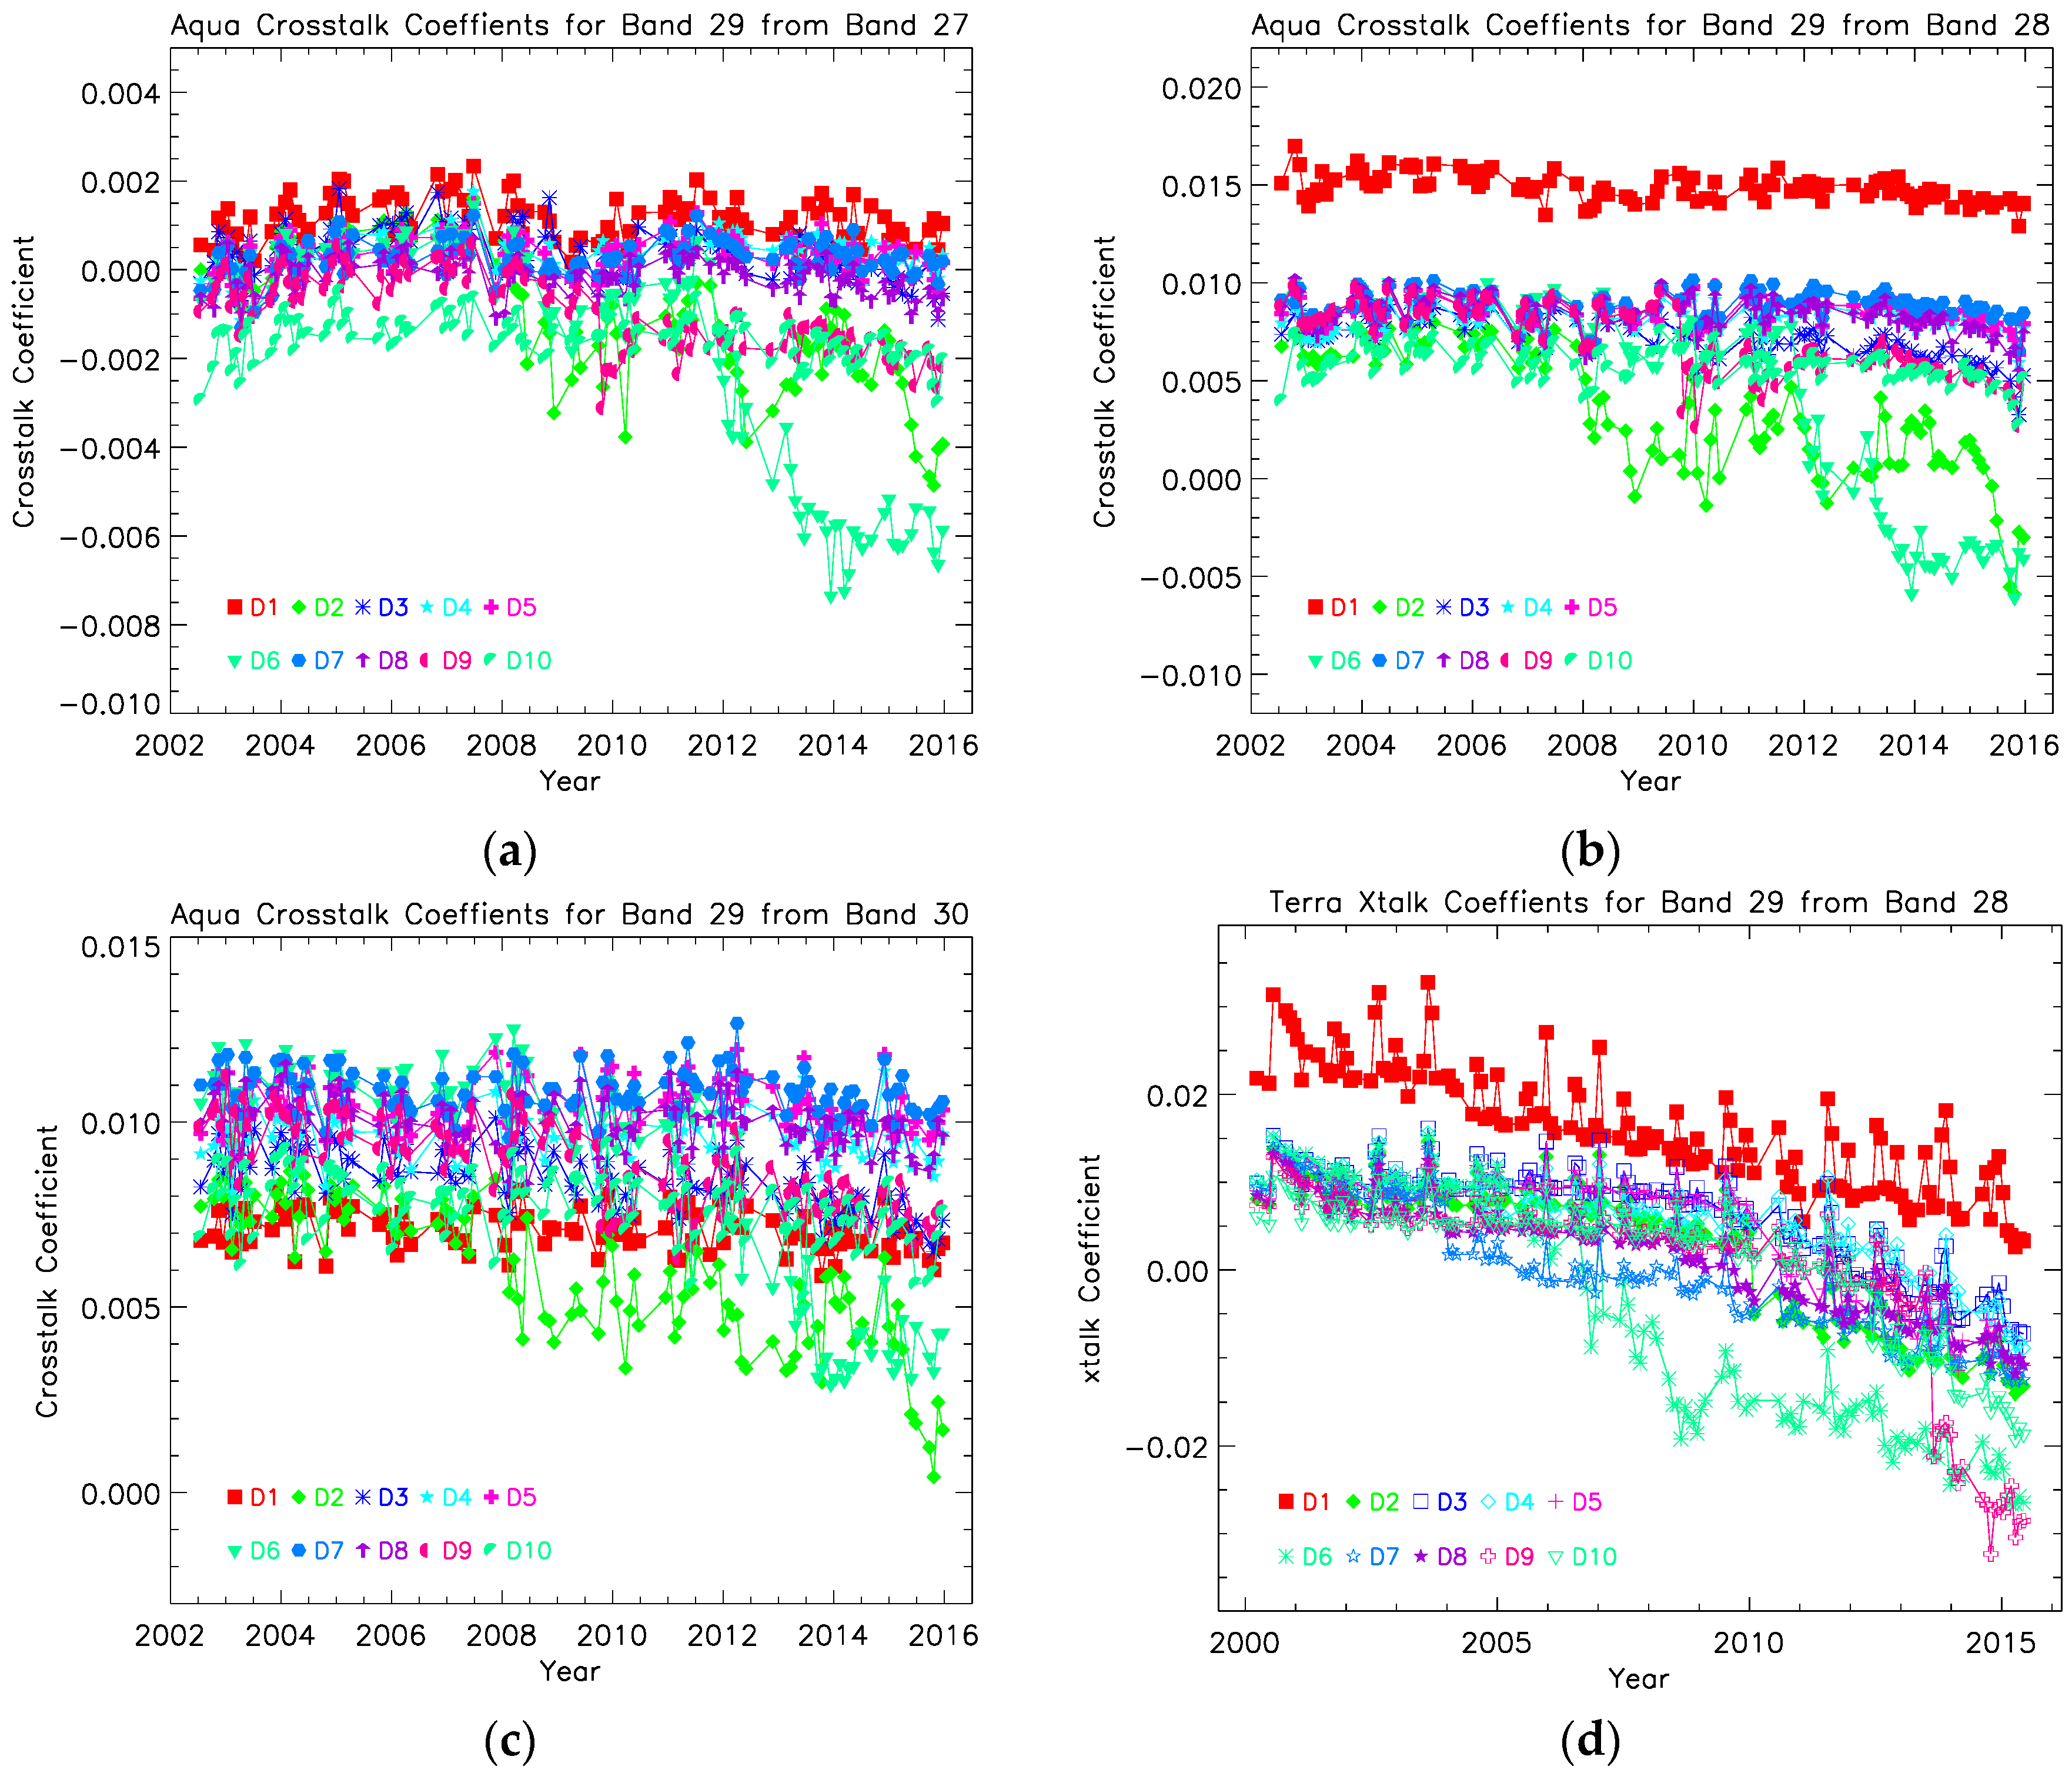
Figure 6a–c displays the crosstalk coefficients for all detectors of Aqua band 29 showing the same start of the effect in the early mission. Again, for most of the detectors, the coefficients maintain their constancy for the entire mission, thus the effect also remains unchanged. For detectors 2, 6, and 9, sudden changes are observed in 2008, 2010, and 2012, respectively. These changes, again, match the sudden jumps observed in their calibration coefficients at the aforementioned times [
12,
13]. For comparison,
Figure 6d shows Terra band 29 crosstalk coefficients with sending band 28 [
9]. It is seen from
Figure 6b,d that the crosstalk effect in Terra band 29 changes much faster with time compared with that in Aqua band 29. As with the band 27 comparison result, the crosstalk effects are about the same for Aqua band 29 and Terra band 29 in the early mission. It is known that Terra MODIS band 29 BT is about 1 K lower in an ocean site around equator in Pacific Ocean, as well as at the desert site Libya 1, due to the crosstalk effect in the early mission [
9], and therefore the impact of the crosstalk contamination in Aqua MODIS band 29 BT at these two sites is estimated also to be 1 K lower. This impacts MODIS science products derived from Aqua band 29 EV retrievals and should be corrected in Aqua MODIS L1B products.
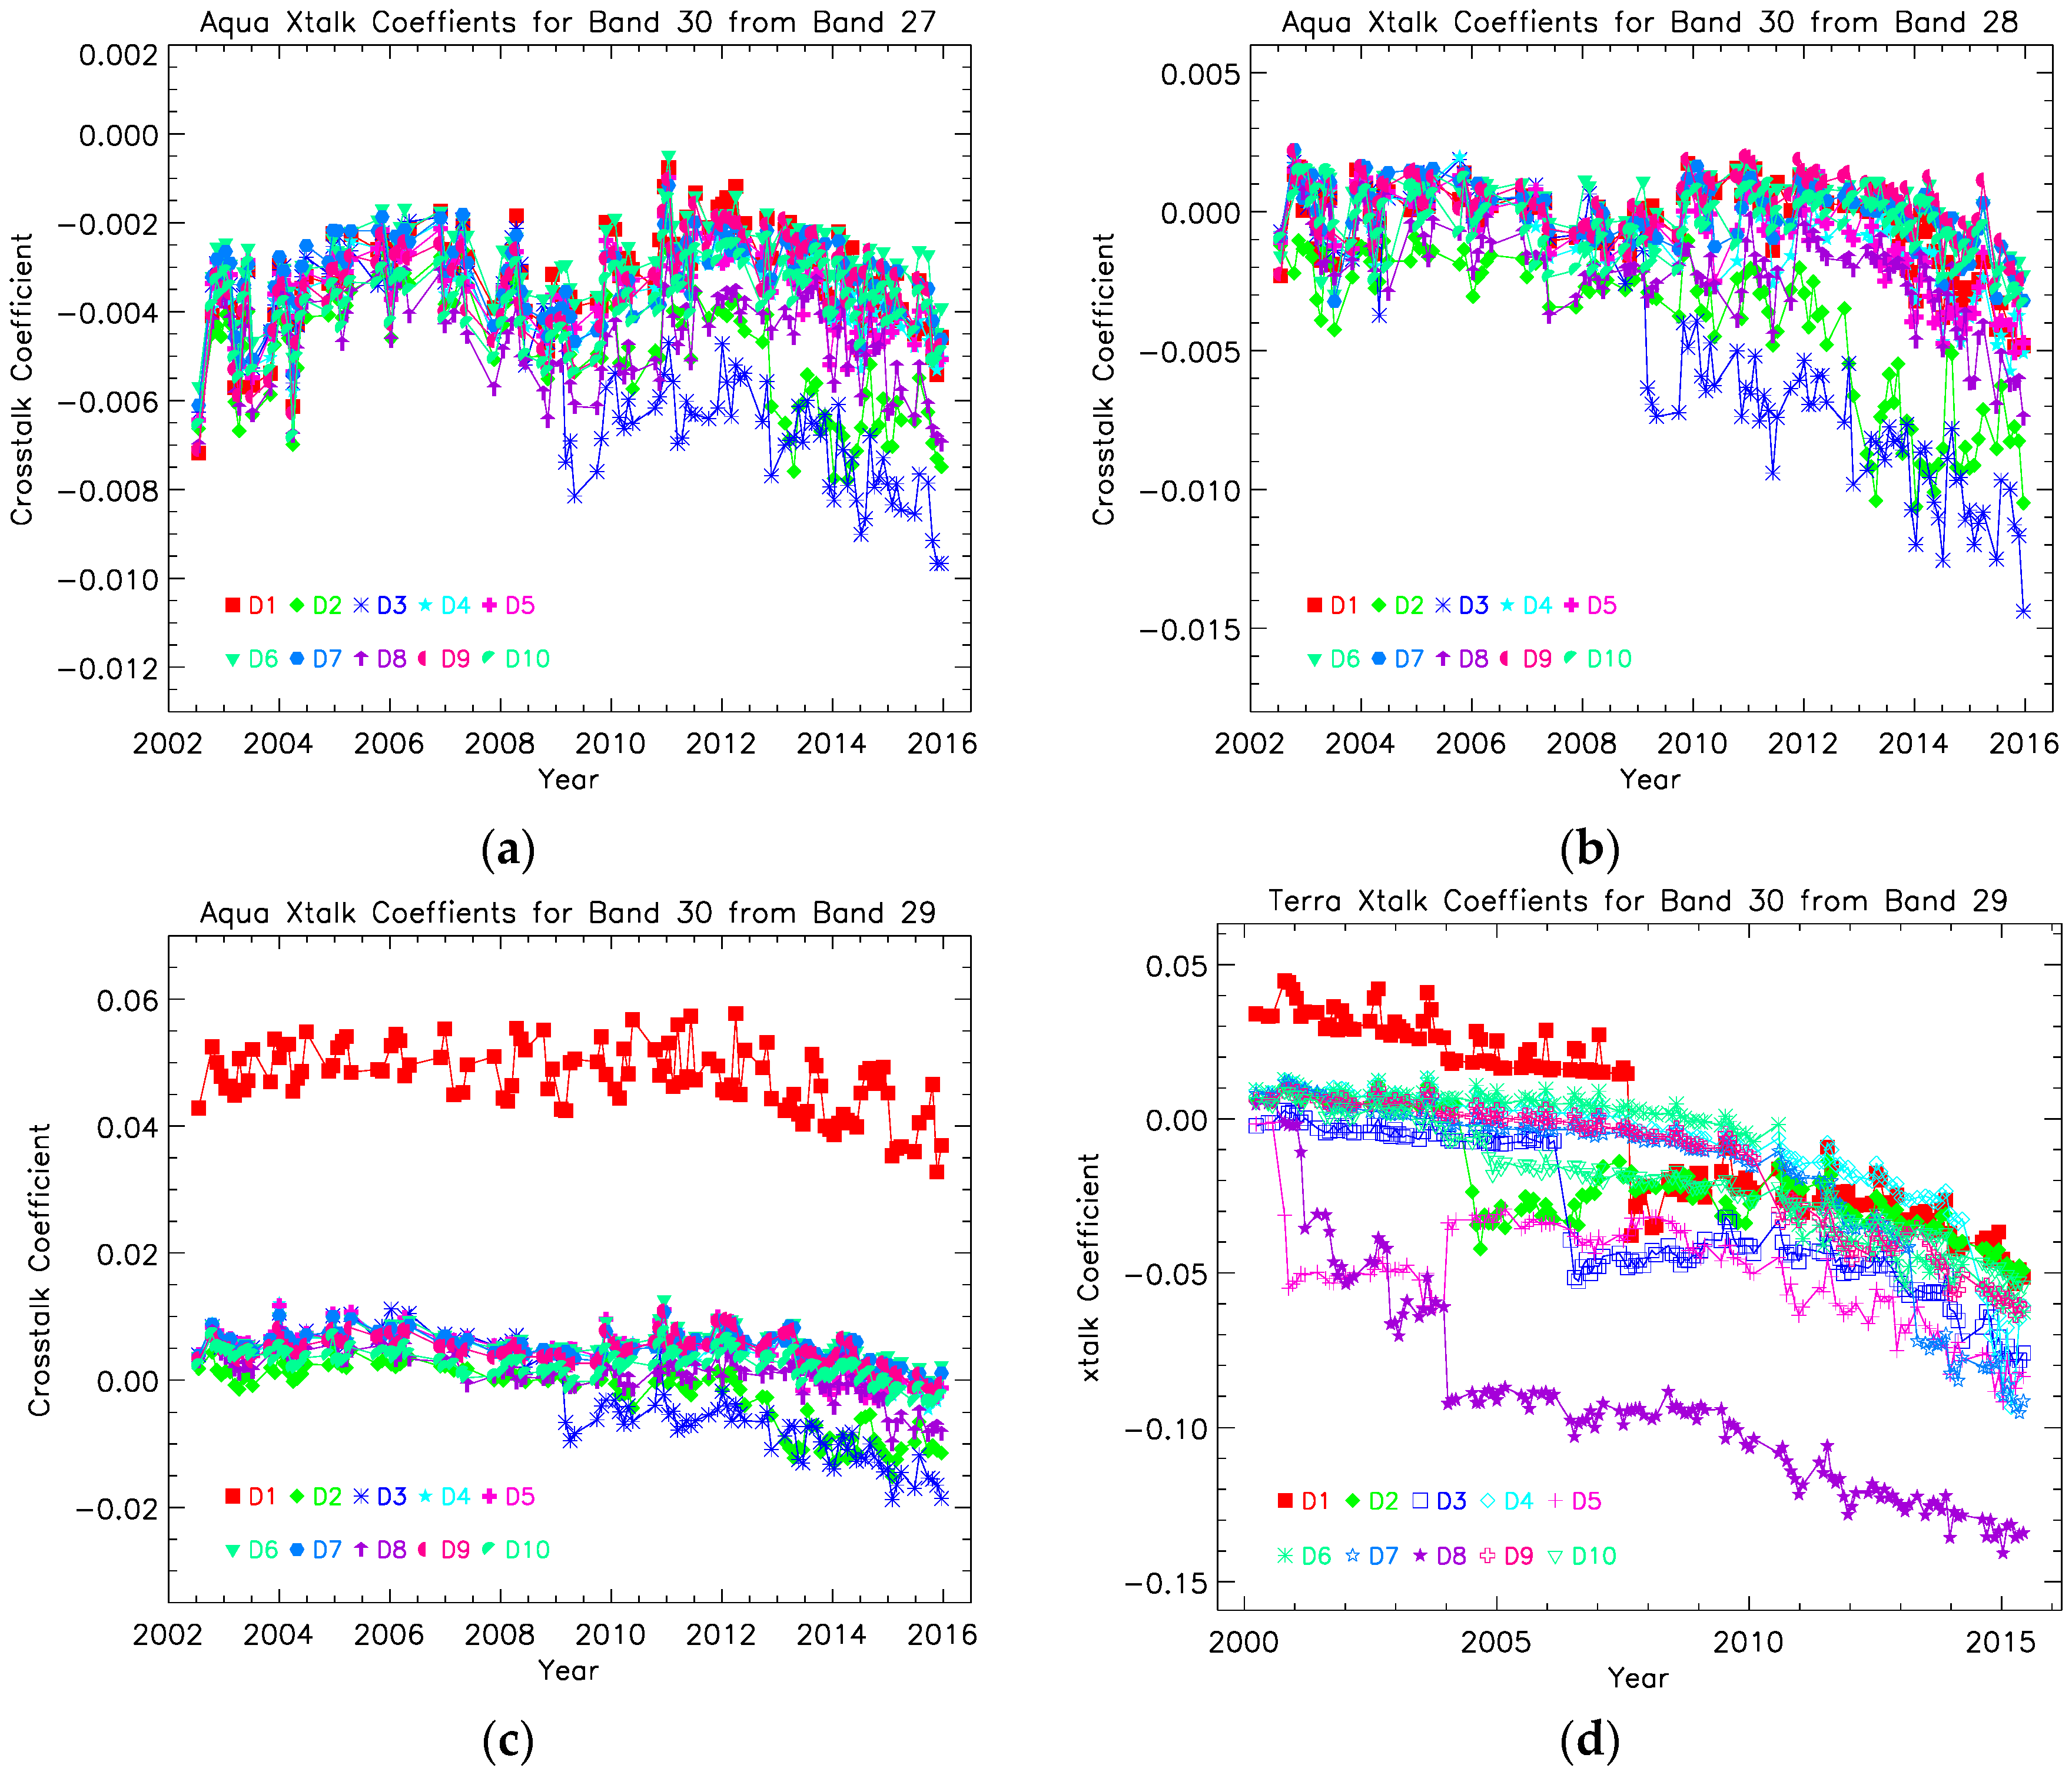
Figure 7a–c represents the crosstalk coefficients for all detectors of Aqua band 30. Change with time for most of detectors is slow, and sudden jumps are observed in the coefficients for detectors 2 and 3 in 2009 and 2013, respectively. Once again, the sudden changes in the linear calibration coefficients of Aqua band 30 detectors 2 and 3 have been observed [
12,
13] and the timing matches the sudden changes of the crosstalk coefficients shown in
Figure 6a–c. This clearly indicates that the jumps in the calibration coefficients are induced by the crosstalk effect, same as the jumps in the crosstalk coefficients of other PV bands.
Figure 7d shows the crosstalk coefficients of Terra band 30 with sending band 29 for purpose of comparison [
10]. Once again, the crosstalk coefficients of band 30 are about same in the early mission for the two instruments. However, the crosstalk coefficients of Terra band 30 change dramatically with time, while those of Aqua band 30 change slowly.
5. Summary
An examination of Aqua MODIS has confirmed the existence of significant crosstalk contamination among its four LWIR PV bands. The crosstalk effect is characterized and the crosstalk coefficients for the Aqua LWIR PV bands are derived from the analysis of the scheduled lunar observations. It is shown that, for most of the detectors of the four bands, the crosstalk effect is rather stable while a few detectors per band show dramatic changes of the crosstalk effect at numerous instances. In the early mission, the crosstalk contamination level in each of the four LWIR PV bands is very similar between Terra MODIS and Aqua MODIS, although Aqua MODIS has a smaller overall effect throughout the entire mission. The sudden jumps in the crosstalk coefficients match the discontinuities in the calibration coefficients that have been observed for many years. Thus, this work identifies, for the first time, the crosstalk effect to be the root cause of the discontinuities in the calibration coefficients for these four Aqua MODIS bands. The impact of the crosstalk effect on the EV BT of these bands is also estimated. At a typical radiance, the BT in Aqua MODIS band 27 is estimated to be 2 K higher, while for band 29 the result is about 1 K lower. These differences are significant enough to affect the associated science products derived from these four Aqua MODIS bands, and therefore the crosstalk correction should be applied to the BB calibration and Aqua MODIS L1B code to improve the accuracy of the calibration coefficients and the EV retrievals.


